Building Strong Foundations for Life
Results from the 2025 Early Learning and Child Well‑being Study

Results from the 2025 Early Learning and Child Well‑being Study
This work is issued under the responsibility of the Secretary-General of the OECD, and does not necessarily reflect the official views ofOECD Membercountries.
This document, as well as any data and map included herein, are without prejudice to the status of or sovereignty over anyterritory, tothe delimitationofinternational frontiers andboundariesandtothename ofanyterritory,cityorarea.
The statistical data for Israel are supplied by and under the responsibility of the relevant Israeli authorities. The use of such data by the OECDiswithout prejudice to the statusof the Golan Heights,EastJerusalem and Israeli settlementsin theWestBankunder the terms of international law.
Note by the Republic of Türkiye
The information in this document with reference to “Cyprus” relates to the southern part of the Island. There is no single authority representing both Turkish and Greek Cypriot people on the Island. Türkiye recognises the Turkish Republic of Northern Cyprus (TRNC). Until a lasting and equitable solution is found within the context of the United Nations, Türkiye shall preserveitspositionconcerningthe“Cyprusissue”.
Note byalltheEuropean Union Member States of the OECDand the European Union
The Republic of Cyprus is recognised by all members of the United Nations with the exception of Türkiye. The information inthis document relates to the area under the effectivecontrol oftheGovernmentofthe RepublicofCyprus.
Kosovo*: This designation is without prejudice to positions on status, and is in line with United Nations Security Council Resolution 1244/99 and the Advisory Opinion of the International Court of Justice on Kosovo’s declaration of independence.
Pleasecitethispublicationas:
OECD(2026), Building Strong Foundations for Life: Results from the 2025 Early Learning and Child Well-being Study,OECD Publishing,Paris,https://doi org/10 1787/02bf8efe-en
ISBN978-92-64-93014-8(print)
ISBN978-92-64-61322-5(PDF)
ISBN978-92-64-80408-1(HTML)
Photocredits:Cover©Rawpixel.com/Shutterstock.com.
CorrigendatoOECDpublicationsmaybefoundat:https://www oecd org/en/publications/support/corrigenda html ©OECD2026

Attribution4.0International(CCBY4.0)
This work is made available under the Creative Commons Attribution 4.0 International licence. By using this work, you accept to be bound by the terms of this licence (https://creativecommons org/licenses/by/4 0/).
Attribution–youmustcitethework.
Translations – you must cite the original work, identify changes to the original and add the following text: In the event of any discrepancy between the original work and the translation, only the text of the original work should be considered valid.
Adaptations–youmustcitetheoriginalworkandaddthefollowingtext: This is an adaptation of an original work by the OECD. The opinions expressed and arguments employed in this adaptation should not be reported as representing the official views of the OECD or of its Member countries. Third-partymaterial–thelicencedoesnotapplytothird-partymaterialinthework.Ifusingsuchmaterial,youareresponsibleforobtainingpermissionfromthethirdpartyandfor anyclaimsofinfringement.
YoumustnotusetheOECDlogo,visualidentityorcoverimagewithoutexpresspermissionorsuggesttheOECDendorsesyouruseofthework.
AnydisputearisingunderthislicenceshallbesettledbyarbitrationinaccordancewiththePermanentCourtofArbitration(PCA)ArbitrationRules2012.Theseatofarbitrationshall beParis(France).Thenumberofarbitratorsshallbeone.
If you want to understand the future of a country, do not start in its universities. Start in its kindergartens, creches and nurseries.
Because by the age of 5, the story is already being written. Early childhood development is not just a warmup act for education; it is the foundation. It shapes whether a child will thrive in school, feel confident in life, and ultimately find their place in society. When children fall behind at this stage, the consequences are not minor delays. They are gaps that are difficult – and expensive – to close later. Gaps that can quietly follow a child throughout their life.
Here is the uncomfortable truth: the results from the OECD’s Early Learning and Child Well-being Study (IELS 2025) show that by age 5, those gaps are already wide, both within and across countries. In some countries, children have solid foundations in emergent literacy and numeracy. In others, they are struggling to get off the starting line. And it is not just about preparing for later learning. The data show the same divides in social and emotional skills, in working memory, and in the mental flexibility children need to solve problems – the very skills that define how they will learn, adapt, and navigate the world.
This is not just an education issue. It’s an economic issue, a social issue and a question of fairness. But the good news is that this is not destiny. The data point to something profoundly important: a significant share of the differences we observe can be traced to one factor that we can influence directly - the quality of early childhood education and care. In other words, policy matters a lot. When governments invest in well-trained staff, rich and stimulating learning environments, teaching that responds to each child, and the nurturing of social and emotional development, they are not just improving preschool. They are shaping life trajectories at the moment when the money invested delivers the highest return.
Early childhood education and care, however, is only part of the story. Long before a child enters a classroom, learning is already taking place at home – and what happens there matters enormously. The evidence is clear: it is not just how much parents do with their children, but how they do it. The most powerful interactions are often the simplest ones, such as those that involve attention, language, curiosity, and exchange. A conversation. A question. A shared moment over a book. All of these create the backand-forth – the rhythm of human interaction – through which development truly comes alive.
Family resources do matter, but this is where the debate should evolve. Meaningful, engaged parent-child interactions make a difference well above and beyond socio-economic status. That means this is not just about income; it is about awareness, support, and opportunity. Once again, policy has a role to play by helping families understand and enable the interactions that most powerfully shape children’s outcomes. What makes IELS 2025 so powerful is that it does not just look at one piece of the puzzle. It brings together direct assessments of the cognitive, social and emotional foundations of children with insights from parents and teachers. It looks across multiple domains of development at once. In doing so, it gives us something we have long been missing: a clear and comparable picture of how children are really doing at the very start of their learning journeys.
If we connect these early signals with what we already know from later stages of education, a powerful insight emerges: much is happening before – and shaping – what we observe at age 15, when the OECD carries out PISA mathematics, reading and science tests.
It begins in early childhood – quietly, unevenly, but decisively. And that means that if we are serious about equity, about excellence, about the kind of societies we want to build, then we need to start where it matters most. At the very beginning.
Andreas Schleicher
Director, OECD Directorate for Education and Skills and
Special
Advisor to the Secretary-General on Education
The International Early Learning and Child Well-being Study (IELS) 2025 was a collaborative effort between participating jurisdictions, the OECD Secretariat, and the international Consortium. The study and this report were guided by Andreas Schleicher and Yuri Belfali. Responsibility for the implementation of the study rested with Rowena Phair until 2023 and with Claudia Tamassia, thereafter, supported by a team that included Nathaniel Reinertsen and Marco Paccangella.
Carlos González-Sancho was the lead author of the report and related dissemination products, with support from Nathaniel Reinertsen, Mila Staneva (Annex A) and Elizabeth Shuey and Roland Tusz (jurisdiction notes). François Keslair provided statistical and analytical support. Elizabeth Shuey, Stéphanie Jamet and Hannah Ulferts provided valuable feedback on draft chapters, while Marco Paccagnella and Francesco Avvisati offered technical advice. Administrative support was provided by Sabrina Leonarduzzi while communications support was provided by Eda Cabbar, Duncan Crawford, Sophie Limoges, Rachel Linden and Anna Wahlgren. Chapters 1 and 2 of this report draw on the Assessment Framework prepared by the Australian Council for Educational Research (ACER)/International Consortium.
The international Consortium was led by ACER and included also the International Association for the Evaluation of Educational Achievement (IEA) and cApStAn. It was responsible for developing the assessment instruments, guiding implementation, preparing the underlying data, and supporting countries throughout implementation. The Consortium operated under the direction of Maurice Walker (International Project Director, ACER), supported by Dan Cloney (Co-Deputy Director, ACER) and Clara Beyer (CoDeputy Director, IEA)
To help ensure the rigour and validity of the study, the design and implementation of IELS 2025 were guided and supported by a Technical Expert Group (TEG), chaired by Iram Siraj.
This volume also benefited from reviews by teams from participating jurisdictions, including members of the Steering Group and National Project Managers. Their contributions to the report are gratefully acknowledged. A complete list of contributors from the OECD Secretariat, the international Consortium, the TEG and participating jurisdictions can be found in Annex C.
Table
Table
Table
Table
Table
Table
Figure
Figure 3.2. Age differences in early learning and development between ages 5 and 6
Figure 3.3. Share of variation in early learning and development outcomes occurring between ECEC centres or schools
Figure 3.4. Proportion of young adults with tertiary education and average performance in foundational learning outcomes
Figure 3.5. Correlations between early learning and development outcomes
Figure 3.6. Early learning and development skill sets of young children
Figure 4.1. Gender gaps in early learning and development outcomes
Figure 4.2. Socio-economic gaps in early learning and development outcomes
Figure 4.3. Developmentally resilient five-year-olds
Figure 4.4. Children with an immigration background and children with another home language
Figure 4.5. Gaps in early learning and development outcomes by immigration background
Figure 4.6. Differences in early learning and development outcomes, by language spoken at home
Figure 5.1. Mother’s level of education and early learning and development outcomes
Figure 5.2. Frequency of parent-child activities with a developmental focus
Figure 5.3. Home learning environment and children’s early learning and development outcomes
Figure 5.4. Parent-child reading activities and children’s early learning and development outcomes
50
52
53
56
57
64
67
69
72
73
75
83
85
86
89
Figure 5.5. Parent-child educational digital activities and children’s early learning and development outcomes 91
Figure 5.6. Parental involvement in ECEC centres/schools and early learning and development outcomes 93
Figure 6.1. Starting age of participation in ECEC/school 104
Figure 6.2. Association between years in ECEC/school and five-year-olds’ early learning and development outcomes
106
Figure 6.3. Association between earlier starting ages of attendance of ECEC/school and five-year-olds foundational learning domains 108
Figure 6.4. Variation in the association between years in ECEC/school and five-year-olds’ foundational learning outcomes, by socio-economic background 110
Figure 6.5. Additional supports among different groups of children 114
Boxes
Box 6.1. An
The OECD International Early Learning and Child Well-being Study (IELS) is comparative survey that assesses how children are faring at age five. IELS provides evidence to help policy makers, education leaders and early childhood practitioners in improving young children’s experiences and outcomes. IELS measures multiple domains of children’s early learning and development and collects a range of contextual information from their parents and teachers.
IELS uses two complementary assessment approaches:
• Direct assessment of children’s skills, delivered through developmentally appropriate, interactive stories and games on tablet devices. This approach provides a common basis for crossjurisdictional comparisons. Careful design, testing and analysis minimise cultural and other biases, supporting the comparability of results. For IELS 2025, analyses included differential item functioning by gender, country, and language, as well as item-level, latent trait, and validity analysis. Tablet-based assessments also improve reliability by reducing transcription and coding errors.
• Indirect assessment through parent and early childhood education and care (ECEC)/school teacher reports which provide complimentary perspectives on children’s skills. Parents contribute observations across everyday settings, while teachers provide evaluations informed by comparisons with other children of the same age. These perspectives add depth and support the triangulation of results from the direct assessment.
Together, these components allow IELS to provide a robust and multi-dimensional picture of children’s early learning, development and well-being across participating jurisdictions.
IELS conceptualises early learning and development as holistic, involving cognitive as well as social and emotional skills that are closely interrelated and mutually reinforcing. The study focuses on three dimensions that strongly predict later educational outcomes and well-being: foundational learning, executive function, and social and emotional development. Across these three dimensions, 10 specific domains are assessed. Results for each dimension are distinguished by colour in figures and tables.
Ten national and sub-national entities (“jurisdictions”), participated in IELS 2025, with eight included in this report (Switzerland participated in the field trial only while Hangzhou (China) results were still undergoing analyses and validation). The target population for the study was children aged five to six years enrolled in a registered early childhood education and care (ECEC) centre or school. Samples were designed and weighted to be representative of these populations. For simplicity, this report uses “five-year-olds” to refer to the target population, and “ECEC centre/school” to refer to the setting attended at the time of assessment.
Parents and teachers also participated by providing contextual information about children’s characteristics, home environments, ECEC or school attendance, and skills. “ECEC teacher” refers to the staff member who knew the child best and completed the Teacher questionnaire while “parents” refers broadly to parents, guardians or other individuals who completed the Parent questionnaire.
Participation rates are a key indicator of survey quality and the reliability of results. Under the IELS 2025 Technical Standards, the quality thresholds for centre-level and child participation rates were set at 75%, indicating adequate representativeness of the target population.
Most jurisdictions met this standard before replacements. Three jurisdictions – the Flemish Community (Belgium), Korea and the Netherlands – conducted centre-level non-response bias analysis (NRBA) which indicated a low risk of bias. After replacements, all jurisdictions met the standard for child participation rate (see table below).
Parent and teacher participation rates showed greater variation across jurisdictions and were lower than child participation rates, although still relatively high compared with other international surveys. For jurisdictions with lower parent and teacher participation rates, caution is therefore advised when interpreting results based on questionnaire data with lower participation rates.
Note: Participation rates are weighted. Centre and children participation rates are after replacements. Parent and teacher data availability are based on participating children. *Estimates for Brazil correspond to averages across the three participating Brazilian states. **IELS Adjudicated Region.
Source: IELS 2025 Technical Report (OECD, 2026[1])
IELS results are based on direct and indirect assessments of children’s skills across ten domains of early learning and development. IELS scores are numbers that express a location on a continuum of a latent trait: an unobserved aspect, such as emergent literacy. Because the IELS scales are defined in relation to the observed variation across all participating children, they have no theoretical minimum or maximum. For reporting purposes, results are scaled to approximately normal distributions, with the international means set at 500 and standard deviations around 100. Therefore, a one-point difference corresponds to a 0.01 of a standard deviation and a 10-point difference of 0.1. Results for child subgroups are reported only when estimates are based on at least 30 children from at least five ECEC centres or schools within a jurisdiction.
Contextual information on children’s lives and skills was collected from parents and teachers, with some information provided by one source only and some by both. Comparisons between parent and teacher reports are based on the subsample of children for whom data from both sources are available.
Baku and Sumgait (Azerbaijan)
The sample for Azerbaijan was drawn from ECEC centres in the national capital and largest city, Baku, and the nearby city of Sumgait. Together, these two cities represent approximately 25% of Azerbaijan’s total population. The results for Azerbaijan are representative of the population of five-year-olds attending ECEC in these two locations.
Ceará, Pará, São Paulo (Brazil)
Three Brazilian states participated in IELS 2025: Ceará, Pará, and São Paulo. Therefore, the reported estimates pertain only to these three states, rather than the whole country. The results for Ceará, Pará, and São Paulo (Brazil) are representative of the population of five-year-olds attending ECEC in these locations and are presented as an average; weights were standardised to ensure that each of the states contributes to the estimates equally.
England (United Kingdom)
England is one of the countries of the United Kingdom. It has its own education system that is independent of the education systems of the other countries of the United Kingdom. The results for England are representative of the population of five-year-olds in primary schools in England.
Flemish Community (Belgium)
The Flemish Community (Belgium) is one of the three institutional communities of Belgium. The results for the Flemish Community (Belgium) are representative of the population of five-year-olds in ECEC in the Flemish Region as well as in schools under the authority of the Flemish Community in the bilingual Brussels-Capital region.
Hangzhou (China) was one of two jurisdictions to join the study at a point where the regular field trial was not feasible. Instead, an Operational Field Trial (OFT) was conducted to test administration procedures in preparation to the main study. Further analysis and evaluation of the collected data are required for validation; therefore, results are not included in this report.
Korea was one of two jurisdictions to join the study at a point where the regular field trial was not feasible. Instead, an Operational Field Trial (OFT) was conducted to test administration procedures in preparation to the main study. The results for Korea are representative of the country’s population of five-year-olds in ECEC.
Unlike other jurisdictions where a sample of ECEC centres/schools was drawn, all ECEC centres in Malta participated in IELS 2025. Within each centre/school, children were sampled at random in the same way as in other jurisdictions. The results for Malta are representative of the country’s population of five-yearolds attending ECEC or primary schools.
Netherlands
The results for the Netherlands are representative of the country’s population of five-year-olds in ECEC.
Switzerland
Switzerland participated in the IELS 2025 field trial but not in the main study. Therefore, there are no final results to be included in this report.
The results for the United Arab Emirates are representative of the country’s population of five-year-olds attending ECEC.
ECEC centres and children in the Emirate of Abu Dhabi (Abu Dhabi Region, Al Dhafra Region and Al Ain Region) that are not administered by the Ministry of Education (i.e. private and charter centres) participated as an adjudicated region within the United Arab Emirates. Its results are reported separately and referred to as Abu Dhabi (United Arab Emirates)
Where cross-jurisdiction averages are provided in the OECD’s IELS 2025 International Report, these averages correspond to the arithmetic mean of the estimates for participating jurisdictions.
The ten domains of assessment in IELS 2025 are conceptually organised into three broader dimensions of early learning and development. IELS uses a multi-dimensional model in its analysis, enabling the arithmetic mean of domain estimates within a dimension to represent the overall magnitude in that
dimension. For this report, this simple approach was adopted to ensure that the results are more easily replicable. However, there are other ways to construct composite scores, including those in which domains are weighted differently, and researchers are encouraged to explore these methods in secondary analysis.
In the IELS 2025 Public Use Files, there are two indices of socio-economic status (SES), described below. This report uses the SES index derived from Item Response Theory (IRT) in all of its analyses.
Socio-economic status index derived from Item Response Theory
The first index is derived using an IRT approach that combined an item response model and a latent regression model. To derive the item response model, three variables from the Parent questionnaire were used: household income, parental occupation, and parental education. In addition, the latent regression model used other variables explanatory of the missing data structure: household composition, child outcomes across domains, and jurisdiction. This conditioning aims to ensure that the values of the SES index are appropriate for secondary analysis. The main advantage of the IRT approach is that it uses all available data to construct the index, making it unnecessary to choose the highest level of a variable when data are available for both parents for a child. This is a new approach for this cycle, and therefore, several checks for robustness and consistency across jurisdictions were conducted. For further details, please refer to the IELS 2025 Technical Report (OECD, 2026[1])
The SES IRT index is standardised to have a mean of 0 in each jurisdiction, while its standard deviation is allowed to vary across jurisdictions. This enables comparisons between jurisdictions in terms of the dispersion of SES in the population. In IELS 2018, no SES IRT index was produced.
Socio-economic status index derived from Principal Component
The second is an index derived from a Principal Component Analysis (PCA) of three indicators from the parent questionnaire: household income, highest parental occupation, and highest parental education. The term ‘highest’ for parental occupation and parental education indicates that when data are provided for both parents/guardians, the higher of the two levels is selected for the child. For Baku and Sumgait (Azerbaijan), no household income indicator was collected; however, a substituted proxy measure based on household resources (e.g. a separate room for the child, appliances) was used.
The SES index derived from PCA is standardised within each jurisdiction, with a mean of 0 and a standard deviation of 1. Trends analysis for England (United Kingdom) between IELS 2018 and IELS 2025 involving socio-economic status measures should be made using the SES PCA Index
Unless otherwise stated, a difference reported as statistically significant is significant at the .05 level. This means there is less than a 5% probability that the reported difference occurred by chance; a statistical test has been carried out to establish this. In figures in this report, statistically significant differences in this report are denoted by darker tones.
A correlation coefficient is a measure of the degree to which two variables tend to move together. The coefficient ranges from +1 to -1, indicating the strength and direction of association. If a correlation is positive, it means that as one variable increases, the other increases as well. If a correlation is negative, it means that as one variable increases, the other decreases. In this report, a correlation coefficient with an
absolute value between 0 and .19 is interpreted as weak, between .20 and .40 as moderate and already meaningful, and above .40 as substantial.
The standard deviation is a measure of the dispersion of a set of data around its mean. The more spread out the data, the higher the standard deviation. In a normal distribution, 68% of the scores fall within one standard deviation of the mean, 95% within two standard deviations, and 99% within three. As mentioned above, all IELS scales have an approximate standard deviation of 100.
Scores reported in this volume are population estimates based on a sample of selected children. However, even after applying appropriate weights, it is unlikely that the sample mean is exactly equal to the ‘true’ population mean. Some degree of variation – known as sampling error – is to be expected. Thus, each estimate has an associated standard error, which indicates how accurately the sample estimate reflects the ‘true’ population estimate.
As a result of rounding, some figures in tables may not add up exactly to the stated totals. Totals, averages and differences are calculated using exact (unrounded) numbers and rounded only after calculation. Percentages and mean scores are rounded to whole numbers, and standard errors are rounded to two decimal places.
Readers interested in additional technical detail regarding IELS 2025 are directed towards the short technical note (Annex B) at the end of this volume and to the IELS 2025 Technical Report (OECD, 2026[1])
This report uses the OECD StatLinks service, meaning that tables with the data underlying the report are assigned a stable URL leading to an Excel workbook; for a list of tables available online, see Annex C.
References
OECD (2026), IELS 2025 Technical Report, http://oecd.org/en/about/projects/international-earlylearning-and-child-well-being-study [1]
The International Early Learning and Child Well-being Study (IELS) is the largest survey of its kind in the world, designed to provide a rich picture of children’s early development. What makes IELS distinctive is its focus on outcomes at age 5, alongside its simultaneous measurement of a wide range of developmental outcomes. Uniquely, IELS combines direct assessments of children’s skills - through engaging, play-based tasks delivered on tablets - with indirect measures gathered from parents and teachers, offering a wellrounded understanding of early learning and development.
More than 23,000 children participated in the second cycle of the study (IELS 2025) from eight jurisdictions featured in this publication: Baku and Sumgait (Azerbaijan), Ceará, Pará and São Paulo (Brazil), England (United Kingdom), the Flemish Community (Belgium), Korea, Malta, the Netherlands and the United Arab Emirates. The report provides evidence to inform efforts by policymakers, education leaders and early childhood practitioners to build strong foundations for life for all children.
How five-year-olds are faring
• Children in Korea and England (United Kingdom) achieve high scores in the foundational learning domains of emergent literacy and emergent numeracy. Children in Korea also perform strongly in executive function domains, such as mental flexibility. In emergent literacy and emergent numeracy, gaps between high- and low-performing children are relatively large in the United Arab Emirates and Baku and Sumgait (Azerbaijan), and relatively small in Korea, the Flemish Community (Belgium) and the Netherlands.
• The quality and composition of early education settings attended by five-year-olds account for a sizeable share of the differences in their early learning and development outcomes. On average, 36% of the variation in children’s scores in foundational learning domains, and 22% of the variation in scores in executive function and social and emotional development domains, are attributable to differences between these settings.
• Large shares of children with strong outcomes in one dimension of early learning and development also show strong outcomes in other dimensions, and the same holds for weaker outcomes. Policies to support children with relatively weak early skills need to address multiple dimensions at once.
• At age 5, girls outperform boys across the three dimensions of early learning and development assessed in IELS 2025. Gender gaps are more pronounced in social and emotional development, less visible in foundational learning, and often larger among those with weaker skills.
• Large socio-economic gaps are evident in learning and development outcomes by age 5. On average, socio-economically advantaged children score between 60 and 70 points higher in
emergent literacy and emergent numeracy than disadvantaged peers. Socio-economic gaps are smaller, but still consistent, in executive function and social and emotional development domains.
• Learning and development gaps between children with different immigration and language backgrounds are small compared to socio-economic or gender gaps, particularly after accounting for children’s socio-economic status.
• The perceptions of parents and teachers about five-year-olds’ cognitive and motor skills, socioemotional skills and global skills generally reflect the same socio-demographic gaps that emerge in children’s assessments.
• The quality of home learning environments varies markedly by socio-economic status, but what parents choose to do with their children matters. Children whose parents spend more time engaging with them in educational activities have stronger outcomes in emergent literacy, emergent numeracy, and in some social and emotional development domains, on average. Supporting disadvantaged families in providing rich home learning environments can promote better outcomes and reduce inequalities.
• For children aged 5 and under, books outperform screens when it comes to learning. Among a range of home learning activities on which IELS collected information, reading to children from a book shows the strongest associations with children’s outcomes in several domains. Meanwhile, more than half of the children in the study were reported to use a digital device daily, but digital practices were weakly and occasionally negatively related to children’s outcomes.
• Children whose parents are strongly involved in their early education settings at age 5 have higher scores than peers with less involved parents in many domains, particularly in social and emotional development. This relationship holds after accounting for socio-economic status. Policies that strengthen family-school connectedness in the early years could benefit all children.
• Children who start early childhood education and care (ECEC) or school at an earlier age are more likely to have positive learning outcomes at age 5. This association is most visible when comparisons are made between categories of starting age of participation, which tend to reflect the structure of ECEC programmes.
• The positive relationship between length of participation in ECEC or school and outcomes at age 5 is stronger for emergent literacy and emergent numeracy than with executive function and social and emotional development domains.
• IELS 2025 finds no evidence that participation in ECEC or school is more beneficial for socioeconomically disadvantaged children. Given greater participation among advantaged children in most jurisdictions - and its general positive impact on children - ECEC and early schooling may not currently have the opportunity to mitigate socio-economic gaps in early learning and development. Addressing gaps in early participation and ensuring consistently high-quality provision could help ECEC fulfil its potential for reducing inequalities.
• On average across jurisdictions, about one in ten children in IELS 2025 were reported by their parents to have experienced early learning or early social, emotional or behavioural difficulties, with this being higher among socio-economically disadvantaged families. Children exposed to more risk factors are more likely to receive special supports, suggesting these supports adequately target the most vulnerable children.
The International Early Learning and Child Well-being Study (IELS) provides a rich picture of children’s early learning and development outcomes by age 5. This chapter presents the rationale for focusing on children’s skills in the early years and outlines the factors and environments that drive positive early learning and development.
The first five years of a child’s life represent a window of opportunity, but also of vulnerability. Strong early skills promote future educational success and lifelong well-being, whereas a poor start can inhibit them. Ensuring that all children acquire the foundations for positive learning and development is one of the most efficient investments governments can make to enhance education, social and economic outcomes. Designing more effective early years policies requires a sound understanding of the timing and drivers of positive child outcomes and of their wide-ranging benefits to stimulate public investment in supporting environments.
This chapter first discusses arguments about the heightened sensibility that characterises the early years and the advantages of investments in that period. It then reviews evidence about the predictive power of early skills regarding important later outcomes in life, and concludes by outlining the main drivers of early learning and development. The chapter draws on work having informed the conceptual framework for the first two cycles of IELS (Shuey and Kankaraš, 2018[1]) (OECD, 2026[2]) and work from the OECD Starting Strong series (OECD, 2025[3]) and the OECD Centre on Well-Being, Inclusion, Sustainability and Equal Opportunity (OECD, 2021[4])
The early years as a critical window of opportunity and vulnerability
The first five years of life are a decisive period in skill formation, and early experiences and skills can have long-lasting impacts on a range of outcomes throughout schooling and adulthood. While the importance of neurological and physical development during the prenatal period and the first two years of life has long been recognised, research in child development is also increasingly highlighting the period from 3 to 5 years of age as an equally fundamental period of child development. There is also a growing recognition of the critical role that proximal experiences and environments play for young children. The early learning and development outcomes of five-year-olds assessed in IELS reflect cumulative processes and influences over the various stages of early childhood
A large body of multidisciplinary research identifies the early years as a pivotal period for laying the foundations of lifelong health, learning and well-being (Institute of Medicine and National Research Council, 2000[5]). The period from conception to age two, commonly referred to as “the first 1 000 days”, is characterised by exceptional rapid development in multiple areas. These first 1 000 days, therefore, constitute a major window of developmental sensitivity, marked by both extraordinary adaptability and pronounced vulnerability. The period is sensitive in a double sense: responses to changes in the environment – both prenatal and postnatal – drive early adaptations of bodily structures, which includes the possibility that short-term defensive reactions to adversity increase the likelihood of negative implications in the long term (Moore et al., 2017[6]) (Commission des 1000 premiers jours, 2020[7]) Birth outcomes, including prematurity and low birth weight, which are often associated with maternal distress during pregnancy, constitute the first measurable markers of possible developmental and health vulnerabilities with implications across the life course (Almond, Currie and Duque, 2018[8])
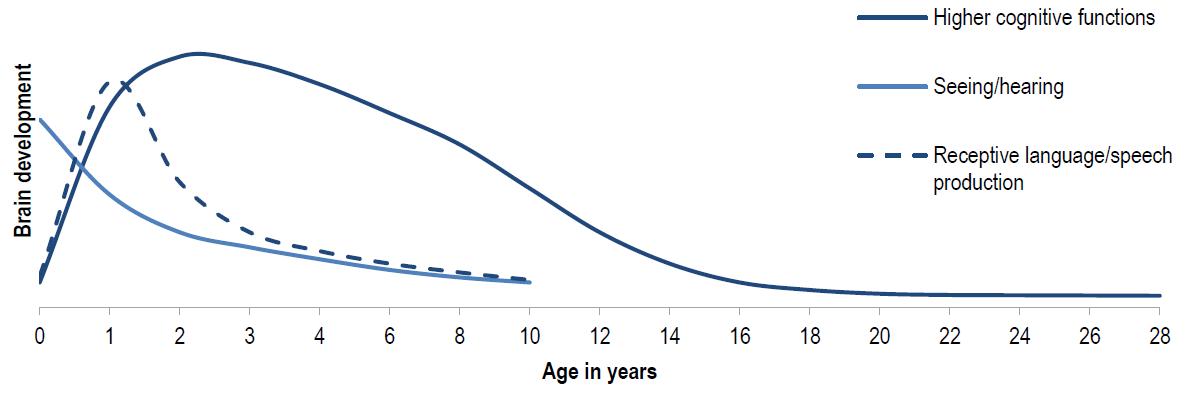
A key reason the early years are so critical for child development is brain plasticity, as depicted in stylised form in Figure 1.1. During the first years of life, the brain is at its most malleable, allowing young children to learn faster than at any other stage; however, different aspects of brain development (e.g., basic sensory processing, complex integrative functions) can peak at different times, as sensitive periods represent properties of domain-specific neural circuits rather than a feature of the overall brain (Knudsen, 2004[9]) (Stiles and Jernigan, 2010[10])
Source: Shuey and Kankaraš (2018[1]), The power and promise of early learning, https://dx.doi.org/10.1787/f9b2e53f-en; adapted from Institute of Medicine and National Research Council (2000[5]), From Neurons to Neighborhoods: The Science of Early Childhood Development, https://doi.org/10.17226/9824
Important complementary considerations come from growing research and policy interest in “the next 1 000 days”, defined as the period from 2 to 5 years and including the pre-school and pre-primary years (Draper et al., 2024[11]) (Nores et al., 2024[12]) Marked by accelerated growth across multiple domains, this phase constitutes another particularly sensitive developmental window in which targeted inputs can attenuate environmental risks, amplify protective factors, and consolidate adaptive developmental and behavioural trajectories. Importantly, “the next 1 000 days” offer scope to recalibrate pathways affected by earlier adversity, while also sustaining and building on achievements from the earlier period. Between the ages of 2 and 5, children undergo heightened neural maturation that supports fast growth in motor, language, and interactive abilities, as well as the emergence and gradual expansion of different aspects of selfregulation (including executive functions) that are highly experience-dependent (Draper et al., 2024[11]) This frames developmental sensitivity in early childhood as a continuing, life-course phenomenon, with ages 2 to 5 years as a critical second window where maturing learning and development capabilities remain highly responsive to both positive and adverse experiences.
A fundamental argument across these perspectives is that early foundational skills develop through relationships and context. Children’s progress toward developmental milestones depends heavily on the everyday interactions they have with parents, caregivers, and Early Childhood Education and Care (ECEC) professionals. This is because early skill development is inherently social and experience-dependent. In the first years of life, brain development is highly responsive to stimulation, especially through frequent, warm exchanges with attentive adults (Fox, Levitt and Nelson, 2010[13]). From birth, infants are drawn to social cues such as faces and voices, and they learn rapidly when adults engage them. This social orientation makes children active learners: they explore, test expectations, notice patterns, and adjust their understanding when something conflicts with what they predicted. Curiosity and experimentation are therefore core drivers of early learning, and errors should be viewed as normal signals of learning in progress (OECD, 2025[3])
Adults play a crucial scaffolding role. Supportive caregivers help children focus attention on what matters, make sense of experiences, and, critically, develop language. Rich verbal interaction in the early years is a key pathway to later knowledge: both how much adults talk with children and how they talk (diverse vocabulary, connected sentences, encouragement, songs, and shared reading) shape learning. When parents and caregivers recognise children’s curiosity and intentionally engage in learning activities, children gain stronger foundations for later achievement (Institute of Medicine and National Research Council, 2000[5]) Besides parents’ capacity to positively support children’s development through rich
interactions, children raised in stable, secure environments are more likely to develop a future-oriented mindset – including skills like anticipation and planning (Delgado et al., 2024[14]). Inversely, the experience of early adversity can speed a maturational transition from exploration to exploitation in decision-making (i.e. defaulting to known options instead of seeking new strategies), with limiting effects on learning trajectories (Frankenhuis and Gopnik, 2023[15])
As developmental sensitivity characterises growth through the early childhood years, children’s expanding environments beyond the home context make them especially reliant on the continuity and quality of nurturing and care inputs – and not just their availability. Because development remains malleable in this period, well-timed, high-quality investments – especially in caregiving support and quality early education and care environments – can rebalance risks and protections and shift children onto healthier trajectories before school entry.
From multiple scientific perspectives, child development can be understood as a time-dependent process in which early investments generate cumulative benefits that unfold throughout childhood and into adulthood (OECD, 2021[4]) The economic approach contends that early childhood investments compound over time: early skills function as stepping-stones that accelerate and strengthen later development, making future learning and development easier, more efficient, and sustained, enabling children to master increasingly complex tasks. This dynamic view is reinforced by the concepts of self-productivity and dynamic complementarity, which explain why capabilities acquired at one stage can create dependencies across the life course in the accumulation of human and social capital (Cunha and Heckman, 2007[16]) (Conti and Heckman, 2014[17]).
The ‘Heckman curve’ hypothesis (Heckman, 2008[18]) about the rates of return of social investments in early childhood relative to later ages remains the object of intense empirical scrutiny, finding support in a range of contexts, from targeted or means-tested programmes to universalist welfare states, but most often conditional on high levels of quality in intervention design and implementation (Elango et al., 2015[19]) (Rosholm et al., 2020[20]). Evidence from randomised field experiments in both home and early education interventions further suggests that relationships between age and spill-over effects may vary between different types of skills, being generally higher for early literacy than for other areas (Fryer, 2017[21])
Importantly, the principle of dynamic complementarity – by which children with stronger early skills would benefit more from later investments – has implications not only for the timing of investments, but also for their breadth of focus. Policies targeting multiple early developmental domains, encompassing cognitive, self-regulation and social and emotional skills, are likely to have a greater positive impact than policies with a narrower focus on skills that are likely to be addressed at later ages, and typically in compulsory levels of education (OECD, 2025[3]). A coherent sequence of skill-building interventions that spans early childhood and the first years of primary school – and is designed so that each stage builds on the previous one – can be more effective and efficient (Duncan et al., 2023[22]). Policies need also to explore avenues to scale up successful examples of multi-component interventions that address the holistic needs of young children – and, ultimately, consider the high costs of underinvestment in early childhood development (Richter et al., 2017[23]) (Nores et al., 2024[12]).
A child’s development in the first few years of life significantly predicts their later success in education, as well as their long-term happiness and well-being. Early learning and development are consistently linked to educational attainment, physical and mental health, social outcomes, employment, earnings, socioeconomic status, and civic engagement. A large body of evidence combining information from the pre-
school years through schooling into adulthood shows significant relationships between children’s early experiences and later outcomes (Shuey and Kankaraš, 2018[1]) (OECD, 2021[4]). The benefits of strong early learning and development are clearly evident at school entry, at the end of compulsory schooling and later in adulthood.
At the same time, no single early learning domain can reliably predict children’s later outcomes. Rather, it is a combination of early skills that support children’s positive, holistic development and well-being. While there is overlap across the major areas of early learning and development, each also has an independent effect on later outcomes. Thus, each of these dimensions is necessary but not sufficient to predict later outcomes.
hildren’s
There is no trade-off between early learning and children’s happiness or, from a child’s perspective, between learning and play. Happy, healthy children are active and curious and enjoy the natural processes of learning. These processes occur through interactions with family and other caregivers, and through different types of play. Through these experiences, children learn about and actively explore their world, as they also develop their foundational learning, cognitive, social and emotional, and physical skills (Zosh, Hassinger-Das and Laurie, 2022[24]). Both child-initiated free play and guided play are fundamental to children’s development, strengthening their understanding of the world and their environment. Play provides a meaningful context for learning early concepts in literacy, numeracy, and science, and it promotes curiosity, communication, and emotional involvement. Learning and play are complementary; playful learning engages children in ways that can enhance both academic achievement and social development (Hirsh-Pasek et al., 2008[25]) (Weisberg, Hirsh‐Pasek and Golinkoff, 2013[26])
Positive interactions with others help children learn to express their feelings and preferences, listen, share, regulate their emotions, solve problems, and sustain attention and concentration. These early competencies shape how effectively children relate to peers and their ability to form friendships. For example, substantial evidence shows a positive association between emotional regulation in early childhood, early learning, and the quality of friendships and social skills developed in middle and later childhood (Blair et al., 2015[27])
Foundational learning skills such as emergent literacy and emergent numeracy are positively associated with later educational achievement. In addition, cognitive and emotional self-regulation, visual-motor skills and agreeableness in early childhood all predict later educational attainment. These early skills are evident in the skills students demonstrate at the end of elementary school and secondary school, including higher rates of school completion (Shuey and Kankaraš, 2018[1]). Emergent literacy and emergent numeracy are positively associated with later educational achievement (Duncan et al., 2007[28]) (Claessens, Duncan and Engel, 2009[29]) (Jordan et al., 2009[30]).
Self-regulation, visual-motor skills and agreeableness in early childhood also predict school readiness and later outcomes in schooling (Howard and Vasseleu, 2020[31]) (Robson, Allen and Howard, 2020[32]).
Aspects of self-regulation, such as attentiveness and task persistence among children starting school, are positively associated with achievement in reading and mathematics throughout primary school (Li-Grining et al., 2010[33]). Children’s social and emotional skills are also related to later educational achievement. Children with emotional regulation, social competence, and coping skills at age four and five were found to have better school achievement outcomes at age eight (O’Connor et al., 2019[34]). Self-regulation appears to be particularly important for boys and for children from low-income or at-risk families in predicting later education outcomes (Washbrook, Propper and Sayal, 2013[35]).
Early academic skills, such as emergent literacy and emergent numeracy, are also positively associated with educational attainment in adulthood (Schoon et al., 2015[36]). In addition, self-regulation, agreeableness, visual-motor skills, and prosocial behaviour in early childhood all predict adult educational attainment, such as completing a degree. Both self-regulation and early agreeableness have been found to be associated with higher academic attainment in adulthood, even after adjusting for earlier cognitive ability. Furthermore, early self-regulation has been found to be a stronger predictor of degree completion by age 25 than early reading or maths scores (McClelland et al., 2013[37])
Strong early cognitive skills, cognitive and emotional self-regulation skills and social well-being have clear positive associations with employment, income and socio-economic status in adulthood. For example, stronger verbal skills at age five are linked with a greater likelihood of being employed, higher income, higher rates of home ownership and a lower likelihood of living in social housing in adulthood (Schoon et al., 2015[36]) Similar associations are found for early numeracy and visual-motor skills.
Indeed, adults who succeeded in moving out of the poverty they experienced as children generally displayed higher cognitive skills in their early years than others from similar circumstances who remained in poverty as adults (Blanden, Gregg and Macmillan, 2007[38]).
Early cognitive skills are a stronger predictor of adult earnings for women than for men, although in a negative rather than positive direction. Women who had low early cognitive skills faced larger wage penalties in the labour market than men with similarly low levels of early cognitive skills (Parsons et al., 2011[39]). Cognitive ability in reading and math measured in kindergarten is also highly correlated with later adulthood earnings, college attendance, home ownership, and retirement savings (Chetty et al., 2011[40])
Early self-regulation has also been found to be linked to labour market outcomes (Robson, Allen and Howard, 2020[32]) Better early self-regulation is related to a lower likelihood of unemployment, welfare dependence, including social housing, and higher income levels (Fergusson, Boden and Horwood, 2013[41])
Early cognitive skills, self-regulation, emotional health and social skills are all associated with better mental health in adulthood. Children with better receptive language skills at age five were more likely to have positive mental health outcomes as adults, including a lower likelihood of depression, anxiety and psychological distress. One longitudinal study found a positive relationship between participation in a specific pre-school program and long-term psychological well-being (Mondi and Reynolds, 2022[42]). Better self-regulation and visual-motor skills at age five are also associated with lower malaise in adulthood. Conversely, poor early self-regulation is associated with later psychological disorders, particularly for men (Schoon et al., 2015[36]).
Physical health in adulthood is also associated with children’s early development and skills. Early cognitive abilities, as well as self-regulation, visual-motor skills, agreeableness, and conscientiousness, are linked with adult physical health. This includes better self-reported health, better eating habits and lower likelihoods of obesity, depression and anxiety, smoking and substance abuse and symptoms of physical illness in adulthood (Schoon et al., 2015[36]) (Robson, Allen and Howard, 2020[32])
Early learning and development and child well-being are interrelated, mutually reinforcing, and driven by the same factors. Early development is sequential and cumulative, so frequent, ongoing positive interactions lead to a virtuous cycle of skills acquisition. Human development is highly complex and characterised by the interplay rather than opposition of “nature and nurture”. Individuals’ characteristics (i.e. genetic or other biological features) are in constant interaction with their environments (e.g. features of the home and other contexts). Thus, while skills may be heritable to varying extents, the environments that children experience influence the ways in which they develop particular skills and also their potential for learning new skills (Rutter, 2006[43]) (Anreiter, Sokolowski and Sokolowski, 2017[44])
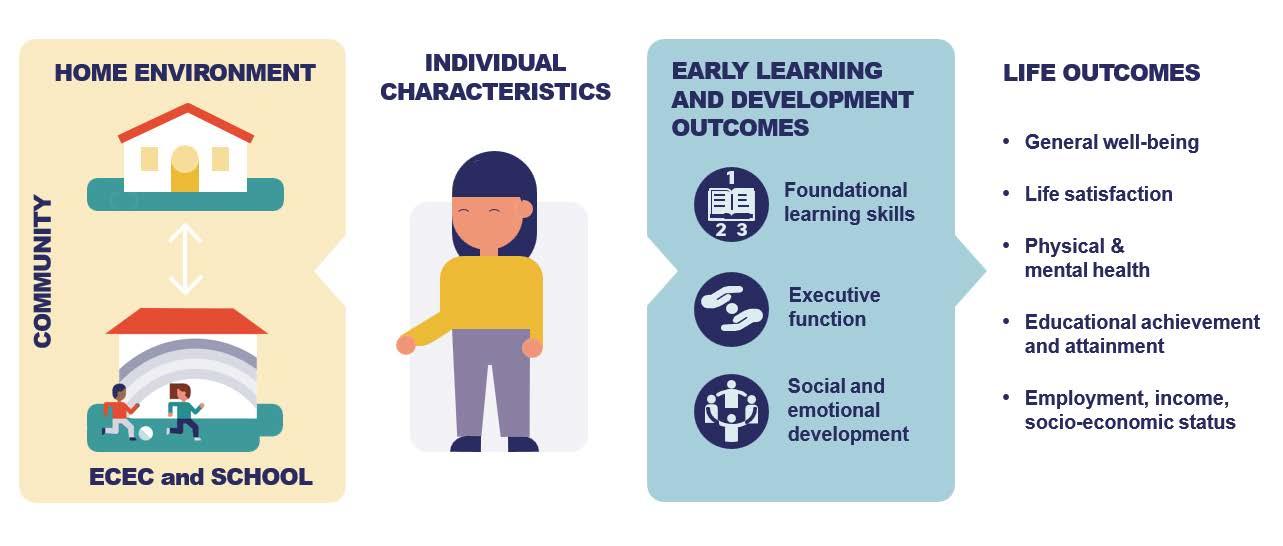
Heightened sensitivity early in life means that young children are especially influenced by and responsive to external stimuli, such as the types of interactions they have with their parents and other caregivers. The IELS framework focuses on the family and home environments and on early care and education settings as two major drivers of children’s early learning and development outcomes, which in turn are posited to influence later outcomes (Figure 1.2).
Children thrive in caring families, where they feel safe and happy and where they are supported to learn about themselves and their social, cultural and physical environments. The day-to-day interactions and activities between young children and their parents and other family members foster children’s well-being and their emerging skills in multiple dimensions of early learning and development.
Children also learn in settings beyond their immediate home, including their wider family network, their neighbourhood community, ECEC settings, and early schooling. While ECEC/school can be beneficial for all children, they can be particularly important for children who lack strong home learning environments For these children, experiences in early care and education may represent a particularly important opportunity to develop the key skills that will help them thrive in life
Children’s home environment is a strong predictor of children’s early development. Family socio-economic status, parental education, parenting behaviours and parental well-being all contribute to the home environment children experience and to their early learning and development outcomes (Feinstein, Duckworth and Sabates, 2008[45])
Parents are the first to introduce children to the world. Parent-child interactions are enjoyable for both adults and infants and set in motion a positive cycle of communication. Infants form attachments to caregivers who respond promptly, warmly, and appropriately to their cues, and this sense of security supports learning (OECD, 2025[3]). The activities parents undertake with their children – such as reading together, engaging in warm and responsive interactions, and frequently using complex adult language –help create a home learning environment that supports children’s development of cognitive skills, selfregulation, social-emotional skills and overall well-being.
Source: Adapted from Shuey and Kankaraš (2018[1]), The power and promise of early learning, https://dx.doi.org/10.1787/f9b2e53f-en
The Effective Pre-school and Primary Education Project (EPPE) identified a range of activities that parents undertake with their children that significantly affect later achievement in education, including the frequency of reading from books; playing with numbers; painting and drawing; teaching letters teaching numbers, and teaching songs, rhymes and poems, taking children on visits and creating regular opportunities for them to play with their friends at home. Home learning environments where these activities are frequent and consistent are associated with better cognitive, emotional and behavioural outcomes for young children. EPPE found the combined effect of these activities was greater than the effects of parental education and family socio-economic status, although the prevalence of these activities correlated positively with both (Sylva et al., 2004[46])
Within home environments, young children are engaging with digital technologies at progressively earlier ages, for a wide range of purposes, often alongside their parents or under parental supervision. Evidence on the links between children’s online engagement and their well-being and development – including physical health, cognitive development and learning, and socio-emotional well-being and mental health –suggests that impacts vary substantially by type of activity and mode of engagement, rather than being associated with the total amount of time spent using digital tools. The literature further underscores the need to align digital media exposure and activities with children’s developmental stages, given that the balance of risks and opportunities changes with age. Outcomes are also shaped by personal and contextual factors that may increase vulnerability or provide protection, thereby moderating the likelihood and severity of potential effects associated with digital practices (OECD, 2023[47]) (OECD, 2025[48])
Efforts to support children’s early learning, development and well-being are most effective when they involve supporting families to provide home environments in which their children will flourish.
ECEC serves multiple functions. In many contexts, it is used as a tool to increase women’s labour participation, help families to reconcile work and family responsibilities, confront demographic challenges such as decreasing fertility rates and ageing populations, and maintain high employment-to-population ratios. More recently, however, governments increasingly view ECEC as a means of supporting children’s early development and mitigating social inequalities. Multiple factors influence whether early childhood education delivers positive outcomes for all children. These include the quality and responsiveness of
ECEC provision, whether such provision focuses on the skills children need to develop most in the early years, and the timeliness and continuity of provision (OECD, 2025[3]).
Policy makers are increasingly investing in ECEC programmes to build a strong foundation for cognitive, self-regulation and social and emotional skills, especially for children from disadvantaged or immigrant backgrounds to combat the linguistic and economic disadvantages that could otherwise hinder children’s development and integration. As such, ECEC is seen by many as a critical policy measure that can promote equity, support holistic and continuous development and improve child well-being. However, research suggests that fulfilling this role rests on ensuring high and consistent levels of quality in ECEC services, with regulatory requirements governing formal ECEC provision representing necessary but not sufficient conditions (van Huizen and Plantenga, 2018[49]) (Duncan et al., 2023[22]). Further, lower levels of participation and access to lower quality services, less responsive or tailored to their needs, remain important obstacles for ECEC and early schooling to play a substantive role in mitigating inequalities (OECD, 2025[3])
It is important to emphasise that children’s developmental contexts do not operate separately from each other (OECD, 2021[4]). The connections between home, school, and the wider community constitute “meso-systems” (Bronfenbrenner, 1986[50]) whose quality can substantially affect child well-being. Literacy development, for instance, reflects both learning opportunities in early education settings and the degree of learning support available at home. In the same way, children’s peer relationships at school are shaped by opportunities for social interaction beyond school, including interactions with friends and those available in safe and pleasant neighbourhoods.
References
Almond, D., J. Currie and V. Duque (2018), “Childhood Circumstances and Adult Outcomes: Act II”, Journal of Economic Literature, Vol. 56/4, pp. 1360-1446, https://doi.org/10.1257/jel.20171164
Anreiter, I., H. Sokolowski and M. Sokolowski (2017), “Gene–Environment Interplay and Individual Differences in Behavior”, Mind, Brain, and Education, Vol. 12/4, pp. 200-211, https://doi.org/10.1111/mbe.12158
Blair, B. et al. (2015), “Identifying developmental cascades among differentiated dimensions of social competence and emotion regulation.”, Developmental Psychology, Vol. 51/8, pp. 10621073, https://doi.org/10.1037/a0039472
[8]
[44]
[27]
Blanden, J., P. Gregg and L. Macmillan (2007), “Accounting for Intergenerational Income Persistence: Noncognitive Skills, Ability and Education”, The Economic Journal, Vol. 117/519, pp. C43-C60, https://doi.org/10.1111/j.1468-0297.2007.02034.x [38]
Bronfenbrenner, U. (1986), “Ecology of the family as a context for human development: Research perspectives.”, Developmental Psychology, Vol. 22/6, pp. 723-742, https://doi.org/10.1037/0012-1649.22.6.723. [50]
Chetty, R. et al. (2011), “How Does Your Kindergarten Classroom Affect Your Earnings? Evidence from Project Star”, The Quarterly Journal of Economics, Vol. 126/4, pp. 1593-1660, https://doi.org/10.1093/qje/qjr041
[40]
Claessens, A., G. Duncan and M. Engel (2009), “Kindergarten skills and fifth-grade achievement: Evidence from the ECLS-K”, Economics of Education Review, Vol. 28/4, pp. 415-427, https://doi.org/10.1016/j.econedurev.2008.09.003 [29]
Commission des 1000 premiers jours (2020), Les 1000 premiers jours: Là où tout commence, Ministère des Solidarités et de la Santé, France, https://solidarites.gouv.fr/sites/solidarite/files/2023-01/rapport-1000-premiers-jours.pdf (accessed on 8 December 2025). [7]
Conti, G. and J. Heckman (2014), “Economics of Child Well-Being”, in Handbook of Child WellBeing, Springer Netherlands, Dordrecht, https://doi.org/10.1007/978-90-481-9063-8_21
Cunha, F. and J. Heckman (2007), “The Technology of Skill Formation”, American Economic Review, Vol. 97/2, pp. 31-47, https://doi.org/10.1257/aer.97.2.31
Delgado, H. et al. (2024), “Differential psychophysiological responses associated with decisionmaking in children from different socioeconomic backgrounds”, Child Development, Vol. 95/5, pp. 1478-1493, https://doi.org/10.1111/cdev.14082
Draper, C. et al. (2024), “The next 1000 days: building on early investments for the health and development of young children”, The Lancet, Vol. 404/10467, pp. 2094-2116, https://doi.org/10.1016/s0140-6736(24)01389-8
Duncan, G. et al. (2007), “School readiness and later achievement”, Developmental Psychology, Vol. 43/6, pp. 1428-1446, https://doi.org/10.1037/0012-1649.43.6.1428 [28]
Duncan, G. et al. (2023), Investing in early childhood development in preschool and at home, Elsevier, https://doi.org/10.1016/bs.hesedu.2022.11.005
Elango, S. et al. (2015), Early Chilhood Education, University of Chicago Press, https://www.nber.org/books-and-chapters/economics-means-tested-transfer-programs-unitedstates-volume-2/early-childhood-education. (accessed on 12 December 2025).
Feinstein, L., K. Duckworth and R. Sabates (2008), Education and the Family, Routledge, https://doi.org/10.4324/9780203894927
Fergusson, D., J. Boden and L. Horwood (2013), “Childhood Self-Control and Adult Outcomes: Results From a 30-Year Longitudinal Study”, Journal of the American Academy of Child & Adolescent Psychiatry, Vol. 52/7, pp. 709-717.e1, https://doi.org/10.1016/j.jaac.2013.04.008
Fox, S., P. Levitt and C. Nelson (2010), “How the Timing and Quality of Early Experiences Influence the Development of Brain Architecture”, Child Development, Vol. 81/1, pp. 28-40, https://doi.org/10.1111/j.1467-8624.2009.01380.x
Frankenhuis, W. and A. Gopnik (2023), “Early adversity and the development of explore–exploit tradeoffs”, Trends in Cognitive Sciences, Vol. 27/7, pp. 616-630, https://doi.org/10.1016/j.tics.2023.04.001
[19]
Fryer, R. (2017), “The Production of Human Capital in Developed Countries”, in Handbook of Economic Field Experiments, Elsevier, https://doi.org/10.1016/bs.hefe.2016.08.006 [21]
Heckman, J. (2008), “Schools, Skills, and Synapses”, Economic Inquiry, Vol. 46/3, pp. 289-324, https://doi.org/10.1111/j.1465-7295.2008.00163.x [18]
Hirsh-Pasek, K. et al. (2008), A Mandate for Playful Learning in Preschool, Oxford University Press, https://doi.org/10.1093/acprof:oso/9780195382716.001.0001
Howard, S. and E. Vasseleu (2020), “Self-Regulation and Executive Function Longitudinally Predict Advanced Learning in Preschool”, Frontiers in Psychology, Vol. 11, https://doi.org/10.3389/fpsyg.2020.00049
Institute of Medicine and National Research Council (2000), From Neurons to Neighborhoods: The Science of Early Childhood Development, The National Academies Press, https://doi.org/10.17226/9824 (accessed on 7 November 2025).
Jordan, N. et al. (2009), “Early math matters: Kindergarten number competence and later mathematics outcomes.”, Developmental Psychology, Vol. 45/3, pp. 850-867, https://doi.org/10.1037/a0014939
Knudsen, E. (2004), “Sensitive Periods in the Development of the Brain and Behavior”, Journal of Cognitive Neuroscience, Vol. 16/8, pp. 1412-1425, https://doi.org/10.1162/0898929042304796
Li-Grining, C. et al. (2010), “Children’s early approaches to learning and academic trajectories through fifth grade.”, Developmental Psychology, Vol. 46/5, pp. 1062-1077, https://doi.org/10.1037/a0020066
McClelland, M. et al. (2013), “Relations between preschool attention span-persistence and age 25 educational outcomes”, Early Childhood Research Quarterly, Vol. 28/2, pp. 314-324, https://doi.org/10.1016/j.ecresq.2012.07.008.
Mondi, C. and A. Reynolds (2022), “Psychological well-being in midlife following early childhood intervention”, Development and Psychopathology, Vol. 35/1, pp. 357-382, https://doi.org/10.1017/s0954579421001528
Moore, T. et al. (2017), The First Thousand Days: An Evidence Paper – Summary, Centre for Community Child Health, Murdoch Children’s Research Institute, https://www.rch.org.au/uploadedFiles/Main/Content/ccchdev/CCCH-The-First-ThousandDays-An-Evidence-Paper-Summary-September-2017.pdf (accessed on 13 December 2025).
Nores, M. et al. (2024), “The cost of not investing in the next 1000 days: implications for policy and practice”, The Lancet, Vol. 404/10467, pp. 2117-2130, https://doi.org/10.1016/s01406736(24)01390-4.
O’Connor, M. et al. (2019), “Positive Mental Health and Academic Achievement in Elementary School: New Evidence From a Matching Analysis”, Educational Researcher, Vol. 48/4, pp. 205-216, https://doi.org/10.3102/0013189x19848724
OECD (2026), IELS 2025 Assessment Framework, http://oecd.org/en/about/projects/international-early-learning-and-child-well-being-study
OECD (2025), How’s Life for Children in the Digital Age?, OECD Publishing, Paris, https://doi.org/10.1787/0854b900-en
OECD (2025), Reducing Inequalities by Investing in Early Childhood Education and Care, Starting Strong, OECD Publishing, Paris, https://doi.org/10.1787/b78f8b25-en
[37]
[42]
[6]
OECD (2023), Empowering Young Children in the Digital Age, Starting Strong, OECD Publishing, Paris, https://doi.org/10.1787/50967622-en [47]
OECD (2021), Measuring What Matters for Child Well-being and Policies, OECD Publishing, Paris, https://doi.org/10.1787/e82fded1-en
Parsons, S. et al. (2011), “Long-term Outcomes for Children with Early Language Problems: Beating the Odds”, Children & Society, Vol. 25/3, pp. 202-214, https://doi.org/10.1111/j.1099-0860.2009.00274.x
Richter, L. et al. (2017), “Investing in the foundation of sustainable development: pathways to scale up for early childhood development”, The Lancet, Vol. 389/10064, pp. 103-118, https://doi.org/10.1016/s0140-6736(16)31698-1
Robson, D., M. Allen and S. Howard (2020), “Self-regulation in childhood as a predictor of future outcomes: A meta-analytic review.”, Psychological Bulletin, Vol. 146/4, pp. 324-354, https://doi.org/10.1037/bul0000227
Rosholm, M. et al. (2020), “Are Impacts of Early Interventions in the Scandinavian Welfare State Consistent with a Heckman Curve? A meta-Analysis”, Journal of Economic Surveys, Vol. 35/1, pp. 106-140, https://doi.org/10.1111/joes.12400 [20]
Rutter, M. (2006), “Gene–environment interdependence”, Developmental Science, Vol. 10/1, pp. 12-18, https://doi.org/10.1111/j.1467-7687.2007.00557.x [43]
Schoon, I. et al. (2015), The impact of early life skills on later outcomes, https://discovery.ucl.ac.uk/id/eprint/10051902/ (accessed on 14 December 2025).
Shuey, E. and M. Kankaraš (2018), “The Power and Promise of Early Learning”, OECD Education Working Papers, No. 186, OECD Publishing, Paris, https://doi.org/10.1787/f9b2e53f-en.
Stiles, J. and T. Jernigan (2010), “The Basics of Brain Development”, Neuropsychology Review, Vol. 20/4, pp. 327-348, https://doi.org/10.1007/s11065-010-9148-4.
Sylva, K. et al. (2004), The Effective Provision of Pre-School Education (EPPE) Project: Findings from Pre-school to end of Key Stage1, Sure Start, https://dera.ioe.ac.uk/id/eprint/18189/2/SSU-SF-2004-01.pdf (accessed on 23 November 2025).
van Huizen, T. and J. Plantenga (2018), “Do children benefit from universal early childhood education and care? A meta-analysis of evidence from natural experiments”, Economics of Education Review, Vol. 66, pp. 206-222, https://doi.org/10.1016/j.econedurev.2018.08.001
Washbrook, E., C. Propper and K. Sayal (2013), “Pre-school hyperactivity/attention problems and educational outcomes in adolescence: prospective longitudinal study”, British Journal of Psychiatry, Vol. 203/4, pp. 265-271, https://doi.org/10.1192/bjp.bp.112.123562.
Weisberg, D., K. Hirsh‐Pasek and R. Golinkoff (2013), “Guided Play: Where Curricular Goals Meet a Playful Pedagogy” , Mind, Brain, and Education, Vol. 7/2, pp. 104-112, https://doi.org/10.1111/mbe.12015
[36]
[1]
[10]
[46]
[49]
[35]
[26]
Zosh, J., B. Hassinger-Das and M. Laurie (2022), Learning Through Play and the Development of Holistic Skills Across Childhood, https://cms.learningthroughplay.com/media/kell5mft/hs_white_paper_008-digital-version.pdf (accessed on 21 November 2025).
This chapter outlines key elements of the design and implementation of the second cycle of the International Early Learning and Child Well-being Study (IELS 2025). This includes its objectives and guiding principles, the target group of children sampled, the aspects of early learning and development that were assessed, the variety of assessments carried out, and the contextual information gathered about children from parents and teachers. The chapter concludes by highlighting avenues for future developments.
The OECD’s International Early Learning and Child Well-being Study (IELS) was developed to support countries and jurisdictions in their efforts to improve children’s learning, development and well-being in the early years. The study collects a broad range of information on the drivers, levels and gaps in children’s early learning and development outcomes, and provides participant jurisdictions with reliable, valid and comparable data to monitor the extent to which their early years policies give all children a strong start in life.
Nine jurisdictions participated in the second cycle of the study (hereafter, IELS 2025), including four countries – Korea, Malta, the Netherlands and the United Arab Emirates – and five sub-national entities – Baku and Sumgait (Azerbaijan), Ceará, Pará and São Paulo (Brazil), England (United Kingdom), the Flemish Community (Belgium), and Hangzhou (China)1. Additionally, Abu Dhabi participated as an adjudicated region within the United Arab Emirates (see the IELS 2025 Technical Report (OECD, 2026[1])
The data collection for the main study was completed in 2025, building on field trials implemented in 20242 and the foundational work of the first cycle, which was completed in 2020 with the participation of England (United Kingdom), Estonia, and the United States. The consolidation of IELS and its assessment framework across two cycles lays the groundwork for bringing a comparative perspective to the study of trends in children’s early learning and development outcomes.
The design and implementation of IELS 2025
A fundamental objective of IELS is to provide evidence to help jurisdictions identify where improvements can be made to enhance children’s early years experiences and outcomes. International comparative data help policy makers, education leaders and early childhood practitioners understand what is possible to achieve for children in the early years3. This includes key system goals such as mitigating disadvantage and ensuring that children are well-positioned to succeed in school.
To achieve this objective, IELS contributes to the evidence base by providing a population-level assessment that reflects how a cohort of children is doing. This enables jurisdictions to observe differences in outcomes across various groups of children, including girls and boys, socio-economic groups, and children from migrant or linguistically diverse backgrounds. While the analysis in this report remains largely descriptive, connections between findings from the study and the policy context in each jurisdiction can support inferences that inform policy prioritisation, shape recommendations, guide further research questions, or support evaluations of previously enacted policy interventions.
The first cycle of IELS was developed in conjunction with countries interested in children’s early learning, development and well-being. As well as setting the objectives for the study, participants agreed on a set of guiding principles to steer its design, development and implementation, newly summarised below for this second cycle:
• Policy relevance: Capacity to inform changes in policy and/or practices.
• Reliable, valid and comparable: across jurisdictions, languages, cultural contexts and over time.
• Ethical: ensuring the well-being of participant children in all decisions.
• Practicable, efficient and cost-effective: a study that can be implemented without undue effort and cost burdens on jurisdictions, practitioners, parents and children.
IELS study focuses on a number of dimensions of children’s early learning and development that have been found to be strong and consistent predictors of positive later outcomes, including educational achievement and attainment, mental and physical health, employment and earnings, citizenship, wider well-being and life satisfaction (see Chapter 1 and the IELS 2025 Technical Report (OECD, 2026[1]))
The IELS assessment is intended for population-level monitoring and reporting and should be interpreted as an aggregate picture that illustrates how a cohort of children is faring overall. It should not be used to make judgements about any single child’s strengths and weaknesses or to evaluate individualised support needs. By assessing multiple domains of early learning and development, the study can provide insights into the strength of inter-relationships among these different domains and the extent to which different groups of children experience such overlapping skill sets. Children who are developing well in one area may be developing equally well in others, but disparities in the pace of skill development may also exist between areas. These insights can inform the design of policies and specific interventions to support children in developing a balanced set of early skills that become a strong foundation for further growth and well-being.
The study also captures relevant contextual information relating to children’s individual characteristics, families and home environments, and experiences in early childhood education and care (ECEC) and the initial years of primary schooling. This information is essential in answering policy and research questions about factors associated with stronger and weaker outcomes in these key domains, and for identifying gaps between different groups of children.
The children in the study are five-year-olds enrolled in regulated ECEC centres or schools in their respective jurisdictions. Age 5 is often the point at which children are about to enter or have just entered the schooling system, and it is also the point at which OECD countries reach near-universal participation in some form of formal early education. While some jurisdictions have not yet achieved universal participation by age 5, most are progressing toward universality at this stage, driven by growing enrolment rates in ECEC and earlier entry into schooling.
IELS carries out its assessments at a common age, rather than at a particular stage of education, in order to provide a more comparable basis across jurisdictions. A stage of education refers to a level or step within an education system, such as the point of entry to school or the last year of ECEC. The names and features of the educational settings where five-year-olds are enrolled typically vary across jurisdictions (see Chapter 6). Selecting an age rather than a specific stage or grade enables jurisdictions to understand what children of the same age in other jurisdictions know and are able to do, inviting reflection on the structure of ECEC and early schooling systems, regarding for instance features such as starting ages, duration, and curriculum.
Children in IELS are assessed in the ECEC centre or school they attended at age 5, to ensure the assessment was carried out in a setting the child was familiar with, as well as for reasons of practicality and cost. Accessing children in formal educational settings is generally easier and less costly than locating them and conducting assessments in their home or other settings.
To achieve jurisdiction-level representative samples, IELS uses a two-stage probability design. In the first stage, a random sample of ECEC centres/schools was selected in each jurisdiction. In the second stage, a random sample of children was selected from the list of eligible children within each selected ECEC centre/school. Overall, more than 23 000 children took part in the IELS 2025 main study across the nine participant jurisdictions. Statistical weightings are applied to enable accurate inferences about the jurisdiction-level population (see IELS 2025 Technical Report (OECD, 2026[1])).
All aspects of children’s early learning and development matter for their well-being and ongoing success in childhood and in adulthood. However, there is also a significant degree of overlap across aspects and measuring every distinct dimension of early and development to gauge how well children are faring is neither necessary nor feasible. In selecting a meaningful and manageable set of early skills for the study, IELS applied the following criteria:
• Broad rather than narrow, i.e. covering sufficient dimensions to provide an accurate indication of children’s early development and likely later outcomes
• Predictive of children’s later trajectories, across a broad set of positive outcomes in adulthood, beyond an exclusive focus on educational achievement
• Related to the learning that develops in early childhood and that can be developed through early years programmes, including in ECEC/school settings.
• Manageable in the time required from children, parents and teachers to participate in the study, and in terms of the cost of developing and implementing the study
Based on these considerations, IELS 2025 measures a balanced set of skills across three dimensions of children’s early learning and development: foundational learning, executive function and social and emotional development (see the IELS 2025 Assessment Framework (OECD, 2026[2]) Figure 2 1 list these dimensions and the domains included in each of them, as well as the mode of assessment.
In IELS 2025, three sources of information provide a many-sided perspective on children’s early learning and development:
• A direct assessment of each child in seven domains (i.e. the two foundational learning domains of emergent literacy and emergent numeracy; the three executive function domains of inhibition, working memory and mental flexibility; and the social and emotional development domains of emotion identification and emotional attribution).
• A questionnaire completed by each child’s ECEC/school teacher, including:
o an indirect assessment of each child in three domains (e.g. the social and emotional development domains of trust, pro-social behaviour and non-disruptive behaviour);
o perceptions about each child’s cognitive and motor skills, social and emotional skills, and global capabilities.
• A questionnaire completed by each child’s parents/guardians, including:
o perceptions about each child’s cognitive and motor skills, and social and emotional skills.
In this way, the study triangulates information from direct assessment of the child with indirect assessments of the child provided by adults who knew them well. This approach enables IELS to assess children’s early learning and development across a broader scope of domains than is possible through a direct assessment alone. For details on the construction of scores in the three indirectly assessment domains and the teacher’s and parent’s perceptions indices, see the IELS 2025 Technical Report (OECD, 2026[1])
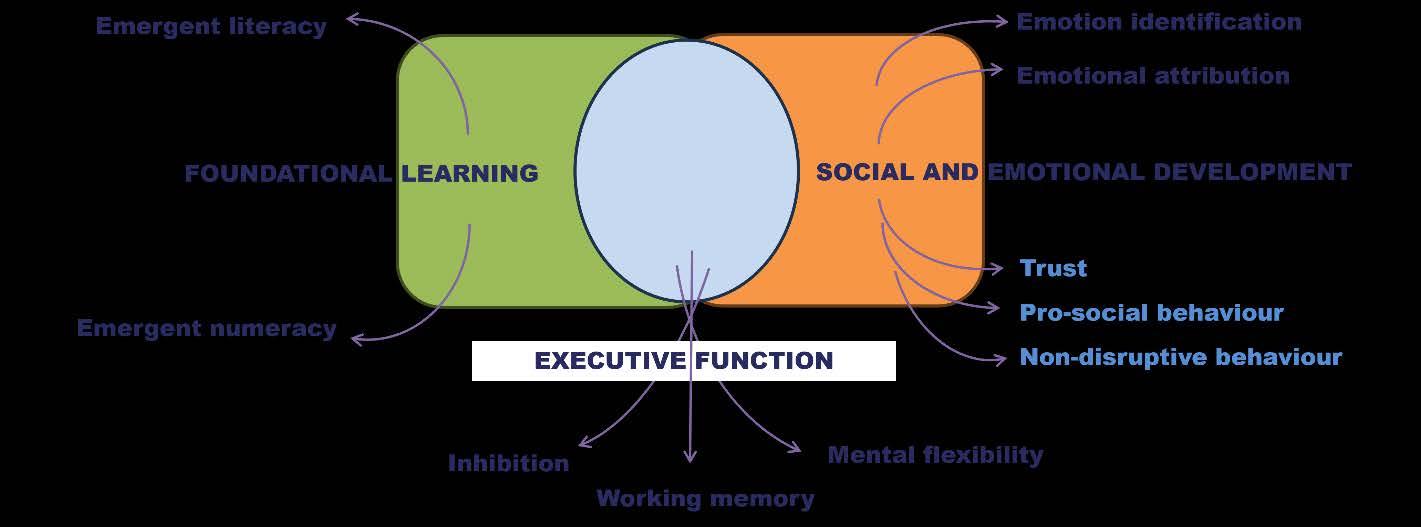
Note: Domains in dark blue font are directly assessed through play-based assessment on tablets, with one-to-one support from a trained study administrator. Domains in light blue font are indirectly assessed through reports from ECEC/school teachers. Emergent literacy includes three sub-domains: listening comprehension, vocabulary and phonological awareness. Emergent numeracy includes five sub-domains: numbers and counting, working with numbers, measurement, shape and space, and pattern.
Source: IELS 2025 Assessment Framework (OECD, 2026[2])
Foundational learning encompasses what are traditionally understood of as the skills children learn in early education settings. In IELS, two specific domains are assessed in this dimension: emergent literacy and emergent numeracy. These are fundamental skills that enable children to have a strong start in later stages of education where they will learn reading, writing and mathematics. Importantly, these emergent skills are precursors to later learning.
Emergent literacy is a child’s capacity to use knowledge and skills to understand information and narratives, as a developmental precursor to reading and writing (Whitehurst and Lonigan, 1998[3]) (Horowitz‐Kraus and Hutton, 2015[4]) In IELS, the emergent literacy assessment included three subdomains: listening comprehension, vocabulary and phonological awareness. Listening comprehension incorporates a range of early literacy skills, such as understanding the explicit and implied meaning of spoken language, including standalone sentences. Vocabulary knowledge is fundamental to comprehension and to successful communication with others, thereby further developing emergent literacy as well as social connectedness. Phonological awareness is the ability to detect, manipulate and analyse the auditory aspects of spoken language.
As an innovation in IELS 2025 a multi-stage adaptive design was used for the assessment of emergent literacy, which presented children with questions appropriately challenging for their ability level and to support appropriate targeting to a range of proficiency levels. A branching design was used for the literacy sub-domains of listening comprehension and vocabulary, while a stop rule was introduced for the subdomain of phonological awareness.
Emergent numeracy refers to the range of informal number and quantity skills that children in their early years, and which involve the understanding and manipulation of both symbolic and non-symbolic number (Bisanz et al., 2005[5]) (Raghubar and Barnes, 2016[6]) In IELS, emergent numeracy is defined as children’s early mathematical thinking, including their ability to mathematise through reasoning and problem solving as relates to real-world contexts. Emergent numeracy skills that predict later positive outcomes for children are as much about the processes of mathematics as about content. Through early stages of development, children learn that things can be measured, such as by counting objects and
comparing lengths and weights. At age 5, children also develop organised ways of thinking about and addressing mathematical problems to arrive at solutions.
In IELS 2025, the emergent numeracy assessment covered five sub-domains: numbers and counting, working with numbers, measurement, shape and space, and pattern. In the sub-domain of numbers and counting, children are for instance asked to identify digits and numbers up to 20. In the sub-domain of working with numbers, sample tasks included adding and subtracting in informal number story contexts. The measurement sub-domain focuses on the ability to use everyday language compare measures (e.g. longer, heavier). Shape and space assessed children’s understanding of common shapes (e.g. identify triangles) and use of language of location (e.g. above). In turn, the pattern sub-domain is concerned with children’s ability to recognise and create patterns of shapes or objects.
Executive function is the cognitive aspect of self-regulation4, which is a complex construct that supports purposeful, goal-directed, problem-solving behaviour (Diamond, 2013[7]) (Hofmann, Schmeichel and Baddeley, 2012[8]) (Diamond, 2013[7]) (Hofmann, Schmeichel and Baddeley, 2012[8]) (Bailey, 2018[9]). IELS focuses on three core components of executive function: inhibition, working memory, and mental flexibility. The domain of inhibition relates to children’s ability to regulate impulsive and automatic reactions and switch attention or consciously choose and concentrate on the required tasks.
Working memory reflects a child’s ability to store information for current use and bring it to bear to complete tasks. Children with well-developed working memory are typically able to follow instructions without the need for frequent repetition. Mental flexibility refers to children’s ability react quickly to changing stimuli or shifts in rules or circumstances, helping them to manage complex and multiple tasks. In the IELS 2025 assessment, each of these domains was presented as a series of games and is divided into clusters of items of increasing difficulty, with the next cluster only being accessible if the child is managing above a designated level.
Social and emotional are individual capacities that enable people to collaborate with others, as well as regulate one’s own emotions and behaviour to achieve goals (Chernyshenko, Kankaraš and Drasgow, 2018[10]). During the early years, children form close relationships and develop expectations of behaviours for both them and others. They learn to regulate their emotions and actions, to take others’ perspectives and to empathise. These skills serve as the building blocks for later development of more complex social and emotional skills (Halle and Darling-Churchill, 2016[11]) (Campbell et al., 2016[12]). IELS 2025 measures five domains of children’s social and emotional development: emotion identification and emotional attribution (together conceptualised as empathy), trust, pro-social behaviour, and non-disruptive behaviour.
In IELS, empathy refers to the ability of children to understand and respond to the thoughts, intentions and emotional states of others. The study uses empathy tasks that contrast the emotional states of characters and particular social situations in stories. It measures two components of empathy. The first component is emotion identification, which relates to ability to identify the emotions of others. The second component is emotional attribution, which pertains to the correspondence between the child’s emotional response to a story and the emotions experienced by the characters in the story.
In IELS, the domain of trust relates to social confidence or the child’s capacity to establish interpersonal trusting relationships. The domains of pro-social behaviour and non-disruptive behaviour concern social behaviours that might be expected to be influenced by children’s experiences in ECEC centres/schools, and are based on a modified version of the Adaptive Social Behaviour Inventory (ASBI), an instrument developed as a general measure of social competence for pre-school-aged children (Hogan, Scott and
Bauer, 1992[13]) Positive dimensions related to expression and compliance were combined into a measure of pro-social behaviour. Disruptive aspects were used to infer the inverse, that is, the child’s non-disruptive behaviour.
IELS 2025 uses both direct and indirect assessments of children’s social and emotional development skills: empathy-related domains are assessed directly, whereas trust, pro-social behaviour and non-disruptive behaviour are measured indirectly through reports from ECEC/school teachers5. More information on the indirectly assessed domains is provided below.
Children completed a direct, play-based assessment on tablets, with one-to-one support from a trained study administrator. The children listened to stories and interacted with cartoon-like characters by touching or moving items on the screen. The assessment uses drag-and-drop technology, where children move items on the screen, as well as hot-spot technology, where children tap objects to show their preferred choice. Study administrators ensured each activity was ready before children started and that each child could navigate his or her way through the activities. The study administrator remained with the child throughout the assessment sessions
Each direct assessment activity took approximately 15 minutes. Two assessment activities were administered per day, across two days. The two-day format aimed to ensure that children were neither overburdened by the assessment nor removed from the regular environment of their ECEC centre/school for an extended period of time.
The stories and other activities the children engaged in during the assessment were designed to be interesting, fun and developmentally appropriate for this age group. Two child characters (shown in Figure 2 2) guided the children through the activities via audio. The names and physical characteristics of these lead characters were adapted to the context of each participating jurisdiction. No reading or writing was involved in the direct assessment activities; only visual and auditory materials were used.
The questionnaire completed by the teacher or staff member who knew each child best in their ECEC centre/school included several questions about the child’s learning and development, as reflected in behaviours that teachers observed at the ECEC centre/school the child attends.
Teachers were asked to select the response that best described the child on a series of 28 statements relating to children’s behaviours and attitudes when interacting with other children and with adults 6 Responses to this question were used to estimate children’s scores on three indirectly assessed social and emotional development domains of trust, pro-social behaviour and non-disruptive behaviour Examples of the items in the question include: “Greets unfamiliar children in a friendly way” (trust); “Tries to comfort others when they are upset” (pro-social behaviour); and ”Prevents other children from doing their own activities” (non-disruptive behaviour).
Teachers were also asked about the child’s ability to complete a series of tasks7 involving emergent literacy or emergent numeracy (e.g. “sort a group of objects by shape, size or colours”; “count in multiples”; “recognise the sounds of words that rhyme”), as well as related to empathy (e.g. “draw inferences about how a character felt after listening to a story”). Techers’ perceptions were used to estimate the child’s values on the index of ‘global capabilities’.
Figure 2.2. The lead characters from the children’s stories in the IELS 2025 direct assessments
Source: IELS 2025 Assessment Framework (OECD, 2026[2])
Lastly, teachers were asked to rate the level of development of the child relative to typical development on 12 different areas8, pertaining for instance to expressive language skills (e.g. “understands, interprets, listen”), fine and gross motor skills (“catches and throws balls”, “plays with small objects likes beads or bricks”), mood and emotion control (“gets over being upset quickly”) or peer relationships (“plays easily with others”). Teachers’ perceptions were used to estimate the child’s values on the teacher indices of ‘cognitive and motor skills’ and ‘socio-emotional skills’.
The Parent questionnaire included also some questions about the child’s learning and development, as reflected in behaviours that parents/guardians observed at home. Parents/guardians were asked to rate the level of development of the child relative to what they would estimate as typical development on 12 different areas9, using the same question as teachers. Parents’ perceptions were used to estimate the child’s values on the parent indices of ‘cognitive and motor skills’ and ‘socio-emotional skills’.
Contextual information on children’s individual characteristics, family context and home environments and experiences in ECEC/school is essential for understanding how these factors interact with their early learning and development outcomes. IELS 2025 administered contextual questionnaires to both parents/guardians and ECEC/school teachers to collect such information. Questionnaires were primarily delivered online, with a paper-based version available for participants without internet access. For details on the design of the contextual questionnaires and their alignment with the conceptual framework of IELS, see the IELS 2025 Technical Report (OECD, 2026[1]); for details on response rates and mode of administration, see the Reader’s Guide.
Information on the individual characteristics of each child participating in the study was collected from parents/guardians. This included:
• Exact age, transformed into age in months for analysis in this report.
• Gender
• Whether the child experienced any developmental challenges, including a low birthweight, a premature birth, or sensory, learning or behavioural difficulties
Information on aspects of home environments with the potential to influence children’s early learning, development and well-being was collected from parents/guardians. This included:
• Household composition, such as whether the child lived in a one- or two-parent household, the number of siblings of the child, and the age of parents/guardians
• Socio-economic status of the family, including parents/guardians’ employment status and occupations, highest levels of education completed, and annual household income. Consistent with other large-scale assessments, IELS uses this information to construct an index of socio-economic status; for details, see the Reader’s Guide and the IELS 2025 Technical Report (OECD, 2026[1]).
• Immigration background of the parents/guardians and the child
• Language(s) spoken at home by the parents/guardians and the child
• Number of children’s books in the home, and the frequency of use of digital devices by the child
• Frequency of parent-child activities with a learning and developmental focus, such as reading with the child and engaging in back-and-forth conversations.
ECEC/school participation and additional supports
Information on the child’s enrolment in ECEC or the early years of schooling up to age 5 was collected from parents/guardians. This included:
• Whether the child regularly attended an ECEC centre/school between ages 0 to 5.
• The types of ECEC or school attended by the child at each specific age, with questions adapted according to the organisation of the early education system of each jurisdiction.
• The number of hours that the child attended those settings.
Further, ECEC/school teachers provided information on whether the child had received different types of additional support services, such as learning or behavioural support, or support with the language of assessment.
IELS provide evidence that helps jurisdictions see where they can improve children’s early learning and development outcomes. Cross-jurisdictional comparative data can help policymakers, researchers and professionals in early education and care to address key issues in early childhood policy and practice, including reducing inequalities and helping all children start school ready to thrive. With the aim of strengthening the policy relevance of the analysis of IELS 2025 data, subsequent chapters in this report are structured around key questions:
Chapter 3: How five-year-olds are faring: What are average scores and variation in children’s early learning and development outcomes across the jurisdictions participating in IELS 2025? What are the associations between average scores and jurisdictions’ contextual factors? How do children’s scores and parents’ and teachers’ perceptions of their skills correlate with each other? How do children’s outcomes across domains of assessment correlate with each other?
Chapter 4: Equity gaps in early learning and development: How are children’s early learning and development outcomes associated with their gender, socio-economic, immigration and language
backgrounds? Are the gaps in assessed outcomes consistent with parents’ and teachers’ perspectives on children’s skills?
Chapter 5: Home environments and early learning and development: How are children’s early learning and development outcomes associated with home environments? What are the associations with factors such as parental levels of education, household structure, parent-child activities, or parents’ engagement in the child’s ECEC centre/school?
Chapter 6: Early childhood education and care, additional supports, and early learning and development: What are the ECEC/school participation patterns among children in IELS 2025? How is participation in ECEC/school associated with children’s early learning and development outcomes by age 5? What proportions of children in IELS 2025 experience early difficulties and receive special supports? How are these special supports associated with children’s early learning and development outcomes?
The topics examined in this report represent a small sample of the broad range of research and policy questions that IELS 2025 can inform. Alongside this report, the OECD has released Public Use Files (PUF) intended not only to enable the replication of the OECD’s analysis, but also to facilitate further secondary analysis by researchers. In addition to open-access datasets, the International Database Analyzer (IDB Analyzer) software tool of the International Association for the Evaluation of Educational Achievement (IEA) is freely available to download. There are numerous open questions that the high-quality IELS datasets could help explore, particularly when analyses are conducted in line with the study design. An expanded range of participant jurisdictions in future cycles of the study would increase the potential scope for both comparative and jurisdiction-specific analysis. In the same vein, trend analysis could be conducted for jurisdictions participating in several cycles of IELS.
Importantly, IELS data could be analysed in connection with data from other studies. For instance, other OECD large-scale assessment programmes measure related skills at different stages of the life course. The Programme for International Student Assessment (PISA) assesses reading and mathematics, the Survey of Adult Skills (PIAAC) assesses literacy and numeracy, and the Survey on Social and Emotional Skills (SSES) assesses social and emotional skills. This creates opportunities to use IELS, PISA, SSES and PIAAC – which assess individuals in early childhood, adolescence, and adulthood, respectively – together to examine long-term learning trajectories. However, many challenges exist to making direct and valid comparisons based on different surveys, including differences in their target populations, test administration procedures and assessment frameworks.
Going forward, an improved alignment between the conceptual and assessment frameworks of IELS and those of other OECD surveys, including PISA, PIAAC or SSES could create new opportunities to combine data across surveys to analyse skills development and equity outcomes from a longitudinal perspective, such as through birth cohort comparisons. This would require theoretical and methodological groundwork to explore whether different assessments can be positioned along a developmental continuum and to better understand what learning progressions look like over time.
Meanwhile, connections with the Starting Strong Teaching and Learning International Survey (TALIS Starting Strong) could also bring enhanced opportunities to understand the role that ECEC and early schooling can play in promoting children’s early learning and development and in reducing inequalities in children’s outcomes.
Bailey, R. (2018), Executive Function Mapping Project Measures Compendium: A Resource for Selecting Measures Related to Executive Function and Other Regulation-related Skills in Early Childhood., Office of Planning, Research and Evaluation, Administration for Children and Families, U.S. Department of Health and Human Services, https://acf.gov/opre/report/executive-function-mapping-project-measures-compendiumresource-selecting-measures (accessed on 16 January 2026).
Bisanz, J. et al. (2005), Development of arithmetic skills and knowledge in preschool children. In Campbell, J. (Ed.) Handbook of mathematical cognition, Psychology Press.
Campbell, S. et al. (2016), “Commentary on the review of measures of early childhood social and emotional development: Conceptualization, critique, and recommendations”, Journal of Applied Developmental Psychology, Vol. 45, pp. 19-41, https://doi.org/10.1016/j.appdev.2016.01.008 [12]
Chernyshenko, O., M. Kankaraš and F. Drasgow (2018), “Social and emotional skills for student success and well-being: Conceptual framework for the OECD study on social and emotional skills”, OECD Education Working Papers, No. 173, OECD Publishing, Paris, https://doi.org/10.1787/db1d8e59-en [10]
Diamond, A. (2013), “Executive Functions”, Annual Review of Psychology, Vol. 64/1, pp. 135168, https://doi.org/10.1146/annurev-psych-113011-143750 [7]
Halle, T. and K. Darling-Churchill (2016), “Review of measures of social and emotional development”, Journal of Applied Developmental Psychology, Vol. 45, pp. 8-18, https://doi.org/10.1016/j.appdev.2016.02.003
[11]
Hofmann, W., B. Schmeichel and A. Baddeley (2012), “Executive functions and self-regulation”, Trends in Cognitive Sciences, Vol. 16/3, pp. 174-180, https://doi.org/10.1016/j.tics.2012.01.006 [8]
Hogan, A., K. Scott and C. Bauer (1992), “The Adaptive Social Behavior Inventory (ASBI): A New Assessment of Social Competence in High-Risk Three-Year-Olds”, Journal of Psychoeducational Assessment, Vol. 10/3, pp. 230-239, https://doi.org/10.1177/073428299201000303
Horowitz‐Kraus, T. and J. Hutton (2015), “From emergent literacy to reading: how learning to read changes a child’s brain” , Acta Paediatrica, Vol. 104/7, pp. 648-656, https://doi.org/10.1111/apa.13018
OECD (2026), IELS 2025 Assessment Framework, http://oecd.org/en/about/projects/international-early-learning-and-child-well-being-study
OECD (2026), IELS 2025 Technical Report, http://oecd.org/en/about/projects/international-earlylearning-and-child-well-being-study
Raghubar, K. and M. Barnes (2016), “Early numeracy skills in preschool-aged children: a review of neurocognitive findings and implications for assessment and intervention”, The Clinical Neuropsychologist, Vol. 31/2, pp. 329-351, https://doi.org/10.1080/13854046.2016.1259387
Whitehurst, G. and C. Lonigan (1998), “Child Development and Emergent Literacy”, Child Development, Vol. 69/3, pp. 848-872, https://doi.org/10.1111/j.1467-8624.1998.tb06247.x
1 Results from Hangzhou (China) are not included in this report. See Reader’s Guide for more information.
2 Korea and Hangzhou (China) implemented only an operational field trial in early 2025.
3 International comparisons should be made with caution given contextual differences between jurisdictions, particularly when the level of participation (i.e. national, regional, municipal) differs.
4 In the first cycle, this dimension was labelled ‘Self-regulation’. Following recommendations by the IELS Technical Expert Group, the labelling in the second cycle changed to ‘Executive function’ Self-regulation is a broader concept that includes both cognitive and emotional types of self-regulation. The IELS assessment captures mainly the cognitive aspects of self-regulation, which are commonly referred to as executive function or cognitive control
5 Since the first cycle of IELS revealed that parents tended to use a limited (and generally positive) range of response categories, and to shorten the Parent Questionnaire, the second cycle of IELS collected trust, pro-social behaviour and non-disruptive behaviour data exclusively from children’s teachers.
6 This is Question 6 of Section B of the International version of the Staff questionnaire. Teachers responded to the 28 items/statements using a 5-point Likert scale for frequency ranging from “Never” to “Always”.
7 This is Question 4 of Section B of the International version of the Staff questionnaire. Response options to the 9 items/statements were “Yes”, “No” and “Not sure”.
8 This is Question 5 of Section B of the International version of the Staff questionnaire. Teachers responded to the 12 items/statements using a 5-point Likert scale ranging from “Much less than average” to “Much more than average”.
9 This is Question 5 of section A of the International version of the Parent questionnaire. Parents responded to the 12 items/statements using a 5-point Likert scale ranging from “Much less than average” to “Much more than average”.
This chapter compares average scores and variation in children’s early learning and development outcomes across the jurisdictions participating in IELS 2025. It then looks at associations between average scores and jurisdictions’ contextual factors. The chapter concludes by examining correlations between children’s scores and parents’ and teacher’s perceptions of their skills, and between children’s outcomes across domains of assessment.
• IELS 2025 finds significant differences in early learning and development outcomes across participating jurisdictions. In foundational learning and executive function domains, children in Korea consistently achieve high scores. Children in England (United Kingdom), in both emergent literacy and emergent numeracy, and in Baku and Sumgait (Azerbaijan), in emergent numeracy, also have comparatively high scores. In executive function domains, jurisdictions cluster more often around the international mean. In social and emotional development, several jurisdictions combine scores above and below the international mean in different domains.
• In foundational learning domains, gaps between high- and low-performing children are relatively large in the United Arab Emirates and Baku and Sumgait (Azerbaijan), and relatively small in Korea, the Flemish Community (Belgium) and the Netherlands. These gaps are more homogeneous between jurisdictions in executive function domains. In social and emotional development domains, differences between children with the highest and lowest scores are smallest in the Netherlands, and largest in the United Arab Emirates and Malta.
• Age differences in children’s scores as they grow from age 5 to age 6 are more pronounced in the domains of emergent numeracy and inhibition, followed by emergent literacy, working memory and mental flexibility, and smaller in social and emotional development domains.
• On average, 36% of the variation in foundational learning scores, and 22% of the variation in both executive function and social and emotional development scores occur between early childhood education and care (ECEC) centres or schools. This suggests that, within jurisdictions, the characteristics of ECEC centres/schools play a substantive role in explaining differences in children’s early learning and development outcomes.
• ECEC teachers’ perceptions about children’s skills show stronger correlations with children’s assessed early learning and development outcomes than parents’ perceptions.
• Correlations between children’s outcomes in different domains of early learning and development are consistently positive but vary in strength. A strong correlation exists between scores in the foundational learning domains of emergent literacy and emergent numeracy. Moderate correlations exist between executive function domains, particularly with inhibition. In social and emotional development, directly and indirectly assessed domains correlate weakly. Correlations are sometimes higher between domains in different dimensions than between domains in the same dimension. Scores in emergent literacy and emergent numeracy correlate strongly with scores in working memory and mental flexibility, and emotion identification correlate more with those than with most other social and emotional development domains.
• There is strong similarity in the relative position of children in the performance distributions across dimensions of early learning and development. Large shares of children with high or low scores in foundational learning have also high and low scores in executive function, respectively. The overlap between the distributions of children’s scores is less pronounced between foundational learning and social and emotional development. Overall, a minority of five-year-olds combine relatively strong skills in one dimension with relatively weak skills in others, but cross-over is higher in intermediate layers of performance.
IELS assesses the learning and development outcomes of 5-year-olds as a window into their acquisition of basic skills that matter for their future educational success and well-being. By focusing on an age at which children are close to starting primary school, IELS provides participating jurisdictions with reliable, valid and comparable data about the levels and drivers of these outcomes and about gaps between different groups of children. This information is essential to evaluate the performance of jurisdictions’ early years policies in providing a strong start in life for all children.
This chapter describes jurisdictions’ average performance in IELS 2025, setting the stage for the rest of the report and for further analyses of IELS 2025 data. This system-level perspective serves to identify jurisdictions’ main strengths in promoting early learning and development outcomes as well as areas where additional investments may be needed, both for future cohorts of young children and, in the near term, for primary school policies.
The first part of the chapter presents average scores for foundational learning, executive function and social and emotional development domains and compares performance across jurisdictions. Wide differences in social and economic conditions between the jurisdictions in IELS 2025 are the background for these comparisons. The second part of the chapter describes within-jurisdiction variation in early learning and development outcomes, preparing the ground for more detailed analyses of the factors driving differences among various groups of children.
The chapter concludes by looking at correlations between children’s scores in the 10 domains of IELS’ multidimensional assessment model and parents’ and teachers’ perceptions of children’s early skills, combining complementary perspectives about how five-year-olds are learning and developing. Lastly, the chapter presents correlations between children’s scores across those domains of assessment as well as their positions in joint performance distributions in different dimensions of early learning and development, providing insights into how different types of early skills relate to each other.
IELS assesses children’s outcomes in 10 early learning and development domains using the same metric, with international means standardised to 500 score points. Table 3 1 presents the mean scores of each of the jurisdictions participating in IELS 2025, and Table 3.2 shows how jurisdictions cluster when their means are not statistically significantly different. Mean scores are presented for all assessed outcomes, while performance clusters are based on the composite scores for the three broad dimensions of early learning and development (see the Reader’s guide). It is important to emphasise that no single ranking can do justice to the richness of information that IELS provides and, more importantly, to the variety of goals that jurisdictions pursue in their early years policies. This section also highlights the statistical uncertainty in IELS results when comparing jurisdictions.
IELS 2025 finds significant differences in early learning and development outcomes across participating jurisdictions. In the foundational learning and executive function dimensions, children in Korea stand out for consistently achieving higher scores than those in other jurisdictions. Children in England (United Kingdom), in both emergent literacy and emergent numeracy, and children in Baku and Sumgait (Azerbaijan), in emergent numeracy, also have comparatively high scores in the foundational learning dimension. There is generally less differentiation across executive function domains, with jurisdictions clustering around the international mean.
Note: OECD members are listed in black font. Partner countries/economies are listed in blue font. Sub-national jurisdictions are listed in italics. *Estimates for Brazil correspond to averages across the 3 participating Brazilian states. **IELS Adjudicated Region. Blue (grey) shading indicates scores are statistically significantly above (below) the IELS 2025 international averages, which are standardised to 500 score points in each domain. For more information, see the IELS 2025 Technical Report (OECD, 2026[1]) Jurisdictions are ranked in descending order of average composite scores for each dimension
Source: OECD, IELS 2025 Database, Tables B.3.1, B.3.2 and B.3.3.
Jurisdiction
Korea
England (United Kingdom)
Baku, Sumgait (Azerbaijan)
Netherlands
United Arab Emirates
Malta
Flemish Community (Belgium)
Ceará, Pará, São Paulo (Brazil)*
Jurisdiction
Korea
England (United Kingdom)
United Arab Emirates
Flemish Community (Belgium)
Baku, Sumgait (Azerbaijan)
Malta
Netherlands
Ceará, Pará, São Paulo (Brazil)*
Jurisdiction
England (United Kingdom)
United Arab Emirates
Malta
Baku, Sumgait (Azerbaijan)
Korea
Netherlands
Average composite score for foundational learning statistically similar
Netherlands, United Arab Emirates, Malta
Baku, Sumgait (Azerbaijan), United Arab Emirates, Malta
Baku, Sumgait (Azerbaijan), Netherlands, Malta, Flemish Community (Belgium), Ceará, Pará, São Paulo (Brazil)
Baku, Sumgait (Azerbaijan), Netherlands, United Arab Emirates, Flemish Community (Belgium), Ceará, Pará, São Paulo (Brazil)
United Arab Emirates, Malta, Ceará, Pará, São Paulo (Brazil)
United Arab Emirates, Malta, Flemish Community (Belgium)
Average composite score for executive function statistically similar
United Arab Emirates, Flemish Community (Belgium), Baku, Sumgait (Azerbaijan)
England (United Kingdom), Flemish Community (Belgium), Baku, Sumgait (Azerbaijan), Malta
England (United Kingdom), United Arab Emirates, Baku, Sumgait (Azerbaijan), Malta
England (United Kingdom), United Arab Emirates, Flemish Community (Belgium), Malta
United Arab Emirates, Flemish Community (Belgium), Baku, Sumgait (Azerbaijan)
C. Social and emotional development
Average composite score for social and emotional development statistically similar
United Arab Emirates, Malta
England (United Kingdom), Malta, Baku, Sumgait (Azerbaijan), Korea
England (United Kingdom), United Arab Emirates, Baku, Sumgait (Azerbaijan), Korea
United Arab Emirates, Malta, Korea, Netherlands, Flemish Community (Belgium)
United Arab Emirates, Malta, Baku, Sumgait (Azerbaijan), Netherlands, Flemish Community (Belgium)
Baku, Sumgait (Azerbaijan), Korea, Flemish Community (Belgium)
Flemish Community (Belgium) Baku, Sumgait (Azerbaijan), Korea, Netherlands
Ceará, Pará, São Paulo (Brazil)*
Note: OECD members are listed in black font. Partner countries/economies are listed in blue font. Sub-national jurisdictions are listed in italics. *Estimates for Brazil correspond to averages across the 3 participating Brazilian states. Regions are excluded from comparisons. Jurisdictions listed together horizontally have average composite scores not statistically significantly different from each other. Blue (grey) shading indicates scores are statistically significantly above (below) the IELS 2025 international averages, which are standardised to 500 score points in each domain. For more information, see the IELS 2025 Technical Report (OECD, 2026[1]) Jurisdictions are ranked in descending order of average composite scores for each dimension.
Source: OECD, IELS 2025 Database, TablesB.3.1, B.3.2 and B.3.3.
In the social and emotional development dimension, children in England (United Kingdom) achieve high average scores in three out of the five domains of assessment, which is also the case in two domains for children in Korea, Malta and the United Arab Emirates. Overall, results appear less consistent in this dimension, with children in four jurisdictions – the Flemish Community (Belgium), Malta, the Netherlands and Korea – combining average scores above and below the international mean in different domains.
When comparing mean scores between jurisdictions (Table 3 2), it is important to note that only statistically significant differences should be considered (see the Reader’s guide).
How skills are distributed across the child population complements information provided by jurisdiction averages. Two similar average performances can result from different distributions within jurisdictions, for instance, when the majority of children have scores near the average and when equal shares of children have scores distant from the average. In the first case, a compressed distribution means less differentiation in the skills that children attain by age 5, whereas in the second case, a wide distribution implies different groups of children attain rather unequal levels of skills. These two scenarios can have different policy implications.
In the foundational learning domains of emergent literacy and emergent numeracy, children in the Flemish Community (Belgium), Korea and the Netherlands have the smallest variability in scores, while children in the United Arab Emirates and Baku and Sumgait (Azerbaijan) have the largest variability, as measured by standard deviations1 (Table B.3.1). Scores in the executive function domains display less variation overall, with no clear pattern of results across jurisdictions (Table B.3.2). Variation is again comparatively low among children in the Netherlands across the five social and emotional development domains, as it is among children in Ceará, Pará and São Paulo (Brazil) in three domains and children in the Flemish Community (Belgium) in two domains. By contrast, variation in this dimension tends to be large among children in the United Arab Emirates and Baku and Sumgait (Azerbaijan), albeit not in all domains. In jurisdictions such as England (United Kingdom) and Korea, children’s scores vary less than international averages in the directly assessed domains of emotion identification and emotional attribution, but more in some of the indirectly assessed domains (Table B.3.3). Overall, across all early learning and development outcomes, there is a weak and inconsistent association between jurisdictions’ mean performance and the degree of variability in children’s scores.
Another measure of variation in outcomes is the difference that separates the children with the highest and lowest scores within a jurisdiction (i.e. 90th-10th inter-decile range)2 (Figure 3.1). For the 10 domains of early learning and development assessed in IELS 2025, the international averages for these differences range from 220 to 250 score points. This means that the scores of children in the upper and lower portions of the performance distribution tend to differ by approximately two to two and a half standard deviations. This level of variation is broadly consistent with the inter-decile ranges observed in PISA 2022 among 15-year-olds (OECD, 2023[2])
In foundational learning domains, the widest gaps between high- and low-performing children are found in the United Arab Emirates and Baku and Sumgait (Azerbaijan), where inter-decile ranges are above 280 score points in both emergent literacy and emergent numeracy. By contrast, these differences remain below 200 score points in Korea (in emergent literacy) and in the Flemish Community (Belgium) and the Netherlands (in emergent numeracy). Inter-decile ranges tend to be smaller in jurisdictions with higher average scores in emergent literacy, but no such association exists in emergent numeracy.
Distances between children in the upper and lower parts of the performance distribution are more homogeneous across jurisdictions in executive function domains, reflecting the lesser overall variation in this dimension of early development. In inhibition and mental flexibility, differences between children tend to be larger in jurisdictions with higher average scores on these domains, while the opposite holds in working memory.
Regarding social and emotional development domains, differences between children with the highest and lowest scores are smallest in the Netherlands, being below 200 score points in four of these domains, and largest in the United Arab Emirates and Malta, and generally mirror the overall level of variation in each jurisdiction. In trust, pro-social behaviour and non-disruptive behaviour, inter-decile ranges are larger in jurisdictions with higher average scores in these domains.
Differences between the 90th and 10th percentiles of the performance distribution in foundational learning, executive function, and social and emotional development domains
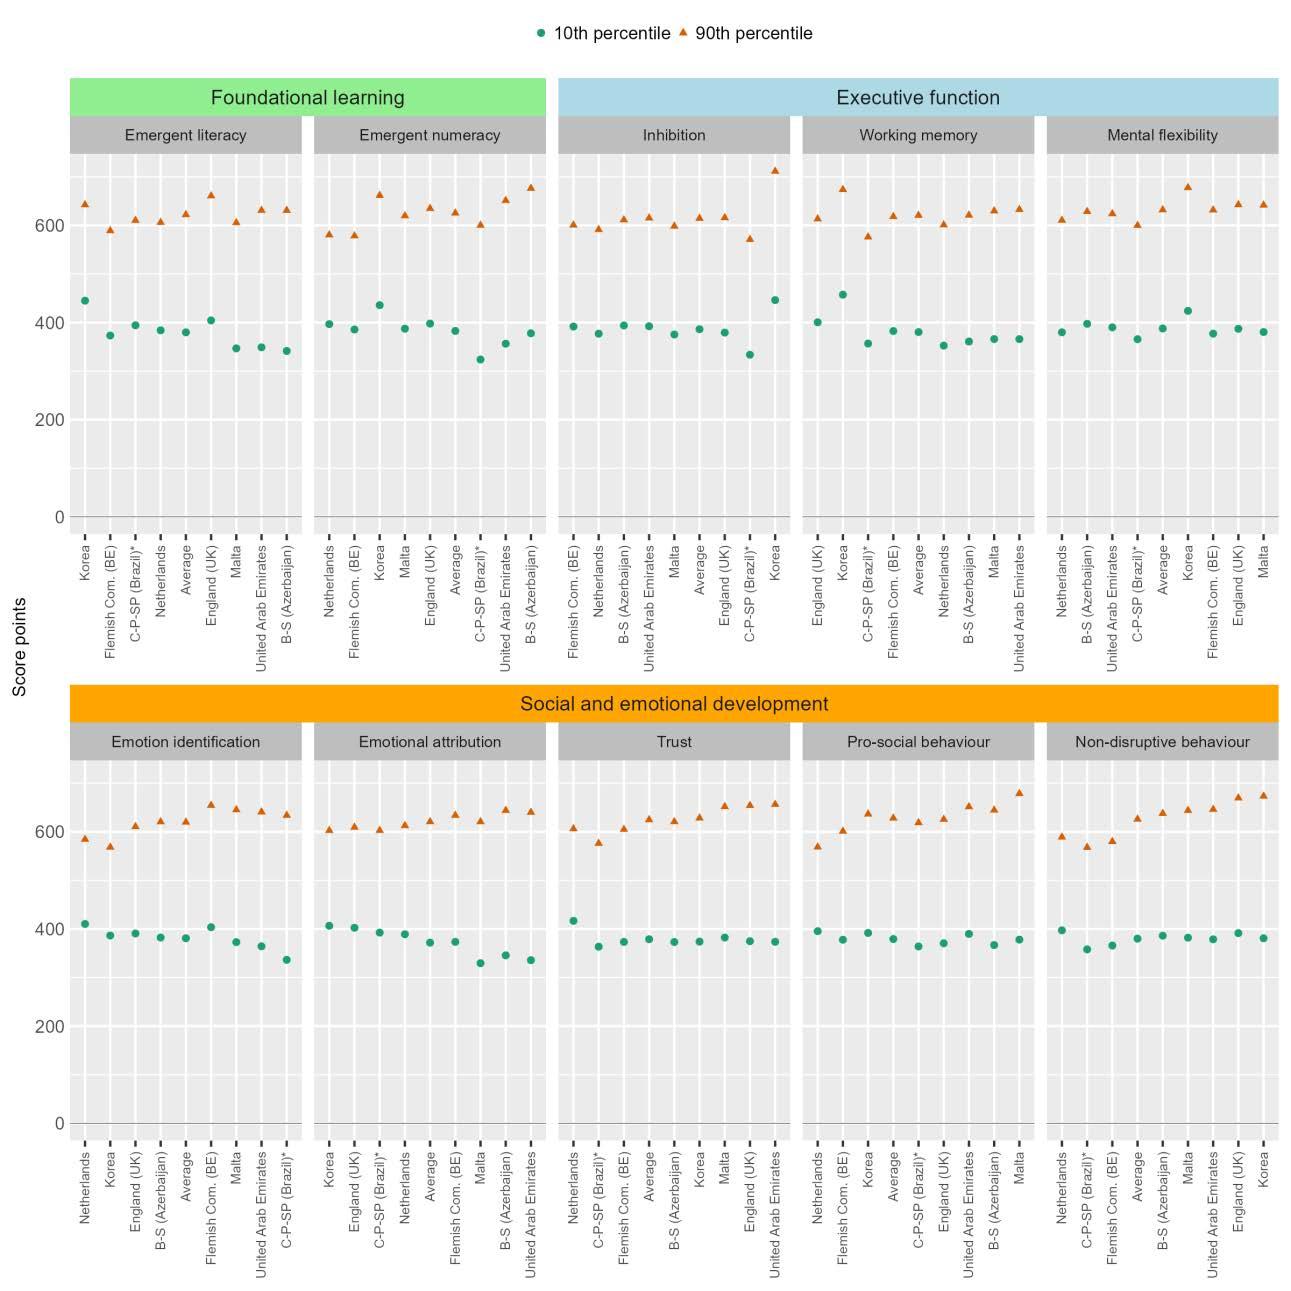
Note: *Estimates for Brazil correspond to averages across the 3 participating Brazilian states. For more information, see the IELS 2025 Technical Report (OECD, 2026[1]) Jurisdictions are ranked in ascending order of the difference in scores between the 90th and 10th percentiles of their performance distribution.
Source: OECD, IELS 2025 Database, Tables B.3.1, B.3.2 and B.3.3
Children learn and develop rapidly during their early years. Age differences in early learning and development outcomes primarily reflect naturally occurring increases in children’s abilities, driven by cognitive and physical maturation processes that start from conception and continue into the pre-school years (Brown and Jernigan, 2012[3]) (Figueroa and An, 2016[4]). Differences in scores by month of age between ages 5 and 6 provide an estimate of the rate of expected learning and developmental progressions and help examine whether gaps between younger and older children vary across the three dimensions of early learning and development assessed by IELS.
Results in Figure 3 2 show that children’s scores in early learning and development outcomes increase as children grow from age 5 to age 6. However, the gains associated with age are not consistent across outcomes. The increase is most pronounced in the domains of emergent numeracy and inhibition, with scores increasing by approximately 70 score points over this age range on average across jurisdictions. In emergent literacy, working memory and mental flexibility, the average increase ranges from 43 to 58 score points. By contrast, scores raise more moderately in the social and emotional development dimension, particularly in the domains of trust, pro-social behaviour, and non-disruptive behaviour, where the average increase is between 15 and 20 score points and where scores level off or decrease slightly between 5 years and 10 months and 6 years of age. Gains in emotion identification and emotional attribution are more similar to those observed in the foundational learning and executive function domains, with average increases of 42 and 32 score points, respectively.
Variation in children’s outcomes by month of age is not consistent across jurisdictions. In England (United Kingdom), score differences between younger and older children are larger than international averages across all domains of assessment. In the foundational learning and executive function dimensions, these differences are also large among children in the Netherlands while small among children in Baku and Sumgait (Azerbaijan), Ceará, Pará and São Paulo (Brazil) and Malta, relative to international averages. Across other jurisdictions, the size of age differences varies by domain, without displaying a clear pattern (Tables B.3.5 and B.3.6). In the social and emotional development domains of emotion identification and emotional attribution, these age differences are also large among children in the United Arab Emirates and the Flemish Community (Belgium), whereas they are small among children in Baku and Sumgait (Azerbaijan), Ceará, Pará and São Paulo (Brazil) and Korea. However, in indirectly assessed domains, differences between jurisdictions tend to be narrow (Table B.3.7).
Figure 3.2. Age differences in early learning and development between ages 5 and 6
Mean scores in foundational learning, executive function, and social and emotional development domains by month of age of five-year-olds
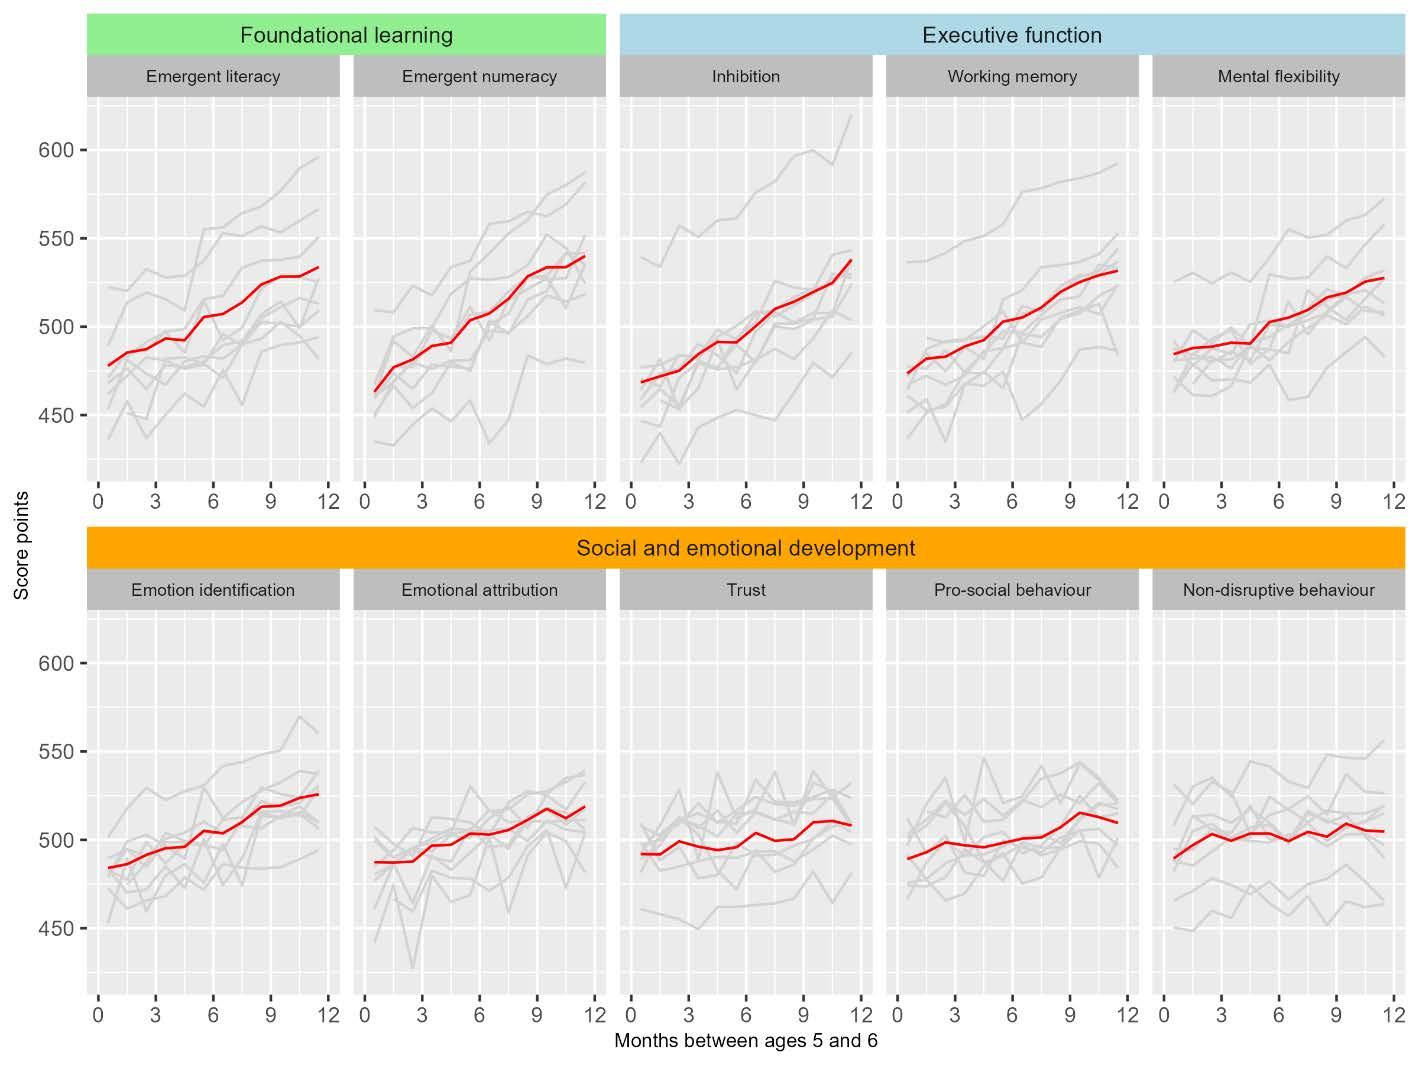
Note: Estimates exclude children younger than 5 years and older than 6 years, who represent less than 4% of children in IELS 2025 samples, on average across jurisdictions. Red lines correspond to the IELS average, and grey lines to jurisdictions. *Estimates for Brazil correspond to averages across the 3 participating Brazilian states. For more information, see the IELS 2025 Technical Report (OECD, 2026[1])
Source: OECD, IELS 2025 Database, Tables B.3.5, B.3.6 and B.3.7
The early learning and development outcomes of five-year-olds in IELS 2025 vary widely, and that variation can be broken down into differences at the child, ECEC centre/school and jurisdiction levels. This decomposition analysis builds on the design of IELS, which samples participating children through ECEC centres/centres (see the Reader’s guide)3. Identifying the relative share of different components of the overall variation in children’s outcomes can provide valuable policy insights. If a large share of the variation is attributable to differences in performance between jurisdictions, this suggests that their system-level characteristics (e.g. economic and social conditions, early years policies) strongly influence children’s outcomes. Likewise, if differences between ECEC centres/schools account for a large share of the overall variation in outcomes within a jurisdiction, then differences in their characteristics are important for policy to consider.
Ensuring consistently high quality through ECEC centres/schools is a major challenge for any education system. Within a jurisdiction, performance differences between early education settings may be attributable
to how general features of ECEC systems (e.g. governance and funding models) or specific quality standards (e.g. curriculum frameworks, staff-to-child ratios, qualification requirements for ECEC teachers) apply to different segments of the system (OECD, 2025[5]). Performance differences can also result from the socio-economic composition of settings, which in turn may reflect factors such as residential segregation, and thus from disparities in the resources that ECEC centres/schools and the families that they serve can mobilise. In this vein, the share of the variation in outcomes occurring between ECEC centres/schools, rather than within them, can be seen as a proxy measure for the variation in the quality of provision between ECEC centres/schools as well as for the concentration of socio-economic disadvantage across settings. Recent data from TALIS Starting Strong 2024 show that pre-primary ECEC centres with very small and large shares of children from socio-economically disadvantaged homes coexist in many countries (OECD, 2025[6])
In IELS 2025, about 6% of the variation in foundational learning composite scores, 13% of the variation in executive function composite scores, and 2% of the variation in social and emotional development composite scores is linked to average differences in children’s scores between participating jurisdictions. These results indicate that system-level contextual characteristics influence children’s outcomes, while also implying that most of the variation in children’s outcomes occurs within jurisdictions, rather than between them.
Figure 3.3 shows the share of this within-jurisdiction variation in outcomes that, in turn, occurs between ECEC centres/schools in IELS 2025. On average across jurisdictions, 36% of the variation in foundational learning composite scores, and 22% of the variation in both executive function composite scores and social and emotional development composite scores is attributable to performance differences between ECEC centres/schools. This suggests that the characteristics of ECEC centres/schools play an important role in explaining children’s early learning and development outcomes. This includes system or institutional factors relating to the quality of ECEC and early schooling (see Chapter 6), as well as the extent to which children are concentrated in different centres/schools according to their socio-economic background. Across the three dimensions of early learning and development, the between-centres/schools percentage of variance in outcomes is strongly correlated (with coefficients in the range of .50 to .67) with the share of variation in socio-economic status at the centre/school level (Table B.3.8).
Importantly, the average variance split in Figure 3 3 masks substantial differences between jurisdictions. Across the three dimensions of early learning and development, the share of between-ECEC centres/schools variation in children’s scores is systematically larger than the IELS average in Baku and Sumgait (Azerbaijan), Ceará, Pará and São Paulo (Brazil) and the United Arab Emirates, accounting for instance for between 45% and 65% of the variation in foundational learning composite scores. These are the three jurisdictions with more variation in the socio-economic composition of centres/schools in IELS 2025. By contrast, the share of variance in outcomes between ECEC centres/schools is smallest, across the three dimensions, in England (United Kingdom) and the Netherlands, two jurisdictions where five-yearolds attend the final years of ECEC in school-based settings, and with comparatively low variation in the socio-economic makeup of these settings. Differences between jurisdictions in Figure 3 3 are therefore likely to reflect the heterogeneity that exists within them in both the quality of ECEC/schools and the socioeconomic composition of ECEC centres/schools. Meanwhile, most of the within-jurisdiction variation in children’s outcomes remains attributable to differences in children’s characteristics, including their individual backgrounds and home environments. Subsequent chapters in the report explore those factors.
Figure 3.3. Share of variation in early learning and development outcomes occurring between ECEC centres or schools
Percentage of within-jurisdiction variation in composite scores in foundational learning, executive function and social and emotional development attributable to differences in outcomes between ECEC centres/schools
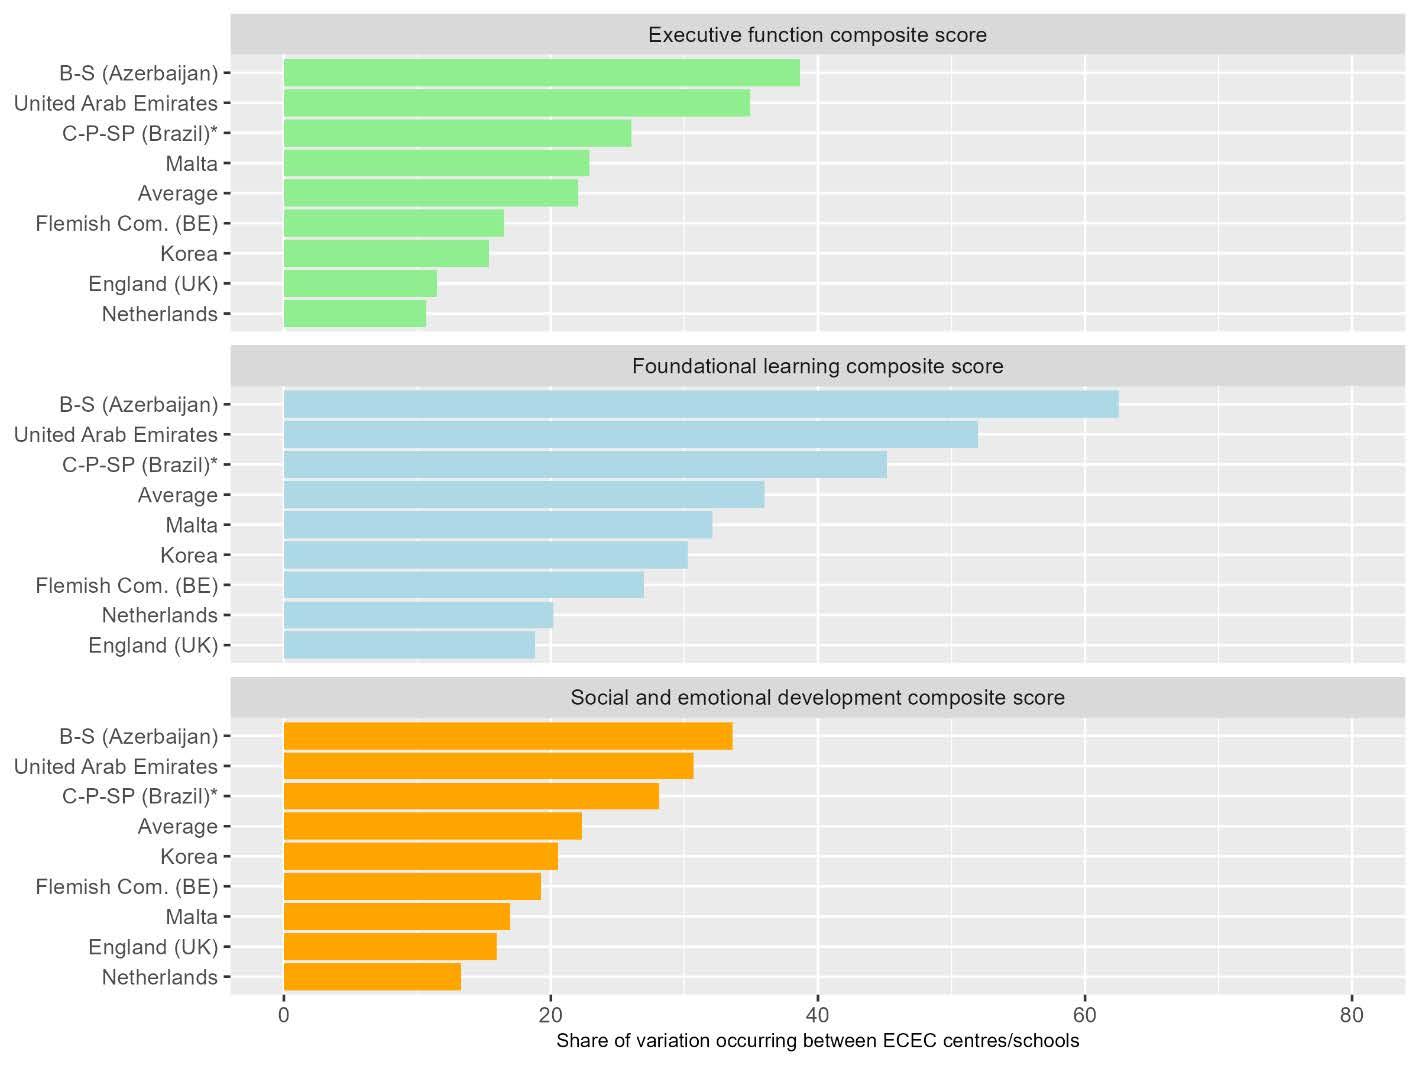
Note: The variance decomposition analysis between vs. within ECEC centres/schools is based on a two-level regression model (i.e. child and ECEC centre/school levels), with normally distributed residuals, and estimated through maximum likelihood. *Estimates for Brazil correspond to averages across the 3 participating Brazilian states. For more information, see the IELS 2025 Technical Report (OECD, 2026[1]) Jurisdictions are ranked in descending order of the between-ECEC centre/school variation in composite scores in each area of early learning and development as a percentage of the total variation in these outcomes across jurisdictions.
Source: OECD, IELS 2025 Database, Table B.3.8
Analyses of children’s average outcomes across diverse countries and education systems poses numerous challenges because the social, economic and cultural context of jurisdictions being compared are often very different. Each jurisdiction’s contextual factors provide the background for its specific findings, as these affect the family and the wider social environments in which the five-year-olds included in this study were growing up. For instance, the relative prosperity of some jurisdictions allows them to allocate more funding to early years policies and enrol more children in high-quality ECEC services at an earlier age, whereas others are constrained by a lower national income. For children, opportunities for participating in ECEC and experiencing supportive home environments are limited in high poverty contexts. However, it is not only economic conditions that matter for promoting early childhood outcomes at the
system-level; for instance, the level of education of previous generations also influences the societal context in which young learn and develop. The participating jurisdictions in IELS 2025 differ in scale, economic development, demographic composition and in the features of the early care and education systems and other policies aimed at supporting young children and their families. Annex A presents a selection of statistical indicators and descriptors of basic features of these jurisdictions’ ECEC systems. This information provides context for interpreting the results that are presented in the report.
As an illustration, Figure 3 4 shows the system-level correlation between jurisdictions’ average performance in the foundational learning dimension and the percentage of 25-34-year-olds who had attained tertiary education in 2020 (see Annex A). This population group corresponds loosely to the cohort of parents of the 5-year-olds assessed in IELS 2025. According to this elementary analysis, variation in the share of tertiary-educated young adults would account for 43% of the variation in the foundational learning composite score between jurisdictions. A stronger correlation exists between this contextual indicator and jurisdictions’ average composite scores in executive function (53% of variation), whereas the association with the composite score in the social and emotional development dimension is slightly weaker (30% of variation). The individual-level association between a child’s scores in early learning development outcomes and their parents’ level of education is explored later in the report (see Chapter 5).
Figure 3.4. Proportion of young adults with tertiary education and average performance in foundational learning outcomes
Percentage of 25–34-year-olds with tertiary education in 2020 and average foundational learning composite score of five-year-olds in 2025
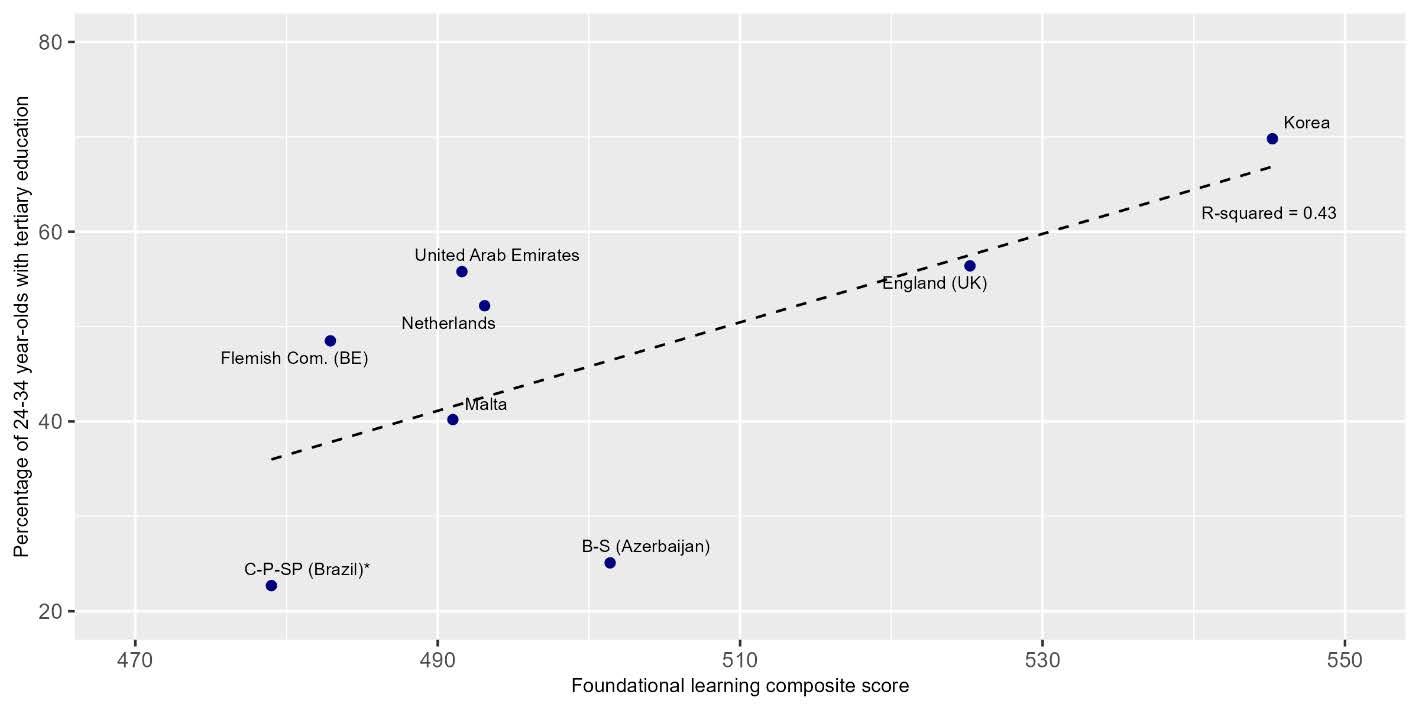
Note: *Estimates for Brazil correspond to averages across the 3 participating Brazilian states.
Source: Annex A and OECD, IELS 2025 Database, Table B.3.1
IELS 2025 not only provides children’s scores in 10 different domains of early learning and development but also information on the perceptions that their parents and ECEC/school teachers have about children’s skills (see Chapter 2). This enables IELS to compare information from direct and indirect assessments and
also gauge children’s skills across a broader scope of areas, based on the competences and behaviours that parents and teachers observed at home or at the ECEC centres/schools that children attend. Research documents moderate correlations between assessments of children’s early learning and development outcomes and adult reports of children’s developmental competencies, with the concordance generally being higher regarding early literacy and early numeracy skills than executive function and self-regulation skills (Li, Rao and Gong, 2026[7])
In IELS 2025, parents and ECEC/school teachers reported on how children were developing regarding cognitive and motor skills and social and emotional skills, while teachers reported also about children’s global capabilities. This information was used to construct three indices summarising the perceptions from familiar adults, using an IRT estimation method consistent across contextual and outcomes measures (see the Chapter 2 and the IELS 2025 Technical Report (OECD, 2026[1])).
Correlations between assessments and parent and ECEC/school teacher perceptions about children’s skills
Table 3 3 presents the international averages for correlations between assessed early learning and development outcomes and parents’ and ECEC/school teachers’ perceptions of children’s skills. Correlations of children’s scores in foundational learning and executive function domains and in the two directly assessed domains of social and emotional development are stronger with the index of global capabilities than with the rest of measures based on adult reports. This index synthetises information from teachers about children’s ability to complete a series of tasks involving emergent literacy or emergent numeracy commonly encountered in early education settings (e.g. sort a group of objects by shape, size or colours; count in multiples; speak using multiple sentences to explain something) – as well as tasks related to empathy (e.g. draw inferences about how a character felt after listening to a story). Substantial correlations also exist between the teacher-based indices of cognitive and motor skills and of socioemotional skills, on the one hand, and children’s scores in the indirectly assessed domains of trust, prosocial behaviour and non-disruptive behaviour, on the other, a result that is likely explained by both sets of measures being based on reports from ECEC/school teachers.
Overall, across the three dimensions, parents’ perceptions about children’s skills appear less consistent with children’s scores than those of teachers, as indicated by lower correlations.
Table 3.3. Correlations between assessed early learning and development outcomes and parent and teacher perceptions of children’s skills
Average correlation coefficients across jurisdictions
and ECEC teacher perceptions
Parent indices
Teacher
Note: All coefficients are statistically significant at the 5% level (p<.05). The term ECEC/school teacher is shorthand for the person completing the Staff questionnaire (see the Reader’s guide). For more information on indices based on parent and ECEC teacher reports, see Chapter 2 and the IELS 2025 Technical Report (OECD, 2026[1])
Source: OECD, IELS 2025 Database.
For young children, the different dimensions of their early learning and development are inter-related and mutually reinforcing. Notwithstanding the positive correlations extensively documented between these dimensions, research continues to explore potential trade-offs between different types of skills – based, for instance, on concerns about the relative balance between direct instruction and play in early education settings (Le et al., 2019[8]) – as well as the dynamics of early skills transfer and co-development (Thijssen et al., 2024[9]) (Hart et al., 2026[10]) (see also Chapter 1). Because IELS data are cross-sectional rather than longitudinal, they cannot illustrate potential skills complementarities or trade-offs over time. However, they provide a unique opportunity to examine how multiple dimensions of early learning and development, and specific domains within these, relate to each other in large samples of five-year-olds internationally.
Across the jurisdictions participating in IELS 2025, the average correlations between children’s composite scores in different dimensions of early learning and development are consistently positive but vary significantly in strength (Figure 3 5). These scores are more strongly correlated between the dimensions of foundational learning and executive function (r=.64), but the associations are weaker with those for social and emotional development (r=.46 and r=.40, respectively).
Within dimensions, a very strong correlation exists between children’s scores in the foundational learning domains of emergent literacy and emergent numeracy (r=.72). In executive function domains, correlations are still substantial, particularly between working memory and mental flexibility (r=.52), but slightly lower with inhibition. In social and emotional development, scores in trust and pro-social behaviour are also very strongly correlated (r=.79), and a more modest association exists between the two empathy-related domains (emotion identification and emotional attribution) and the two behavioural domains (pro-social and non-disruptive behaviours). Notably, though, within this dimension, correlations between children’s scores in directly and indirectly assessed domains are weak.
An important insight from IELS 2025 is that associations between different domains or early learning development are sometimes stronger across rather than within some of its dimensions. For instance, correlations between children’s scores in emergent literacy and emergent numeracy are higher with their scores in working memory and mental flexibility than with scores in inhibition. Meanwhile, scores in emotion identification correlate more closely with scores in most foundational learning and executive function domains than with scores in most other social and emotional development domains.
In some jurisdictions, relationships between performance in different domains deviate significantly from these averages. For instance, the correlation between scores in the foundational learning domains of emergent literacy and emergent numeracy is stronger than the IELS average among children in England (United Kingdom) and the Netherlands, and weaker among children in Ceará, Pará and São Paulo (Brazil). In turn, correlations between scores in executive function domains are stronger than average among children in England (United Kingdom), and weaker among children in Baku and Sumgait (Azerbaijan). In turn, children’s scores in social and emotional development domains are generally more strongly correlated with each other in the Flemish Community (Belgium).
Average correlation coefficients across jurisdictions between children’s scores in foundational learning, executive function and social and emotional development domains
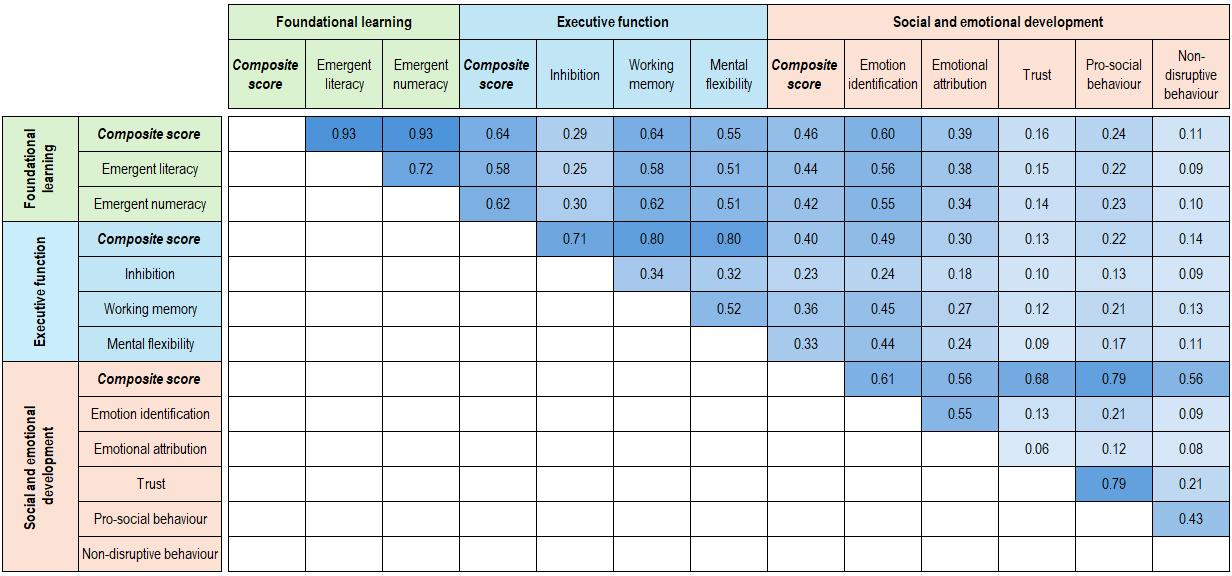
Note: All coefficients are statistically significant at the 5% level. For more information, see the IELS 2025 Technical Report (OECD, 2026[1]) Source: OECD, IELS 2025 Database.
IELS 2025 provides further insights into the early skill sets of young children by enabling an exploration of where five-year-olds stand regarding particular combinations of early learning and development outcomes (Figure 3 6). This analysis suggests a strong similarity in the relative positions of children when the distributions of composite scores of two dimensions of early learning and development are considered together. This means that the majority of children with high or low scores in one area tend to have similarly high or low scores in other areas, and that only a minority of five-year-olds combine relatively strong skills in one dimension with relatively weak skills in others.
On average across jurisdictions, 56% of the five-year-olds in the bottom quarter of the distribution of foundational learning composite scores are also in the bottom quarter of the same distribution in executive function (right-hand side of Figure 3 6). At the other end of the skills range, 57% of the children in the top quarter of the distribution of foundational learning scores are also top scorers in executive function. More generally, more than eight out of ten of these children with either the highest or lowest composite scores in foundational learning are in the upper or lower halves of the performance distribution in executive function, respectively. This implies that the cross-over between relatively high performance in one dimension and relatively low performance in the other is very limited. Nonetheless, almost 40% of children in any of the two intermediate quarters of the distribution of foundational learning scores are in the opposite half of the performance distribution in executive function, which suggests more diverse skill profiles for children with intermediate levels of skills in these dimensions (Table B.3.9).
Children’s positions in the distribution of foundational learning skills are less strongly correlated with their relative level of social and emotional development skills (left-hand side of Figure 3.6). In the bottom quarter of the performance distribution in foundational learning, 49% of children have scores within the same range in social and emotional development, whereas among top performers, this proportion is 44%. Inversely, up to 25% of five-year-olds with the lowest foundational learning composite scores are in the upper half of the performance distribution in social and emotional development, and 28% of the children with the highest
scores in the first dimension are in the bottom half of the distribution in the second dimension (Table B.3.10).
While these results depict only aggregate patterns, as they rely on composite scores and international averages, IELS 2025 data represent an opportunity to extend this analysis to jurisdiction-specific patterns and to particular combinations of specific early learning and development domains, which may yield important insights for ECEC and primary education policies, as well as for early years policies in other sectors. For instance, knowing whether child populations have relatively low levels of skills in a single dimension or domain of early learning and development or in several of those simultaneously can inform the design of both universal policies and of more targeted interventions when the characteristics of children with specific skill sets are identified. Similarly, jurisdictions gaining a better understanding of how the early learning and development outcomes of five-year-olds combine in different areas can use this information to design curricular programmes and pedagogical practices in the early years of primary school.
Distribution of five-year-olds across quarters of the performance distributions of composite scores in foundational learning, executive function and social and emotional development, on average across jurisdictions
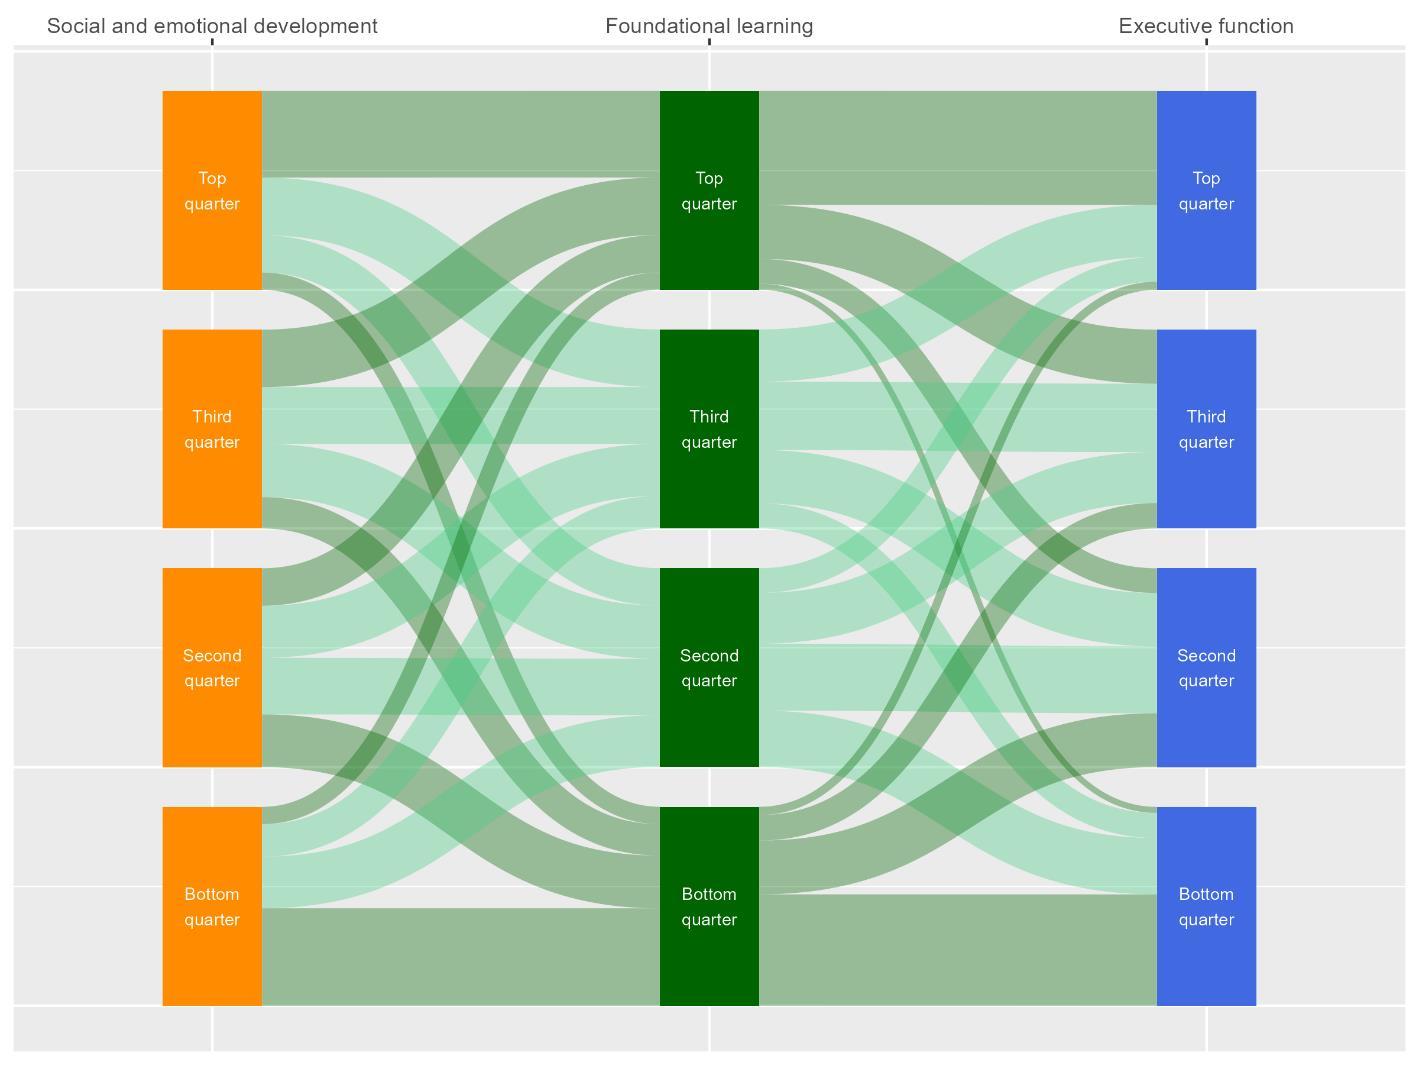
Note: The graph shows the joint distribution of children across quarters of performance distributions. Flows between columns represent the percentage of children in a specific quarter of the distribution of foundational learning composite scores (central column) who are also in different quarters of the distributions of social and emotional development composite scores (flows to the left column) and of executive function composite scores (flows to the right column). For more information, see the Reader’s guide and the IELS 2025 Technical Report (OECD, 2026[1])
Source: OECD, IELS 2025 Database, Table B.3.9 and B.3.10
Table 3.4. How five-year-olds are faring: Chapter 3 figures
Figure Title
Figure 3.1 Inequality in the distribution of early learning and development outcomes
Figure 3.2 Age differences in early learning and development between ages 5 and 6
Figure 3.3 Share of variation in early learning and development outcomes occurring between ECEC centres or schools
Figure 3.4 Proportion of young adults with tertiary education and average performance in foundational learning outcomes
Figure 3.5 Correlations between early learning and development outcomes
Figure 3.6 Early learning and development skill sets of young children
StatLink2 https://stat.link/bgldsv
Brown, T. and T. Jernigan (2012), “Brain Development During the Preschool Years”, Neuropsychology Review, Vol. 22/4, pp. 313-333, https://doi.org/10.1007/s11065-012-92141
Figueroa, R. and R. An (2016), “Motor Skill Competence and Physical Activity in Preschoolers: A Review”, Maternal and Child Health Journal, Vol. 21/1, pp. 136-146, https://doi.org/10.1007/s10995-016-2102-1.
Hart, E. et al. (2026), Using experimental variation to examine the (co-)development of cognitive and social-emotional skills in early childhood, Annenberg Institute at Brown University:, https://doi.org/10.26300/sb70-rd25 (accessed on 25 January 2026). [10]
Le, V. et al. (2019), “Advanced Content Coverage at Kindergarten: Are There Trade-Offs Between Academic Achievement and Social-Emotional Skills?”, American Educational Research Journal, Vol. 56/4, pp. 1254-1280, https://doi.org/10.3102/0002831218813913.
Li, Z., N. Rao and J. Gong (2026), “Concordance between direct assessment and adult report in assessing learning and developmental competencies of young children: A systematic review and meta-analysis”, Early Childhood Research Quarterly, Vol. 74, pp. 253-265, https://doi.org/10.1016/j.ecresq.2025.10.006
OECD (2026), IELS 2025 Technical Report, http://oecd.org/en/about/projects/international-earlylearning-and-child-well-being-study
OECD (2025), Reducing Inequalities by Investing in Early Childhood Education and Care, Starting Strong, OECD Publishing, Paris, https://doi.org/10.1787/b78f8b25-en.
OECD (2025), Results from TALIS Starting Strong 2024: Strengthening Early Childhood Education and Care, TALIS, OECD Publishing, Paris, https://doi.org/10.1787/20af08c0-en.
OECD (2023), PISA 2022 Results (Volume I): The State of Learning and Equity in Education, PISA, OECD Publishing, Paris, https://doi.org/10.1787/53f23881-en [2]
Thijssen, M. et al. (2024), “Cross Productivities of Executive Functions: Evidence from a Field Experiment”, Journal of Human Capital, Vol. 18/4, pp. 563-589, https://doi.org/10.1086/732483 [9]
1 The standard deviations in early learning and development scores summarise variation in outcomes among 5-year-olds within each jurisdiction. These standard deviations were standardised to have an international average of about 100 score points. If a standard deviation is larger than the international average, it indicates that children’s scores vary more from a particular jurisdictions’ mean performance than they vary internationally. A smaller standard deviation means that children’s scores vary less in a jurisdiction than they vary internationally.
2 For each outcome, this is the difference between the 90th percentile of performance (the score above which only 10% of children scored) and the 10th percentile of performance (the score below which only 10% of children scored).
3 This analysis was carried out in two steps. The first step estimated the share of the variation in children’s composite scores between jurisdictions. Of the remaining variation, the second step identified the betweencentre and within-centre variances. Within-centre variation are differences in scores between children attending the same ECEC centres. The sum of the between- and within centre shares represents the total variation in that jurisdiction as a proportion of the IELS average level of variation in performance; that is why the sum of the two bars may exceed or fall short of 100%.
As a window into inequalities in early learning and development, this chapter examines the associations between children’s outcomes in IELS 2025 and their gender and socio-economic, immigration and language backgrounds. It also explores the alignment between gaps in assessed outcomes and parents’ and teachers’ perspectives on children’s skills.
• At age 5, girls outperform boys across the three dimensions of early learning and development measured in IELS 2025. The differences are more pronounced in social and emotional development and less salient in foundational learning. On average across jurisdictions, girls score between 20 and 31 points higher than boys in the domains of emotion identification, emotional attribution, pro-social behaviour and non-disruptive behaviour. Emergent numeracy is the domain where girls’ and boys’ outcomes are most similar. In executive function, differences exist in inhibition and mental flexibility. Gender gaps in favour of girls tend to be larger among children with the weakest performance in the IELS assessments.
• IELS 2025 finds pervasive socio-economic gaps in learning and development outcomes by age 5. These gaps are most substantial in foundational learning: socio-economically advantaged children score on average between 60 and 70 points higher than disadvantaged peers in emergent literacy and emergent numeracy. Socio-economic gaps are smaller in executive function and social and emotional development but remain consistent across all domains.
• Developmentally resilient children achieve strong early learning and development outcomes despite growing up under unfavourable socio-economic circumstances. On average across jurisdictions, about 15% of socio-economically disadvantaged five-year-olds perform strongly in emergent literacy and emergent numeracy. Across executive function and social and emotional development domains this percentage ranges from 15% to 22%.
• Across jurisdictions and assessment domains, gaps in early learning and development between children with and without an immigration background are small compared to other aspects of equity. Differences in outcomes by immigration background are larger and more often statistically significant in foundational learning, but rare in the executive function and social and emotional development. Accounting for socio-economic status and home language reduces both the magnitude and significance of these gaps.
• On average, gaps between children whose primary home language is the same or different differs from the language of assessment are also relatively small and not visible in many jurisdictions after children’s socio-economic status is taken into account. They appear mainly in the foundational learning domains of emergent literacy and emergent numeracy, in the executive function domain of mental flexibility, and in the social and emotional development domain of emotion identification.
• The perceptions of parents and early childhood education and care (ECEC) or school teachers about five-year-olds’ cognitive and motor skills, socio-emotional skills and global skills generally reflect the same socio-demographic gaps that emerge in children’s assessments. Both parents and teachers perceive girls as having stronger skills than boys, and socio-economically advantaged children as having stronger skills than disadvantaged peers. However, ECEC/school teachers’ perceptions of the skills of children with and without an immigration background sometimes go in the opposite direction to gaps in assessments.
The jurisdictions participating in IELS 2025 vary markedly in their economic development, demographic profiles and social protection systems, resulting in differences in the levels of resources and opportunities that public policies can provide to support young children and families (see Annex A). However, most of the variation in five-year-olds’ early learning and development outcomes lies within rather than between jurisdictions (see Chapter 3). This highlights the importance of children’s individual and family characteristics in shaping the distribution of outcomes across child populations
This chapter describes how variation in children’s early learning and development differs according to gender, socio-economic status, and immigration and language backgrounds. The chapter considers these factors as central components of children’s social identities (i.e. who children are), while subsequent chapters examine the influences of home environments (i.e. what parents do) (Chapter 5) and early education and care services (i.e. what early education systems do) (Chapter 6).
In this chapter, socio-demographic gaps in early learning and development outcomes are examined through an equity lens. To a significant extent, these gaps are socially conditioned rather than naturally occurring (as, for instance, age-related gaps) and can therefore represent important policy targets. By adopting an equity lens, IELS views early skill development and the distribution of early learning and development outcomes as shaped by social contexts and influenced by “circumstances” that children themselves cannot control, for example, their gender, socio-economic status, race or ethnicity, immigrant background, family structure or place of residence. From this perspective, more equitable early years systems are those that succeed in reducing the influence and minimising any adverse impact of these circumstances on children’s early learning and development.
Gender is an important dimension for understanding children’s early learning and development. Nonetheless, the relationship between a child’s gender and their early skills is neither univocal nor biologically determined. The size and direction of gender differences in skills can change as children grow older, since the relationship is moderated by other factors, chiefly the social environments in which children live (Etchell et al., 2018[1]) (Eliot et al., 2021[2])
Research suggests that gender-related differences exist in the pace of skill development in early childhood with female children having, on average, stronger early language and communication abilities, as well as an advantage in social and emotional skills, compared to male children, whereas the direction of gaps in motor skills development often vary between fine (in favour of girls) and gross (in favour of boys) (Eriksson et al., 2011[3]) (Rinaldi et al., 2021[4]) (Bando et al., 2024[5]). Yet, while maturational differences between male and female children can drive gaps in their early skill development, the magnitude of these gaps changes across social and cultural contexts, which indicates that other factors are also at play.
Gender-differentiated parenting is another potential influence on gender gaps in early learning and development. The time and activities that mothers and fathers engage in with their children can vary depending on the gender of the child; at the same time, children’s gender-differentiated behaviours can induce parents to treat boys and girls differently, with either of these channels resulting in varying types of interactions, including differential vocalisation, displays of affect, play or compliance (Raley and Bianchi, 2006[6]) (Morawska, 2020[7]). For instance, the fact that girls and boys reach pretend‐play milestones at different times and exhibit differential development in fine and gross motor skills is likely to reflect sociocultural expectations and practices about how each gender is encouraged to play (Ertem et al., 2018[8]) (Dinkel and Snyder, 2020[9])
In IELS 2025, the even gender distribution of all jurisdictions’ samples allows robust comparisons regarding the skills development of boys and girls by age 5 (Table B.4.1).
Girls outperform boys across the three dimensions of early learning and development measured in IELS 2025, with differences being most pronounced in social and emotional development and least visible in foundational learning (Figure 4 1). On average across jurisdictions, girls’ scores are between 20 and 31 points higher than boys’ scores in emotion identification, emotional attribution, pro-social behaviour and non-disruptive behaviour, and 14 points higher in trust. Compared across jurisdictions, gaps in this dimension tend to be largest among children in England (United Kingdom) and smallest among children in Baku and Sumgait (Azerbaijan). In other jurisdictions, their size varies inconsistently across domains.
Both the prevalence and magnitude of gender gaps are smaller in executive function. Across the three domains in this dimension, the average gap in favour of girls is about 10 points across jurisdictions; however, in both inhibition and working memory, the differences between girls’ and boys’ scores are not statistically significant in half or more of the jurisdictions. Gender gaps in executive function domains are largest among children in Korea and the United Arab Emirates.
In foundational learning domains, statistically significant gaps in emergent literacy are only visible among children in the Netherlands, Ceará, Pará and São Paulo (Brazil) and the United Arab Emirates, with a size of around 10 points, and in England (United Kingdom), where the gap reaches 18 points. Emergent numeracy is the domain in which five-year-old girls and boys have the most similar scores, with significant differences observed only among children in the United Arab Emirates (in favour of girls) and in Korea (in favour of boys).
It is also important to examine gender gaps at the extremes of the performance distribution because the average spread of scores is greater among boys than girls in most of the early learning and development domains assessed in IELS This can be done by comparing the average scores in the lowest- and highestperforming 10% of girls and boys within each jurisdiction. This comparison shows that gender gaps, always in favour of girls, are generally larger among children with the weakest performance in the IELS assessments. This pattern holds among children in many jurisdictions in the social and emotional development domains of emotion identification and emotional attribution; in the two foundational learning domains of emergent literacy and numeracy; and in the executive function domains of working memory and mental flexibility, and more commonly in the jurisdictions where the average gender gaps are larger. By contrast, across all three dimensions, differences between the highest-performing girls and boys tend to be smaller and less often statistically significant than gaps for those with an average performance (Tables B.4.2, B.4.3 and B.4.4).
Score-point differences between girls and boys in mean scores of foundational learning, executive function, and social and emotional development domains
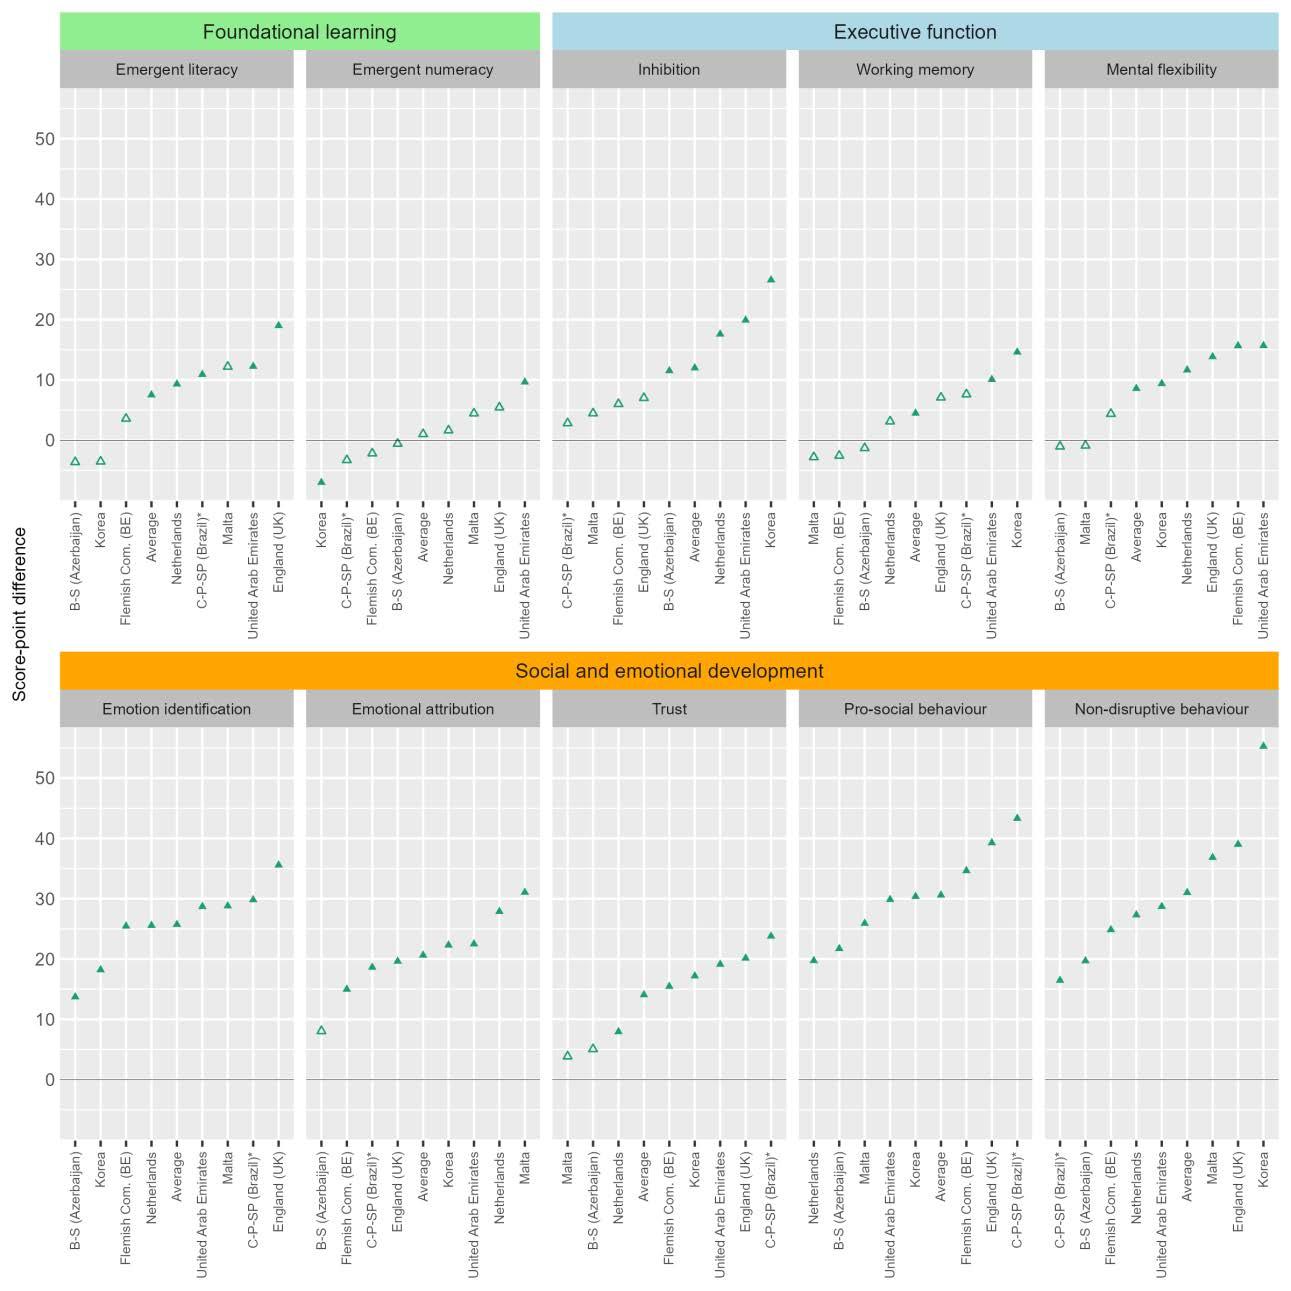
Note: *Estimates for Brazil correspond to the average across the three participating states. Gaps calculated as girls’ mean scores minus boys’ mean scores Solid triangles indicate statistically significant differences. For more information, the IELS 2025 Technical Report (OECD, 2026[10]) Jurisdictions are ranked in ascending order of the size of the gap for each domain
Source: OECD, IELS 2025 Database, Tables B.4.2, B.4.3 and B.4.4
Parent and ECEC teacher perspectives on the skills of five-year-old girls and boys
Differences in the perceptions of parents and teachers about the skills of male and female 5-year-olds align with the gender gaps observed in their assessment scores (Table 4 1). Across all the jurisdictions in IELS 2025, significant gender differences emerge in parent and ECEC teacher ratings of children’s
cognitive and motor skills as well as social and emotional skills: in general, both parents and ECEC teachers perceive girls as having stronger skills than boys. However, differences between boys and girls in the scale of global capabilities (from teachers only) are smaller and not statistically significant in Baku and Sumgait (Azerbaijan), England (United Kingdom), Korea, Malta and the Netherlands. Overall, results suggest a high degree of consistency between the gender gaps observed in children’s assessments and parents’ and teachers’ reports about children’s skills.
Tests of statistically significant differences in indices of parent and ECEC staff perspectives between girls and boys
Parent perspective
Jurisdiction
Baku, Sumgait (Azerbaijan)
Cognitive and motor skills index
Socioemotional skills index
Cognitive and motor skills index
Teacher perspective
Socioemotional skills index
Global capabilities index
Consistency with gaps in assessments
Intermediate Ceará, Pará, São Paulo (Brazil)* High England (United Kingdom) High Flemish Community (Belgium) High Korea High
Malta Intermediate Netherlands High
United Arab Emirates High IELS 2025 average High Regional results
Abu Dhabi (United Arab Emirates)** High
Note: OECD members are listed in black font. Partner countries/economies are listed in blue font. Sub-national jurisdictions are listed in italics. *Estimates for Brazil correspond to the average across the three participating states. **IELS Adjudicated Region. Blue (grey) shading indicates that girls are perceived as having stronger (weaker) skills than boys. White shading indicates a lack of statistically significant differences. Results based on parent and ECEC staff contextual indices. For more information, see the IELS 2025 Technical Report (OECD, 2026[10]) Consistency ratings based on the number of indices where differences show the same sign as differences in assessments. Jurisdictions are ranked in alphabetical order
Source: OECD, IELS 2025 Database, Table B.4.5
Socio-economic status is a concept widely used in social and educational research to capture an individual’s access to family resources (i.e. economic, social and cultural forms of capital) and the relative social and economic position of an individual or household (Cowan et al., 2012[11]) (Avvisati, 2020[12]) Families’ socio-economic status strongly influences children’s health, cognitive and socio-emotional development from before birth into adulthood, through a range of mechanisms that include differences in time and material investments, parenting practices, and stress exposure (Bradley and Corwyn, 2002[13]) (Duncan, Magnuson and Votruba‐Drzal, 2015[14]).
In IELS, a child’s socio-economic background is measured by an index combining information about their parents’ highest levels of education and occupational status and about the household’s income, all collected through the Parent questionnaire. This report relies on the IELS index of socio-economic status derived from Item Response Theory (IRT) (see the Reader’s guide and the IELS 2025 Technical Report (OECD, 2026[10])). The index enables comparisons between children with different socio-economic profiles. In this report, five-year-olds are considered socio-economically advantaged if they are among the 25% of
children with the highest values on the index in their jurisdiction, and socio-economically disadvantaged if they are among the 25% with the lowest values.
While the index is centred within each jurisdiction to a mean of zero, its standard deviation can vary and serve as a proxy of the variation in children’s socio-economic conditions within each of the IELS 2025 national samples. According to this measure, the extent of variation in socio-economic status is largest among children in England (United Kingdom), the Flemish Community (Belgium) and Malta, and lowest among children in Korea (Table B.4.1).
In IELS 2025, children’s socio-economic background accounts for a small but non-negligible share of the variation in their early learning and development outcomes. This system-level socio-economic gradient is more pronounced in the foundational learning dimension, accounting for 7% of the variation in emergent literacy and 9% of the variation in emergent numeracy scores, on average across jurisdictions. This association is strongest in England (United Kingdom), the Flemish Community (Belgium) and the Netherlands and lowest in Baku and Sumgait (Azerbaijan) and the United Arab Emirates. In the executive function and social and emotional development dimensions, however, children’s socio-economic background accounts for a more modest share of the variation in outcomes: below 5% in any of the corresponding domains (Tables B.4.6, B.4.7 and B.4.8).
Another relevant equity indicator is the size of the gaps in outcomes between socio-economically advantaged and disadvantaged children within each jurisdiction. Across dimensions of early learning and development, these gaps consistently favour five-year-olds from families with a high socio-economic status (Figure 4.2). IELS 2025 provides unequivocal evidence that differences in children’s learning and development related to socio-economic inequalities are already visible and sizeable by age 5.
Socio-economic gaps are most substantial in foundational learning domains. On average across jurisdictions, socio-economically advantaged children score 61 and 67 points above disadvantaged peers in the emergent literacy and emergent numeracy domains, respectively. These differences are smaller among children in Ceará, Pará and São Paulo (Brazil), and Korea, and larger among children in England (United Kingdom) and the Flemish Community (Belgium). The case of Korea shows that a strong average performance in this dimension is compatible with comparatively small socio-economic gaps.
In the social and emotional development dimension, socio-economic gaps are also smaller than in foundational learning, although relatively large in emotional identification (43 points) compared to the trust, and non-disruptive behaviour domains (in both cases, below 20 score points), on average across jurisdictions. The differences in social and emotional development domains associated with families’ socioeconomic position are also generally smaller among children in Baku and Sumgait (Azerbaijan), Ceará, Pará and São Paulo (Brazil) and Korea, and larger among children in the Flemish Community (Belgium)
Overall, the magnitude of socio-economic gaps in early learning and development across jurisdictions mirrors the degree of variation in children’s socio-economic circumstances, as captured by the standard deviation of the IELS index of socio-economic status (Table B.4.1).
Score-point differences in foundational learning, executive function, and social and emotional development domains between socio-economically advantaged and disadvantaged children
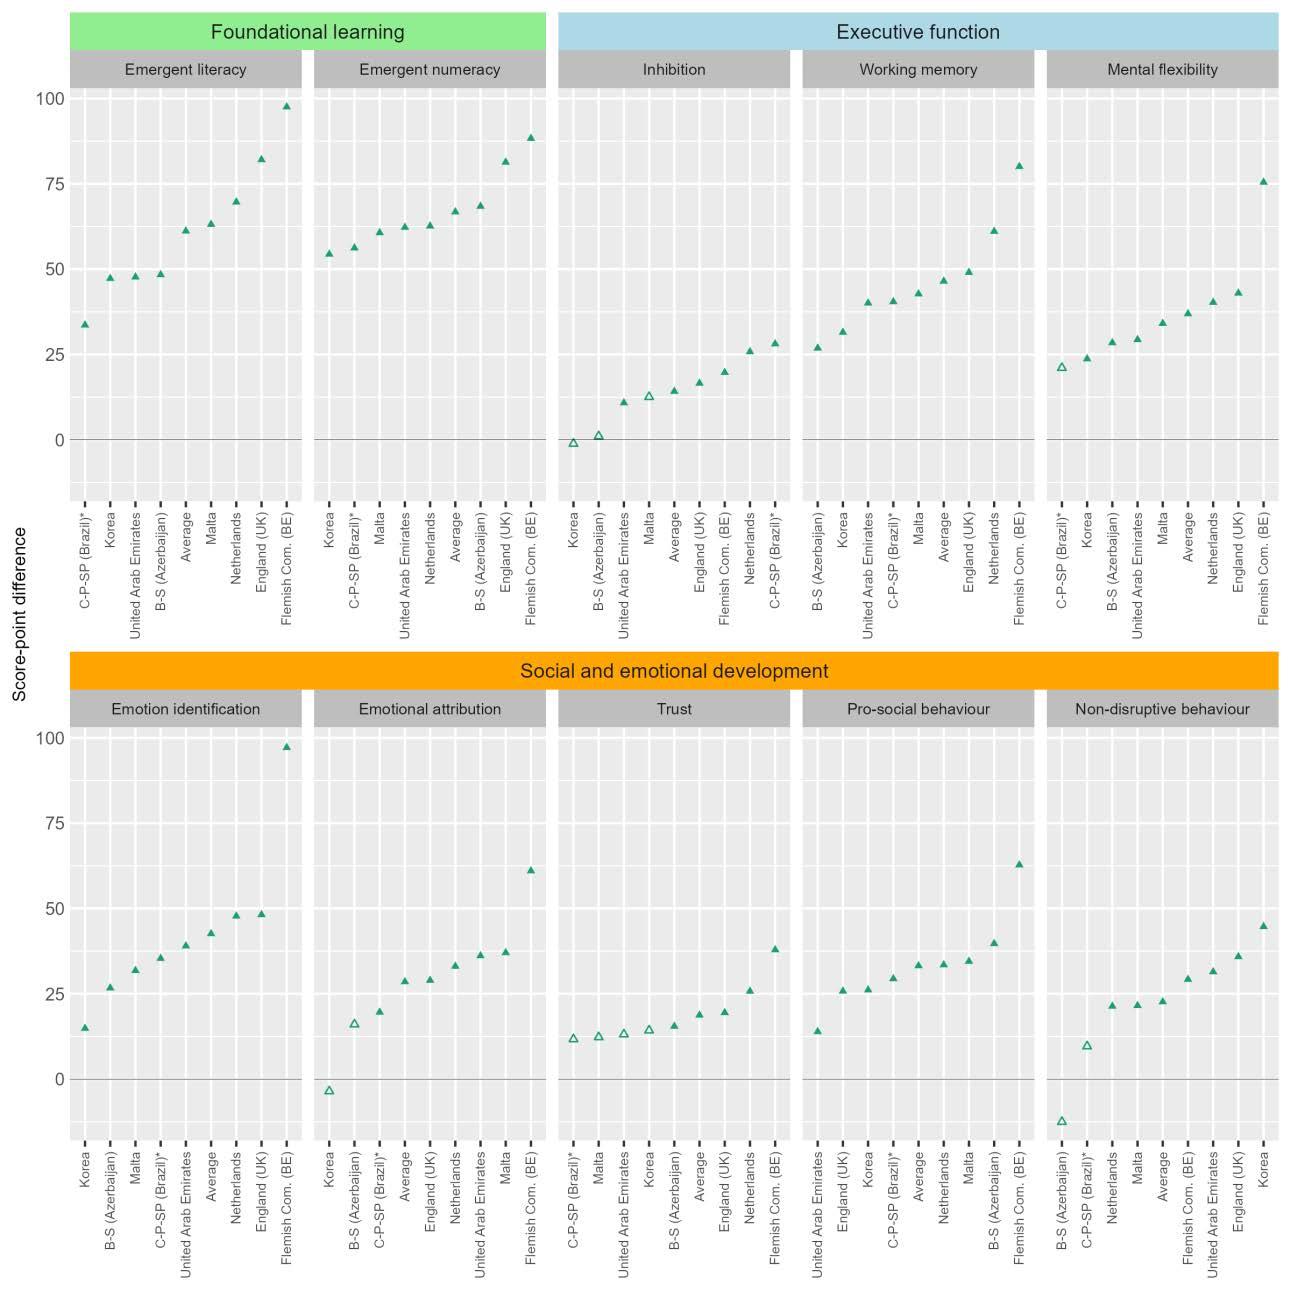
Note: *Estimates for Brazil correspond to the average across the three participating states. Gaps calculated as mean scores of socioeconomically advantaged children minus mean scores of socio-economically disadvantaged children. Advantaged and disadvantaged children are those in the top and bottom quarters, respectively, of the distribution of the IELS index of socio-economic status (SES) within their jurisdiction. Solid triangles indicate statistically significant differences. For more information, see the IELS 2025 Technical Report (OECD, 2026[10]) Jurisdictions are ranked in ascending order of the size of the gap for each domain
Source: OECD, IELS 2025 Database, Tables B.4.6, B.4.7 and B.4.8.
Socio-economic gaps tend to be smaller in executive function domains. On average across jurisdictions, differences in scores between socio-economically advantaged and disadvantaged children amount to 46
points in working memory, 37 points in mental flexibility, and 14 points in inhibition, the domain in which these gaps are smallest across the 10 outcomes assessed by IELS.
Parent and ECEC teacher perspectives about the skills of five-year-olds from different socio-economic backgrounds
The perceptions held by parents and ECEC teachers about children’s skills are systematically associated with their socio-economic backgrounds. Across all the jurisdictions in IELS 2025, socio-economically advantaged children are perceived to have stronger skills than disadvantaged peers as measured by significant differences in the cognitive and motor skills, social and emotional skills and global capabilities indices based on adults’ reports (Table 4 2). While parental perceptions can be heavily conditioned by the socio-economic position they share with their own children, this result holds also for ECEC teachers, who generally encounter children from more diverse socio-economic backgrounds as part of their work in ECEC settings. Overall, the results also suggest a strong consistency between children’s assessments and parents’ and teachers’ perspectives regarding differences in the skills of five-year-olds from different socioeconomic backgrounds.
Table 4.2. Socio-economic gaps in parent and teacher perceptions of children’s skills
Tests of statistically significant differences in indices of parent and ECEC staff perspectives between advantaged and disadvantaged children
Parent perspective
Jurisdiction
Baku, Sumgait (Azerbaijan)
Teacher perspective
Consistency with gaps in assessments Cognitive and motor skills index
Ceará, Pará, São Paulo (Brazil)* High
England (United Kingdom) High
Flemish Community (Belgium)
Korea
Malta
Netherlands
United Arab Emirates
IELS 2025 average
Regional results
Abu Dhabi (United Arab Emirates)**
Note: OECD members are listed in black font. Partner countries/economies are listed in blue font. Sub-national jurisdictions are listed in italics. *Estimates for Brazil correspond to the average across the three participating states. **IELS Adjudicated Region. Blue (grey) shading indicates that socio-economically advantaged children are perceived as having stronger (weaker) skills than socio-economically disadvantaged children. White shading indicates a lack of statistically significant differences. Results based on parent and ECEC staff contextual indices. For more information, see the IELS 2025 Technical Report (OECD, 2026[10]) Consistency ratings based on the number of indices where differences show the same sign as differences in assessments. Jurisdictions are ranked in alphabetical order
Source: OECD, IELS 2025 Database, Table B.4.9
A focus on developmentally resilient five-year-olds
In alignment with other OECD studies, IELS defines developmentally resilient children as those from low socio-economic backgrounds (i.e. in the bottom quarter of the distribution of the index of socio-economic status within their jurisdiction) who nevertheless achieve strong early learning and development outcomes (i.e. whose scores are in the top quarter of the distribution of a domain within their jurisdiction). Given the strong association between socio-economic status and early learning and development, these children are
considered developmentally resilient because they achieve better outcomes in IELS than would be predicted by the relatively unfavourable socio-economic conditions in which they grow up. Within jurisdictions, the percentage of resilient children is another indicator of the extent to which early learning and development are associated with socio-economic status: higher levels of resilience among disadvantaged children can be interpreted as a sign of a weaker relationship between children’s circumstances and outcomes The indicator is also related to the degree of variation in socio-economic conditions within jurisdictions, as captured by the IELS index of socio-economic status.
Percentage of socio-economically disadvantaged children in the top quarter of the performance distribution in foundational learning, executive function and social and emotional development domains in their jurisdiction
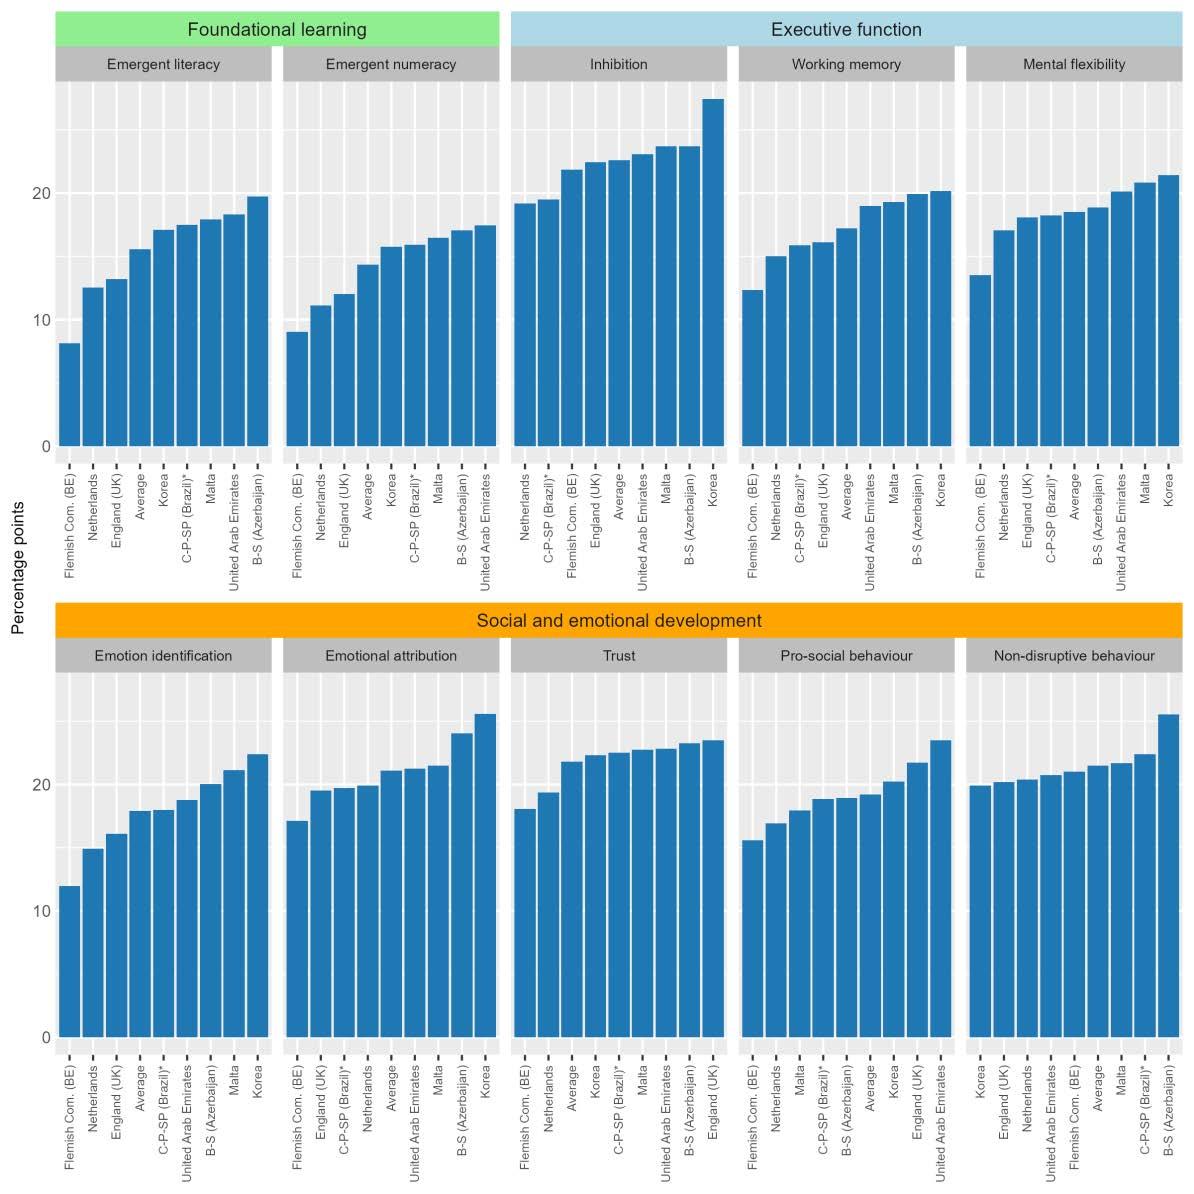
Note: *Estimates for Brazil correspond to the average across the three participating states Developmentally resilient children are those in the bottom quarter of the distribution of the IELS index of socio-economic status (SES) within their jurisdiction, and whose scores are in the top quarter of a domain of assessment within their jurisdiction. For more information, see the IELS 2025 Technical Report (OECD, 2026[10]) Jurisdictions are ranked in ascending order of the percentage of developmentally resilient children in each domain
Source: OECD, IELS 2025 Database, Tables B.4.6, B.4.7 and B.4.8.
Figure 4.3 shows the percentage of developmentally resilient disadvantaged 5-year-olds in each of the 10 domains of assessment in IELS 2025. In the foundational learning dimension, and on average across jurisdictions, around 15% of socio-economically disadvantaged children perform strongly in emergent literacy and emergent numeracy, with variation of close to five percentage points between the jurisdictions with the highest and lowest shares. In both the executive function and social and emotional dimensions, the percentage of resilient disadvantaged children ranges between 15% to 22% across domains. Reflecting the generally smaller social-economic gaps in scores observed in these jurisdictions, developmental resilience tends to be higher among disadvantaged 5-year-olds in Korea, Malta, Baku and Sumgait (Azerbaijan) and Ceará, Pará and São Paulo (Brazil)
Rising international migration is reshaping the makeup of populations worldwide. In 2020, the global number of international migrants reached 281 million, including 36 million children (UNICEF, 2025[15]). By 2022, 145 million people living in OECD countries were born abroad, an increase of 25% over a decade, representing more than 10% of the population in two-thirds of these countries (OECD, 2023[16]) Meanwhile, between 2010 and 2024, the global number of children displaced due to conflict and violence nearly tripled, rising from approximately 17.0 million to 48.8 million (UNICEF, 2025[17])
These trends are also visible in the composition of child populations participating in ECEC. Data from TALIS Starting Strong 2024 show that children with an immigration background represent more than 10% of the children attending over one quarter of pre-primary settings in 11 out of 15 participating entities. In the Flemish Community (Belgium), immigrant children accounted for over 50% of the children in 1 out of 6 settings (OECD, 2025[18]).
Young children with an immigration background often face a range of structural, linguistic, and socio‐cultural disadvantages that can shape their early educational experiences and long-term developmental outcomes. Immigrant children are less likely to access high‐quality early childhood programs due to barriers such as limited programme availability, insufficient bilingual or culturally responsive services, and a lack of institutional outreach tailored to their families, limiting children’s access to early learning and development opportunities (Karoly and González, 2011[19]). Research shows that immigration-related gaps in later educational outcomes are often rooted in skills gaps in the early years (Washbrook et al., 2012[20]) (Becker and Klein, 2021[21])
However, within most countries, immigrants tend to be a highly diverse, rather than uniform, population group. Children with an immigration background vary with regard to their countries of origin, cultural and linguistic traditions, socio-economic circumstances, and the amount of time they have spent in the host country. Intersecting social identities means these children can face a double disadvantage if they are more likely than peers without an immigration background to also experience socio‐economic hardship, compounding the effects of cultural and social barriers (Kruzik et al., 2023[22]). In some cases, though, children with an immigration background come from relatively affluent and educated families. That is why accounting for socio-economic status is critical in examining the relationship between an immigration background and children’s outcomes.
Increasing multilingualism in child populations is one of the major consequences of international migration flows. In some countries, this overlaps with the presence of multiple official languages rooted in longstanding historical and cultural traditions. A limited familiarity with the language used in early education settings can follow for both children with an immigrant background – especially those having arrived recently – and children from local cultural communities where other languages are predominantly spoken.
Given the centrality of language for early learning and development, multilingualism in the early years represents an important consideration for equity. Opportunities for early language development can differ between monolingual and multilingual children, depending partly on how much they are exposed to the majority language in their home environments (Lauro, Core and Hoff, 2020[23]) (Persici et al., 2022[24]) In a shift from deficit- to strength-based approaches to diversity, research increasingly highlights how multilingual children can flexibly draw on their full linguistic repertoire to respond to social and cognitive demands (Bonacina-Pugh, da Costa Cabral and Huang, 2021[25]).
Overall, minimising any potentially adverse impact of children’s immigration or diverse language backgrounds on their early learning and development outcomes is central to promoting equity in the early years and a way of enhancing social cohesion in host communities.
In IELS 2025, children with an immigration background are defined as children having two parents born outside the jurisdiction in which the child participated in IELS (or one parent, in the case where information about only one parent was provided). Among children with an immigration background, a further distinction can be made between first- and second-generation migration, depending on whether only the parents or both the parents and the child were born outside the IELS jurisdiction. Further, children are considered to have a different home language if they primarily speak at home a language other than the language of assessment in IELS. In each participating jurisdiction, the language of assessment was the language of the ECEC centre/school that the child attends1 .
Figure 4.4 shows substantial variation across jurisdictions in the shares of children with an immigration background and children with another home language in IELS 2025. At one extreme, almost 60% of the participating children in the United Arab Emirates come from families with international origins, with more than half being first-generation. Other jurisdictions with notably diverse child populations are England (United Kingdom) and the Flemish Community (Belgium), where about one in four and one in five children, respectively, have an immigration background. In both jurisdictions, the majority of these children are second-generation migrants. The most homogeneous child populations in IELS 2025 are those of Korea, Ceará, Pará and São Paulo (Brazil) and Baku and Sumgait (Azerbaijan), where less than 3% of participating five-year-olds have an immigration background.
Similarly, the prevalence of multilingualism among children in IELS 2025 varies widely across jurisdictions. It is highest in Malta and the United Arab Emirates, where 57% and 31% of children, respectively, primarily speak a language other than the language in which they were assessed in IELS at home. By contrast, in Korea and Ceará, Pará and São Paulo (Brazil) virtually all children speak the same language in their homes and their ECEC centres (Figure 4 4). On average across jurisdictions, more than one in four children have two parents whose first language differs from the language of assessment in IELS 2025. In each jurisdiction, this percentage is higher than that of children speaking primarily another language at home, a result that may be explained by the presence of siblings or the adoption, by these children, of the language used in their ECEC centres/schools (Table B.4.1).
Across jurisdictions, gaps between children with and without an immigration background in the early learning and development outcomes included in IELS 2025 are small compared to other equity gaps, particularly after taking into account children’s socio-economic status and home language. Differences in outcomes by immigration background are larger and more often statistically significant in foundational learning domains, but rare in the executive function and social and emotional development dimensions (Figure 4.5).
In foundational learning, on average across jurisdictions, the mean scores in emergent literacy and emergent numeracy of children with an immigration background are 37 points and 15 points lower, respectively, than those of children without such a background. Once children’s socio-economic and linguistic backgrounds are controlled for, the average adjusted mean difference decreases to 24 points in emergent literacy and disappears in emergent numeracy. These gaps are largest among children in the Flemish Community (Belgium), the Netherlands and England (United Kingdom). In opposition to the general pattern, gaps in emergent numeracy are in favour of children with international origins in Malta and the United Arab Emirates.
In executive function domains, only raw comparisons show differences between five-years-olds with and without an immigration background; these gaps disappear in virtually all cases after other child characteristics are taken into account. In social and emotional development domains, gaps persist in emotion identification and pro-social behaviour but only in a small number of jurisdictions.
Figure 4.4. Children with an immigration background and children with another home language
Percentage of children with a first- and second-generation immigration background, and percentage of children who primarily speak at home a language other than the language of assessment
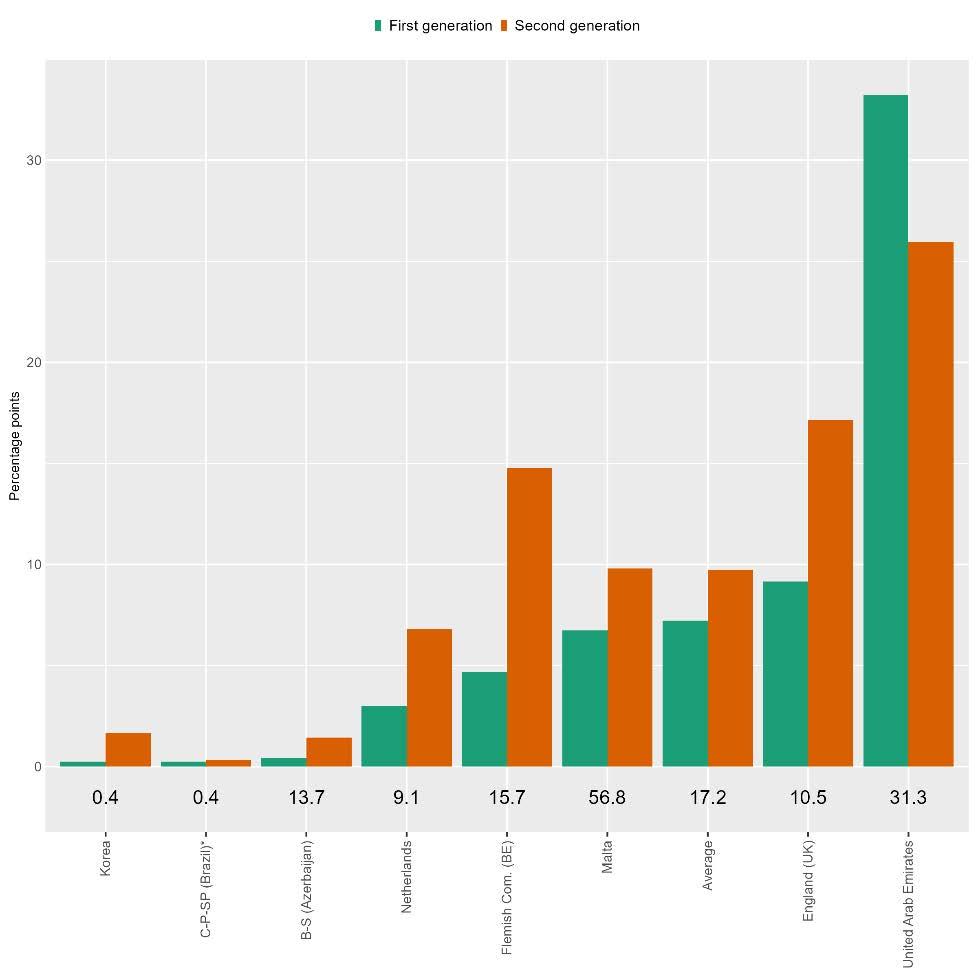
Note: *Estimates for Brazil correspond to the average across the three participating states. First-generation immigration background refers to children born outside their IELS jurisdiction; second-generation immigration background refers to children born in their IELS jurisdiction whose parents were born abroad. Home language refers to the language primarily spoken at home by the child. The percentage of children speaking primarily a language other than the language of assessment appears above jurisdictions’ names. For more information, see the IELS 2025 Technical Report (OECD, 2026[10]) Jurisdictions are ranked in ascending order of the percentage of first-generation immigrant children
Source: OECD, IELS 2025 Database, Table B.4.1
Score-point differences in foundational learning, executive function, and social and emotional development domains between children with and without an immigration background, before and after accounting for socio-economic status and home language
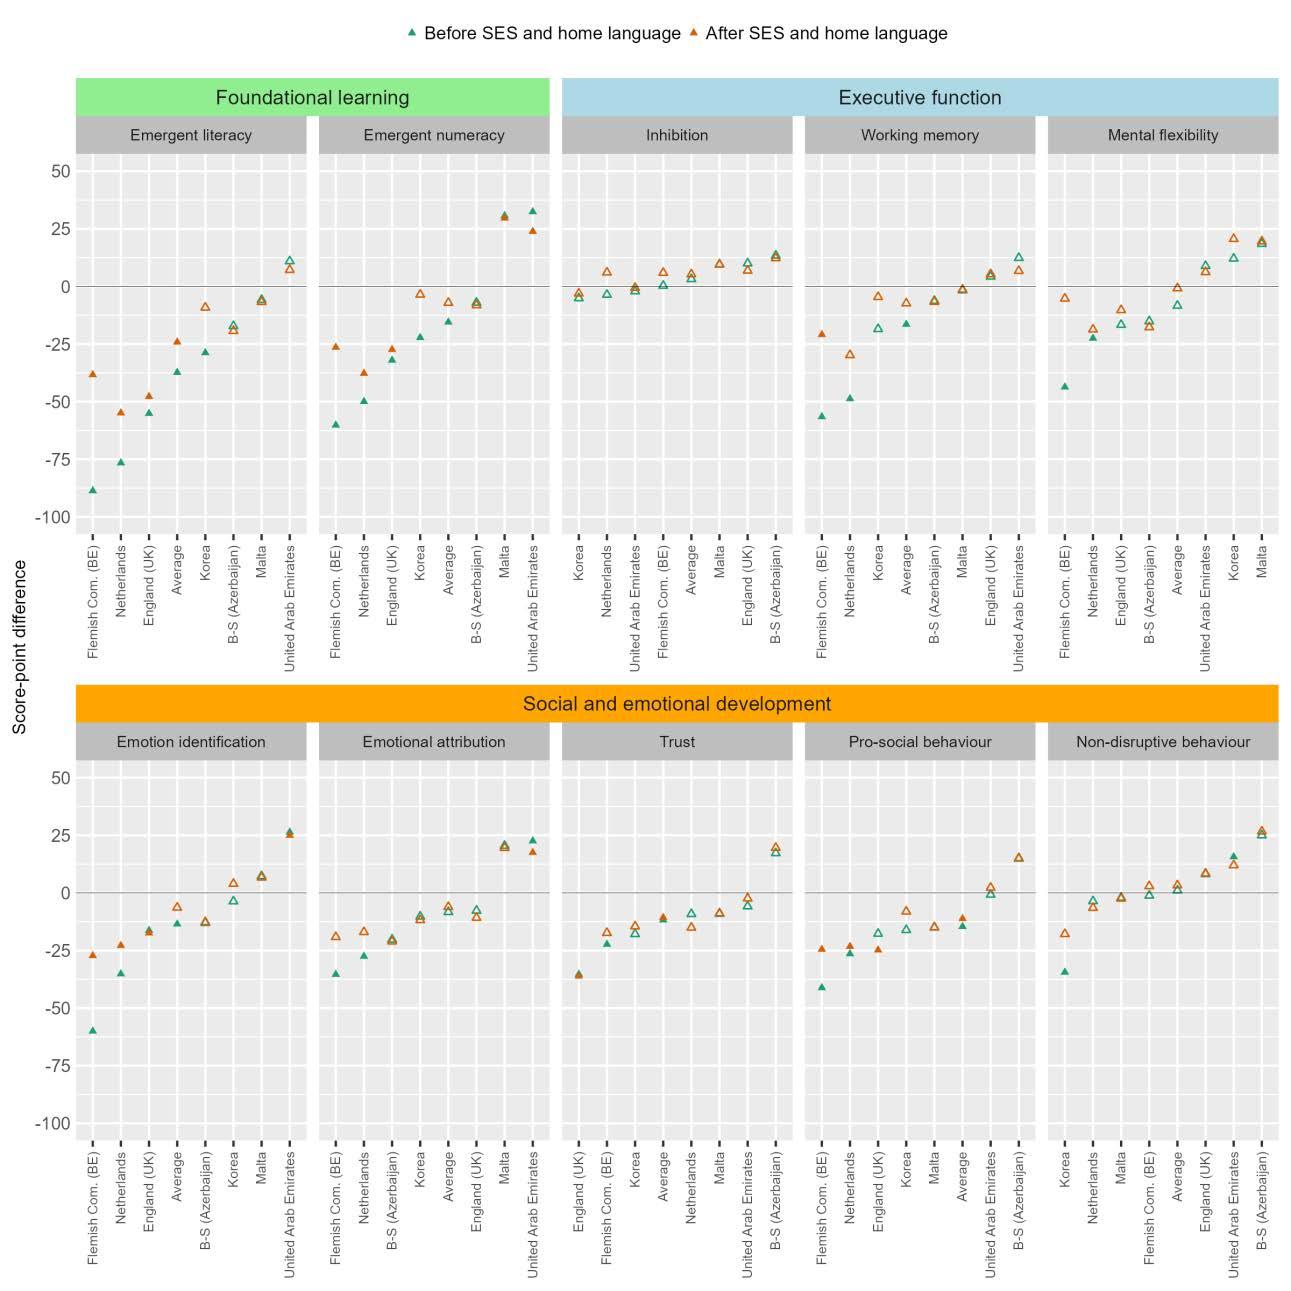
Note: Ceará, Pará and São Paulo (Brazil) excluded due to the small share of children with an immigration background. Gaps calculated as mean scores of children with an immigration background minus mean scores of children without such background. An immigration background refers to having two parents born outside the jurisdiction in which the child participated in IELS. Children’s socio-economic background as measured by the IELS index of socio-economic status (SES). Home language refers to the language primarily spoken at home by the child. Solid triangles indicate statistically significant differences. For more information, see the IELS 2025 Technical Report (OECD, 2026[10]) Jurisdictions are ranked in ascending order of the size of the gap for each domain
Source: OECD, IELS 2025 Database, Tables B.4.10, B.4.11 and B.4.12
Parent and ECEC teacher perspectives about the skills of five-year-olds with and without an immigration background
Contrary to results for gender and socio-economic status, the perceptions of adults concerning the relative level of skills of children with and without an immigration background show are not always aligned with the gaps in IELS 2025 assessments (Table 4.3). When parental views on their children’s skills are compared, non-immigrant children tend to be perceived as having stronger skills than children with an immigration background in most of the jurisdictions with sizeable shares of immigrant children, while the opposite holds in the United Arab Emirates. Parental perceptions are therefore broadly consistent with actual gaps in assessment. However, when this comparison is made based on the views of ECEC teachers, children with an immigration background are generally perceived to have stronger skills than non-migrant children in several jurisdictions, including England (United Kingdom), the Flemish Community (Belgium) and the Netherlands. This is a noteworthy result given that, in these jurisdictions, children with an immigration background tend to have lower scores in several early learning and development domains. This result does not necessarily mean that teachers do not accurately assess the skills of five-year-olds in their ECEC centres/schools. Instead, teachers, who see the learning and developmental progressions of both groups of children, may contextualise their outcomes in relation to children’s immigration status in different ways than parents. For both parents and ECEC staff, differences in perceptions remain largely similar after accounting for children’s socio-economic status and home language.
Table 4.3. Gaps by immigration background in parent and teacher perceptions of children’s skills
Tests of statistically significant differences in indices of parent and ECEC staff perspectives between children with and without an immigration background, after accounting for socio-economic status and home language
Parent perspective
Jurisdiction
Baku, Sumgait (Azerbaijan)
Cognitive and motor skills index
Socio-
Teacher perspective
Global capabilities index
Consistency with gaps in assessments
High
England (United Kingdom) Intermediate
Flemish Community (Belgium) Intermediate
Korea Intermediate
Malta Intermediate
Netherlands Intermediate
United Arab Emirates Intermediate
IELS 2025 average Intermediate Regional results
Abu Dhabi (United Arab Emirates)** Intermediate
Note: OECD members are listed in black font. Partner countries/economies are listed in blue font. Sub-national jurisdictions are listed in italics. Ceará, Pará and São Paulo (Brazil) excluded due to small sample sizes. **IELS Adjudicated Region. Blue (grey) shading indicates that children without an immigration background are perceived as having stronger (weaker) skills than children with an immigration background. White shading indicates a lack of statistically significant differences. Results based on parent and ECEC staff contextual indices. For more information, see the IELS 2025 Technical Report (OECD, 2026[10]). Consistency ratings based on the number of indices where differences show the same sign as differences in assessments. Jurisdictions are ranked in alphabetical order
Source: OECD, IELS 2025 Database, Table B.4.13
Figure 4.6. Differences in early learning and development outcomes, by language spoken at home
Score-point differences in foundational learning, executive function, and social and emotional development domains between children who primarily speak the language of assessment at home and children who primarily speak another language, before and after accounting for socio-economic status
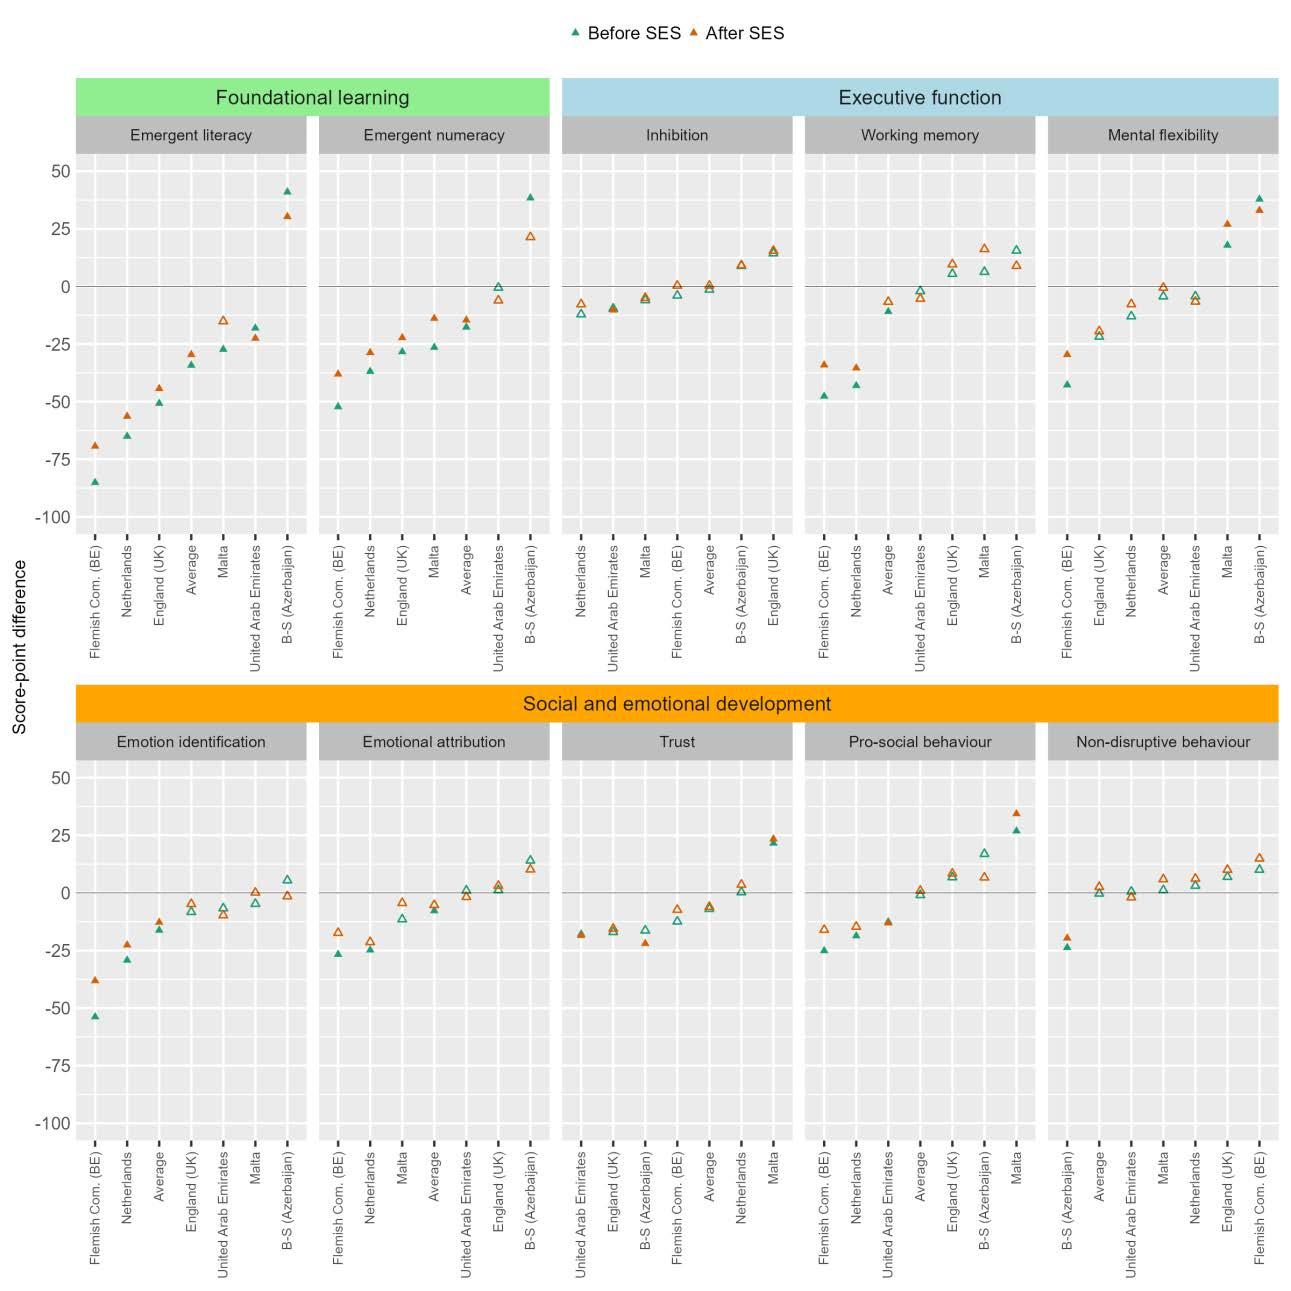
Note: Ceará, Pará and São Paulo (Brazil) and Korea excluded from this analysis due to small sample sizes. Children’s socio-economic background as measured by the IELS index of socio-economic status (SES). Home language refers to the language primarily spoken at home by the child. Differences calculated as mean scores of children speaking primarily another language at home minus mean scores of children speaking primarily the language of assessment at home Solid triangles indicate statistically significant differences. For more information, see the IELS 2025 Technical Report (OECD, 2026[10]) Jurisdictions are ranked in ascending order of the size of the gap for each domain
Source: OECD, IELS 2025 Database, Tables B.4.14, B.4.15 and B.4.16
On average across jurisdictions, the mean scores of children whose primary language at home is different from the language of assessment in IELS 2025 only differ from those of children speaking the same language in the foundational learning domains of emergent literacy and emergent numeracy, and in the social and emotional development domain of emotion identification; in these cases, the score differences range between 13 and 30 points, after accounting for children’s socio-economic status (Figure 4 6). However, few statistically significant differences are observed between the two groups across the remaining domains of assessment. Gaps in favour of children with a different home language are observed only among children in Baku and Sumgait (Azerbaijan) and Malta in some domains, for instance mental flexibility. Unsurprisingly, gaps by home language tend to be largest in emergent literacy, with a 48 point or larger advantage in favour of children speaking the same language at home and in their ECEC centre among children in England (United Kingdom), the Flemish Community (Belgium), and the Netherlands.
Table 4.4. Equity gaps in early learning and development: Chapter 4 figures
Figure Title
Figure 4.1 Gender gaps in early learning and development outcomes
Figure 4.2 Socio-economic gaps in early learning and development outcomes
Figure 4.3 Developmentally resilient five-year-olds
Figure 4.4 Children with an immigration background and children with another home language
Figure 4.5 Gaps in early learning and development outcomes by immigration background
Figure 4.6 Differences in early learning and development outcomes, by language spoken at home
StatLink2 https://stat.link/u29hpi
References
Avvisati, F. (2020), “The measure of socio-economic status in PISA: a review and some suggested improvements”, Large-scale Assessments in Education, Vol. 8/1, https://doi.org/10.1186/s40536-020-00086-x.
Bando, R. et al. (2024), “Gender Differences in Early Child Development: Evidence from LargeScale Studies of Very Young Children in Nine Countries”, Journal of Economics, Race, and Policy, Vol. 7/2, pp. 82-92, https://doi.org/10.1007/s41996-023-00131-1
Becker, B. and O. Klein (2021), “The primary effect of ethnic origin – rooted in early childhood? An analysis of the educational disadvantages of Turkish-origin children during the transition to secondary education in Germany”, Research in Social Stratification and Mobility, Vol. 75, p. 100639, https://doi.org/10.1016/j.rssm.2021.100639
Bonacina-Pugh, F., I. da Costa Cabral and J. Huang (2021), “Translanguaging in education”, Language Teaching, Vol. 54/4, pp. 439-471, https://doi.org/10.1017/s0261444821000173
Bradley, R. and R. Corwyn (2002), “Socioeconomic Status and Child Development”, Annual Review of Psychology, Vol. 53/1, pp. 371-399, https://doi.org/10.1146/annurev.psych.53.100901.135233.
[5]
[21]
[25]
[13]
Cowan, C. et al. (2012), Improving the Measurement of Socioeconomic Status for the National Assessment of Educational Progress, National Center for Education Statistics, https://nces.ed.gov/nationsreportcard/pdf/researchcenter/socioeconomic_factors.pdf (accessed on 15 January 2026).
Dinkel, D. and K. Snyder (2020), “Exploring gender differences in infant motor development related to parent’s promotion of play”, Infant Behavior and Development, Vol. 59, p. 101440, https://doi.org/10.1016/j.infbeh.2020.101440 [9]
Duncan, G., K. Magnuson and E. Votruba‐Drzal (2015), Children and Socioeconomic Status, Wiley, https://doi.org/10.1002/9781118963418.childpsy414
Eliot, L. et al. (2021), “Dump the “dimorphism”: Comprehensive synthesis of human brain studies reveals few male-female differences beyond size”, Neuroscience & Biobehavioral Reviews, Vol. 125, pp. 667-697, https://doi.org/10.1016/j.neubiorev.2021.02.026.
Eriksson, M. et al. (2011), “Differences between girls and boys in emerging language skills: Evidence from 10 language communities”, British Journal of Developmental Psychology, Vol. 30/2, pp. 326-343, https://doi.org/10.1111/j.2044-835x.2011.02042.x
Ertem, I. et al. (2018), “Similarities and differences in child development from birth to age 3 years by sex and across four countries: a cross-sectional, observational study”, The Lancet Global Health, Vol. 6/3, pp. e279-e291, https://doi.org/10.1016/s2214-109x(18)30003-2.
Etchell, A. et al. (2018), “A systematic literature review of sex differences in childhood language and brain development”, Neuropsychologia, Vol. 114, pp. 19-31, https://doi.org/10.1016/j.neuropsychologia.2018.04.011
Karoly, L. and G. González (2011), “Early Care and Education for Children in Immigrant Families”, The Future of Children, Vol. 21/1, pp. 71-101, https://futureofchildren.princeton.edu/sites/g/files/toruqf2411/files/media/immigrant_children_2 1_01_fulljournal.pdf (accessed on 12 January 2026).
Kruzik, C. et al. (2023), “The Early Emergence of SES Achievement Gaps: Disparities Across Race, Ethnicity, and Immigrant Status”, Race and Social Problems, Vol. 16/1, pp. 116-132, https://doi.org/10.1007/s12552-023-09402-w.
Lauro, J., C. Core and E. Hoff (2020), “Explaining Individual Differences in Trajectories of Simultaneous Bilingual Development: Contributions of Child and Environmental Factors”, Child Development, Vol. 91/6, pp. 2063-2082, https://doi.org/10.1111/cdev.13409
[8]
[1]
[19]
[22]
[23]
Morawska, A. (2020), “The Effects of Gendered Parenting on Child Development Outcomes: A Systematic Review”, Clinical Child and Family Psychology Review, Vol. 23/4, pp. 553-576, https://doi.org/10.1007/s10567-020-00321-5 [7]
OECD (2026), IELS 2025 Technical Report, http://oecd.org/en/about/projects/international-earlylearning-and-child-well-being-study
OECD (2025), Results from TALIS Starting Strong 2024: Strengthening Early Childhood Education and Care, TALIS, OECD Publishing, Paris, https://doi.org/10.1787/20af08c0-en.
OECD (2023), International Migration Outlook 2023, OECD Publishing, Paris, https://doi.org/10.1787/b0f40584-en
[18]
[16]
Persici, V. et al. (2022), “Vocabulary and reading speed in the majority language are affected by maternal language proficiency and language exposure at home: a study of language minority bilingual children in Italy”, International Journal of Bilingual Education and Bilingualism, Vol. 25/10, pp. 3729-3744, https://doi.org/10.1080/13670050.2022.2076552.
Raley, S. and S. Bianchi (2006), “Sons, Daughters, and Family Processes: Does Gender of Children Matter?”, Annual Review of Sociology, Vol. 32/1, pp. 401-421, https://doi.org/10.1146/annurev.soc.32.061604.123106
Rinaldi, P. et al. (2021), “Gender differences in early stages of language development. Some evidence and possible explanations”, Journal of Neuroscience Research, Vol. 101/5, pp. 643653, https://doi.org/10.1002/jnr.24914.
UNICEF (2025), Child displacement, https://data.unicef.org/topic/child-migration-anddisplacement/migration/ (accessed on 3 February 2026).
UNICEF (2025), International Migrant Stock 2020, https://data.unicef.org/topic/child-migrationand-displacement/migration/ (accessed on 3 February 2026).
Washbrook, E. et al. (2012), “The Development of Young Children of Immigrants in Australia, Canada, the United Kingdom, and the United States”, Child Development, Vol. 83/5, pp. 1591-1607, https://doi.org/10.1111/j.1467-8624.2012.01796.x
Notes
[24]
[6]
1 The languages of assessment in each jurisdiction were: Azerbaijani and Russian, depending on the ECEC centre/school, in Baku and Sumgait (Azerbaijan); Portuguese in Ceará, Pará and São Paulo (Brazil); English in England (United Kingdom); Dutch in the Netherlands and the Flemish Community (Belgium); Arabic and English, depending on the ECEC centre/school, in the United Arab Emirates and Abu Dhabi (as an IELS adjudicated region); Maltese and English, depending on the ECEC centre/school, in Malta; Mandaring in Hangzhou (China), and Korean in Korea.
This chapter discusses associations between home environments and children’s early learning and development outcomes. It first explores parental levels of education and household structure as indirect influences on children’s outcomes. The chapter then examines the frequency and nature of parent-child activities, with a focus on reading and digital practices, as well as parents’ engagement in the child’s ECEC centre/school, as more direct influences on children’s outcomes.
• In half of the jurisdictions participating in IELS 2025, five-year-olds most commonly have mothers who have completed tertiary education. In the other half, the modal highest educational attainment of mothers is upper secondary or post-secondary, non-tertiary education.
• On average across jurisdictions, children whose mothers have tertiary education have higher scores across early learning and development domains than children whose mothers have lower levels of education. Differences are largest and most consistent in the foundational learning domains of emergent literacy and emergent numeracy – around 30 score-points on average, in each case – but are also sizable in most social and emotional development domains. Conversely, children whose mothers had at most completed lower secondary education have significantly lower scores than children whose mothers have intermediate levels of education in eight out of ten assessment domains.
• IELS provides information on both material (e.g. children’s books) and process-related (e.g. parent-child activities) aspects of the home learning environments of five-year-olds. There is a marked socio-economic gradient in these home environments: children in advantaged families have access to more resources and parents who engage more frequently with them in activities with an explicit developmental focus than children in disadvantaged families.
• The activities that parents do with their children matter for their early learning and development in addition to parents’ own characteristics. After accounting for socio-economic status, children whose parents engage more frequently in activities with a developmental focus – as captured by the IELS home learning environment index – have higher scores in the foundational learning domains of emergent literacy and emergent numeracy, and in the social and emotional development domains of trust and pro-social behaviour, on average. Supporting families in providing caring, stimulation-rich home environments can promote children’s outcomes.
• On average, 54% of parents read to their child every other day or more often, but this varies greatly between jurisdictions. This activity is also more frequent among socio-economically advantaged families. For five-year-olds, a high frequency of shared parent-child reading is associated with higher scores in emergent literacy and emergent numeracy
• Almost half of the five-year-olds in the study use a digital device every day, on average across jurisdictions, with higher shares among children in socio-economically disadvantaged families. Associations between children’s scores in early learning and development domains and the frequency of both children’s use of digital devices and parent-child joint digital educational activities are weak and most often non-significant.
• On average, 43% of five-year-olds in IELS 2025 have parents who are strongly involved in activities at their early childhood education and care (ECEC) centres/schools; this involvement is consistently higher in socio-economically advantaged families. Children whose parents are strongly involved in their ECEC centres/schools have higher scores than peers with less involved parents in many domains of assessment, particularly in the social and emotional development dimension This relationship holds after accounting for socio-economic status, suggesting that strengthening family-school connectedness in the early years benefits all children.
Young children’s family contexts critically influence their early learning and development trajectories. The environments in which children grow up afford different opportunities depending on the material, time, and cultural resources that families can mobilise. Before other social institutions start to play a role in children’s lives, it is within the family that disparities in early cognitive and social and emotional development begin to emerge, starting from infancy.
Family contexts are central to ecological models of human development as well as to perspectives on the inter-generational transmission of educational success (Bronfenbrenner, 1986[1]) (Feinstein, Duckworth and Sabates, 2008[2]). These frameworks distinguish layered influences that link families’ characteristics and children’s outcomes. More indirect or distal influencing factors pertain to the family’s broader demographic and socio-economic environment, whereas more direct or proximal factors concern children’s immediate lived experiences and interactions with parents or other family members. Parents’ values and beliefs mediate between these two layers. IELS collects information on both general background variables, which exert indirect influences on children’s outcomes, and process-related variables, which exert direct influences
This chapter describes associations between home environments and children’s early learning and development outcomes in IELS 2025. The chapter first examines parental levels of education and household structure as distal factors shaping children’s outcomes. It then looks at a range of activities that parents undertake with their child, as well as their levels of engagement in the child’s early childhood education and care (ECEC) centre or school, as more proximal processes affecting outcomes1. These analyses provide a more in-depth examination of the factors behind socio-economic gaps in children’s outcomes, given the strong influence that families’ socio-economic status exerts on home learning environments.
Parental levels of education shape children’s outcomes through a variety of channels. Longer and more complex schooling experiences can provide parents with a better understanding of the environmental factors that contribute to children‘s development and enhanced skills to provide these positive inputs. This includes, for instance, a better grasp of the dynamics of child development and parents‘ own linguistic and mathematical abilities, as well as confidence in their own parenting skills (Feinstein, Duckworth and Sabates, 2008[2])
Household composition can also exercise an influence on children’s early learning and development. This can be expected when changes in family structure (e.g. a transition from a two-parent household to another living arrangement) create instability and stress for children, including through reduced resources or lowerquality interactions with other family members. However, particularly in the context of an increasing diversity of family structures, a wide range of factors mediate the relationships between household composition and children’s outcomes and well-being, and changes in family structure need not be detrimental for children (Hadfield et al., 2018[3]) (Vowels et al., 2023[4])
The children who took part in IELS 2025 are growing up in diverse family contexts, consistent with the contextual socio-demographic indicators of participating jurisdictions (Table B.5.1and Annex A) At the time of data collection in 2025, on average across jurisdictions, 94% of the five-year-olds were living with two parents, while up to 16% of children in Ceará, Pará and São Paulo (Brazil) and 9% of children in England (United Kingdom) lived in single-parent households (Table B.5.1). Across jurisdictions, five-year-olds most
often had one sibling, and the average number of siblings living in the home was lower in Malta and Korea, and larger in the United Arab Emirates.
On average, almost two-thirds of the mothers of the five-year-olds in IELS 2025 were in their thirties. In the majority of jurisdictions, mothers most frequently were between 35 and 39 years of age, with also close to a third of mothers in the United Arab Emirates, the Flemish Community (Belgium) and Baku and Sumgait (Azerbaijan) aged 30 to 35 years and over a third of mothers in Ceará, Pará and São Paulo (Brazil) being below age 30 in 2025 Korea has the largest share of mothers aged 40 or older (46%) (Table B.5.1).
In terms of parental levels of education, children in the United Arab Emirates, the Flemish Community (Belgium), England (United Kingdom), Korea and Malta most commonly had mothers who had completed a tertiary education degree (a bachelor’s or master’s degree, a doctorate, or equivalent). In the Netherlands, Baku and Sumgait (Azerbaijan) and Ceará, Pará and São Paulo (Brazil), a majority of children had mothers whose highest level of attainment was either upper secondary education post-secondary, non-tertiary education, or short-cycle tertiary education. On average across jurisdictions, these two levels represent the highest educational attainment of over 80% of the mothers of the children in IELS 2025 Lower levels of maternal education were less frequent, but over one in five children in England (United Kingdom), Malta and Ceará, Pará and São Paulo (Brazil) had mothers whose highest attainment was either primary or lower secondary education International Standard. Classification of Education (ISCED) levels 1 or 2). An almost identical pattern of educational attainments existed among children’s fathers (Table B.5.1).
Given that, on average, mothers tend to spend more time and interact more actively with children than fathers, in particular during the early years of their lives (Berghammer and Milkie, 2025[5]), the association between parental education and children’s early learning and development outcomes in IELS 2025 is examined through the lens of the mother’s rather than the father’s level of education (Figure 5 1).
On average across jurisdictions and compared to children whose mothers’ highest level of attainment is upper secondary or post-secondary education, children whose mothers completed tertiary education have higher scores in all ten domains of early learning and development assessed in IELS. Differences in scores between these two groups of children are largest and most often statistically significant in the foundational learning domains of emergent literacy and emergent numeracy – of 30 points on average, in each case – but also clear in the executive function domain of mental flexibility and in all the social and emotional development domains except trust. Across dimensions, gaps in favour of children of mothers with tertiary education tend to be most pronounced among children in Ceará, Pará and São Paulo (Brazil), the Flemish Community (Belgium) and the United Arab Emirates.
Conversely, the scores of children whose mothers completed, at most, lower secondary education are significantly below the scores of children whose mothers have intermediate levels of attainment in eight out of the ten domains of assessment, on average across jurisdictions. This negative association is again most consistent in the foundational learning domains, with the size of the gaps being largest among children in the Netherlands and Korea, but weak across executive function and social and emotional development domains.
Overall, these results are in line with the socio-economic gaps in children’s outcomes presented in Chapter 4. As expected, differences in scores by maternal level of education are smaller in magnitude that those between children and the upper and lower quarters of the IELS index of socio-economic status, which also captures the influence of income and parental occupational levels. At the same time, the results suggest that the educational attainments of parents remain, in themselves, an independent and important predictor of children’s early learning and development outcomes.
Score-point difference in foundational learning, executive function, and social and emotional development domains associated with mothers having tertiary or below upper secondary education, compared to upper secondary or postsecondary education
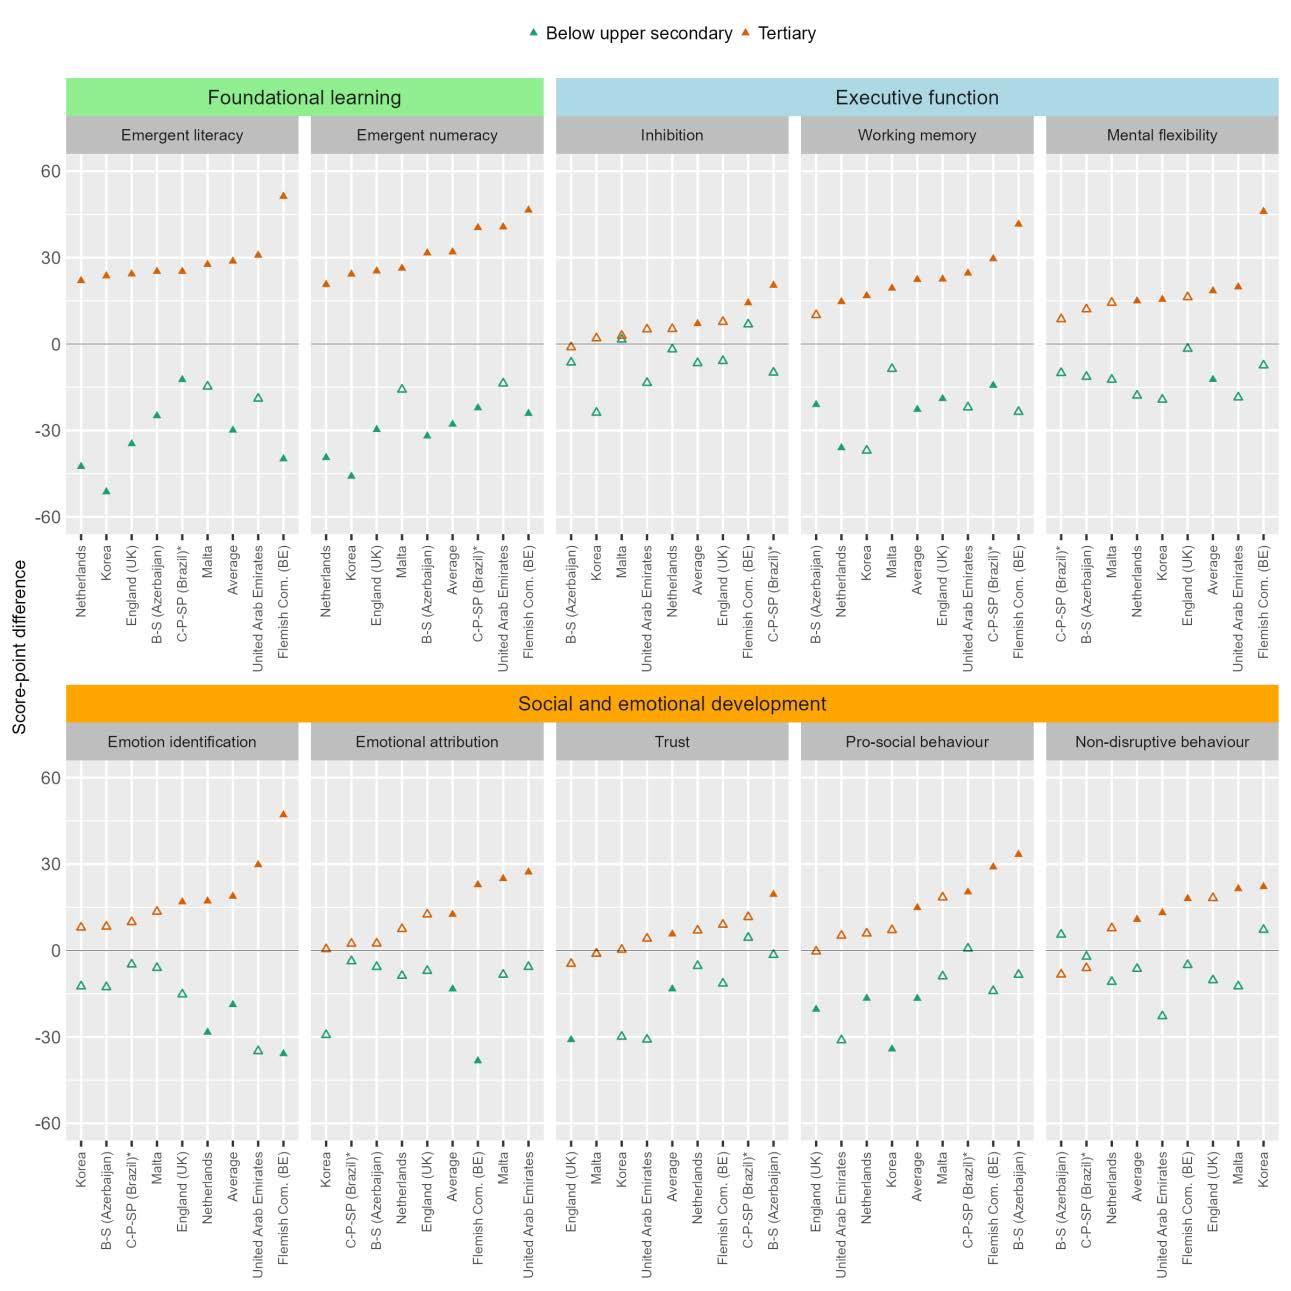
Note: *Estimates for Brazil correspond to the average across the three participating states. Comparisons based on the highest level of formal education completed by the child’s mother: tertiary education refers to ISCED levels 6, 7 and 8; upper secondary or post-secondary education refers to ISCED levels 3 and 4/5; below upper secondary education refers to ISCED levels 2 and 1 or less. Differences calculated relative to the mean scores of children whose mothers have intermediate levels of attainment (ISCED 3, 4 and 5). Solid triangles indicate statistically significant differences. For more information, see the IELS 2025 Technical Report (OECD, 2026[6]) Jurisdictions are sorted in ascending order of the size of the gap relative to children with tertiary educated mothers
Source: OECD, IELS 2025 Database, Tables B.5.2, B.5.3 and B.5.4
By contrast, only minor and inconsistent differences exist across the ten domains of assessment between the scores of children living with two parents and one parent only. Notably, the few gaps observed in some jurisdictions tend to become non-statistically significant after accounting for the socio-economic status of the family (Tables B.5.7, B.5.6 and B.5.7).
An extensive literature documents that supportive home learning environments – understood as a set of conditions within the family setting that encompass material resources (e.g. age-appropriate books and educational toys), adult-child interactions with a developmental intent and woven into daily routines (e.g. shared reading, play, rich conversations) and affect and belief systems (e.g. warmth, self-efficacy) – bear positive associations with young children’s early literacy and numeracy and social and emotional skills (Melhuish et al., 2008[7]) (Rose et al., 2017[8]) (Dong et al., 2020[9]) (James-Brabham et al., 2025[10]).
IELS 2025 collected information on home learning processes by asking parents about the weekly frequency of engagement with their child in various types of activities with a developmental focus. These include interactions such as reading to the child from a book, having conversations about the child’s feelings, engaging in imaginative or pretend play, helping the child learn letters or numbers, doing digital educational activities, or taking the child to a library or to special or extra-cost activities outside the home. Parents indicated how often they do these activities, from “never” to “five to seven times” in a typical week. The items in the IELS Parent questionnaire are derived from research on self-reported measures of home learning environments (Niklas et al., 2016[11]) and adapted for young children (Melhuish et al., 2008[7]). The activities can be seen to reflect proximal, process-related factors with the potential to directly influence children’s early learning and development, while mediating the relationships between more distal factors, such as parental levels of education or parenting values, and child outcomes.
Figure 5 2 shows the percentage of children whose parents engage in different interactions with a high frequency, defined as “three or more days per week” for activities that can take place within the home and unstructured outside activities, and as “once a week or more often” for organised activities outside the home (for more disaggregated results, see Table B.5.8). On average across jurisdictions, back-and-forth conversations about how children feel and why they feel that way are the most common of these interactions, taking place at least three per week for 76% of children. However, being an activity that requires little additional time or expense from adults, it is important to also note that nearly a quarter of children in the study do not have this type of interaction with their parents on a regular basis In the same vein, other activities with light requirements such as storytelling or imaginative play, appear also to not be part of the daily routines of more than half of the five-year-olds in IELS 2025. Meanwhile, on average across jurisdictions between 40% and 56% of children have parents who engage with them three or more times a week in activities with an explicit literacy or numeracy component (e.g. reading from a book, singing songs or poems, playing with numbers) or involving motor development (e.g. physical activities outside). As expected, organised activities involving other actors or settings are generally less common. On average, only one in ten children in the study go to a library with a parent with a weekly frequency, but more than half of the children participate in special activities outside the home (e.g. extra-curricular lessons, sport clubs) at least once a week.
The rich information about these activities is combined into the IELS home learning environment index to facilitate its aggregate analysis with increased reliability (see the IELS 2025 Technical Report (OECD, 2026[6]) The index can be seen as a summary measure of the frequency of parent-child interactions with a deliberate educational or developmental purpose. Importantly, on average across jurisdictions the values of the index are substantially higher among socio-economically advantaged families compared to disadvantaged families (Table B.5.10). This is in line with research showing that parents with higher levels of education, occupational status and income tend to spend more time with their children, especially at
younger ages and often at the expense of their own leisure time, and engage more frequently in stimulation-rich interactions with them (Monna and Gauthier, 2008[12]) (Dotti Sani and Treas, 2016[13]).
Percentage of children whose parents report engaging in the following practices with them with varying frequency in a typical week
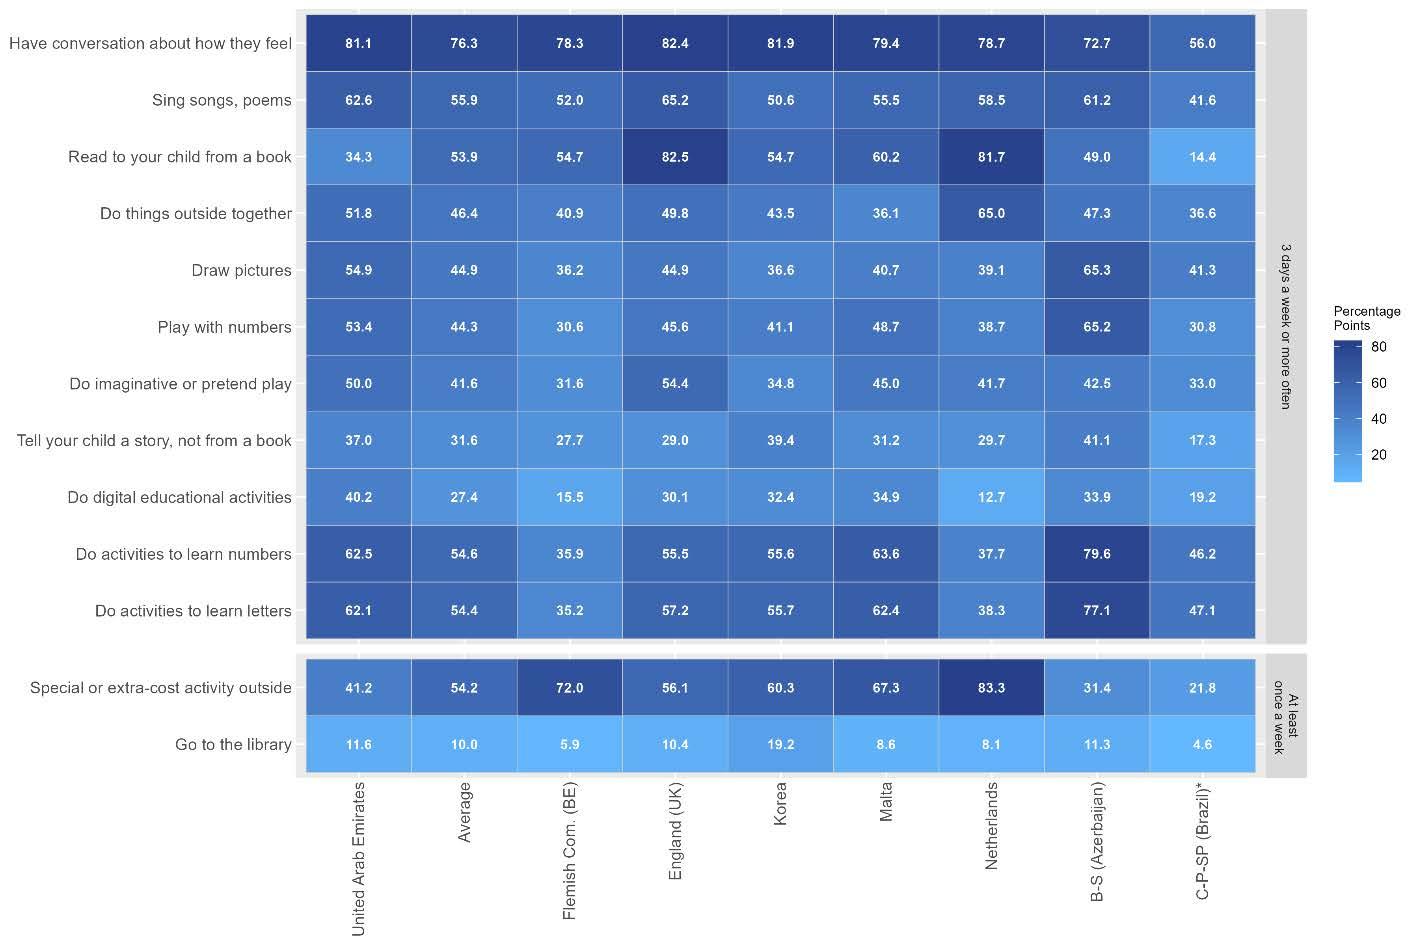
Note: For the upper panel, the percentage shown groups the response categories “3-4 days a week” and “5-7 days a week”, compared to “Never”, “Less than once a week” and “1-2 days a week”. For the lower panel, it groups the three response categories with higher frequency, compared to “Never” and “Less than once a week”. For more information, see the IELS 2025 Technical Report (OECD, 2026[6]) Activities are ranked by descending order of the frequency on average across jurisdictions.
Source: OECD, IELS 2025 Database, Table B.5.8.
In IELS 2025, this socio-economic gradient in home learning environments is most pronounced in Baku and Sumgait (Azerbaijan), Ceará, Pará and São Paulo (Brazil), Korea and the United Arab Emirates. By contrast, no or only marginal differences in the index exist between families in different socio-economic groups in England (United Kingdom) and the Netherlands, a result that may be partially explained by the low response rates to Parent questionnaires in these two jurisdictions (see Reader’s guide). Meanwhile, the index values do not differ significantly between two-parent and single-parent households, except in Korea and Malta (Table B.5.10).
On average across jurisdictions, a one-standard deviation increase in the IELS home learning environment index – which represents a higher frequency of parent-child activities with a developmental focus – is
positively associated with children’s scores in several domains across the three dimensions of early learning and development measured in IELS 2025 (Figure 5.3).
Score-point differences in foundational learning, executive function, and social and emotional development domains associated with a one-standard deviation increase in the home learning environment index, before and after accounting for socio-economic status
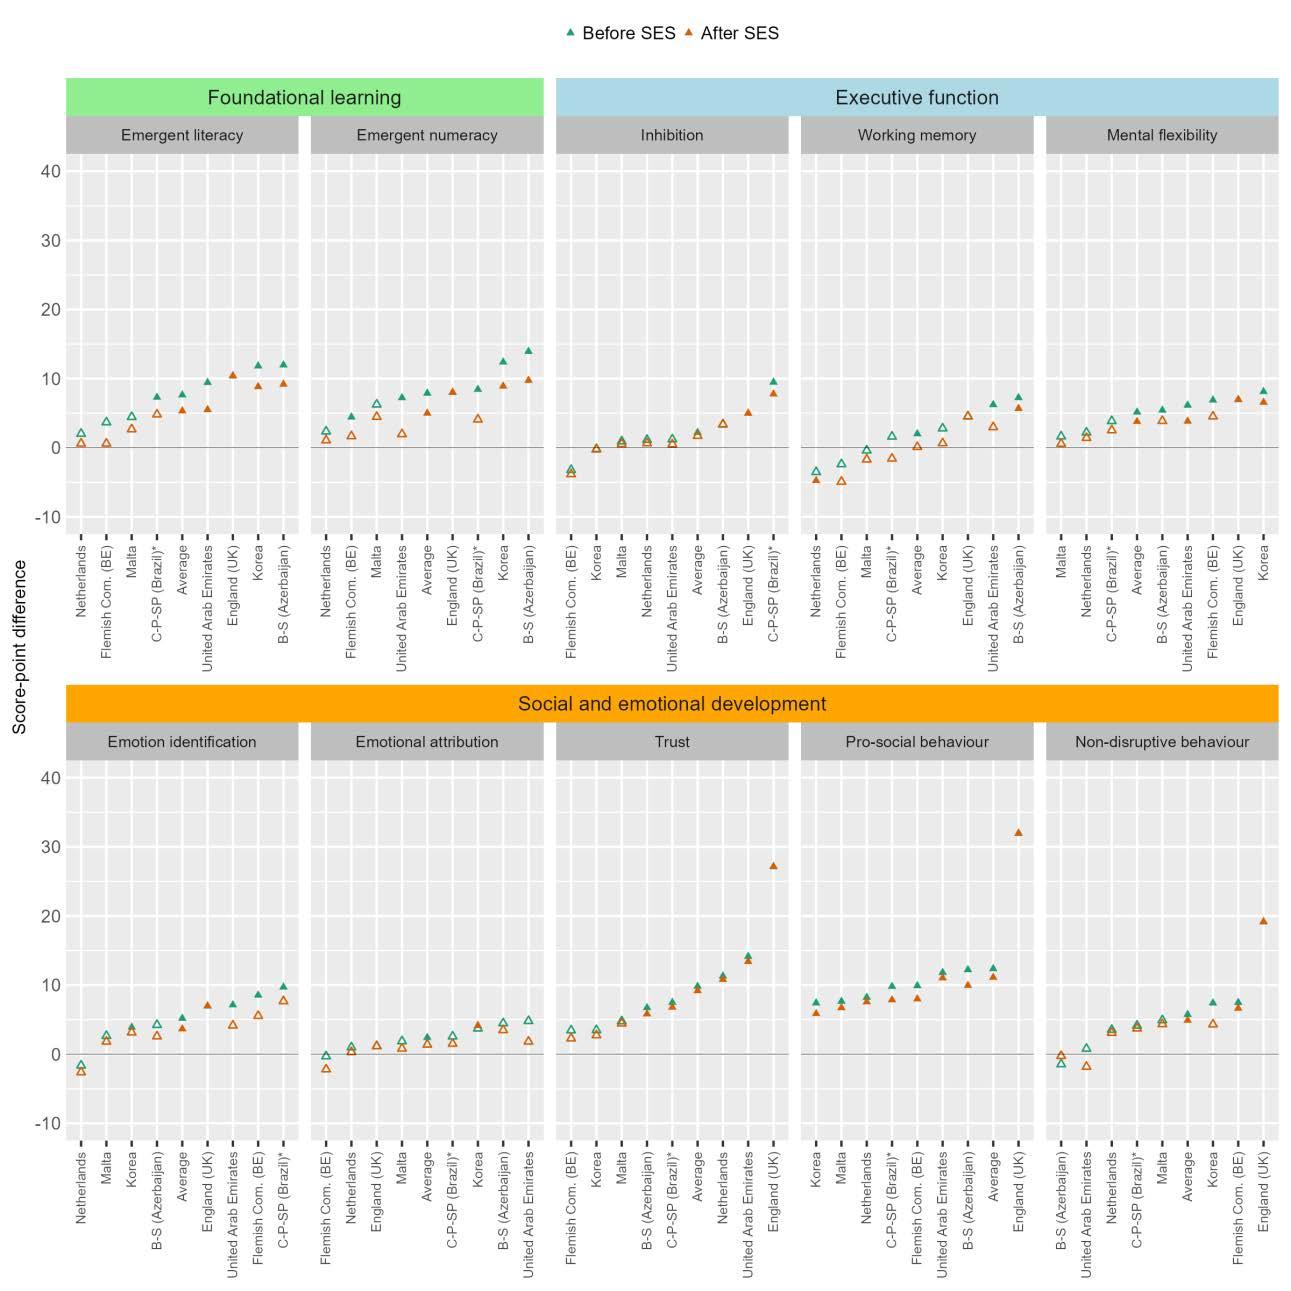
Note: *Estimates for Brazil correspond to the average across the three participating states The IELS home learning environment index is derived from 13 items in Q15 of the Parent questionnaire; it has an international mean of 0 and a standard deviation of 1. Socio-economic background as measured by the IELS index of socio-economic status (SES). Solid triangles indicate statistically significant differences. For more information, see the IELS 2025 Technical Report (OECD, 2026[6]) Jurisdictions are sorted in ascending order of the score-point difference in each domain
Source: OECD, IELS 2025 Database, Tables B.5.11, B.5.12 and B.5.13.
This general positive association is more consistent in the foundational learning domains of emergent literacy and emergent numeracy, and in the social and emotional development domains of trust and prosocial behaviour, where it translates into average increases of between 5 and 10 points in children’s scores, after accounting for socio-economic status. In the executive function dimension, the association is also positive and significant children’s scores in mental flexibility, but rarely in inhibition and working memory. It is also weak and non-significant in the domains of emotion identification and emotional attribution. Across the many domains of early learning and development where the association with home learning environments holds, increases in children’s scores tend to be larger in magnitude and more often significant in Baku and Sumgait (Azerbaijan), England (United Kingdom) and Korea.
Notably, while generally attenuated when families’ socio-economic status is taken into account, the association remains statistically significant in many participating jurisdictions in the five domains where the average magnitude of the score increases is larger, which include both directly and indirectly assessed domains. Given the differential pattern of engagement in activities with an educational or developmental focus of parents in socio-economically advantaged and disadvantage families, this is a noteworthy finding which indicates that what parents choose to do with their children (i.e. the concrete types of interactions and processes) matter for their early learning and development in addition to their education, occupational and income levels. This points to the benefits for children’s outcomes of supporting families to provide caring and stimulation-rich home environments in which their children can thrive.
Further, an item-level analysis serves to examine which specific parent-child interactions are most strongly associated with children’s outcomes, and how the role of individual activities varies across jurisdictions (Table B.5.9). This can provide a more nuanced understanding of the different components of the home learning environment and thereby insights to support meaningful interactions in different family contexts. This analysis shows that item-level correlations with children’s scores are generally positive but weak (with coefficients below .20). However, some activities stand out from this general pattern. On the one hand, stronger positive correlations with children’s outcomes are observed for the weekly frequency with which parents read to the child from a book and for the weekly frequency of special or extra-cost activities outside. These associations, found also in the first cycle of IELS (OECD, 2020[14]), are more pronounced in relation to emergency literacy and emergent numeracy, two domains where correlations with the frequency of visits to the library and the frequency of conversations about children’s feelings are also relatively higher than for other activities. Shared reading and special or extra-cost activities have also larger positive correlations than the rest of the activities with children’s scores in other domains, but weaker than with those in the foundational learning dimension. On the other hand, doing digital activities with children is the activity for which a higher weekly frequency bears a more consistent negative correlation with children’s scores, particularly again with regard to emergent literacy and emergent numeracy. The Flemish Community (Belgium) and the Netherlands are the two jurisdictions in IELS 2025 where these patterns of correlations with specific activities are more noticeable (Table B.5.9).
IELS 2025 provides information on reading-related resources and practices in home environments through questions to parents about the number of children’s books available in the home and, as noted above, about the frequency with which parents read to children from a book on a weekly basis.
A positive and statistically significant association exists between the number of children’s books available in the home and five-year-olds’ outcomes in several early learning and development domains. For instance, on average across jurisdictions, the scores of five-year-olds with access to more than 50 children’s books at home are 42 and 37 points higher in the foundational learning domains of emergent literacy and emergent numeracy, respectively, than the scores of children with fewer than 25 such books in their homes. These differences are also significant, ranging from 15 to 25 points, in the executive function domains of working memory and mental flexibility and in the social and emotional development domain of
emotion identification. Further, the differences hold in most cases, albeit smaller in magnitude, when the comparison is made between five-year-olds with 25 to 50 children’s books and peers with fewer books (Table B.5.16). Importantly, these results take into account families’ socio-economic status, which is strongly correlated with the number of children’s books available at home (Table B.5.14). While the number of children’s books in itself represents a resource rather than a direct interaction, this suggests that the availability of these books reflects not just families’ economic resources, but also the variety and quality of the inputs for parent-child reading activities and parents’ valuing of such interactions.
On average across jurisdictions, 54% of parents report reading to their child from a book three days or more in a typical week, with this percentage being highest (over 80% of families) in England (United Kingdom) and the Netherlands and lowest (around 34% or less of families) in Ceará, Pará and São Paulo (Brazil) and the United Arab Emirates (Table B.5.8). Across all participating jurisdictions, the frequency of these reading activities is higher in socio-economically advantaged families than in disadvantaged families (Table B.5.14).
Figure 5 4 shows that a high frequency of parent-child reading activities is, in many jurisdictions, associated with higher scores in multiple domains of early learning and development. After accounting for socio-economic status, the average score difference between children in families where shared reading activities are most and least frequent (i.e. “more than five days a week”, compared to “less than once a week”) amounts to 32 and 23 points in the foundational learning domains of emergent literacy and emergent numeracy, respectively. In the executive function domains of working memory and mental flexibility, and in the social and emotional development domain of emotion identification, these differences range from 9 to 17 points. However, differences are smaller or non-statistically significant when the comparison is made between children in families with an intermediate and low frequency of parent-child reading interactions (i.e. “one to four days a week”, compared to “less than once a week”) (Table B.5.16). Overall, results suggest that highly frequent (i.e. every other day or more often) joint reading activities with parents are beneficial for children, particularly in foundational learning domains, but also in executive functions and social and emotional development with which they bear substantive and positive correlations (see Chapter 3).
Score-point difference in foundational learning, executive function, and social and emotional development domains associated with a high and intermediate frequency of parents reading to their children from a book, compared to low frequency, and after accounting for socio-economic status
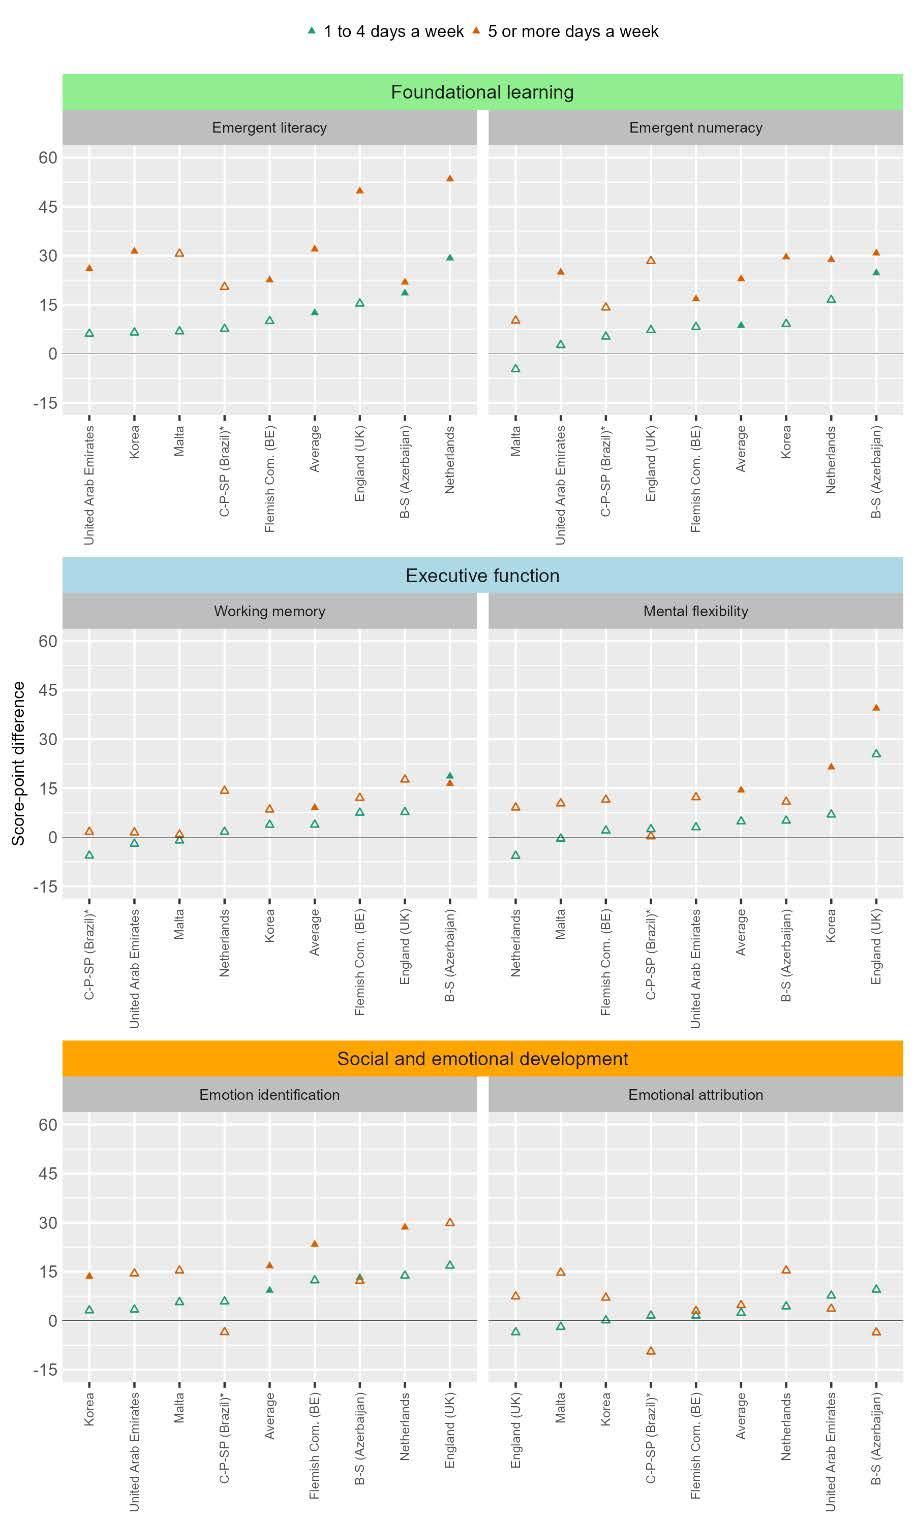
Note: *Estimates for Brazil correspond to the average across the three participating states Score-point differences calculated as scores of children whose parents read to them from a book with high (“five or more days a week”) or intermediate (“one to four days a week”) frequency, minus scores of children whose parents read to them with low frequency (“less than once a week”). Socio-economic background as measured by the IELS index of socio-economic status (SES). Solid triangles indicate statistically significant differences. For more information, see the IELS 2025 Technical Report (OECD, 2026[6]) Jurisdictions ranked in ascending order of the score-point difference between high and low frequency parent-child reading activities.
Source: OECD, IELS 2025 Database, Table B.5.16
IELS 2025 Also provides a window into the role of digital resources and practices in the home environments of young children. The study includes questions to parents about the weekly frequency with which fiveyear-olds use digital devices (e.g. a desktop or laptop computer, tablet device, smartphone), as well as about the weekly frequency of parent-child joint digital activities with an educational purpose.
On average across jurisdictions, 46% of 5-year-olds are reported to use a digital device every day, a slight increase from the international mean of IELS 2018 (42%) with a different set of participating countries, but consistent with the increase reported by parents in England (United Kingdom) between the two cycles (from 39% to 42%). In IELS 2025, the percentage of children reported to be daily users of digital devices ranges from 24% in the Netherlands to 66% in Malta. In all jurisdictions except Baku and Sumgait (Azerbaijan), Ceará, Pará and São Paulo (Brazil) and the United Arab Emirates, children in socioeconomically disadvantaged families are more often reported to be using digital devices every day than children in families with a high socio-economic status, by a difference of between 10 and 26 percentage points (Table B.5.17).
Consistent with results from IELS 2018, the association between children’s frequency of use of digital devices and their scores across the ten early learning and development domains in IELS 2025 is rarely statistically significant, even before accounting for families’ socio-economic status. Comparisons between children reported to use a digital device never or less than weekly, at least once a week, or daily suggest that their outcomes are largely unrelated to the frequency of interactions with digital tools. However, a few exceptions exist to this pattern. In the executive function domain of working memory, both a moderate and a high frequency of use are positively related to children’s scores in several jurisdictions. Further, Korea stands out as the jurisdiction where positive associations are more often observed: this holds for children’s scores in emergent numeracy, working memory, mental flexibility and emotion identification, and generally only with a moderate frequency of use – defined as “at least once a week but not every day” (Table B.5.18).
Mirroring these results, Figure 5.5 shows that the frequency with which parents engage in educational activities with their child on a computer, tablet or smartphone (e.g. using an educational app) bears also a weak and inconsistent association with children’s scores across domains of assessment and jurisdictions. Engaging in this type of activity with a high frequency – defined as “three days of more per week”, and relative to “less than once a week or never” – is associated with lower children’s scores in some domains, particularly in the Flemish Community (Belgium) and the Netherlands, and with higher scores in some domains in Korea (Table B.5.19). This may also reflect cultural variation in parents’ understandings of what constitutes digital educational activities with five-year-olds.
Taken together, results about the associations of digital practices with children’s outcomes in IELS 2025 do not support strong conclusions about the potential impact of these practices. There is no evidence that a highly restrictive approach – characterised by little overall use of digital devices by five-year-olds and no resort to joint consumption of educational digital content – is related to better early learning or development outcomes. At the same time, associations between these outcomes and children’s daily device use or a high frequency of joint parent-child use of educational apps or tools are generally negative, even if rarely statistically significant. Overall, these results are consistent with research reviews documenting mostly non-significant or small negative associations between device use and overall screen time and a range of cognitive and psycho-social outcomes in early childhood (Mallawaarachchi et al., 2022[15]) (Kirkorian et al., 2025[16]). However, as highlighted by this literature, improved measures of the content and context of device use by young children may be needed to derive more robust and nuanced conclusions about these associations.
Figure 5.5. Parent-child educational digital activities and children’s early learning and development outcomes
Score-point difference in foundational learning, executive function, and social and emotional development domains associated with a high and intermediate frequency of parents doing educational digital activities with their children, compared to low frequency, and after accounting for socio-economic status
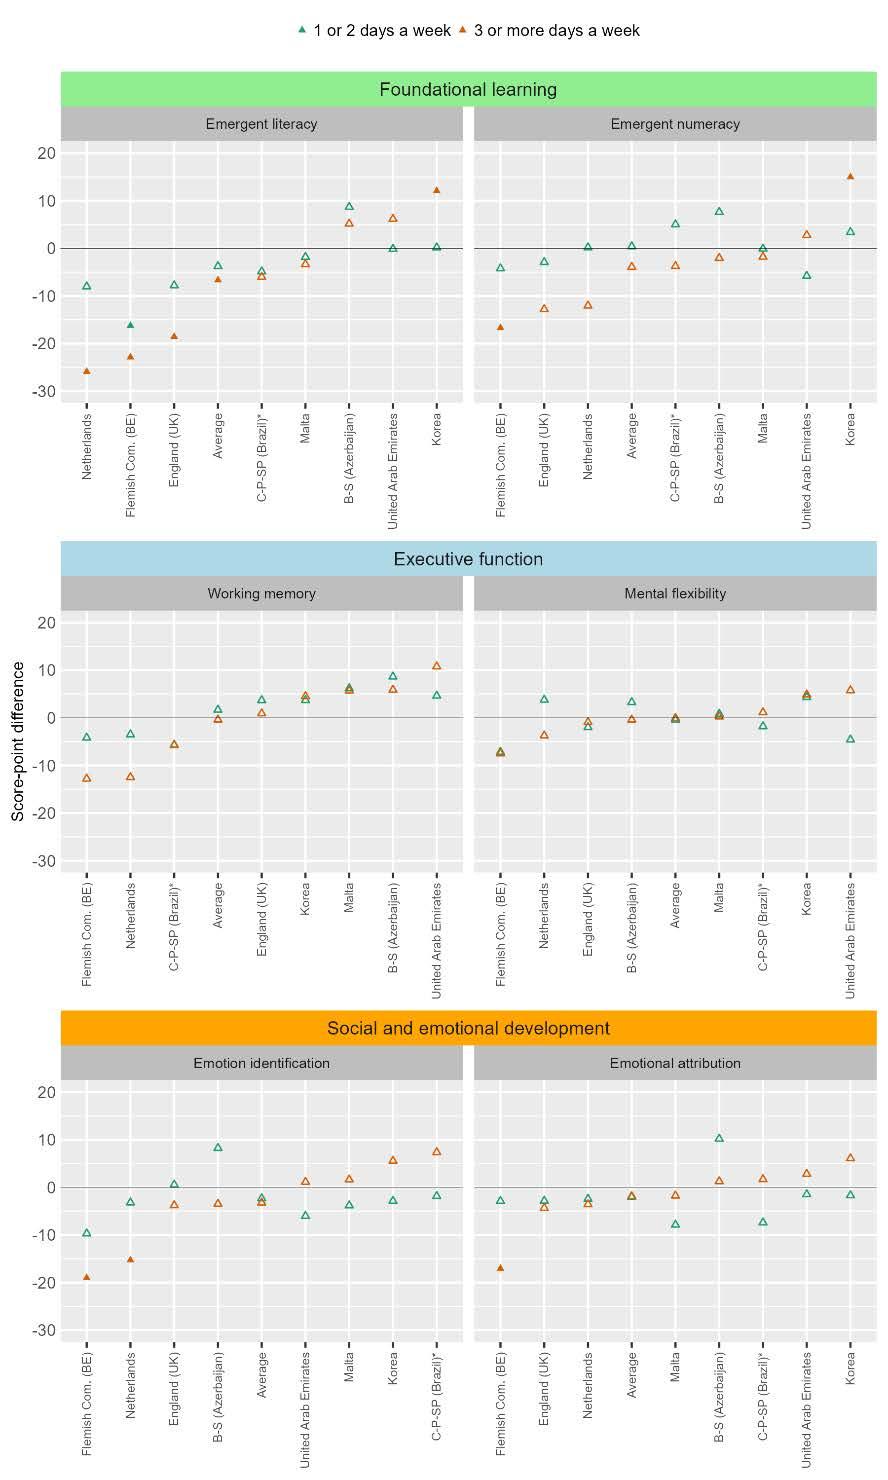
Note: *Estimates for Brazil correspond to the average across the three participating states Score-point differences calculated as scores of children whose parents do educational digital activities with them with high (“three or more days a week”) or intermediate (“one or two days a week”) frequency, minus scores of children with low frequency (“less than once a week or never”). Socio-economic background as measured by the IELS index of socio-economic status (SES). Solid triangles indicate statistically significant differences. For more information, see the IELS 2025 Technical Report (OECD, 2026[6]). Jurisdictions ranked in ascending order of the score-point difference between high and low frequency parent-child educational digital activities
Source: OECD, IELS 2025 Database, Table B.5.19
Family involvement in ECEC/schools can support early learning and development by aligning the home and early schooling ecologies in which children’s skills take shape. For instance, family-school connectedness can promote a shared sense of responsibility for children’s progress and well-being by establishing effective channels for communication and consistent adult-child interactions. In this two-way relationship, parents bring distinct knowledge of their child’s needs, cultural background and preferences, while early educators can advise about home activities (e.g. reading, play, open conversations) that would complement experiences in ECEC settings (Serpell and Mashburn, 2011[17]) (O’Toole et al., 2019[18]) (Barnett et al., 2020[19])
The frequency and intensity with which parents engage with the structures and activities of early education centres and schools characterise this form of family involvement. In IELS 2025, information on parental involvement in ECEC centres/schools is gathered through a question addressed to the ECEC staff member who knows the child best in the centre/school attended at age 5, asking them to rate the strength of this involvement in four categories, from “not at all” to “strongly” involved2
On average across jurisdictions, 43% of the children in the study have parents who are strongly involved in the activities that take place in their child’s ECEC centre/school, 38% have parents moderately involved, and 19% have parents slightly or not at all involved, according to ECEC staff. This pattern is largely consistent across jurisdictions, although strong parental involvement is more frequently reported by educators in Baku and Sumgait (Azerbaijan), and lower levels of involvement are more commonly reported by ECEC staff in the Flemish Community (Belgium) and England (United Kingdom) (Table B.5.20).
Further, and similarly to parent-child activities with a developmental focus, a clear socio-economic gradient exists in levels of parental involvement in ECEC centres/schools: on average, the share of parents strongly involved in their child’s ECEC centre/school is 17 percentage points higher among socio-economically advantaged families than among disadvantaged families, with differences statistically significant in all jurisdictions (Table B.5.20).
In IELS 2025, in the majority of jurisdictions and domains of assessment, large and significant gaps in early learning and development outcomes exist between five-year-olds whose parents are strongly involved in their ECEC centres/schools and peers whose parents are less involved (Figure 5 6). On average across jurisdictions, differences in children’s scores according to parental levels of involvement are largest and most systematic – between 22 and 52 score-points, and significant in virtually all jurisdictions – in the social and emotional development domains of trust, pro-social behaviour and non-disruptive behaviour. Sizable gaps exist also in most jurisdictions in the foundational learning domains of emergent literacy and emergent numeracy – of 17 and 20 points, respectively – while in executive function domains differences tend to be smaller – between 10 and 15 points. In these two dimensions, differences are most consistent among children in the Flemish Community (Belgium) and England (United Kingdom).
Importantly, in most cases, accounting for families’ socio-economic status reduces but does not eliminate raw gaps. This suggests that this involvement is not simply a reflection of varying levels of familiarity with the education system among parents with different levels of education, or of varying levels of financial resources. Instead, the result points to the intervention of different mechanisms, such as communication and collaboration channels between early education settings and families. Strengthening this connectedness can therefore represent an important policy target.
Figure 5.6. Parental involvement in ECEC centres/schools and early learning and development outcomes
Score-point difference in foundational learning, executive function, and social and emotional development domains between children whose parents are strongly vs. moderately, slightly or not at all involved in their ECEC centres/schools, before and after accounting for socio-economic status
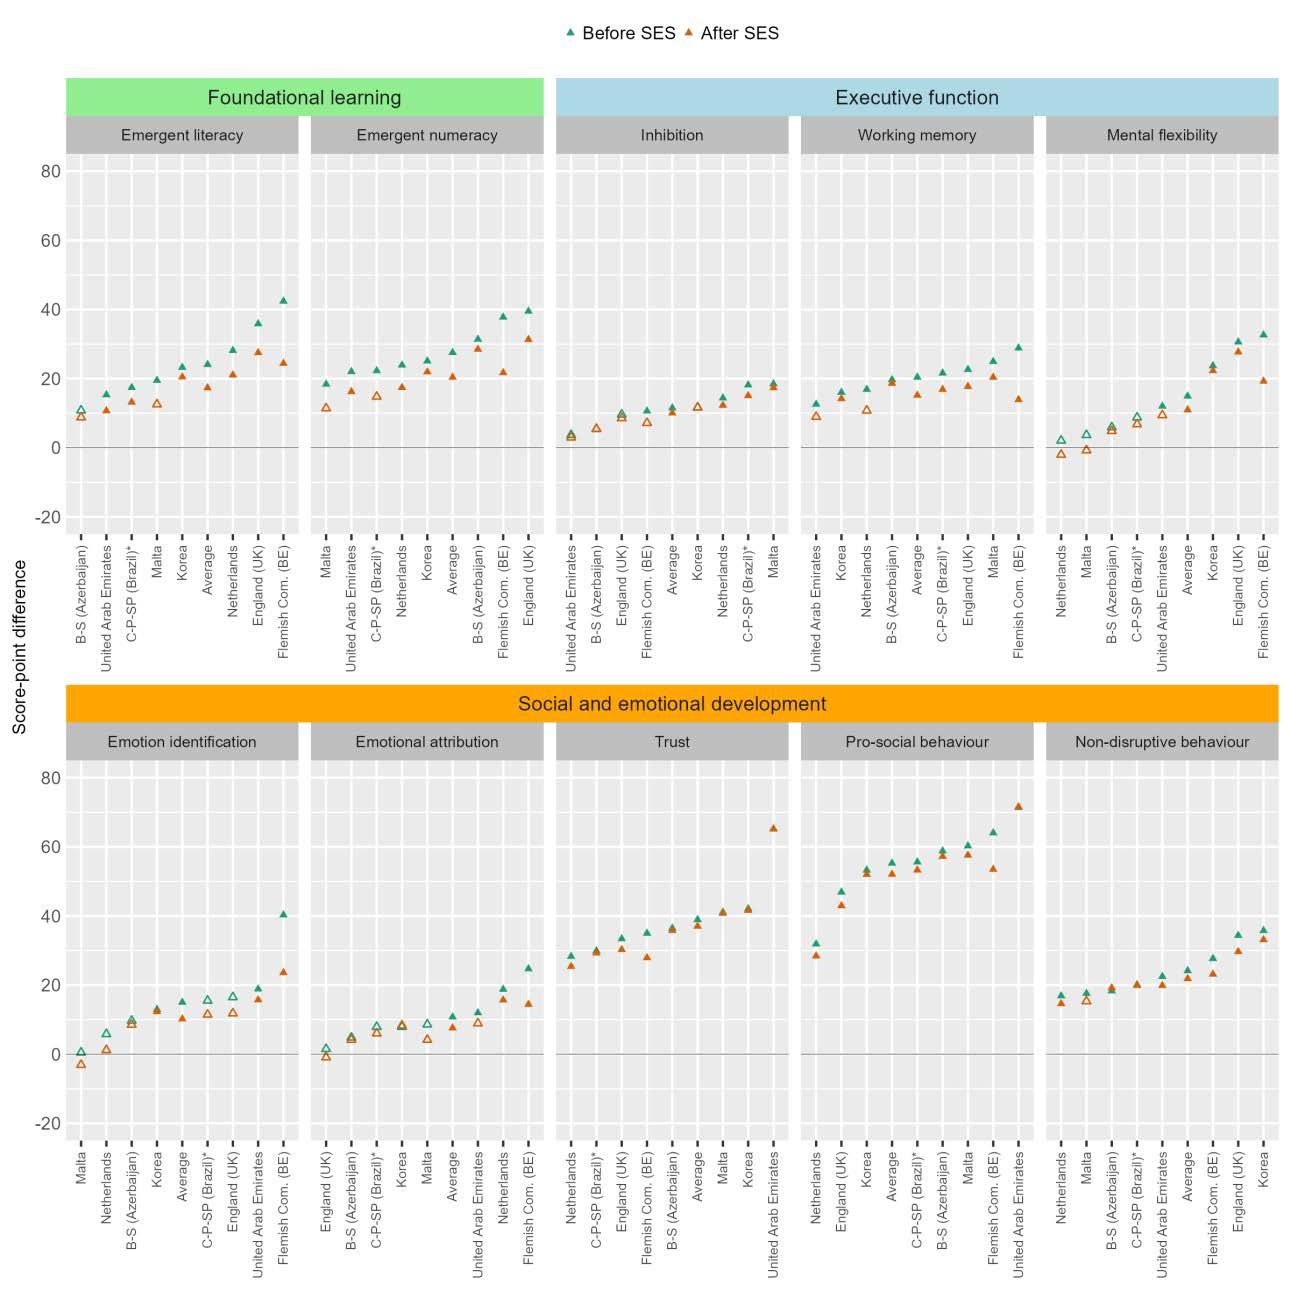
Note: *Estimates for Brazil correspond to the average across the three participating states Analysis limited to children for whom ECEC staff reported a given level of involvement. Socio-economic background as measured by the IELS scale of socio-economic status (SES). Solid triangles indicate statistically significant differences. For more information, see the IELS 2025 Technical Report (OECD, 2026[6]) Jurisdictions are sorted in ascending order of the size of the gap in each domain
Source: OECD, IELS 2025 Database, Tables B.5.21, B.5.22 and B.5.23.
Table 5.1. Home environments and children’s early learning and development: Chapter 5 figures
Figure Title
Figure 5.1
Mother’s level of education and early learning and development outcomes
Figure 5.2 Frequency of parent-child activities with a developmental focus
Figure 5.3
Figure 5.4
Figure 5.5
Figure 5.6
References
Home learning environment and children’s early learning and development outcomes
Parent-child reading activities and children’s early learning and development outcomes
Parent-child educational digital activities and children’s early learning and development outcomes
Parental involvement in ECEC centres/schools and early learning and development outcomes
StatLink2 https://stat.link/ihwxjv
Banerjee, B. (ed.) (2023), “Systematic review and theoretical comparison of children’s outcomes in post-separation living arrangements”, PLOS ONE, Vol. 18/6, p. e0288112, https://doi.org/10.1371/journal.pone.0288112
Barnett, M. et al. (2020), “Influences of Parent Engagement in Early Childhood Education Centers and the Home on Kindergarten School Readiness”, Early Childhood Research Quarterly, Vol. 53, pp. 260-273, https://doi.org/10.1016/j.ecresq.2020.05.005.
Berghammer, C. and M. Milkie (2025), “Trends in time with children in European countries: Intensification and gender convergence”, in The Sociology of Families, Edward Elgar Publishing, https://doi.org/10.4337/9781035319251.00013
Bronfenbrenner, U. (1986), “Ecology of the family as a context for human development: Research perspectives.”, Developmental Psychology, Vol. 22/6, pp. 723-742, https://doi.org/10.1037/0012-1649.22.6.723.
Dong, Y. et al. (2020), “The Effects of Home Literacy Environment on Children’s Reading Comprehension Development: A Meta-analysis”, Educational Sciences: Theory & Practice, Vol. 20/2, pp. 63-82, https://doi.org/10.12738/jestp.2020.2.005
Dotti Sani, G. and J. Treas (2016), “Educational Gradients in Parents’ Child‐Care Time Across Countries, 1965–2012” , Journal of Marriage and Family, Vol. 78/4, pp. 1083-1096, https://doi.org/10.1111/jomf.12305.
Feinstein, L., K. Duckworth and R. Sabates (2008), Education and the Family, Routledge, https://doi.org/10.4324/9780203894927.
Hadfield, K. et al. (2018), “Do Changes to Family Structure Affect Child and Family Outcomes? A Systematic Review of the Instability Hypothesis”, Journal of Family Theory and Review, Vol. 10/1, pp. 87-110, https://doi.org/10.1111/jftr.12243
James-Brabham, E. et al. (2025), “Do home mathematical activities relate to early mathematical skills? A systematic review and meta-analysis”, Child Development, Vol. 96/1, pp. 451-468, https://doi.org/10.1111/cdev.14162.
Kirkorian, H. et al. (2025), “Digital Media, Cognition, and Brain Development in Infancy and Childhood”, in Handbook of Children and Screens, Springer Nature Switzerland, Cham, https://doi.org/10.1007/978-3-031-69362-5_3
[1]
Mallawaarachchi, S. et al. (2022), “Associations of smartphone and tablet use in early childhood with psychosocial, cognitive and sleep factors: a systematic review and meta-analysis”, Early Childhood Research Quarterly, Vol. 60, pp. 13-33, https://doi.org/10.1016/j.ecresq.2021.12.008.
Melhuish, E. et al. (2008), “Effects of the Home Learning Environment and Preschool Center Experience upon Literacy and Numeracy Development in Early Primary School”, Journal of Social Issues, Vol. 64/1, pp. 95-114, https://doi.org/10.1111/j.1540-4560.2008.00550.x
Monna, B. and A. Gauthier (2008), “A Review of the Literature on the Social and Economic Determinants of Parental Time”, Journal of Family and Economic Issues, Vol. 29/4, pp. 634653, https://doi.org/10.1007/s10834-008-9121-z.
Niklas, F. et al. (2016), “Self-report measures of the home learning environment in large scale research: Measurement properties and associations with key developmental outcomes”, Learning Environments Research, Vol. 19/2, pp. 181-202, https://doi.org/10.1007/s10984016-9206-9
OECD (2026), IELS 2025 Technical Report, http://oecd.org/en/about/projects/international-earlylearning-and-child-well-being-study.
OECD (2020), Early Learning and Child Well-being: A Study of Five-year-Olds in England, Estonia, and the United States, OECD Publishing, Paris, https://doi.org/10.1787/3990407f-en.
O’Toole, L. et al. (2019), Parental Involvement, Engagement and Partnership in Their Children’s Education during the Primary School Years, https://researchrepository.ucd.ie/handl.
Rose, E. et al. (2017), “Long-Term Relations Between Children’s Language, the Home Literacy Environment, and Socioemotional Development From Ages 3 to 8”, Early Education and Development, Vol. 29/3, pp. 342-356, https://doi.org/10.1080/10409289.2017.1409096
Serpell, Z. and A. Mashburn (2011), “Family–School Connectedness and Children’s Early Social Development”, Social Development, Vol. 21/1, pp. 21-46, https://doi.org/10.1111/j.14679507.2011.00623.x.
[15]
[7]
[18]
[8]
[17]
Notes
1 The analysis presented in this chapter rely strongly on information from Parent questionnaires. Given low response rates in some jurisdictions, readers are advised to interpret results with caution. See Reader’s guide and the IELS 2025 Technical Report for more information.
2 ECEC teachers could also indicate not knowing the parents/guardians of the child well enough to make a judgement. On average across jurisdictions, less than 2% of ECEC teachers provided this response. Children whose ECEC teachers provided this response are excluded from the analysis in this section.
This chapter explores participation in early childhood education and care (ECEC) and early schooling among children in IELS 2025, and its associations with their early learning and development outcomes by age 5. It also describes the provision of additional supports for children, particularly those experiencing early challenges.
• On average across jurisdictions, 55% of the children in IELS 2025 started attending ECEC before age 3, including 24% of children at age 2, 15% at age 1, and 17% in their first year of life. Among those who started ECEC/school later, 18% of children started at age 3, 17% at age 4, and 9% at age 5. By the time of assessment, children had an average experience of over 2.5 years in ECEC/school, ranging from over 4 years in the Flemish Community (Belgium) to 1.5 years in the United Arab Emirates.
• Before age 5, socio-economically advantaged children had attended ECEC/school for about 5 months longer than disadvantaged children, on average across jurisdictions. In England (United Kingdom), the Flemish Community (Belgium) and the United Arab Emirates this difference was of 6 months or longer. Only in the Netherlands had disadvantaged five-year-olds attended ECEC longer than advantaged peers.
• Across early learning and development domains, the association between the number of years children attended ECEC/school and their outcomes at age 5 is generally positive but weak in statistical significance. A stronger positive association exists when outcomes are compared between children in categories of starting age of attendance, which more accurately reflect the structure of ECEC programmes.
• In jurisdictions where a majority of children start ECEC/school before age 4, children who started attending at ages 0 or 1 have higher scores in some domains than children who first enrolled at ages 2 or 3. In jurisdictions where most children started after age 1, children who started attending at ages 2 or 3 do better in several domains than children who first enrolled at ages 4 or 5.
• The positive relationship between length of participation in ECEC/school and children’s outcomes at age 5 tends to be stronger with the foundational learning domains of emergent literacy and emergent numeracy than with executive function and social and emotional development domains. A negative association exists in some cases with disruptive behaviour.
• IELS 2025 finds no evidence that the association between length of participation in ECEC/school and children’s outcomes varies by socio-economic background. Given the general positive association between attendance and children’s outcomes and the more limited participation of disadvantaged children, on average, this suggests that ECEC and early schooling may not, overall, have the opportunity to reduce socio-economic gaps in those outcomes. Policies can address gaps in early participation in ECEC and promote consistent levels of quality in provision.
• On average across jurisdictions, about one in ten children in IELS 2025 are reported by their parents to have experienced early learning or early social, emotional or behavioural difficulties. Socio-economically disadvantaged children are more likely to experience these risk factors, which compound their overall level of disadvantage
• Targeted learning support is the most frequent form of additional support services for children in IELS 2025, as received by around one in six children overall. Children exposed to a greater number of risk factors are more likely to receive this and other special supports, suggesting an adequate targeting of such supports in most jurisdictions.
High-quality early childhood education and care (ECEC) – from birth to entry into primary school – can be a major driver of children’s early learning and development and a policy lever to promote equal opportunities in society from the early years Many countries have strengthened their ECEC policies in recent decades, resulting in higher enrolment rates, a more balanced dual focus on care and education, and tighter regulations to improve quality. However, extending participation in ECEC does not, on its own, guarantee a strong start for every child, given variation in the quality of provision within ECEC systems (OECD, 2021[1]). Meanwhile, increases in the share of children attending high-quality ECEC services can translate into higher overall levels of school readiness by means of positive peer spillovers and improved conditions to implement more advanced curricula, thereby enhancing the durability of early learning and development gains (List and Uchida, 2024[2])
In the context of increasing diversity in child populations, early learning policies are also paying growing attention to targeted, additional supports for young children who experience particular challenges, for instance, difficulties in their developmental trajectories. Special supports and services embedded in or coordinated with ECEC provision to address early developmental challenges can improve children’s outcomes and reduce the need for remedial or special education later on (Molloy et al., 2019[3]) (Murano, Sawyer and Lipnevich, 2020[4]) (Prenatal-to-3 Policy Impact Center, 2024[5])
This chapter first explores patterns of participation in ECEC among children in IELS 2025, focusing on variation by age and socio-economic background1. It then examines associations between the number of years children participate in ECEC or the early years of primary education prior to age 5 and their early learning and development outcomes, as well as whether these associations differ for children from socioeconomically advantaged and disadvantaged backgrounds
The chapter focuses on formal and regulated ECEC, defined as services meeting the criteria to be classified as International Standard Classification of Education (ISCED) level 0 educational programmes2 Compared with informal care arrangements (e.g. unregulated childminders or babysitters), formal and regulated ECEC, regardless of whether centre- or home-based, generally requires licensing, operates under authority-defined frameworks (e.g. curriculum guidelines), employs trained or accredited staff, and provides more intensive services (e.g. longer hours). However, regulatory requirements for formal ECEC represent a necessary but not sufficient condition to ensure consistent quality (OECD, 2018[6]). In some jurisdictions in IELS 2025, participation in early education programmes includes also the early years primary schooling at ages 4 or 5. The term “ECEC centre/school” is therefore used as shorthand to refer to the educational setting where children are enrolled at age 5; the characteristics of these settings are different across jurisdictions (see Box 6 1)
The chapter concludes by describing the prevalence of various types of early challenges among the children in the study, and the frequency with which they receive special supports (e.g. psychological or learning support, second language support) in the context of their early education and care experiences.
Ensuring ECEC is available, accessible, and affordable for all social groups is a prerequisite for ECEC provision to translate into durable benefits for children and society Despite sizeable increases in ECEC enrolment in many OECD and partner countries in recent decades, participation gaps persist between age groups and children of different backgrounds Socio-economically disadvantaged children tend to participate less in ECEC, particularly in regulated services where structural conditions are often more conducive to high-quality provision In most countries, socio-economic gaps in participation are larger
among children under age 3 but exist also among children aged 3-5. When enrolled, disadvantaged children also tend to attend ECEC settings fewer hours (OECD, 2025[7]).
Barriers to participation in ECEC stem from a mix of personal and environmental factors and can be grouped into two broad categories: direct, which refer to immediate constraints (e.g. cost, location, operating hours) and indirect, which concern more subtle influences (e.g. social norms, parental perceptions, institutional bias). Together, direct and indirect barriers shape whether families, especially disadvantaged ones, can and do participate in ECEC (OECD, 2025[7])
The early education systems of the jurisdictions represented in IELS 2025 differ in many respects (see Box 6 1 and Annex A). In terms of governance, some of these jurisdictions have split systems in which ECEC services for different age groups are governed by different authorities, while others have or are in the process of adopting an integrated system with one leading authority being responsible for all ECEC services. Average enrolment rates for children aged 3-5 also vary markedly, ranging from around 50% in Baku and Sumgait (Azerbaijan) to more than 90% in the Flemish Community (Belgium), England (United Kingdom), Korea and the Netherlands. Enrolment in ECEC is generally not mandatory, with the exceptions of Ceará, Pará and São Paulo (Brazil) and the Flemish Community (Belgium), where it is compulsory from ages 4 and 5, respectively. Jurisdictions have also different models for the transition to primary schooling: in England (United Kingdom), Malta and the Netherlands, this occurs from age 4 or 5 through a change in cycle or a relocation to school-based settings, while in the rest of the jurisdictions most 5-year-olds continue to attend pre-primary ECEC settings and programmes classified as ISCED 02.
To characterise participation in ECEC among children in IELS 2025, this chapter relies on the rich information collected through Parent questionnaires about children’s attendance of different types or early care and education arrangements starting from birth up to the time of assessment at age 5. This information is used to identify the starting age and the number of years children attended ECEC programmes (either ISCED 01 or ISCED 02, or Reception in the case of England) prior to the school year in which they took part in IELS 20253. The chapter also draws on data about the number of hours that children attended ISCED 02 settings in the two school years prior to the assessment4
Box 6.1. An overview of the early education and care systems of the jurisdictions in IELS 2025
Baku and Sumgait (Azerbaijan)
Azerbaijan has an integrated ECEC governance system, with preschool education services for children aged 1-6 overseen by the Ministry of Science and Education which is responsible for curriculum, financing, monitoring and standard setting. ECEC participation in Azerbaijan is not mandatory. In 2024, the enrolment rate among children aged 3-5 was 50%.
Azerbaijan applies a unified Preschool Education Curriculum and State Standard for Preschool Education across all ECEC institutions for ages children aged 1 to 6 years. Content is structured by age groups with distinct standards for ages 1-2 and 2-3), the middle group (ages 3-4), the older group (ages 4-5), and the school preparation group (ages 5-6). Progression is sequential, moving from simpler to more complex learning: heightened expectations arise through the age-group progression within the unified framework. Literacy and numeracy are integrated as core components: literacy through language/communication development and pre-reading behaviours; numeracy through early number sense, measurement, sequencing and classification, aligned with school readiness expectations at ages 5-6.
The placement of children with special educational needs (SEN) is determined by a commission that reviews each child’s individual situation. Where inclusive settings exist, children with SEN attend the same educational environment as their peers. Where inclusive groups are not available, they attend specialised preschool institutions.
Ceará, Pará and São Paulo (Brazil)
The Brazilian ECEC system is integrated, with governance and responsibilities decentralised. The federal government sets national guidelines and provides technical and financial support, while states establish complementary rules and support municipalities, which are the main implementers and providers of ECEC services. ECEC is organised in two stages: creche/daycare (for children aged 0-3) and preschool (for children aged 4-5). While only the second stage is compulsory, since 2024 federal laws guarantee access to public ECEC for children aged 0-3 whose families apply for enrolment, with priority to children in vulnerable situations.
The National Common Core Curriculum (BNCC), approved in 2017, defines learning rights and goals across basic education, including ECEC. At the ECEC level, BNCC is organised around three age groups: infants (0-18 months), toddlers (19 months to 3 years) and preschoolers (4-5 years). Rather than adopting a subject-based structure, BNCC organises learning around five “fields of experience”, promoting transdisciplinary learning through play and interactions. States, municipalities and schools can adapt local curricula and pedagogical projects using BNCC as a reference. Literacy and numeracy are addressed through learning objectives embedded within these fields, with examples provided for each domain.
Brazil’s education policy emphasises inclusion of children with SEN in mainstream ECEC programmes. England (United Kingdom)
England’s early years education system operates under an integrated governance model, with overall responsibilities held by the Department for Education. Across provider types (school-based and groupbased childcare), early years provision is unified through a single statutory framework that all providers must follow.
ECEC is not compulsory in England. In practice, though, virtually all children start Reception (the first year of primary school) on a full-time basis in September after their fourth birthday (e.g. a child turning
4 in June typically start Reception that September). This means that the majority of children experience an early transition into the school system through the Reception year.
England has a single statutory framework covering the whole early years phase: the Early Years Foundation Stage (EYFS). This sets the standards that providers must meet in relation to learning, development and care from birth to age 5. EYFS is structured around seven areas of learning and development. Three “prime” areas - communication and language, physical development, and personal, social and emotional development - form the foundation, while four “specific” areas - literacy, mathematics, understanding the world, and expressive arts and design - extend and deepen learning. The EYFS applies until the end of Reception, that is, the school year in which children turn 5.
Children with SEN typically attend mainstream early years settings. When SEN is identified, providers must work in partnership with parents to agree on appropriate forms and modalities of support.
ECEC in the Flemish Community (Belgium) is governed through a split governance system. Provision for younger children (typically from birth to 2.5 years) falls under the responsibility of the Ministry of Welfare, Public Health and Family, while provision for older children (typically from 2.5 years) is overseen by the Ministry of Education and Training. This division results in distinct structures for childcare (within the welfare domain) and pre-primary (within the education domain), each operating under its own regulatory conditions and pedagogical expectations.
In Belgium (including the Flemish Community), compulsory education starts on 1 September of the calendar year in which a child turns 5. For five-year-olds, attendance typically requires at least 290 halfdays per school year. This requirement has been applied since the 2020-2021 school year when the minimum compulsory school age was lowered from 6 to 5.
All childcare settings are required, as part of their licensing conditions, to have a pedagogical policy that promotes children’s development across multiple domains and safeguarding their well-being and engagement. Childcare settings are also expected, under a best-efforts obligation, to implement a pedagogical framework that provides guidance on methods and processes. Pre-primary settings must follow a detailed set of standardised developmental goals describing minimum objectives by the end of pre-primary stage. These goals apply across all pre-primary education years, so age 4 and age 5 are not formal curricular transition points.
Many children aged 0-5 with SEN attend mainstream ECEC settings, supported through measures such as individualised arrangements and collaboration with external support services.
Korea’s ECEC system is in a transitional phase, shifting from a split governance model towards an integrated system under the Ministry of Education as single responsible authority. The integration of institutions, regulatory frameworks and teacher qualifications is an ongoing process.
Participation in ECEC is not mandatory. However, over 90% of children aged 3-5 are enrolled in either kindergartens or childcare centres, with basic tuition fees covered by the central government.
The Nuri curriculum is Korea’s unified curriculum framework for children aged 3-5 attending kindergartens, while a standard care framework applies for children aged 0-2 in childcare centres. Since 2019, Korea has moved away from rigid, age‐specific task divisions. Instead, the Nuri curriculum provides a transversal, play-centred framework for learning and development. Literacy is primarily addressed within the communication domain, emphasising listening and speaking skills, developing an interest in reading and writing, and enjoyment of books and stories.
There is less of an explicit emphasis on numeracy; however, early mathematical ideas are introduced across the several domains, such as exploration in everyday life.
SEN participation is shaped by both the availability of specialist provision and a strong nondiscrimination principle. Many parents of children with SEN choose to enrol their children in mainstream kindergartens or childcare centres.
Malta has an integrated ECEC system under the Ministry for Education, Youth, Sport, Research and Innovation. Policy and guidance cover the entire ECEC phase across childcare and early education, with national standards and a policy framework providing system-wide direction across ages 0-7.
ECEC in Malta is not compulsory but participation rates are high, with over 85% of children aged 3 and 5, the start of compulsory primary education, enrolled in ECEC.
Integrated curriculum guidelines and standards apply across ECEC stages. The National Standards for Early Childhood Education and Care Services apply to ages 0-3 (childcare), while the Early Childhood Education and Care National Policy Framework for Malta and Gozo apply to ages 0-7. Both frameworks are grounded in the Learning Outcomes Framework. A key transition occurs at age 5 when children enter compulsory schooling: while the ECEC curricular frameworks continue to apply, children also begin to follow subject guidelines delivered within a child-centred approach. Literacy and numeracy are taught across the curriculum, and schools attended by five-year-olds can benefit from additional support from national literacy programmes and mathematics support teachers.
Children with SEN generally attend mainstream ECEC settings. Parents may apply for an Early Intervention Service, which can be delivered either at home or within the childcare setting.
Netherlands
The Netherlands has a split ECEC system. For children aged 0-4, childcare falls under the responsibility of the Ministry of Social Affairs and Employment and is primarily framed as a social provision with a focus on care and supervision. No formal educational goals are defined for this phase, even though educational elements may be present in practice. As a result, childcare for this age group is not formally classified as ISCED. For ages 4-6, early education takes place in primary school kindergarten years governed by the Ministry of Education, Culture and Science. Further, targeted pre-primary education programmes classified as ISCED 02 are available for children approximately aged 2.5 to 4 who are considered at risk of language or developmental delays. These programmes are provided to by regular daycare centres.
Most children start primary school at age 4, but compulsory education begins at age 5, on the first school day of the month following the child’s fifth birthday. Before age 5, there is no compulsory enrolment in ECEC.
There is no unified national curriculum for ages 0-4 (childcare and pre-primary). Providers follow general pedagogical frameworks and, in pre-primary education, implement approved early education programmes, but without statutory learning goals. From age 4, children come under the national framework for primary education (ages 4-12), which establishes broad national learning objectives rather than a detailed curriculum for young children. The curriculum for age 4 and 5 is essentially the same (both are kindergarten years within primary school), while the main structural transition is between age 3 (pre-primary provision) and age 4 (entry into primary school). Literacy and numeracy at age 5 are framed as emergent literacy and early mathematical development, including oral language development, phonological awareness, number sense and pattern recognition
Children with SEN generally attend mainstream settings where feasible, with expected adaptations such as additional pedagogical support and collaboration with specialist services.
ECEC in the United Arab Emirates operates under a split governance model, with responsibilities distributed across several national ministries and, in some cases, emirate-level authorities. Kindergarten provision (typically covering ages 3-6) is overseen by the Ministry of Education, which is responsible for curriculum, standards and licensing. Nurseries/childcare (covering roughly ages 0-4) are licensed under the Ministry of Community Development. In addition, emirate-level entities may play a role in quality assurance and regulation, for example the Knowledge and Human Development Authority in Dubai or the Abu Dhabi Department of Education and Knowledge, contributing to local variation in oversight.
While enrolment in ECEC is not mandatory, participation rates are high, especially for children around age 5.
A national curriculum framework guides ECEC provision, particularly in kindergartens serving children aged 4-6. The kindergarten curriculum emphases holistic development, including early literacy, early numeracy and social and emotional skills, while promoting developmental continuity across ages 3-6. Expectations regarding literacy and numeracy increase modestly in the second year of kindergarten (around age 5) without any fundamental shift away from the holistic, play-based orientation of previous years. ECEC settings may adapt nationally standardised learning goals within approved frameworks. National policies promote the inclusion of children with SEN wherever possible, including attendance of mainstream ECEC settings with special supports.
Note: ECEC refers to early childhood education and care and encompass ISCED levels 01 and 02. SEN refers to special education needs. Source: Contextual questionnaire to IELS 2025 participating jurisdictions; see also Annex A
On average across jurisdictions, 55% of the children in IELS 2025 – who, by design, are all enrolled in either a pre-primary (ISCED 02) or school setting at age 55 – started attending formal and regulated ECEC services before age 3 (Table B.6.1). This group includes 24% of children first enrolled at age 2 – the most common starting age, on average – as well as 15% of children first enrolled at age 1 and 17% of children enrolled during their first year of life.
Among the large minority of children in the study who started attending ECEC/school later, 18% of children started at age 3, 17% started at age 4, and 9% started at age 5. This translates into an average experience in ECEC/school of more than 2.5 years by the time of assessment (Table B.6.2). Cumulatively, and on average across jurisdictions, almost a third of all the children in IELS 2025 (31%) were attending ECEC/school by age 1, more than half (55%) were attending by age 2, over seven in ten (71%) were attending by age 3, and over eight in ten (84%) were attending by age 4. Conversely, about one in six (16%) children first enrolled in formal and regulated early education services the same school year in which they took part in the study (Tables B.6.1 and B.6.2).
Reflecting their diverse institutional and social contexts, jurisdictions vary markedly in the typical age at which children started attending formal and regulated ECEC or early schooling (Figure 6.1). For instance, 70% of children in the Flemish Community (Belgium) and close to 20% of children in both England (United Kingdom) and Malta started attending ECEC before turning 1, while in other jurisdictions less than 5% of children participated in ECEC at that age. Meanwhile, close to 30% of children in Korea started attending ECEC at age 1, making it one of the two jurisdictions (with the Flemish Community (Belgium)) where more
than half of children in IELS 2025 were attending ECEC by that age. At the other end, the share of children who enrolled in ECEC for the first time at ages 4 or 5 is highest in the United Arab Emirates (more than 50%) and in Baku and Sumgait (Azerbaijan) and Ceará, Pará and São Paulo (Brazil) (more than 28%, in both cases). The Netherlands represents a special case: analyses based on the ISCED classification suggest the majority of children in IELS 2025 started their formal early education at age 4; however, large shares of children of younger ages are enrolled in programmes not formally classified as ISCED6
As a result of these varied participation patterns, the average duration of attendance of formal and regulated ECEC or initial years of primary schooling by the time of assessment in IELS 2025 differed substantially across jurisdictions. The longest attendance, at over 4 years, was observed among children in the Flemish Community (Belgium); intermediate durations, between 3 and 4 years were observed in England (United Kingdom), Korea and Malta; and the shortest average durations, below 2.5 years, were observed among children in Baku and Sumgait (Azerbaijan), Ceará, Pará and São Paulo (Brazil), the Netherlands and the United Arab Emirates (Table B.6.2).
Figure 6.1. Starting age of participation in ECEC/school
Percentage of children by starting age of attendance of an ISCED 01 or ISCED 02 programme, or the initial years of primary education at ages 4 or 5
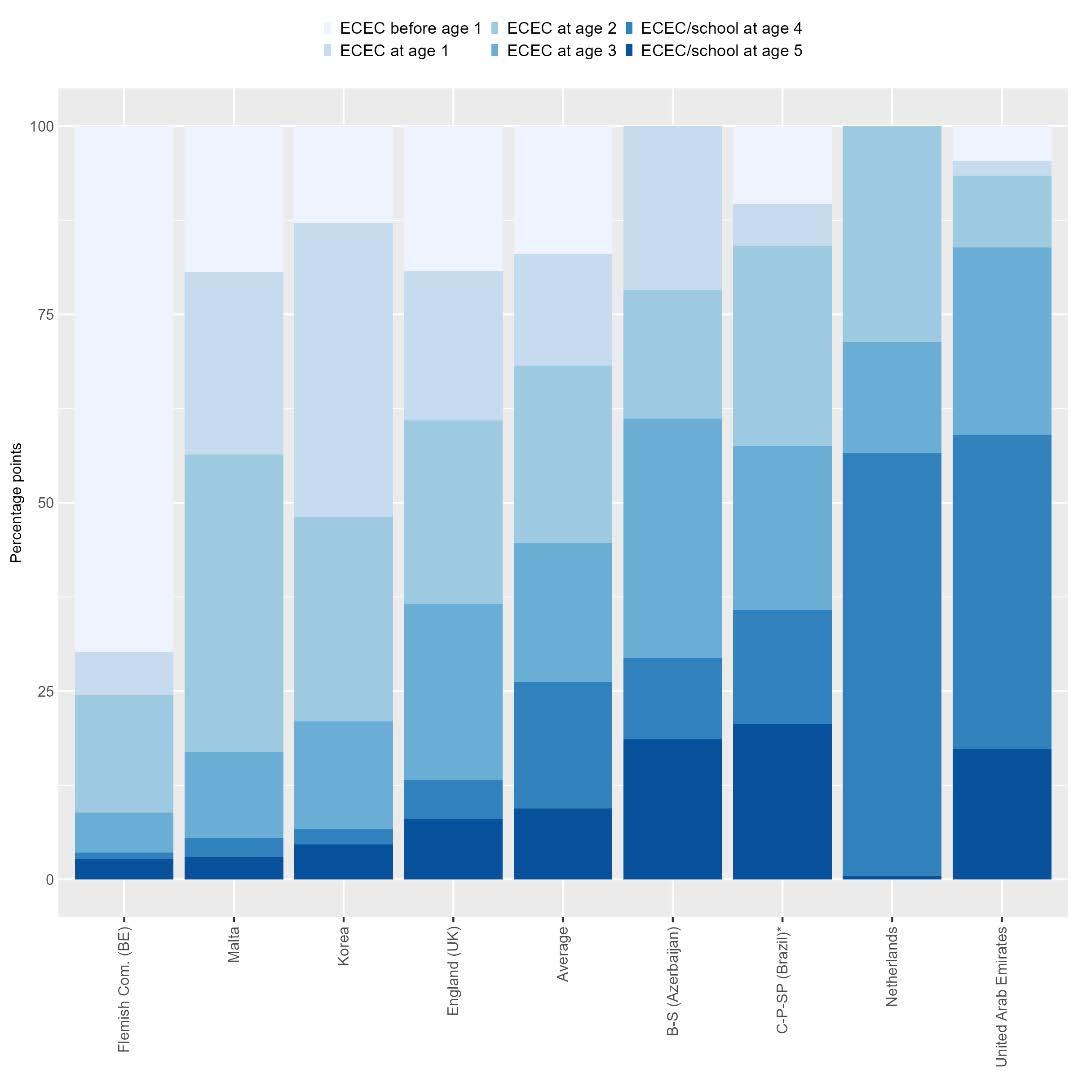
Note: *Estimates for Brazil correspond to the average across the three participating states ECEC refers to formal and regulated services meeting the criteria for ISCED level 0 educational programmes. By design, by the time of assessment at age 5, all children in IELS 2025 are enrolled in either a pre-primary (ISCED 02) programme or in the initial years of primary school, depending on the jurisdiction
Source: OECD, IELS 2025 Database, Table B.6.2
Aggregate patterns of participation in ECEC/school mask substantial variation between children from different socio-economic groups. On average across jurisdictions, by age 5, children from socioeconomically advantaged backgrounds had attended formal and regulated ECEC for between 4 and 5 months longer than their disadvantaged peers. In the Flemish Community (Belgium), this difference amounted to more than one year, while in England (United Kingdom) and the United Arab Emirates it was of 6 months or longer. By contrast, in Baku and Sumgait (Azerbaijan), Ceará, Pará and São Paulo (Brazil) and Korea, there were no statistically significant differences in the average length of ECEC/school attendance between the two groups. The Netherlands stands out as the only jurisdiction where disadvantaged five-year-olds had attended ISCED-classified programmes for longer than their advantaged peers, by about 3 months (Table B.6.2). Overall, though, socio-economic gaps in length of participation in ECEC may be underestimated in some jurisdictions, particularly in contexts where overall enrolment rates at age 5 remain relatively low7
Importantly, these socio-economic gaps emerge at different ages across jurisdictions, reflecting differences in typical starting ages of participation in ECEC/school. Socio-economic differences in enrolment rates are already pronounced by age 1 in England (United Kingdom), the Flemish Community (Belgium) and Malta, where the percentage of children who started to attend ECEC by that age is between 10 and 30 points higher among socio-economically advantaged than among disadvantaged children. Meanwhile, in jurisdictions with a typical later starting age, such as the United Arab Emirates, these differences become visible only by ages 2 and 3. By contrast, in the Netherlands, a higher proportion of disadvantaged children (49%) than advantaged children (38%) had enrolled in ECEC by age 3, in line with targeted policies that make children identified as being at risk eligible for additional (subsidised) hours of early childhood provision (Table B.6.2).
Moreover, among children participating in ECEC, socio-economic gaps are evident in several jurisdictions regarding the intensity of participation, measured by the number of hours that children attended preprimary (ISCED 02) settings at ages 3 and 4. For instance, in the Flemish Community (Belgium), England (United Kingdom) and Korea, the percentage of both three- and four-year-olds attending pre-primary education for more than 30 hours a week is at least seven points higher among socio-economically advantaged children than among disadvantaged children. Inversely, in Malta and the United Arab Emirates, socio-economically disadvantaged children, attend pre-primary settings for more hours per week, at both ages. Overall, however, average differences in the intensity of participation are relatively small (Table B.6.3).
Taken together, the patterns of participation in ECEC among children in IELS 2025 align with evidence from many European OECD countries showing socio-economic differentials in access to, and intensity of participation in regulated ECEC services (OECD, 2025[7]). Results therefore show that, by the time of the IELS 2025 assessment, in most jurisdictions, exposure to ECEC had been greater for children from socioeconomically advantaged families than for peers from less advantaged backgrounds
IELS provides a unique opportunity to examine, from a comparative perspective, how five-year-old children’s participation in ECEC and the initial year of primary schooling is associated with early skills development. In this chapter, this relationship is illustrated through associations between their scores in the early learning and development domains assessed in IELS 2025 i) the number of years that they attended ECEC or primary school (Figure 6 2) and ii) different categories of starting age of enrolment (Figure 6.3).
Figure 6.2. Association between years in ECEC/school and five-year-olds’ early learning and development outcomes
Score-point difference in foundational learning, executive function, and social and emotional development domains associated with an additional year of ECEC/school, before and after accounting for socio-economic status
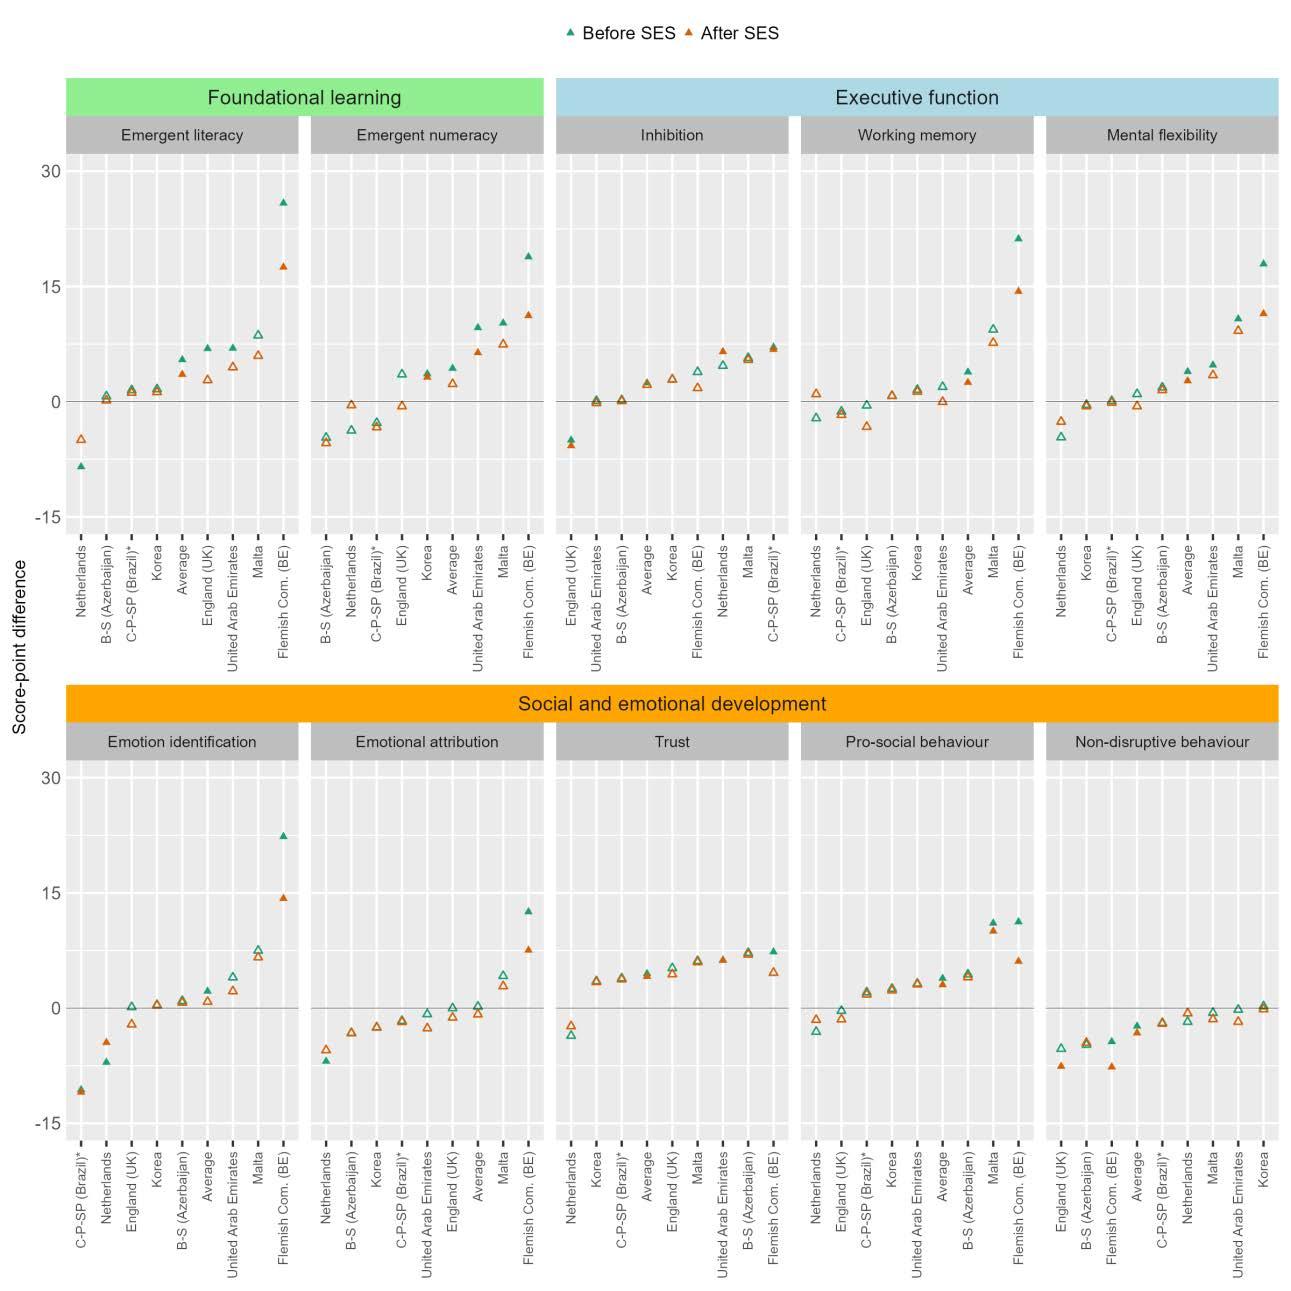
Note: *Estimates for Brazil correspond to the average across the three participating states ECEC refers to formal and regulated services meeting the criteria for ISCED level 0 educational programmes By design, by the time of assessment at age 5, all children in IELS 2025 are enrolled in either a pre-primary (ISCED 02) programme or in the initial years of primary school, depending on the jurisdiction Socio-economic background as measured by the IELS index of socio-economic status (SES). Solid triangles indicate statistically significant differences For more information, see the IELS 2025 Technical Report (OECD, 2026[8]) Jurisdictions ranked in ascending order of the score-point difference associated with an additional year of ECEC/school in each domain.
Source: OECD, IELS 2025 Database, Tables B.6.4, B.6.5 and B.6.6.
The association between children’s length of attendance in ECEC/school – as captured by a linear measure of years of attendance – and their early learning and development outcomes at age 5 is generally positive but weak in terms of statistical significance, particularly after accounting for socio-economic background (Figure 6 2). The estimated association can be interpreted as the effect of an additional year of attendance in ECEC/school relative to the average duration of attendance in each jurisdiction, providing a conservative yet context-tailored estimate of such impact. This approach reflects that an additional year of ECEC may have different implications depending on the typical experience of children within a jurisdiction.
This relationship is marginally stronger in the foundational learning domains of emergent literacy and emergent numeracy, where an additional year of ECEC is associated, on average, with an increase of about 5 points in scores, before considering children’s socio-economic status. Similar results apply to a subset of executive function and social and emotional development domains, including working memory, mental flexibility, trust and pro-social behaviour. By contrast, the association is negative for scores in nondisruptive behaviour.
Across many domains of assessment, the magnitude of the association tends to be stronger in jurisdictions where children have, on average, attended ECEC/school for longer periods (i.e. over three years) by the time of assessment. This pattern is most evident in the Flemish Community (Belgium) and Malta. Inversely, associations with child outcomes are more often negative, albeit only occasionally statistically significant, in jurisdictions where children’s average experience in ECEC is shorter (less than two and a half years). Yet, there are notable exceptions to this pattern such as the United Arab Emirates, where associations are often relatively strong despite a comparatively short average length of attendance in ECEC (Tables B.6.2, B.6.4, B.6.5 and B.6.6). Overall, across domains and jurisdictions, low levels of statistical significance characterise associations between children’s scores and this measure of participation in ECEC/school.
Analyses based on the number of years children attended ECEC/school are, however, subject to some limitations. One key shortcoming is the implicit assumption of linearity, where each additional year of attendance is assumed to have the same marginal impact on children’s outcomes. This assumption may not align with the structure of ECEC programmes, particularly at the pre-primary level, which often consist of multi-year cycles with distinct organisational and curricular features (see Box 6 1) which can contribute to quality differences. In this context, associations between participation in ECEC/school and child outcomes may become more visible after children attend these programmes for a certain period of time that corresponds to more meaningful transitions within ECEC systems.
To examine this hypothesis, Figure 6 3 shows differences in foundational learning outcomes between children in different categories defined by the age of entry into ECEC/school prior to age 5. This analysis looks at two different transitions which arguably capture important differentiation points in ECEC participation patterns. In jurisdictions where children’s average duration of attendance in ECEC/school is longer – namely the Flemish Community (Belgium), England (United Kingdom), Korea and Malta – the outcomes of children who started attending ECEC at ages 0 or 1 are compared to those of children who started attending at ages 2 or 3. In these four jurisdictions, children in these two categories represent over 85% of the children in IELS 2025. Meanwhile, in jurisdictions where average attendance of ECEC/school is shorter – namely Baku and Sumgait (Azerbaijan), Ceará, Pará and São Paulo (Brazil), the Netherlands and the United Arab Emirates – the comparison is made between the scores of children who started attending ECEC at ages 2-3 and those who started attending at ages 4 or 5. In these four jurisdictions, these two groups account for over 75% of the children in the study.
Results from these comparisons provide further insights into the association between length of participation in ECEC/school and children’s early learning and development outcomes by age 5. Among jurisdictions where children’s average attendance of ECEC/school is longer (Figure 6 3: left panels), children who first enrolled at ages 0 or 1 have higher scores in emergent literacy and emergent numeracy than children who first enrolled at ages 2 or 3 in both the Flemish Community (Belgium) and England (United Kingdom), and
in emergent literacy in Malta as well. These differences range from 10 to 25 score points and remain statistically significant after accounting for children’s socio-economic backgrounds. In Korea, by contrast, no differences exist between these two groups of children (Table B.6.7)
Figure 6.3. Association between earlier starting ages of attendance of ECEC/school and five-yearolds foundational learning domains
Score-point difference in emergent literacy (top panels) and emergent numeracy (bottom panels) associated with starting ECEC at ages 0 or 1, compared to ages 2 or 3 (left panels), and associated with starting ECEC/school at ages 2 or 3, compared to ages 4 or 5 (right panels), before and after accounting for socio-economic status
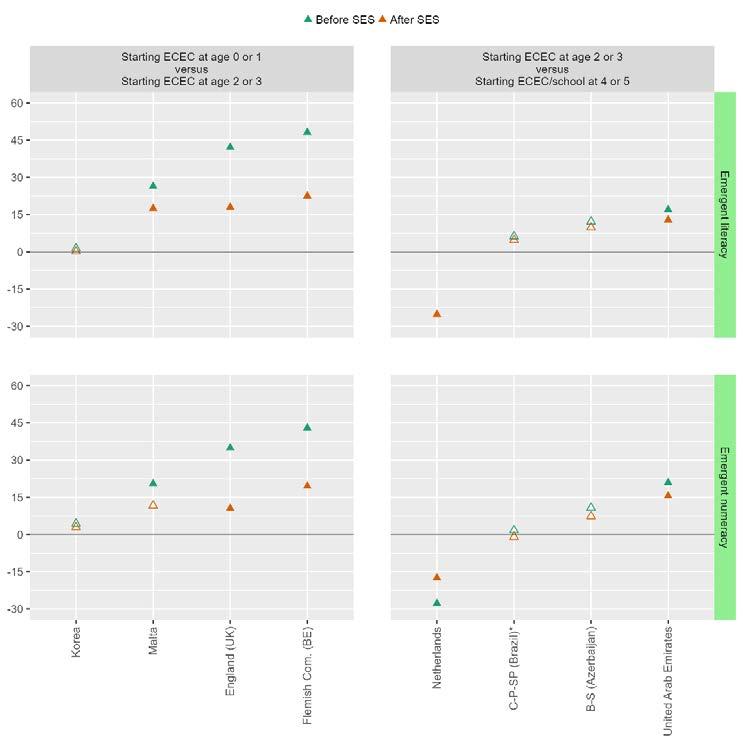
Note: *Estimates for Brazil correspond to the average across the three participating states ECEC refers to formal and regulated services meeting the criteria for ISCED level 0 educational programmes By the time of assessment at age 5, all children in IELS 2025 are enrolled in either a pre-primary (ISCED 02) programme or in the initial years of primary school, depending on the jurisdiction. Specific transitions (starting ages “0 or 1” compared to “2 or 3”; and “2 or 3” compared to “4 or 5”) are analysed depending on children’s average length of participation in ECEC/school in each jurisdiction. Socio-economic background as measured by the IELS index of socio-economic status (SES). Solid triangles indicate statistically significant differences. For more information, see the IELS 2025 Technical Report (OECD, 2026[8]) Jurisdictions ranked in ascending order of the score-point difference associated with an earlier starting age of ECEC/school
Source: OECD, IELS 2025 Database, Table B.6.7
Among jurisdictions where children tend to participate in ECEC/school for a shorter time before age 5 (Figure 6 3: right panels), earlier enrolment at ages 2-3 is also positively associated with children scores in emergent literacy and emergent numeracy compared to a later start at ages 4 or 5 in three jurisdictions,
although statistically significant in the United Arab Emirates only, with a magnitude of between 12 and 16 score points after accounting for socio-economic status. Meanwhile, this relationship has the opposite sign in the Netherlands, where children who started attending ECEC at younger ages appear to have lower scores in both domains than children who first enrolled for age 4; this result may reflect an overrepresentation of vulnerable children in ECEC programmes at younger ages8 (Table B.6.7)
Differences in children’s outcomes associated with the timing of entry into ECEC or school are generally smaller in the domains of executive function and social and emotional development than in foundational learning. However, in several jurisdictions, patterns are broadly consistent with those observed for emergent literacy and numeracy. For instance, in the Flemish Community (Belgium), earlier participation in ECEC from ages 0 or 1, compared with starting at ages 2 or 3, is statistically significantly associated with higher children’s scores in working memory, mental flexibility, emotion identification, trust and prosocial behaviour, and with lower scores in non-disruptive behaviour. Similar patterns are observed in Malta, where earlier entry into ECEC is associated with higher children’s scores in inhibition, working memory, trust and pro-social behaviour. In turn, regarding differences between children who first enrolled in ECEC/school at ages 2 or 3, compared to ages 4 or 5, children in the earlier enrolment group show higher scores in the domains of inhibition, trust and pro-social behaviour in Ceará, Pará and São Paulo (Brazil) By contrast, in the Netherlands they have lower scores in mental flexibility, emotion identification, emotional attribution, trust and pro-social behaviour (Tables B.6.8 and B.6.9).
Socio-economic variation in the association between ECEC/school and children’s outcomes
An important consideration for early education policies is whether participation in ECEC and early schooling contributes to reducing early inequalities in children’s learning and development outcomes, particularly between children from different socio-economic backgrounds. Analyses in this report find no evidence that the association between the number of years of ECEC/school attendance and children’s outcomes by age 5 is different for socio-economically advantaged and disadvantaged children, based on a comparison of the strength of this association between the two groups of children in the emergent literacy and emergent numeracy domains (Figure 6 4).
Results suggests that gains in emergent literacy and emergent numeracy from an additional year of ECEC/school could be marginally smaller (i.e. a negative score-point difference in Figure 6 4) for socioeconomically disadvantaged children than for advantaged peers in jurisdictions such as England (United Kingdom), the Flemish Community (Belgium), Korea and the United Arab Emirates, while gains could be larger (i.e. a positive score-point difference in Figure 6.4) in jurisdictions such as Baku and Sumgait (Azerbaijan) and Malta. However, none of these differences reach conventional levels of statistical significance, precluding any clear interpretations about the potential differential impacts of the length of participation in ECEC for diverse groups of children based on IELS 2025 data.
Figure 6.4. Variation in the association between years in ECEC/school and five-year-olds’ foundational learning outcomes, by socio-economic background
Score-point difference in the association between an additional year of ECEC/school and foundational learning domains for socio-economically disadvantaged children, relative to the association for advantaged children
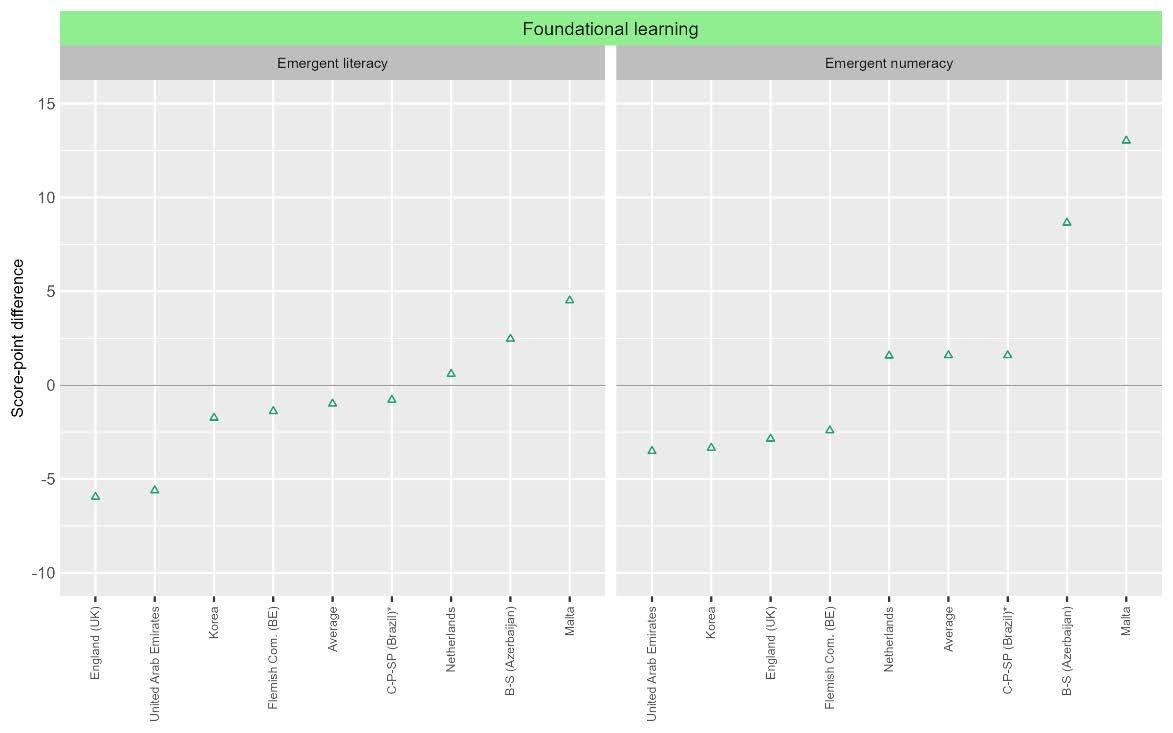
Note: *Estimates for Brazil correspond to the average across the three participating states ECEC refers to formal and regulated services meeting the criteria for ISCED level 0 educational programmes By the time of assessment at age 5, all children in IELS 2025 are enrolled in either a pre-primary (ISCED 02) programme or in the initial years of primary school, depending on the jurisdiction. Socio-economically disadvantaged children are those in the bottom quartile of the distribution of the IELS Index of socio-economic status within their jurisdictions; advantaged children are those in the top quartile of the distribution. Socio-economic background as measured by the IELS index of socio-economic status (SES). Solid triangles indicate statistically significant differences; hollow triangles indicate differences are not statistically significant. For more information, see the IELS 2025 Technical Report (OECD, 2026[8])
Source: OECD, IELS 2025 Database, Table B.6.10.
Overall, results in this section, looking both at the number of years that children attended ECEC/school (Figure 6.2) and at specific starting age categories (Figure 6.3), indicate that longer experiences in early care and education programmes tend to be positively associated with early learning and development outcomes by age 5. This association holds in many but not all of the jurisdictions in IELS 2025 and is more consistent with foundational learning outcomes than with executive function and social and emotional development outcomes, while being often negative with disruptive behaviour.
These results can be seen as broadly consistent with the generally small average effects of ECEC on child early learning and development outcomes reported in the research literature, particularly in the absence of good indicators of the quality of ECEC or early schooling (e.g. (Camilli et al., 2010[9]) (Melhuish et al., 2015[10]) (Duncan et al., 2023[11]) (von Suchodoletz et al., 2023[12])). This literature also documents a stronger relationship of ECEC experiences with emergent literacy and emergent numeracy than with other development domains, which may reflect the deliberate intent to develop these more academic skills in the ECEC curriculum frameworks of participating jurisdictions (see Box 6 1).
Findings from IELS 2025 are less closely aligned with external evidence suggesting that high-quality ECEC can be particularly beneficial for disadvantaged children (e.g. (Melhuish et al., 2015[10]) (Duncan et al., 2023[11])). However, the absence of a statistically significant differential impact of ECEC by children’s socioeconomic status in IELS 2025 (Figure 6 4), when combined with other results, can provide insights about
whether ECEC and early schooling are helping to mitigate or reinforce inequalities in early learning and development in participating jurisdictions. Children from socio-economically advantaged backgrounds tend, on average, to have longer experiences in ECEC/school than disadvantaged peers. Given the general positive association between participation and children’s outcomes, the fact that gains appear independent of children’s socio-economic backgrounds suggests that ECEC and early schooling may not, overall, have the opportunity to reduce socio-economic gaps in those outcomes. In several jurisdictions, a larger proportion of children from low socio-economic status families did not attend ECEC prior to age 5 or started attending later compared to their advantaged peers, thereby limiting the opportunities for ECEC to mitigate early gaps during those years. These results, therefore, suggest that disadvantaged children may not be able to catch up with peers from advantaged backgrounds through their attendance in ECEC/school, in part because they participate less in these programmes
Divergences from findings of previous studies of universal pre-primary education may partly be due to greater access to ECEC and early schooling in many of the jurisdictions in IELS 2025, compared to past cohorts of children in similar or other contexts. Contemporary early education systems have become more inclusive of children with more diverse backgrounds, which may affect the observed associations between participation in ECEC/school and the early learning and development outcomes measured in IELS. Further, the generally greater emphasis placed on quality in today’s early education systems may mean that all children – and not only disadvantaged children with less favourable home learning environments –are now benefiting more from ECEC and early schooling participation than in the past.
Meanwhile, the positive associations observed for very early starting ages (0 or 1) and the absence of negative associations in several jurisdictions in IELS 2025 can also be interpreted positively. These results may reflect system-level investments and regulations in England (United Kingdom), the Flemish Community (Belgium), Korea and Malta that may be ensuring adequate quality services for very young children Further analysis incorporating more detailed information on the quality of different types of ECEC/school services and on the experiences of children who do not attend ECEC would be instrumental in evaluating these findings.
Across countries, growing diversity among young children participating in ECEC has become a defining feature of these systems. This trend is shaped by the expansion and improved accessibility of ECEC services, as well as rising global migration and forced displacement (OECD, 2025[7]). Increasing social and cultural diversity requires inclusive ECEC systems that respond to a broader range of needs from children and families. Inclusion focuses on adapting education systems to meet each child’s needs, rather than expecting children, and particularly those experiencing challenges, to conform to existing structures and practices (OECD, 2023[13]) Inclusive practices to promote children’s early learning and development can take the form of tiered models of support, tailoring the intensity and type of support measures according to the level of need of individual children or early education settings (OECD, 2025[7])
ECEC policies can beneficially combine general education and care services with the provision of targeted supports for some young children. In 12 out the 15 ECEC systems participating in the TALIS Starting Strong 2024 survey at the pre-primary level, and in 5 out of 8 systems at the level of settings for children under age 3, over 66% of setting leaders reported that children with special learning needs were enrolled in their settings (OECD, 2025[14]). In all the jurisdictions participating in IELS 2025, policies determine that young children with special education needs should generally attend regular ECEC settings, which are in turn expected to adapt provision with extra pedagogical support, targeted programmes, and work with specialist services (see Box 6 1).
IELS 2025 asked parents whether their child had ever experienced a number of issues or difficulties, which are conceptualised as risk factors negatively associated with children’s early learning and development9
(OECD, 2022[15]). These include whether their child was premature or had a low birthweight (i.e. lower than 2 500 gr); hearing or vision difficulties that cannot he corrected by a hearing aid or glasses); mobility difficulties; learning difficulties (e.g. speech or language delay, intellectual disability); or social, emotional or behavioural difficulties.
In addition, IELS 2025 asked the ECEC staff who knew the child best in the ECEC centres/school to provide information about different types of additional supports or services that the child had received. These included speech therapy; physiotherapy or occupational therapy; psychological or behavioural management support; learning support (e.g. as provided by assistant staff); and support with the language of assessment as the child’s second language. Since reported by ECEC teachers aware of them, these supports are likely to be provided through or at least in co-ordination with the ECEC centre/school attended by the child.
This section combines information from parental and ECEC teacher reports to describe the prevalence of different types of early difficulties and the provision of special supports among children in IELS 2025. Additionally, it examines support with the language of assessment among children who primarily speak another language at home. This perspective aligns with a shift from disability-focused special education to inclusive early education approaches that no longer require clinical labels or a formal diagnosis to provide targeted support to young children.
On average across jurisdictions, about one in ten children in IELS 2025 are reported by their parents to have been born prematurely or with low birth weight, and similar proportions are reported to have experienced learning difficulties or social, emotional or behavioural difficulties by the time of assessment. By contrast, less than 2% of children in the study are reported to have experienced sensory (hearing or vision) or mobility difficulties, on average (Table B.6.11).
While the prevalence of premature and low-weight births is remarkably similar across jurisdictions, there are large differences in the reported prevalence of early learning and early social, emotional or behavioural difficulties. For instance, about three times as many children are reported to have experienced early learning difficulties in Ceará, Pará and São Paulo (Brazil) and in Malta compared to Korea, the Netherlands or the United Arab Emirates (Table B.6.11). This may reflect variation in how parents understand and define these situations across jurisdictions, but also associations with socio-economic conditions. Parents can have accurate perceptions of children’s learning challenges, which tend to be more frequent among children from disadvantaged backgrounds (Han et al., 2024[16]). Among the jurisdictions in IELS 2025, child poverty rates were at least twice as high in Ceará, Pará and São Paulo (Brazil) and Malta as they were in Korea or the Netherlands (see Annex A).
In the same vein, the within-jurisdiction prevalence of these difficulties, as reported by parents, varies significantly by socio-economic background (Table B.6.12). On average, the percentage of children from disadvantaged families reported to have experienced early learning or social, emotional and/or behavioural difficulties is twice as large as among children from advantaged backgrounds, with these differences being more pronounced in England (United Kingdom) and in the Flemish Community (Belgium). Moreover, in many jurisdictions, the percentage of children speaking a different language at home is also higher among socio-economically disadvantaged children, although in Baku and Sumgait (Azerbaijan) or the United Arab Emirates the reverse pattern holds.
Overall, results indicate that five-year-olds from low socio-economic backgrounds are also more likely to experience other risk factors that compound their level of disadvantage towards achieving strong early learning and development outcomes. The accumulation of socio-economic deprivation with other early challenges may play a role in explaining why the impact of ECEC on children’s outcomes is attenuated when population-level analyses take into account children’s socio-economic backgrounds.
Different types of additional supports to sustain early learning and development were provided to the children in IELS 2025. Across jurisdictions, the most frequent of these is targeted learning support, which 19% of children, on average, and between 29% and 46% of children in Baku and Sumgait (Azerbaijan), England (United Kingdom) and the Flemish Community (Belgium). On average, about 28% of the children in the study received some type of special support other than support with the language of assessment (Table B.6.13).
Figure 6 5 shows that, in most jurisdictions, children who are reported to have experienced early learning or early social, emotional or behavioural difficulties are more likely to also have received additional supports to address those difficulties. On average, across four types of supports, this percentage is 35 percentage points higher among children having experienced early challenges. Similarly, children primarily speaking a different language at home are generally more likely to have received additional support with the language of instruction in their ECEC centres than children speaking the same language at home; on average, this difference is of 22 percentage points. Results, therefore, suggest that, across jurisdictions in IELS 2025, additional supports provided in the context of ECEC services are adequately targeting children exposed to these risk factors.
Association between additional supports and early learning and development outcomes
In virtually all cases and jurisdictions, children having received additional supports have significantly lower average scores in the ten domains of early learning and development assessed in IELS 2025 as compared to children having not received such supports (Tables B.6.14, B.6.15 and B.6.16). This is expected in contexts in which supports effectively target children who more often experience early learning and social, emotional or behavioural difficulties, and who more often come from disadvantaged backgrounds.
Importantly, when the comparison is restricted to children reported to have experienced early difficulties, the scores of children having received additional supports are also lower than those of children who did not receive those supports (Tables B.6.14, B.6.15 and B.6.16). The same result applies to the provision of special support with the language of assessment among children with a different home language with regard to scores in the early literacy and numeracy domains (Table B.6.17). Albeit IELS 2025 data does not allow to distinguish the severity of different types of early difficulties or challenges with the language of assessment, these findings likely reflect selection effects by which these additional supports are provided to the children experiencing the greater challenges.
Percentage of children receiving additional supports by experience of early learning and behavioural difficulties, and by language spoken at home
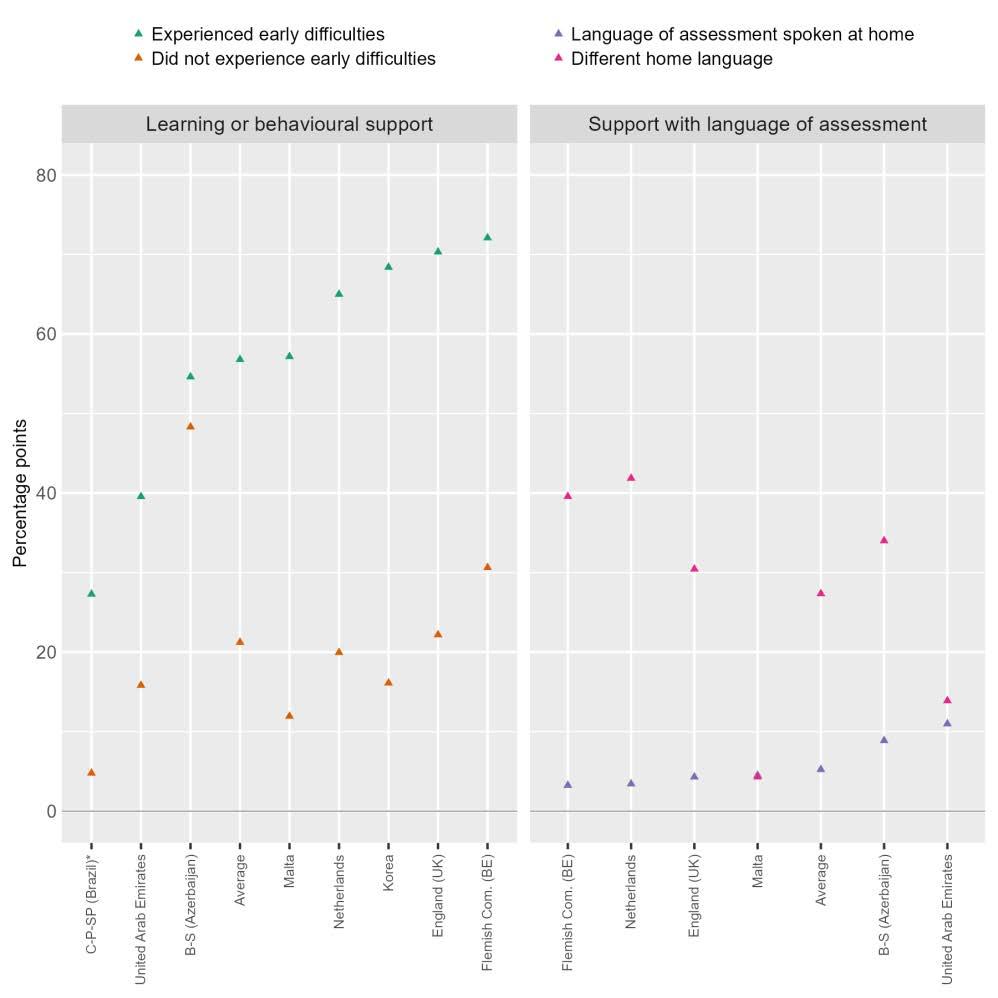
Note: *Estimates for Brazil correspond to the average across the three participating states. Results in the left panel refer to learning support and psychological or behavioural management support, comparing children who have and have not experienced learning or social, emotional and behavioural difficulties. Results in the right panel refer to support with the language of assessment, comparing children who primarily speak the same or a different language at home. For more information, see the IELS 2025 Technical Report (OECD, 2026[8]).
Source: OECD, IELS 2025 Database, Table B.6.13
Figure Title
Figure 6.1 Starting age of participation in ECEC/school
Figure 6.2 Association between years in ECEC/schools and five-year-olds’ early learning and development outcomes
Figure 6.3 Association between earlier starting ages of attendance of ECEC/school and five-year-olds foundational learning domains
Figure 6.4 Variation in the association between years in ECEC/school and five-year-olds’ foundational learning domains, by socioeconomic background
Figure 6.5 Additional supports among different groups of children
StatLink2 https://stat.link/ubzesa
Camilli, G. et al. (2010), “Meta-Analysis of the Effects of Early Education Interventions on Cognitive and Social Development”, Teachers College Record: The Voice of Scholarship in Education, Vol. 112/3, pp. 579-620, https://doi.org/10.1177/016146811011200303
Duncan, G. et al. (2023), “Investing in early childhood development in preschool and at home”, in Handbook of the Economics of Education, Elsevier, https://doi.org/10.1016/bs.hesedu.2022.11.005
Han, T. et al. (2024), “Early onset and increasing disparities in neurodevelopmental delays from birth to age 6 in children from low socioeconomic backgrounds”, Journal of Neurodevelopmental Disorders, Vol. 16/1, https://doi.org/10.1186/s11689-024-09577-2
List, J. and H. Uchida (2024), Here Today, Gone Tomorrow? Toward an Understanding of Fadeout in Early Childhood Education Programs, National Bureau of Economic Research, Cambridge, MA, https://doi.org/10.3386/w33027
Liu, S. (ed.) (2023), “Early childhood education and care quality and associations with child outcomes: A meta-analysis”, PLOS ONE, Vol. 18/5, p. e0285985, https://doi.org/10.1371/journal.pone.0285985 [12]
Melhuish, E. et al. (2015), A review of research on the effects of Early Childhood Education and Care (ECEC) upon child development, https://ececcare.org/fileadmin/careproject/Publications/reports/new_version_CARE_WP4_D4_1_Review _on_the_effects_of_ECEC.pdf (accessed on 4 February 2026).
Molloy, C. et al. (2019), “Potential of ‘stacking’ early childhood interventions to reduce inequities in learning outcomes”, Journal of Epidemiology and Community Health, Vol. 73/12, pp. 10781086, https://doi.org/10.1136/jech-2019-212282.
Murano, D., J. Sawyer and A. Lipnevich (2020), “A Meta-Analytic Review of Preschool Social and Emotional Learning Interventions”, Review of Educational Research, Vol. 90/2, pp. 227263, https://doi.org/10.3102/0034654320914743
OECD (2026), IELS 2025 Technical Report, http://oecd.org/en/about/projects/international-earlylearning-and-child-well-being-study
OECD (2025), Reducing Inequalities by Investing in Early Childhood Education and Care, Starting Strong, OECD Publishing, Paris, https://doi.org/10.1787/b78f8b25-en
OECD (2025), Results from TALIS Starting Strong 2024: Strengthening Early Childhood Education and Care, TALIS, OECD Publishing, Paris, https://doi.org/10.1787/20af08c0-en
OECD (2023), Equity and Inclusion in Education: Finding Strength through Diversity, OECD Publishing, Paris, https://doi.org/10.1787/e9072e21-en
OECD (2022), Improving Early Equity: From Evidence to Action, OECD Publishing, Paris, https://doi.org/10.1787/6eff314c-en.
OECD (2021), Starting Strong VI: Supporting Meaningful Interactions in Early Childhood Education and Care, Starting Strong, OECD Publishing, Paris, https://doi.org/10.1787/f47a06ae-en
OECD (2018), Engaging Young Children: Lessons from Research about Quality in Early Childhood Education and Care, Starting Strong, OECD Publishing, Paris, https://doi.org/10.1787/9789264085145-en
Prenatal-to-3 Policy Impact Center (2024), Prenatal-to-3 policy clearinghouse evidence review: Early Intervention Services, https://pn3policy.org/policyclearinghouse/early-interventionservices/ (accessed on 18 February 2026).
[6]
[5]
1 The analysis presented in this chapter rely strongly on information from Parent questionnaires. Given low response rates in some jurisdictions, readers are advised to interpret results with caution See Annex B and the IELS 2025 Technical Report (OECD, 2026[8]) for more information.
2 The International Standard Classification of Education (ISCED) is the reference classification for organising education programmes and related qualifications by education levels and fields (UNESCO-UIS/ OECD/European Union). In ISCED 2011, level 0 covers early childhood education for all ages, including very young children. As the educational properties of ISCED 0 programmes can be difficult to assess directly, several criteria are used to come up with a technical definition. For a programme to be reported as ISCED level 0 it must have: adequate intentional educational properties; be delivered by qualified staff members; take place in an institutionalised setting; meet a minimum intensity/duration; and be targeted at children from age 0 until entry into ISCED level 1. Programmes classified at ISCED level 0 may be referred to in many ways nationally, for example: early childhood education and development, play school, reception, pre-primary, preschool, Kindergarten, Kita, Krippe or Educación inicial. For programmes provided in crèches, day-care centres, private homes, nurseries, Tagespflege or Guarderías, it is important to ensure that they meet the ISCED level 0 classification criteria. ISCED level 0 programmes are subclassified into two categories depending on age and the level of complexity of the educational content: early childhood educational development (ISCED 01), typically aimed at very young children, aged 0‐2; and pre-primary education (ISCED 02), aimed at children in the years immediately prior to starting compulsory schooling, typically aged 3‐5
3 Each child’s number of years in formal ECEC prior to the school year of the IELS 2025 assessment was calculated based on parental reports about whether the child attended a national ECEC option classified as ISCED 01 or ISCED 02 at ages 0, 1 and 2, and national ECEC options classified as ISCED 02 at ages 3 and 4. In line with the design of the study, all participating children are assumed to be enrolled in either a pre-primary (ISCED 02) or school setting by age 5, at the time of assessment. The starting age of participation in formal ECEC refers to the earliest age at which the child’s parent reports his or her enrolment in an ISCED Level 0 programme.
4 Analyses in this chapter omit information about the current school year due to a high number of missing responses in several jurisdictions and comparability problems. Intensity of participation is therefore measured prior to the school year of the IELS 2025 assessment.
5 A share of five-year-olds may not yet be enrolled education services (ISCED 02 or school settings); therefore, caution is needed when extrapolating to the overall population of five-year-olds in each
jurisdiction. However, enrolment rates in ECEC/school for children aged 3-5 are high in most participating jurisdictions; see Annex A.
6 Analyses in this report, based on ISCED-classified programmes, likely underestimate actual participation rates in formal and regulated ECEC in the Netherlands. The ISCED 01 category (early childhood educational development) is considered not applicable in the Dutch education system. In turn, in the Netherlands the ISCED 02 category (pre-primary education) includes early childhood education for threeyear-olds in playgroups and childcare centres, as well as the kindergarten years in primary education (Dutch Groep 1 and Groep 2). Childcare for children aged 0-4 in the Netherlands is primarily conceptualised as a social provision, where care and supervision are central; childcare settings (supervision and care centres) are not formally part of the education system and fall under the Ministry of Social Affairs and Employment. By contrast, the kindergarten years of primary education are governed by the Ministry of Education. It is also difficult to clearly distinguish between ISCED 02 and non-ISCED 02 participation for children aged 2-4. For this age group, participation in early childhood educational development programmes (Dutch VVE, often referred to as toddler provision) is possible. These programmes were originally developed to support children at risk of language or developmental delays and to facilitate a smooth transition into primary education at age 4 and were offered in targeted groups within ECEC centres. Increasingly, however, VVE programmes have been integrated into regular childcare provision. In practice, this means that from age 2 onwards, children in childcare often receive a combination of care and educational activities. By distinguishing between these two types of programmes, analysis presented in the report are also likely to underestimate participation in ISCED 02 in the Netherlands.
7 See Note 5 above.
8 See Note 6 above.
9 Parental reports may differ from official records about children being formally identified with special education needs (SEN). The background questionnaires did not collect this information
Participating jurisdictions
of children under age 5, 2020
of children under age 15, 2020
Fertility Rate, 2020
Living arrangements of children aged 0-17 by presence of parents in the household, 2020
Share of men and women aged 25-34 having completed ISCED level 5 or a higher level of education, 2020
Participating jurisdictions
Note: OECD members are listed in black font. Partner countries/economies are listed in blue font. Sub-national jurisdictions are listed in italics. The table presents country-level indicators a) Data on living arrangements of children for United Kingdom from 2018; b) Data on proportion of adults with tertiary education in Azerbaijan refers to adults aged 25-64 in 2022; c) Data on proportion of adults with tertiary education for the United Arab Emirates refers to adults aged 25 or above; d) Proportion of Azerbaijan’s population living below the national poverty line in 2020; e) Data on child relative poverty rate for Malta is from 2021; f) Data for the Flemish Community (Belgium) refer to the Flemish Region and one-third of the Brussels-Capital Region, except for the indicator on living arrangements of children, which refers to the national level; g) Fertility rate data for the United Arab Emirates refers to Emirati women only. ISCED: International Standard Classification of Education
Sources: Data for OECD member and accession countries: (OECD, 2026[1])), Historical population data, https://dataexplorer.oecd.org/s/4ce (accessed on 15 January 2026) (OECD, 2025[2])): OECD Family Database, https://www.oecd.org/en/data/datasets/oecd-family-database.htm, accessed on March 13 2026l; (OECD, 2025[3])Adults' educational attainment distribution, by age group and gender, https://data-explorer.oecd.org/s/4cf; Data for the Flemish Community (Belgium) (except on children’s living arrangements): self-reported data based on information from (Statbel, 2025[4]) (https://statbel.fgov.be). Data for non-OECD member countries: self-reports from a survey of countries and economies participating in IELS 2025; Data on educational attainment in Malta: (EUROSTAT, 2025[5]), https://doi.org/10.2908/EDAT_LFSE_03; Data on educational attainment in Azerbaijan: (European Training Foundation, 2023[6])(2023): Key policy developments in education, training and employment – Azerbaijan 2023. https://www.etf.europa.eu/sites/default/files/2024-01/Country%20Fiche_Azerbaijan_2023_EN_web.pdf accessed on October 12, 2025, Data on poverty rate in Azerbaijan: (Asian Development Bank, 2023[7])(2023): Basic Statistics, Asia and the Pacific 2023, ADB Data Library, https://data.adb.org/dataset/basic-statistics-asia-and-pacific , accessed on October 12, 2025.
Participating jurisdictions
(Azerbaijan)
Ceará,Pará,São Paulo(Brazil)
ECEC system governance (integrated under one leading authority vs. split between different authorities) ECEC mandatory enrolment and starting age Presence of unified curriculum for all ECEC centres and applicable
Qualifications
Note: OECD members are listed in black font. Partner countries/economies are listed in blue font. Sub-national jurisdictions are listed in italics. The table presents country-level indicators a) Data for Azerbaijan and the United Arab Emirates is based in on self-reports; b) Data for Malta refers to Maximum number of children at age 4 allowed per core practitioner; c) The enrolment rate in the United Kingdom refers to 4year-olds only.
Source: Self-reports from a survey of jurisdictions participating in IELS 2025. Ratio of students to teaching staff in pre-primary education and enrolment in ECEC: (OECD, 2024[8]) Education at a Glance, https://doi.org/10.1787/c00cad36-en Students-to-teacher ratio for Malta: European Commission, EACEA, (Eurydice, 2025[9])(2025), Key data on early childhood education and care in Europe – 2025, https://eurydice.eacea.ec.europa.eu/publications/key-data-early-childhood-education-and-care-europe-2025; accessed on March 24, 2025.
Asian Development Bank (2023), Basic Statistics, Asia and the Pacific, https://data.adb.org/dataset/basic-statistics-asia-and-pacific (accessed on 15 October 2025).
European Training Foundation (2023), Key Policy Developments in Education,Training and Employment - Azerbaijan 2023, https://www.etf.europa.eu/sites/default/files/202401/Country%20Fiche_Azerbaijan_2023_EN_web.pdf (accessed on 12 October 2025).
EUROSTAT (2025), Population in private households by educational attainment level - main indicators, https://ec.europa.eu/eurostat/databrowser/product/page/EDAT_LFSE_03 (accessed on 12 October 2025).
Eurydice (2025), Key data on early childhood education and care in Europe - 2025, https://eurydice.eacea.ec.europa.eu/publications/key-data-early-childhood-education-andcare-europe-2025 (accessed on 24 March 2025).
OECD (2026), Historical Population Data, OECD Publishing, https://data-explorer.oecd.org/s/4ce (accessed on 13 February 2026).
OECD (2025), , OECD Family Database, https://www.oecd.org/en/data/datasets/oecd-familydatabase.html (accessed on 12 March 2026).
OECD (2025), Adults“ educational attainment distrbution, by age group and gender, https://dataexplorer.oecd.org/s/4cf (accessed on 15 January 2026).
OECD (2024), Education at a Glance 2024: OECD Indicators, OECD Publishing, Paris, https://doi.org/10.1787/c00cad36-en
Statbel (2025), Living conditions Flemish Community (Belgium), https://statbel.fgov.be (accessed on 12 January 2026).
Table A B.1. Chapter 3. How five-year-olds are faring
Table Title
Table B.3.1 Mean scores and variation in foundational learning domains
Table B.3.2 Mean scores and variation in executive function domains
Table B.3.3 Mean scores and variation in social and emotional development domains
Table B.3.4 Age distribution of children in IELS 2025
Table B.3.5 Mean scores in foundational learning domains, by age
Table B.3.6 Mean scores in executive function domains, by age
Table B.3.7 Mean scores in social and emotional development domains, by age
Table B.3.8 Distribution of within-jurisdiction variation in early learning and development outcomes
Table B.3.9 Distribution of children across quarters of composite scores for foundational learning and executive function
Table B.3.10 Distribution of children across quarters of composite scores for foundational learning and social and emotional development
Table B.3.11 Distribution of children across quarters of composite scores for executive function and social and emotional development
StatLink2 https://stat.link/8qedg0
Table A B.2. Chapter 4. Equity gaps in early learning and development
Table Title
Table B.4.1
Socio-demographic distribution of children in IELS 2025
Table B.4.2 Gender gaps in foundational learning domains
Table B.4.3 Gender gaps in executive function domains
Table B.4.4 Gender gaps in social and emotional development domains
Table B.4.5 Gender gaps in parent and teacher perceptions of children's skills
Table B.4.6 Socio-economic gaps in foundational learning domains
Table B.4.7 Socio-economic gaps in executive function domains
Table B.4.8 Socio-economic gaps in social and emotional development domains
Table B.4.9 Socio-economic gaps in parent and teacher perceptions of children's skills
Table B.4.10 Immigration background and gaps in foundational learning domains
Table B.4.11 Immigration background and gaps in executive function domains
Table B.4.12 Immigration background and gaps in social and emotional development domains
Table B.4.13 Immigration background and gaps in parent and teacher perceptions of children's skills
Table B.4.14 Language primarily spoken at home and gaps in foundational learning domains
Table B.4.15 Language primarily spoken at home and gaps in executive function domains
Table B.4.16 Language primarily spoken at home and gaps in social and emotional development domains
StatLink2 https://stat.link/abwfv6
Table Title
Table B.5.1 Parental levels of education and household structure among children in IELS 2025
Table B.5.2 Mother's level of education and foundational learning domains
Table B.5.3 Mother's level of education and executive function domains
Table B.5.4 Mother's level of education and social and emotional development domains
Table B.5.5 Single-parent household structure and foundational learning domains
Table B.5.6 Single-parent household structure and executive function domains
Table B.5.7 Single-parent household structure and social and emotional development domains
Table B.5.8 Home learning environment: Parent-child activities with a learning and developmental purpose
Table B.5.9 Home learning environment: Parent-child activities with a learning and developmental purpose and early learning and development outcomes
Table B.5.10 Home learning environment, by socio-economic status and household structure
Table B.5.11 Home learning environment and foundational learning domains
Table B.5.12 Home learning environment and executive function domains
Table B.5.13 Home learning environment and social and emotional development domains
Table B.5.14 Children's books at home and frequency of parent-child reading activities, by socio-economic background
Table B.5.15 Number of children's books at home and early learning and development outcomes
Table B.5.16 Frequency of parent-child reading activities and early learning and development outcomes
Table B.5.17 Frequency of children's use of digital tools and of parent-child educational activities on a digital support, by socioeconomic background
Table B.5.18 Frequency of children's use of digital tools and early learning and development outcomes
Table B.5.19 Frequency of parent-child educational activities with digital tools and early learning and development outcomes
Table B.5.20 Parental involvement in the child's ECEC centre, by socio-economic status
Table B.5.21 Parental involvement in the child's ECEC centre and foundational learning domains
Table B.5.22 Parental involvement in the child's ECEC centre and executive function domains
Table B.5.23 Parental involvement in the child's ECEC centre and social and emotional development domains
StatLink2 https://stat.link/cvuoj3
Table A B.4. Chapter 6. Early childhood education and care, additional supports and early learning and development
Table Title
Table B.6.1 Participation in ECEC or early schooling, by age
Table B.6.2 Starting age of participation in ECEC (ISCED 01 or 02) or early schooling, by socio-economic background
Table B.6.3 Weekly hours of attendance of pre-primary programmes (ISCED 02)
Table B.6.4 Association between number of years in ECEC/school and foundational learning domains
Table B.6.5 Association between number of years in ECEC/school and executive function domains
Table B.6.6 Association between number of years in ECEC/school and socio emotional development domains
Table B.6.7 Association between starting age of attendance of ECEC/school and foundational learning domains
Table B.6.8 Association between starting age of attendance of ECEC/school and executive function domains
Table B.6.9 Association between starting age of attendance of ECEC/school and socio emotional development domains
Table B.6.10 Association between number of years in ECEC/school and foundational learning domains, by socio-economic background
Table B.6.11 Early developmental and learning difficulties
Table B.6.12 Differences in experiencing early developmental and learning difficulties, by socio-economic background
Table B.6.13 Additional supports for children, by experience of early difficulties and home language
Table B.6.14 Associations between additional supports for children and foundational learning domains
Table B.6.15 Associations between additional supports for children and executive function domains
Table B.6.16 Associations between additional supports for children and social and emotional development domains
Table B.6.17 Associations between second language support and scores in emergent literacy and numeracy
StatLink2 https://stat.link/hcsv5y
The International Early Learning and Child Well‐being Study (IELS) is a collaborative effort that brings together the expertise of participating countries and jurisdictions committed to improving the evidence base on young children’s early learning, development and well‐being. The study provides internationally comparable information on the skills, competencies and experiences of five‐year‐old children, supporting countries and jurisdictions in designing and evaluating policies that foster positive developmental outcomes. This report is the product of extensive collaboration and co‐operation among many stakeholders and contributors. In particular, the co‐operation of staff and leaders in the participating early learning settings was essential to the successful implementation of IELS.
IELS was implemented under the Programme of Work and Budget of the OECD Education Policy Committee (EDPC).
Participating countries and jurisdictions implemented IELS at the national or subnational level through national project centres, supported by national project managers (NPMs), national data managers (NDMs) and national sampling managers (NSMs). These teams operated under rigorous technical and operational standards. NPMs played a central role in securing participation from early learning settings, overseeing the national adaptation, translation and validation of study instruments, managing national data collection and processing, and verifying the accuracy of national results. NDMs coordinated national data processing and data cleaning, while NSMs ensured that sampling procedures and all technical requirements were rigorously followed.
In addition to the participating countries and jurisdictions, several experts contributed to developing the assessment instruments. A Technical Expert Group (TEG) supported the decision‐making process on technical and analytical matters. Subject‐matter experts and analysts also played a critical role in the analytical phase and in drafting the initial reports.
At the international level, the co‐ordination and management of the study implementation were the responsibility of the appointed contractors. The Consortium was led by the Australian Council for Educational Research Limited (ACER), together with its partners, the International Association for the Evaluation of Educational Achievement (IEA) and cApStAn Linguistic Quality Control.
The OECD Secretariat had overall responsibility for managing the project, monitoring its day‐to‐day implementation and serving as the secretariat of the Steering Group on IELS.
Australian Council for Educational Research (ACER) – Overall management, instrument development, technology, psychometrics, and analysis
Jude Alexander (Assessment Development)
Alla Berezner (Psychometrics Lead)
Dan Cloney (Deputy International Study Director)
Tim Friedman (Questionnaires Lead)
Jennifer Hong (Questionnaires)
David Jeffries (Psychometrics)
Sandra Knowles (Assessments Lead)
Renee Kwong (Psychometrics)
Dulce Lay (Questionnaires)
Greg Macaskill (Psychometrics)
Kemran Mestan (Project Management)
Anna Plotka (Assessments)
Prateeti Sabhlok (Project Management)
Maurice Walker (International Study Director)
Karen Wright (Delivery Technology Lead)
International Association for the Evaluation of Educational Achievement (IEA) – Field operations, sampling, data management
Clara Beyer (Deputy International Study Director)
Diego Cortes (Sampling)
Darrell Gwaltney (Data Management)
Juliane Kobelt (Project Management)
Rodrigo Leyton (Sampling)
Tahira Qadri (Quality Assurance Monitoring)
cApStAn – Translation/Linguistic quality control
Roberta Lizzi
Technical Expert Group
Szilvia Papp
Ricardo Primi
Nirmala Rao
Knut Schwippert
Iram Siraj (Chair)
Steering Group
Baku and Sumgait (Azerbaijan): Elnur Aliyev
Ceará, Pará and São Paulo (Brazil): Beatriz de Oliveira Babuchaim, Mariana Luz, Marcella Simonini, Marina Fragata Chicaro
England (United Kingdom): Sanjeeta Abram (until October 2025), Sarah McLoughlin
Flemish Community (Belgium): Johan Geets, Miekatrien Sterck, Jeroen Backs
Hangzhou (China): Conggen Yan, Jianmei Xu, Wenbin Jia, Fangwen Wu, Erping Xiao, Wei Wang, Rong Wang, Dan Sun
Korea: Yujeong Go, Boyoung Sun, Hakyong Yang
Malta: Jude Zammit
Netherlands: Anneke de Wolff
Switzerland (Field Trial Only): Thomas Vollmer
United Arab Emirates: Amina Aljasmi, Amal Alsayegh
Baku and Sumgait (Azerbaijan): Sevinj Asadova
Ceará, Pará and São Paulo (Brazil): Tiago Bartholo, Mariane Campelo Koslinski
England (United Kingdom): Romy Short
Flemish Community (Belgium): Katrijn Denies, Renée Claes (Research support)
Hangzhou (China): Jianmei Xu
Korea: Eunyoung Kim, Wonsoon Park
Malta: Karen Grixti, Jude Zammit
Netherlands: Nicole Swart, Isis Derks, Senne Nout
Switzerland (Field Trial Only): Thomas Vollmer, Sabina Littmann Wernli
United Arab Emirates: Shaikha Al Zaabi; Wafa Alhashmi (Abu Dhabi)
OECD Secretariat
Yuri Belfali (Head of Division, Early Childhood and Schools, Directorate for Education and Skills)
Carlos González-Sancho (Analyst, Report lead)
François Keslair (Statistician)
Sabrina Leonarduzzi (Project Assistant)
Marco Paccagnella (Analyst)
Rowena Phair (Senior Analyst and Project Manager, until June 2023)
Nathaniel Reinertsen (Analyst, until February 2026)
Mila Staneva (Analyst, until March 2026)
Claudia Tamassia (Senior Analyst and Project Manager)
The first five years of a child’s life represent a critical window of opportunity, but also of vulnerability. Strong early skills prepare children to succeed in education and to develop into healthy, well‑adjusted adults. But a poor start can hinder these positive trajectories. For countries, few investments yield greater long‑term benefits than ensuring that all children acquire solid foundational skills.
The International Early Learning and Child Well Being Study (IELS) provides countries with comparative data on children’s early learning and development. It helps governments understand how early outcomes relate to experiences and environments influenced by early years policies.
The study combines direct and indirect assessments of the foundational learning, executive function and social and emotional skills of five‑year‑olds in schools and early childhood education and care (ECEC) settings. It also collected information on children’s characteristics, home environments and participation in ECEC from parents and staff.
This report presents the main findings from IELS 2025 and sets the stage for deeper analysis of progress and gaps across children’s learning trajectories.