16 minute read
2. Imaging Methods


Miroslav Heřman
This chapter discusses the basic principles of imaging methods, their most common indications and contraindications, and the general terms used in the examination report.
2.1 Radiography
Radiography is an imaging technique using X-rays to view the internal structure of an object. Radiographs, usually shortened to X-rays, are results of the rays generated in the X-ray tube (Fig. 2.1) which pass through the area being examined, where they are partially absorbed and scattered, depending on the composition of the tissues being examined, and then they are captured by a detector. The original recording material was a photographic film. By developing the film we get the final image. Nowadays, radiographs are made digitally in most cases. The most significant benefits of digital radiography are the higher quality of the images acquired, the reduction of the dose, the possibility of subsequent modification of the image (e.g. highlighting the most important parts of the image, adjusting the brightness, contrast, enlargement, highlighting of the interfaces), and archiving images in digital form.
There are two basic principles of digital imaging: computed radiography and digital radiography.
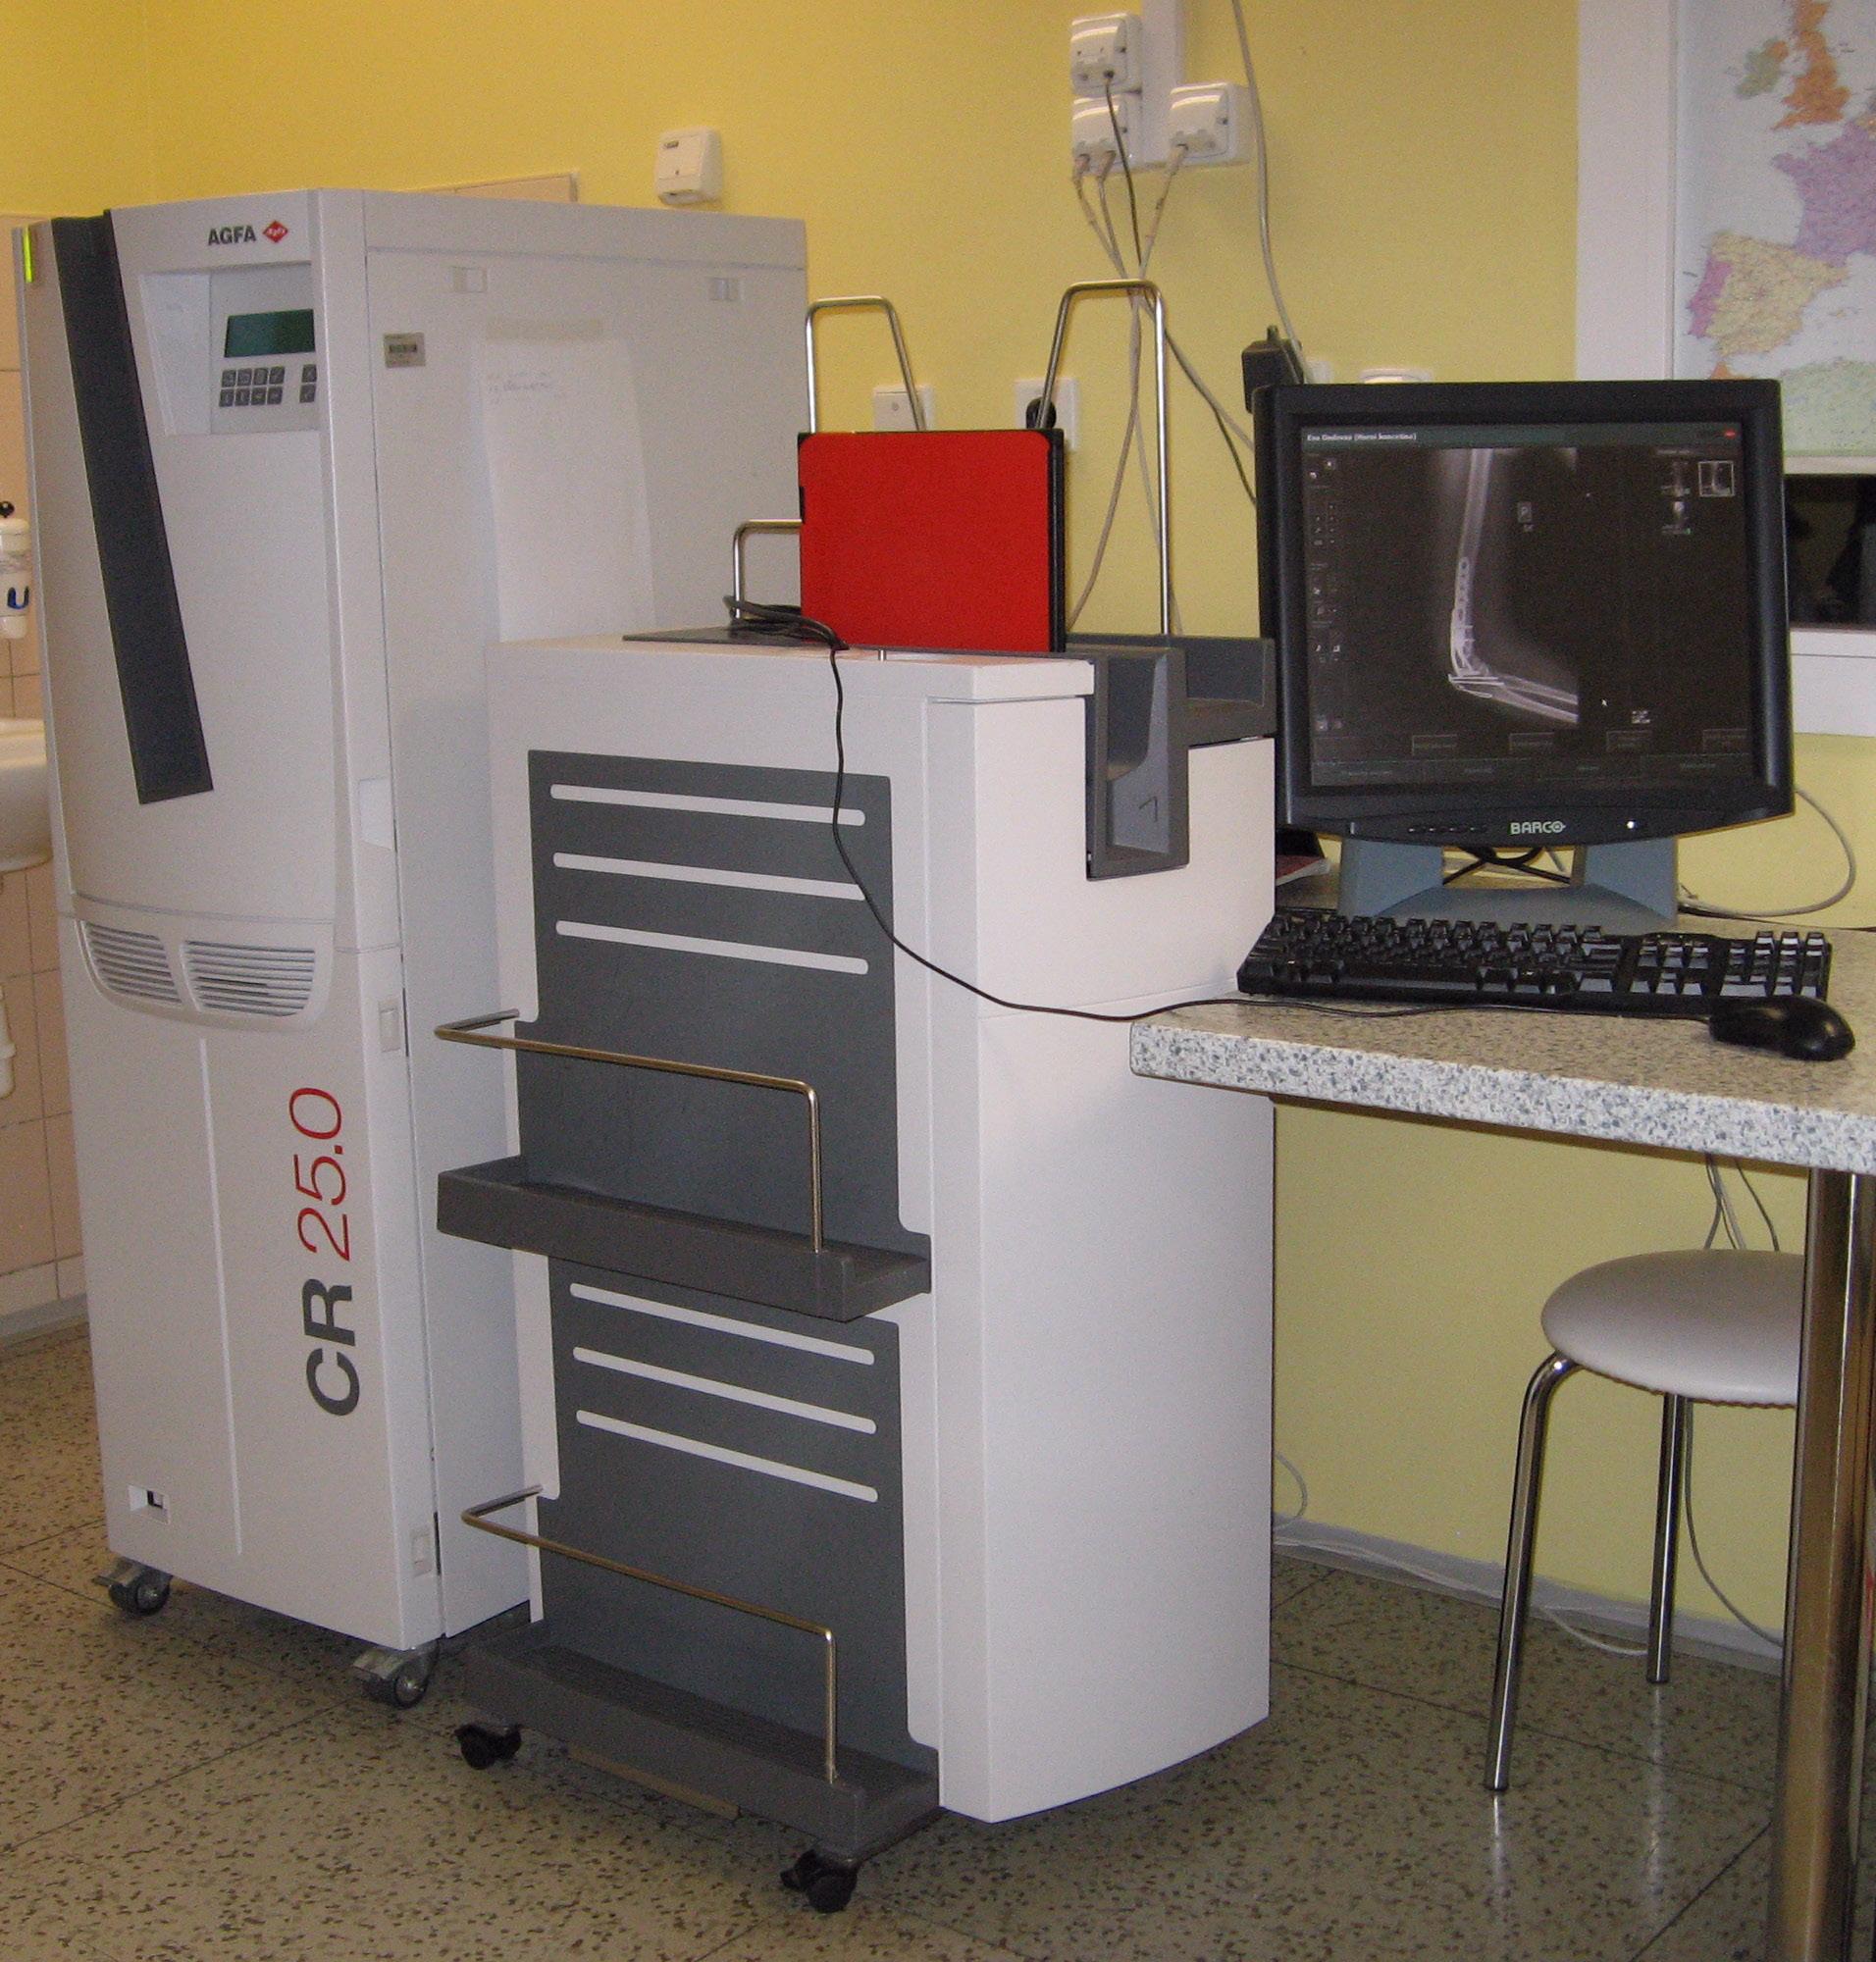
In computed radiography (CR), the radiation passed through the object is captured on a plate containing a sensitive layer based on photostimulable phosphor. The image is processed in a digitizer (reading device) by scanning the plate with a laser. The amount of light released is registered and the latent image of the phosphor layer is converted into digital form. The phosphor layer is then erased by the laser and is ready for further use. These plates are stored in similar cassettes to X-ray films and maintained in a similar way – after the image is captured, the cassette is inserted into the digitizer and the resulting digital image is displayed on a monitor, where it can be further edited. The entire process from exposure to the display of the image takes 0.5–2 minutes (Fig. 2.1).
Digital radiography (DR) uses different technical principles, but in both systems the conversion of passed X-rays to electrical digital signals occurs directly in the detector of the device. This transfer is faster than in computed radiography and, moreover, there is no need to transport the cassette from the examining room to the digitizer, which significantly accelerates the whole process – the image is available a few seconds after its exposure (Fig. 2.2).
A radiograph is a two-dimensional image of a threedimensional object. It is a summation image – it captures information about all the tissues through which radiation has passed, regardless of the order in which it occurred. Tissues that absorb more radiation produce opaque [shadowed, (hyper)dense] areas, while less absorbent tissues are presented as lucent (hypodense) areas. These terms are relative – they are always related to a normal condition. This terminology is based on traditional radiographs. Because the radiograph
b
Fig. 2.1 Computed radiography
process. a) Radiation coming out from the X-ray tube ( ) passes through the object being examined (elbow) and interacts with the sensitive layer of the plate enclosed in the cassette ( ). The phosphor-coated imaging plate interacts with X-rays transmitted through the object to capture a latent image. b) The cassette is then marked with patient data ( ) and inserted into the digitizer ( ). In the digitizer, the film is removed from the cassette and scanned by a laser beam; the amount of energy released is registered at each point of the image and thus the latent image is “converted” to the resulting digital image, which is displayed on the monitor, checked or modified by a radiological technician, and sent to the digital archive.
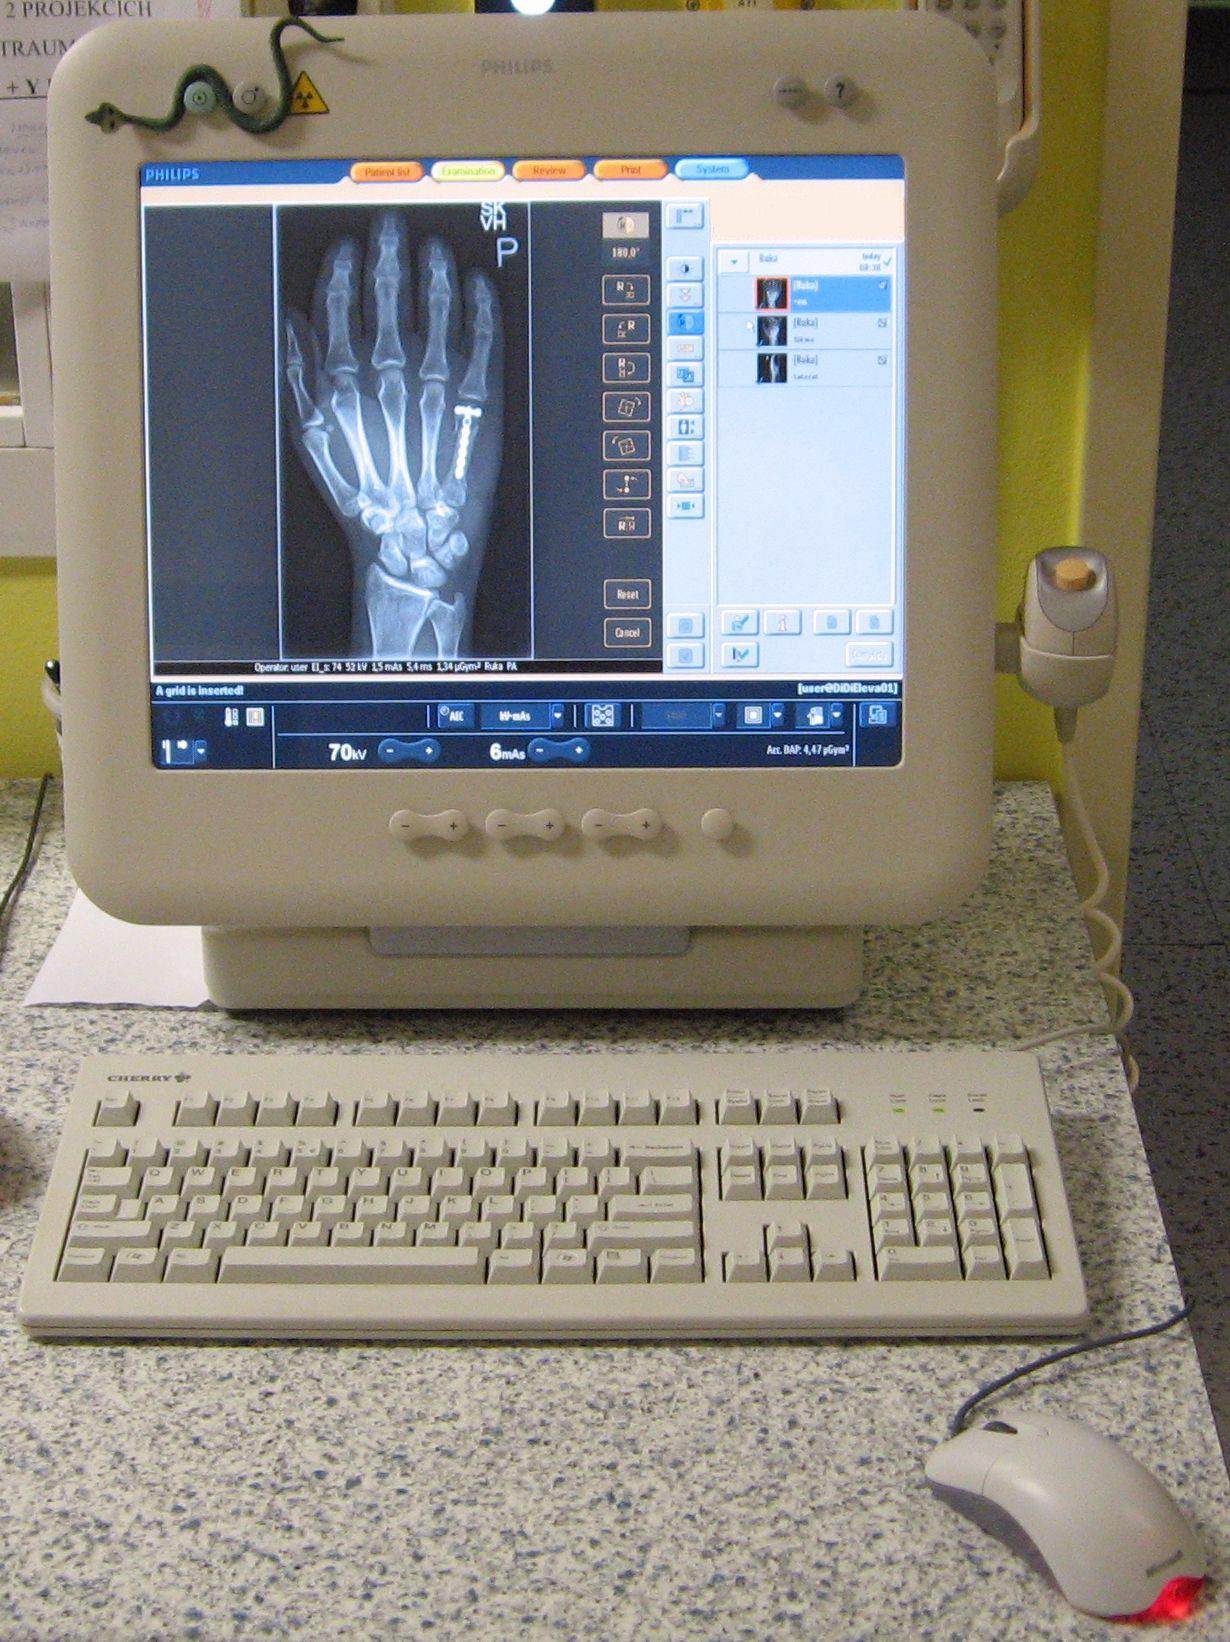

Fig. 2.2 Digital radiography process.
a) Radiation coming out from the X-ray tube ( ) passes through the object being examined (hand) and interacts with the digital detector ( ) in which the transmitted X-rays at each point of the image are converted to digital electrical impulses. b) The image obtained is displayed on the monitor, where a radiological technician checks or modifies it and sends it to the digital archive.
a
is negative, the areas of lucency are displayed as “darker” and opaque ones as “lighter” (Fig. 2.3). Especially in digital images, it is not a problem to convert the image into a “positive” one (“reverse” white and black shades), but a negative image is used as the basic one.
Radiography is limited to demonstrating five basic densities: air, which is most lucent – appears the blackest in a radiograph; fat, which is shown in a lighter shade of grey than air; soft tissue and fluid, which have intermediate density (soft tissue and fluid have the same density on radiographs); calcium, usually contained within bones or calcifications; metal or contrast agents, which are most opaque (they appear as white) in a radiograph, because they attenuate a large proportion of the X-ray beam.
When radiographs of most areas are being captured, images are taken in two projections, most often anteroposterior and lateral. Two projections are advantageous for several reasons – primarily to provide information about the spatial layout of structures, and to find changes that may not be noticeable in one projection. The term anteroposterior (AP) indicates that the X-ray beam enters through the anterior (front) aspect of the body, and exits out of the posterior (back) aspect, where the beam is detected. This is the way most radiographs are taken. An important exception is chest imaging, where images are taken of standing patients as posteroanterior (PA). In right lateral projection the X-ray beam passes from the left to the right side (i.e. the patient’s right side is closer to the detector).
Traditionally, radiographs were viewed using a viewer, an accessory device that emits homogeneous, reasonably intense light. When orienting radiographs on the viewer, the anteroposterior and posteroanterior images are laid in such a way that it is as if we are looking at the standing patient facing us in a basic anatomical position (exceptions include, for example, radiographs of hands or feet, which are laid with the fingers or toes upward). The left and right sides of the image are indicated by the letters L or R, usually located in a corner of the image. We obey the same guidelines when orienting digital images displayed on a computer monitor.
Indications and contraindications. Radiographs of the skeleton and chest are most frequent. Pregnancy is a relative contraindication for performing all tests using ionizing radiation.

Fig. 2.3 Hypodensity/hyperdensity. In the chest image, a hyperdensity or opacity ( ) is visible on the left side, with a hypodensity (lucency) in it ( ) that is inferiorly contoured by an air-fluid level (a typical appearance of an abscess). b
2.2 Fluoroscopy
Fluoroscopy enables real-time radiographic visualization of moving structures. A continuous X-ray beam passes through the patient and then is captured by a detector and

a b
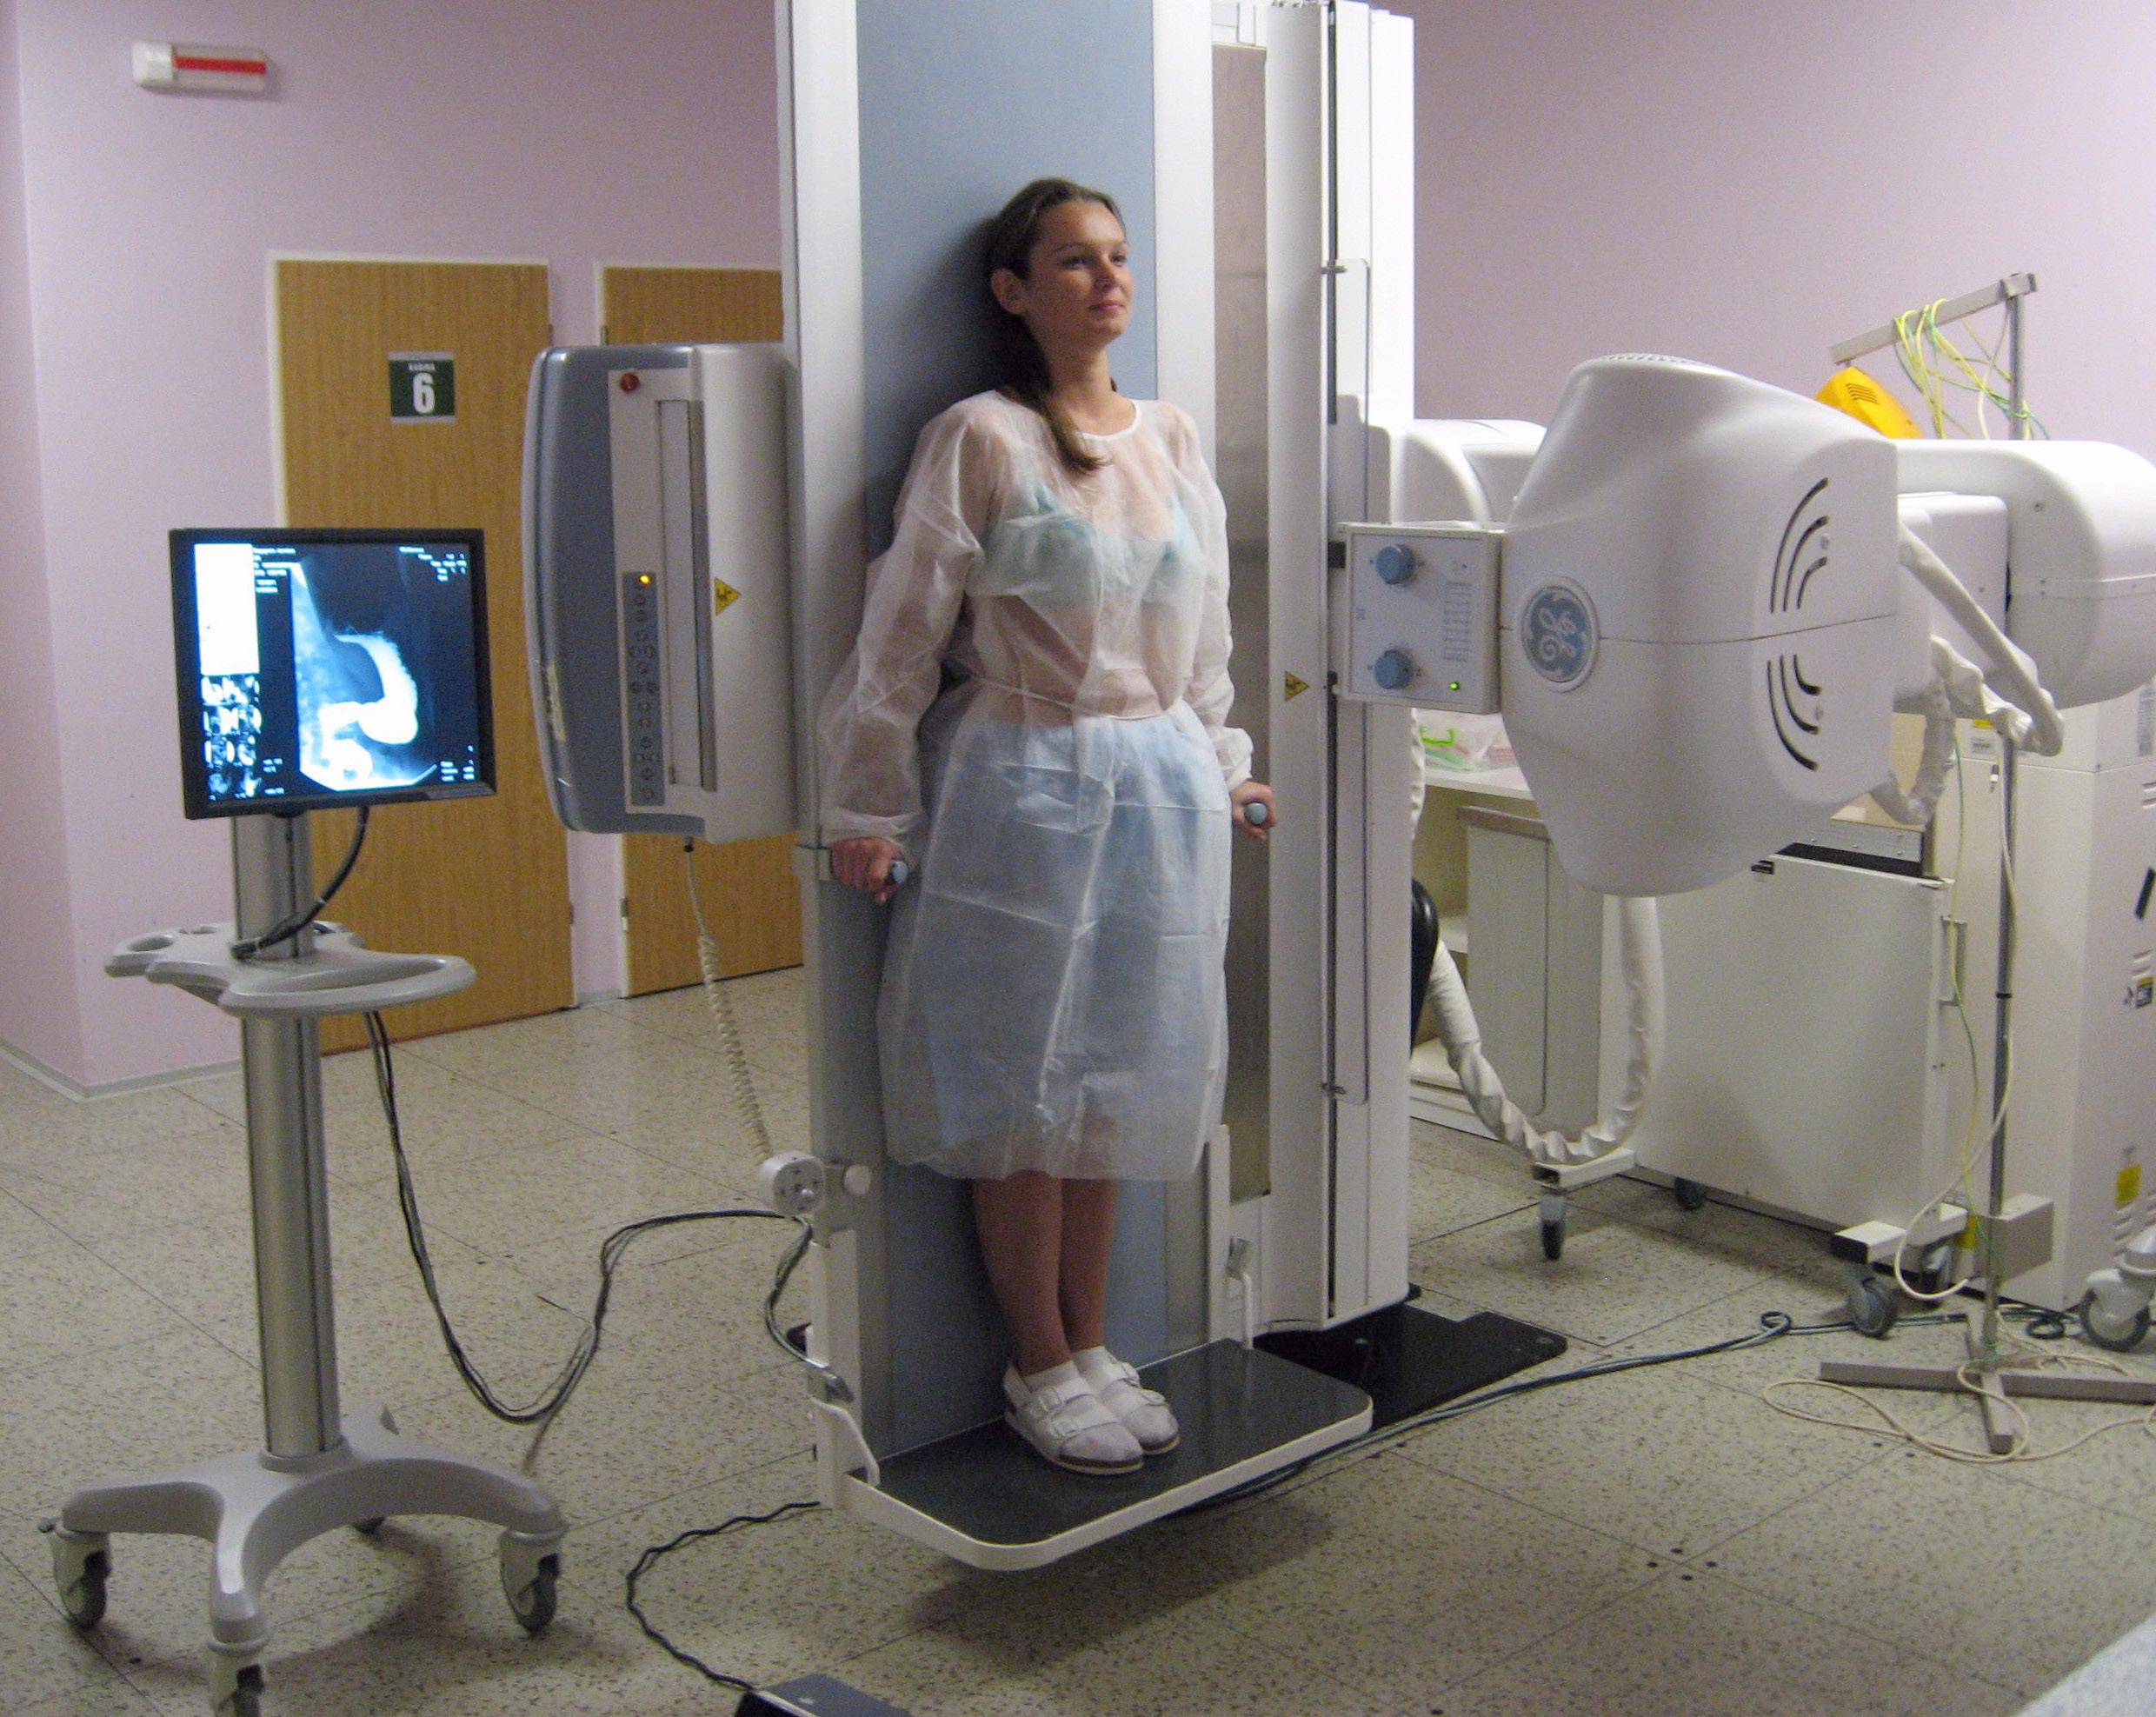
Fig. 2.4 Fluoroscopic examination room. The X-ray tube ( ), the examination table, and the detector ( ) are connected so that the patient can be examined a) standing or b) lying, or the table can be tilted to the Trendelenburg position (the head is lower than the legs). A fluoroscopic image can be viewed on a monitor directly in the examination room or outside it.
displayed on a monitor (Fig. 2.4). Fluoroscopic findings are most often documented in radiographs. When compared to radiography, fluoroscopy has a higher radiation dose and lower resolution and contrast, but it allows the imaging of dynamic processes.
Indications and contraindications. Fluoroscopy is used to monitor continuous radiographic procedures such as studies of the gastrointestinal tract, angiography, and interventional procedures; it is also used for intraoperative imaging, most often in skeletal surgery. The contraindications do not differ from those of other methods using X-rays.
2.3 Tomography, Tomosynthesis
Tomography (from the Greek tomos – layer, cut) was used to reduce the problem of superimposition (summation) of structures in radiography. By moving the X-ray source and the film in opposite directions during the exposure, it was possible to obtain a sharp image of the selected plane of interest and blur other planes.
Indications and contraindications. The main indications were the imaging of lung or bone changes that were insufficiently delineated on conventional radiographs. This method has been replaced in clinical practice by more advanced techniques, particularly by computed tomography (CT). The contraindications do not differ from those of other radiographic methods.
Tomosynthesis is a new technology combining traditional tomography and CT. With a single motion of the Xray tube by several tens of degrees, the data retrieved on a flat digital detector allows the reconstruction of multiple thin layers (either parallel or multi-plane) or even threedimensional imaging. The dose received during an examination is similar: up to twice as high in comparison with a plain radiograph.
Indications and contraindications. Tomosynthesis is beginning to find clinical applications, especially in mammography and lung and skeletal evaluation. The contraindications do not differ from those of other methods using X-rays.
2.4 Angiography
The term angiography generally refers to the imaging of vessels. Vessels can be viewed either non-invasively, using techniques of Doppler ultrasonography, CT angiography, or MR angiography (these methods will be discussed later), or invasively by angiography. This narrower sense of angiography will be used here. In angiography, a contrast medium (CM) is administered intravascularly, followed by radiographic imaging.
Angiographic examinations are performed at special surgeries equipped with an angiographic system. This system allows the fluoroscopic guidance that is necessary for the guidance of angiographic instruments (catheters, guide wires, etc.), as well as fast radiography. The layout of the X-ray tube and the opposite detector placed on a movable C-arm allows both fluoroscopy and radiography in different projections (Fig. 2.5). The patient lies on a freely movable table, known as a floating plate (which can be locked in the selected position). For CM administration at angiographic examinations, we use a contrast media injector that allows rapid and accurate dosing coordinated with imaging.
Digital subtraction angiography (DSA) is used in most angiographic examinations. Its basic principle is the digitization of the fluoroscopic image and the computer subtraction of images before and after the injection of CM. Subtraction leads to removal of the “background” (especially skeletal) structures visible in the unsubtracted image, and therefore only vessels filled with contrast medium are shown (Fig. 2.6).
The term angiography is used in clinical practice to display arteries, capillaries, and veins in one area (e.g. carotid angiography), as well as for imaging arteries only (e.g. angiography of the lower limbs). The term venography is used to target veins.
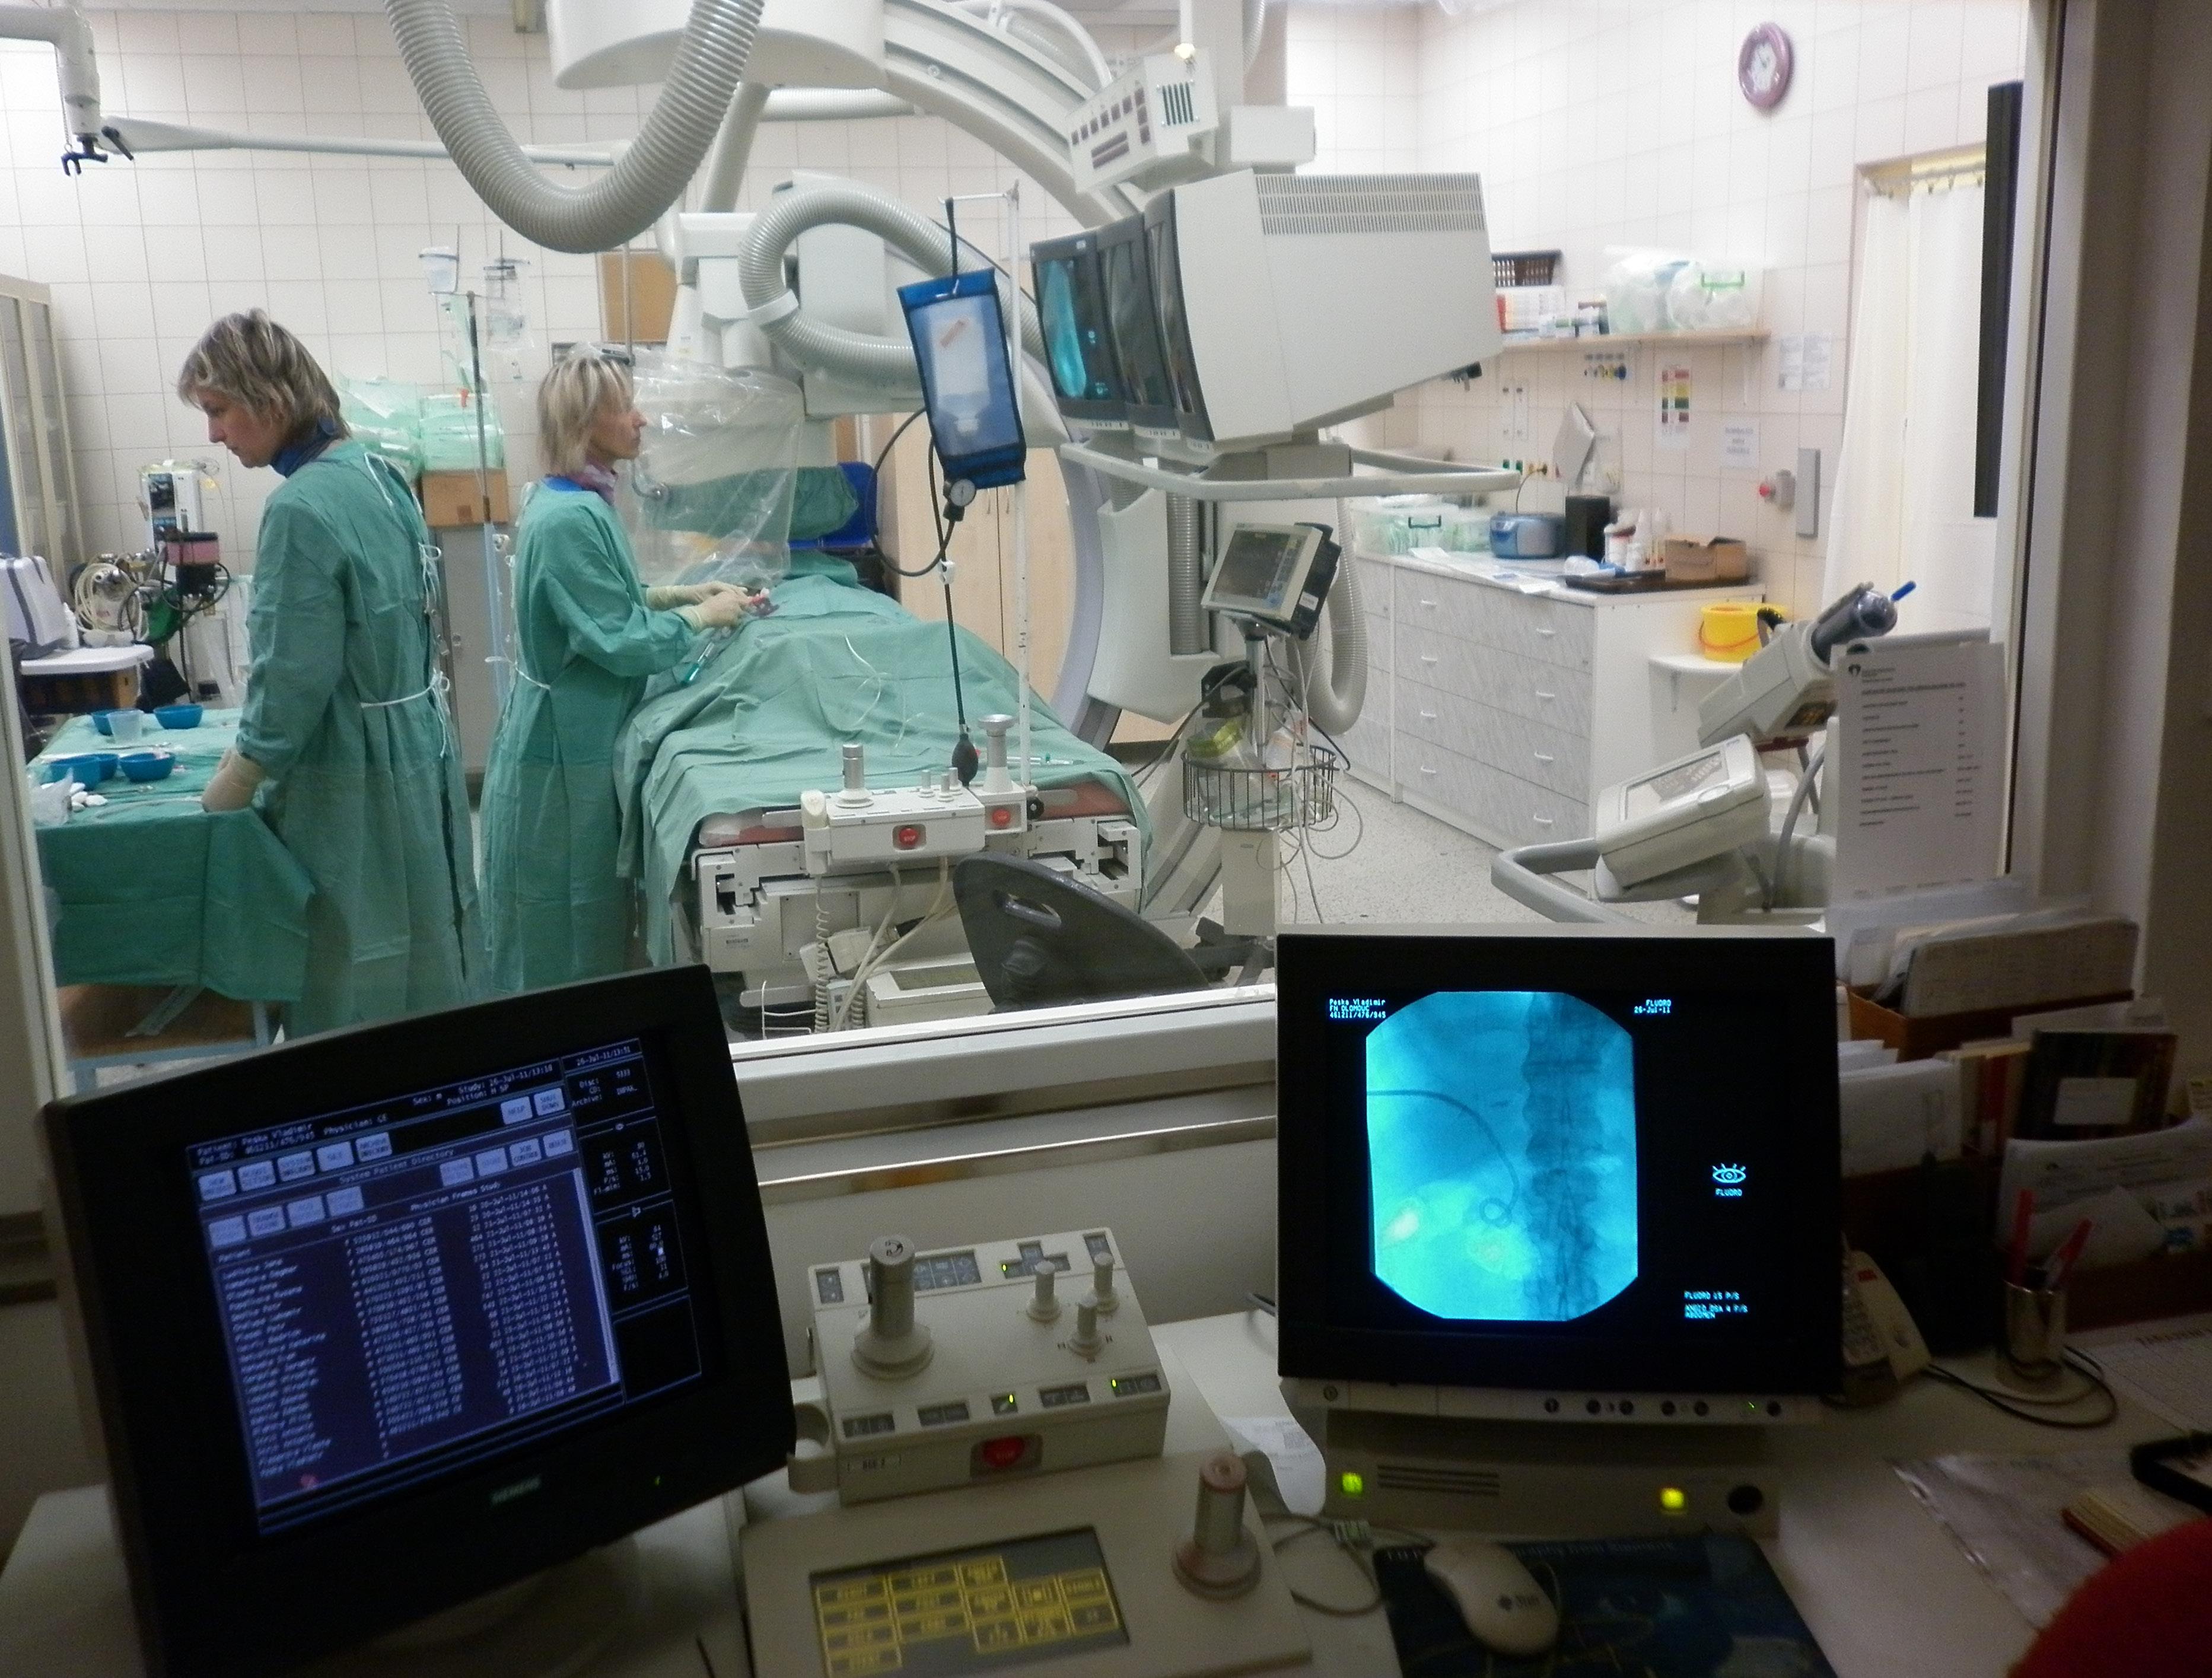
Fig. 2.5 View from the control room to the angiographic
examination room. The patient lies on the examination table, and the physician performing the examination uses the monitors to check the position of the catheter that has been inserted. The detector located above the area being examined and the X-ray tube (now under the table) are attached to the C-arm ( ) and allow different projections to be set up. At the front, we can see the monitors in the control room.
Indications and contraindications. Angiography is primarily used to diagnose vascular diseases, currently most commonly just prior to vascular interventional radiological procedures. Contraindications to angiographic examinations are the same as those of other methods using X-rays, accompanied by contraindications associated with the application of contrast media and haemocoagulation disorders.
2.5 Ultrasonography (US)
The synonyms for ultrasonography are sonography and ultrasound (and echocardiography for cardiac US).
US is an imaging method utilizing ultrasound reflections from tissue interfaces with different acoustic impedances. Ultrasound is a wave of a mechanical nature, transmitted as the vibration of particles in a medium. When passing through the mass, the ultrasound is absorbed, scattered, or reflected. In diagnostics, we use reflections that occur at the interface of different media (tissues with different acoustic impedances); the greater the difference in the density of these media, the greater the intensity of the reflection. For diagnostic purposes, we use frequencies of 2–20 MHz, which are suited to the imaging of soft tissues and fluids. The interface between a fluid medium (in which we can include soft tissue because of its high water content) and a bone or a gas is so big that it reflects almost all ultrasound waves. Therefore, organs located beneath the skeleton or gas can only be examined in a limited way. For the same reason, it is necessary to use contact gels on the skin – to remove the thin layer of air between the skin and the probe, which would prevent the waves from crossing into the area being examined. An important exception to examinations of structures beneath the skeleton is the transcranial Doppler examination of the major brain arteries. It is performed over a squamous part of the temporal bone that is relatively thin and the ultrasound of higher intensity used in Doppler US passes through it at a sufficient intensity.
The source of ultrasound is a piezoelectric crystal that deforms its shape by the action of alternating current. The opposite principle is used to capture reflections (echoes), with the intensity of the reflection informing us about the


a b c d


Fig. 2.6 Principle of digital subtraction (image of the popliteal artery and its branches). a) An unenhanced image is taken before the administration of CM and b) is converted to a negative on the computer. c) The image after the injection of CM (without subtraction). d) If we merge images (b) and (c), structures that have not changed (= skeleton, soft tissues) will be subtracted (and disappear) and only those structures that differ, i.e. arteries filled with contrast medium, will remain. We can view the subtracted image (d) either like this or in the negative or project the skeleton (or part of it) back into the image.

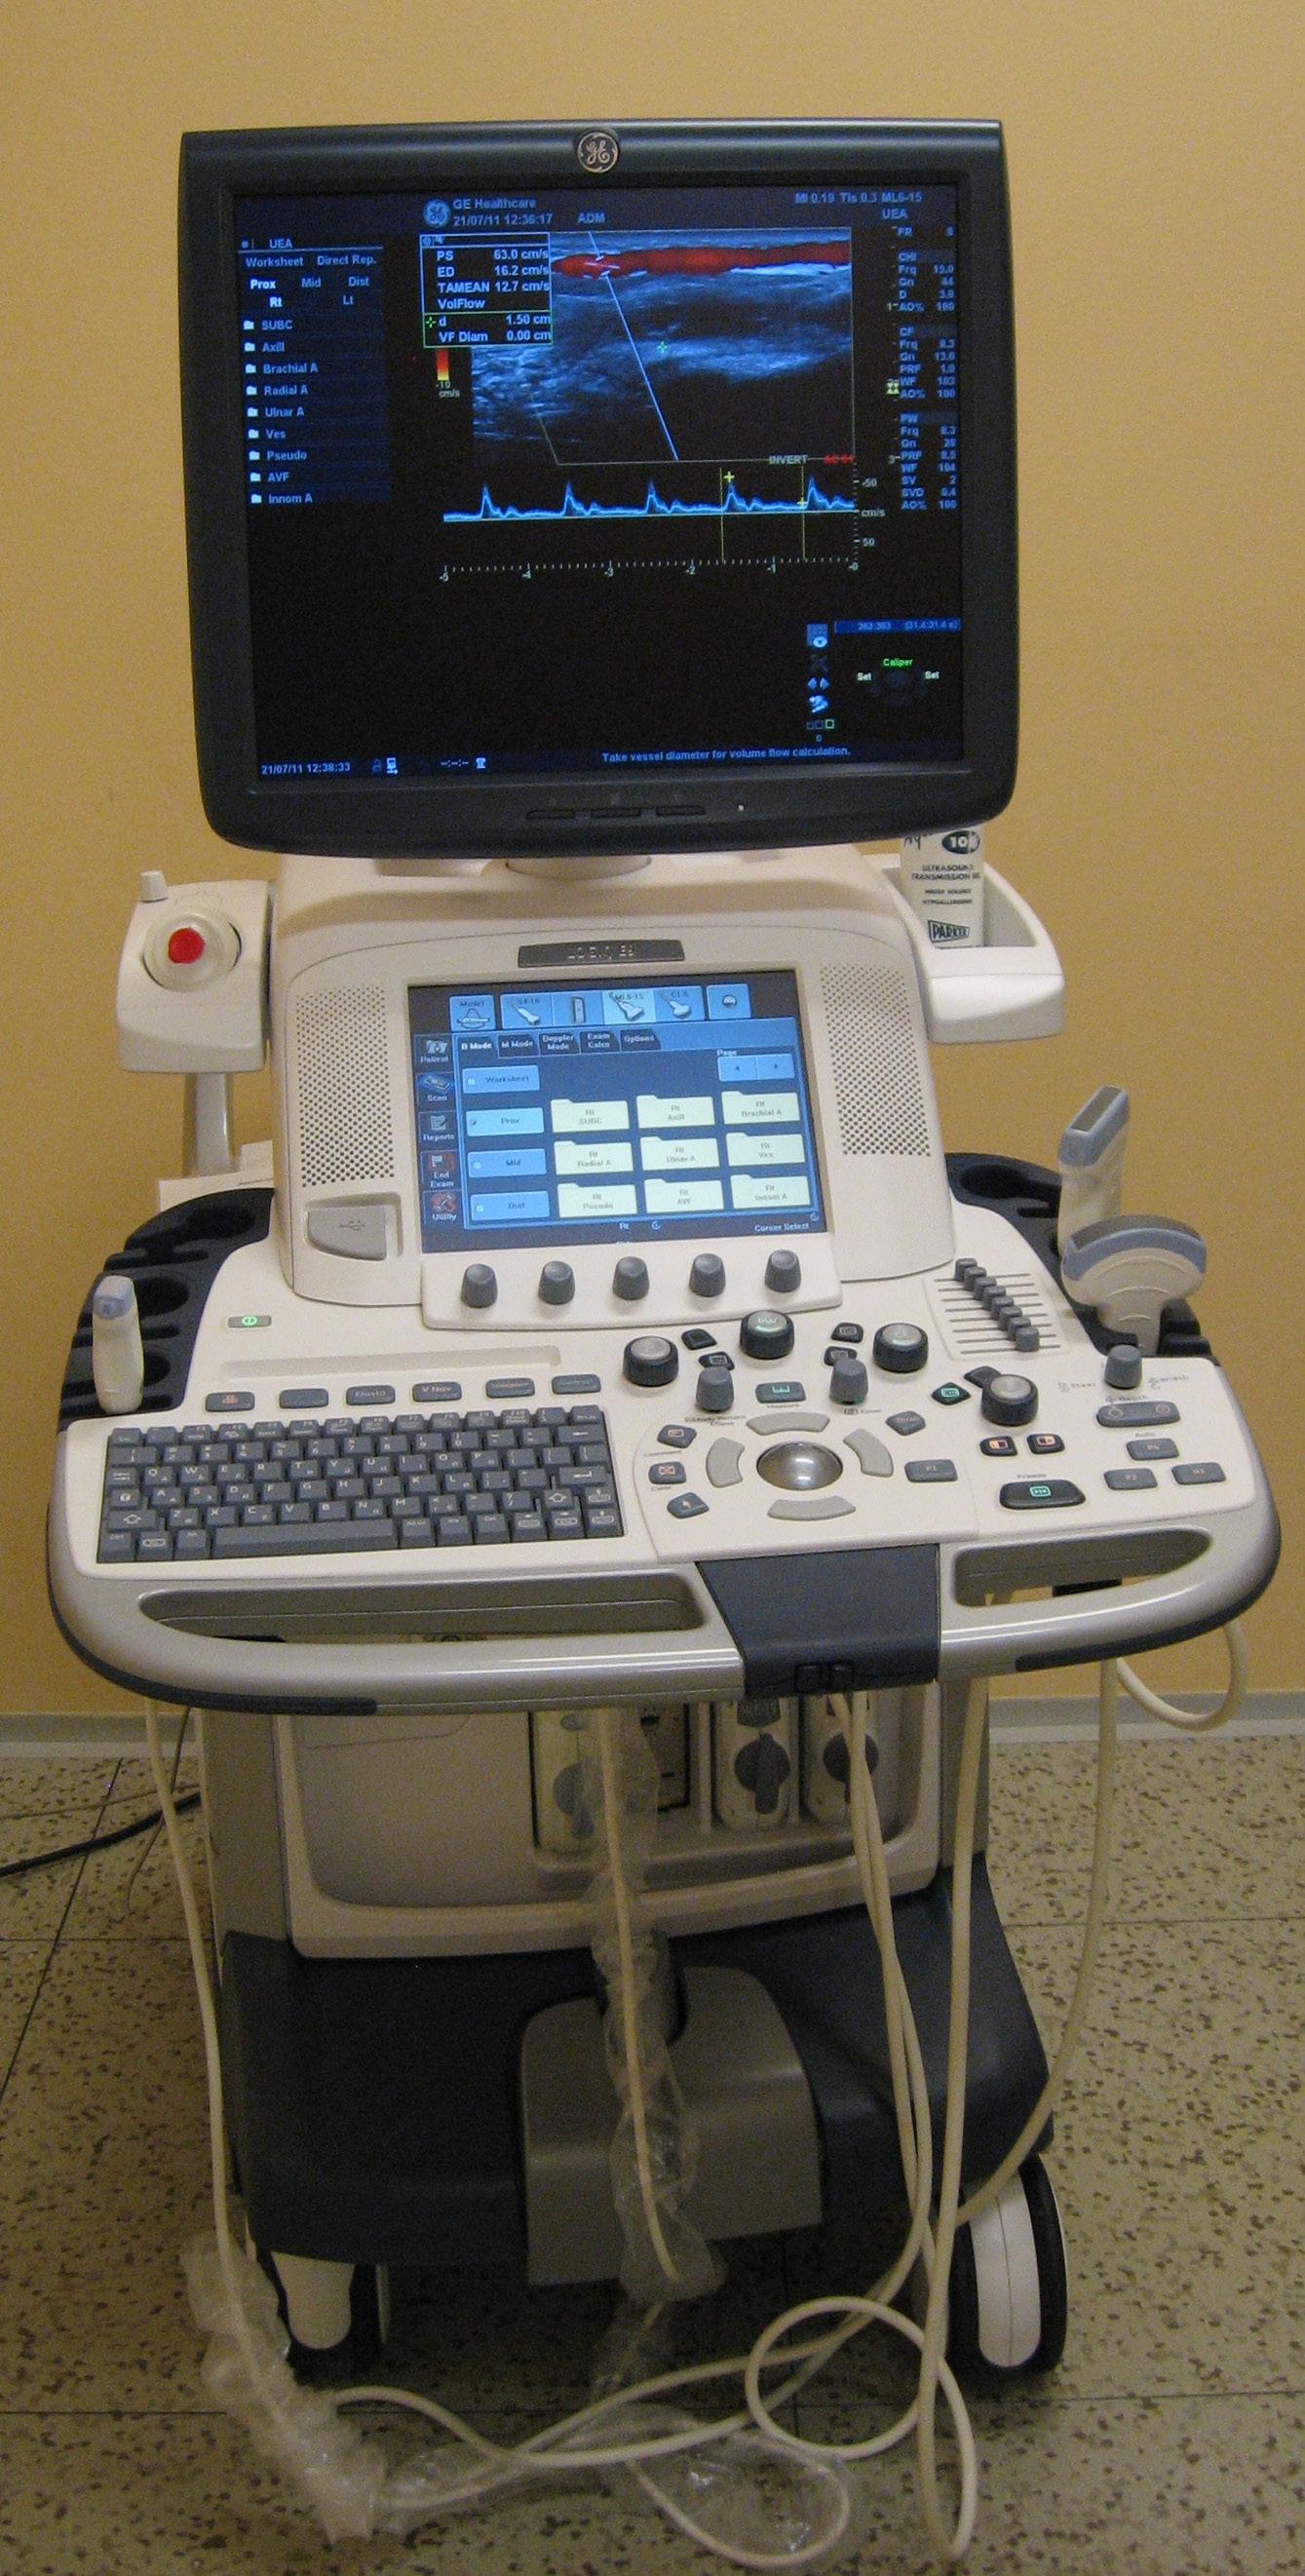
b Fig. 2.7 a) Ultrasound machine. b) Probes – different types. On the left, a convex probe with lower frequencies for the examination of deeper structures, e.g. the abdomen. In the middle, a linear probe with higher frequencies for the examination of superficially located structures, e.g. the neck or limb vessels (the image displayed on the machine was obtained by this probe). On the left, a sector probe with a small contact area designed specifically to examine the smallest children.
a
size of the difference in the tissue interface and the time that elapsed from its sending to returning informing us about the distance of the interface from the source.
In most ultrasound applications, the same crystal transmits waves (about 0.5% of its operating time) and receives reflections (99.5% of its operating time). The crystal or, more precisely, crystals are located in a probe, which may be of one of several designs. The most common are sector, linear, and convex probes (Fig. 2.7). The probes also differ in the frequency transmitted: 2–5 MHz frequencies are used to display deeper structures, 5–15 MHz frequencies are used for studying structures closer to the surface (greater spatial resolution but limited penetration). For endosonographic examinations, special probes are used that can be inserted into the organ’s lumen to perform endorectal, transvaginal, endovascular, transoesophageal, or intravascular examination.
The most commonly used type of ultrasound imaging is dynamic B-mode (brightness mode), in which the image is created by capturing a large number of side-by-side reflections, the intensity of whose reflection is associated with a particular degree of grey colour on the monitor. In the description of these images, we use the terms hyperechogenic
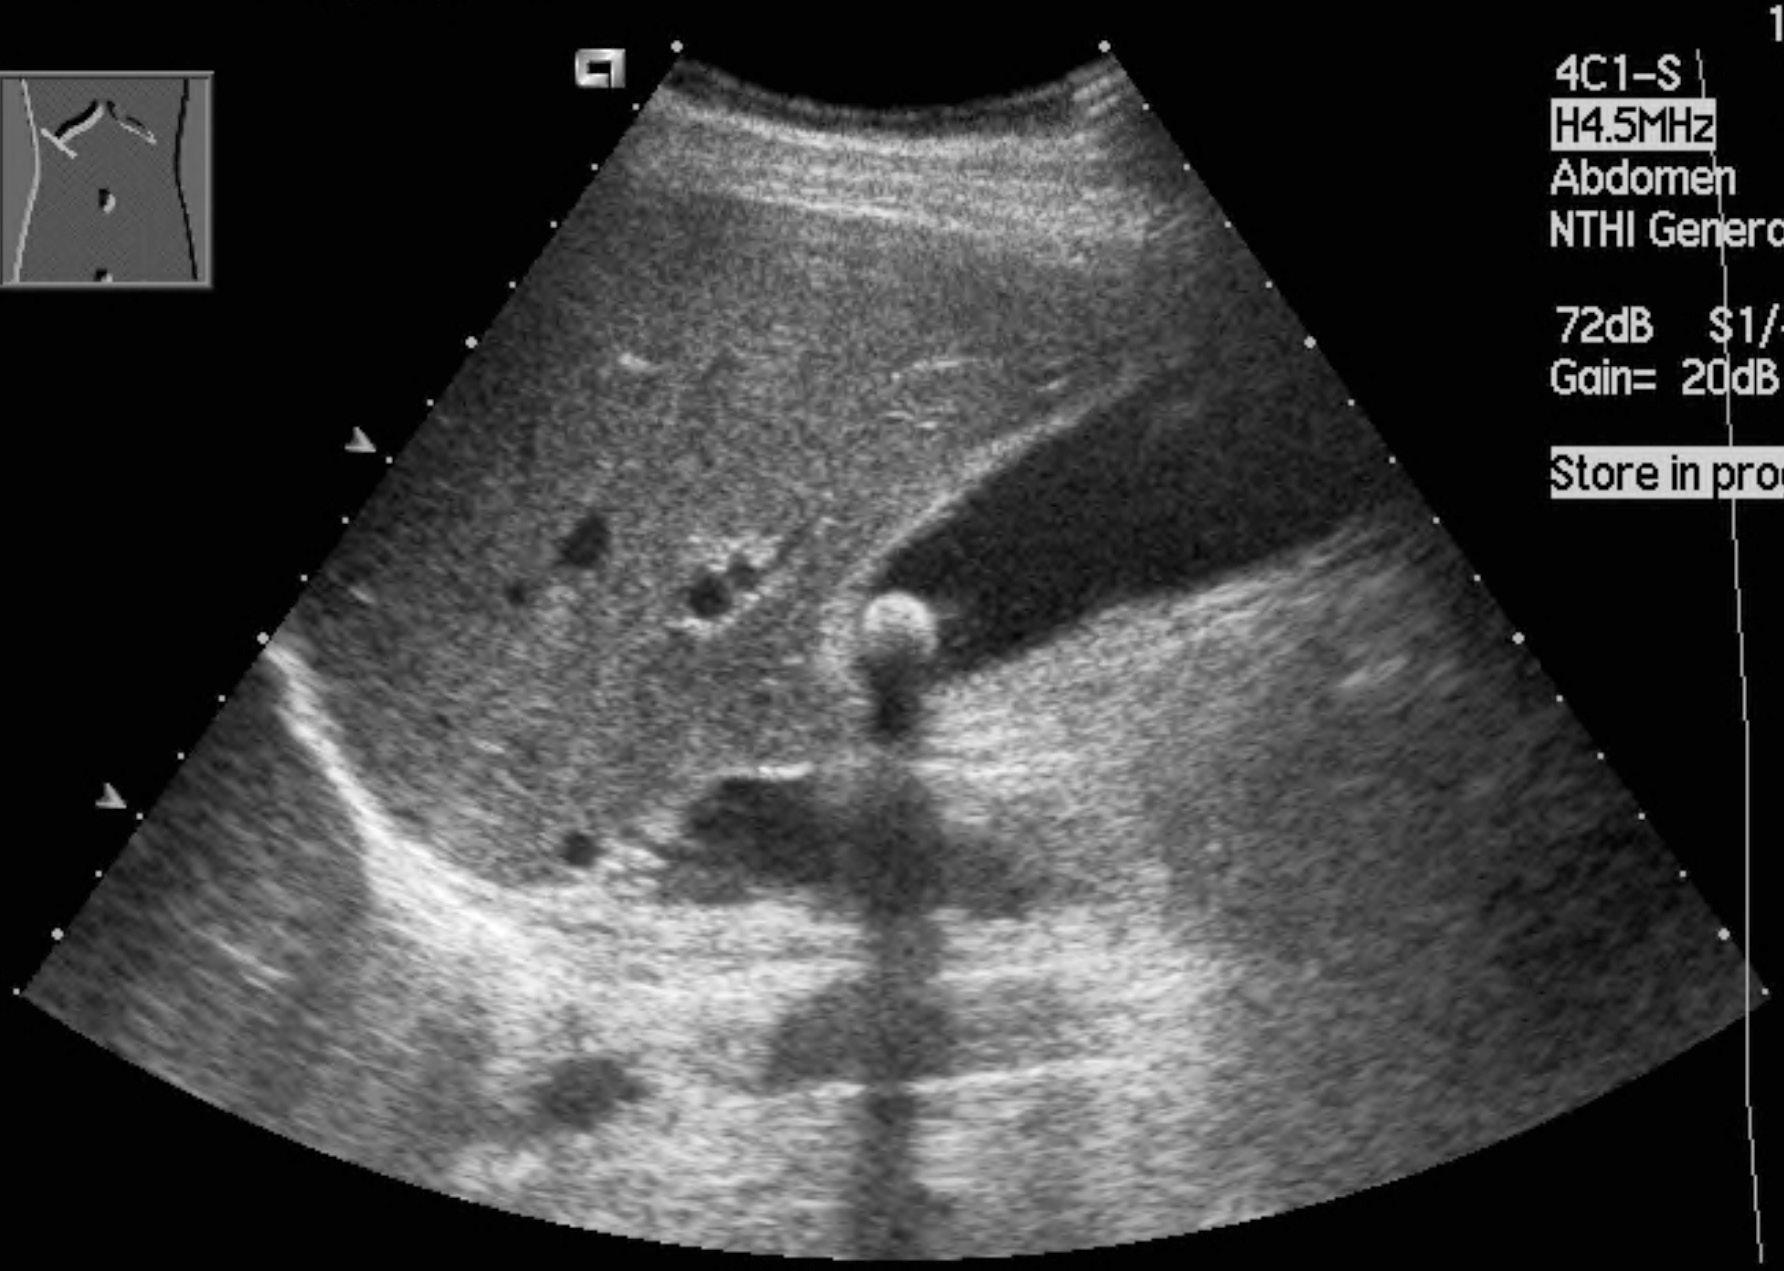
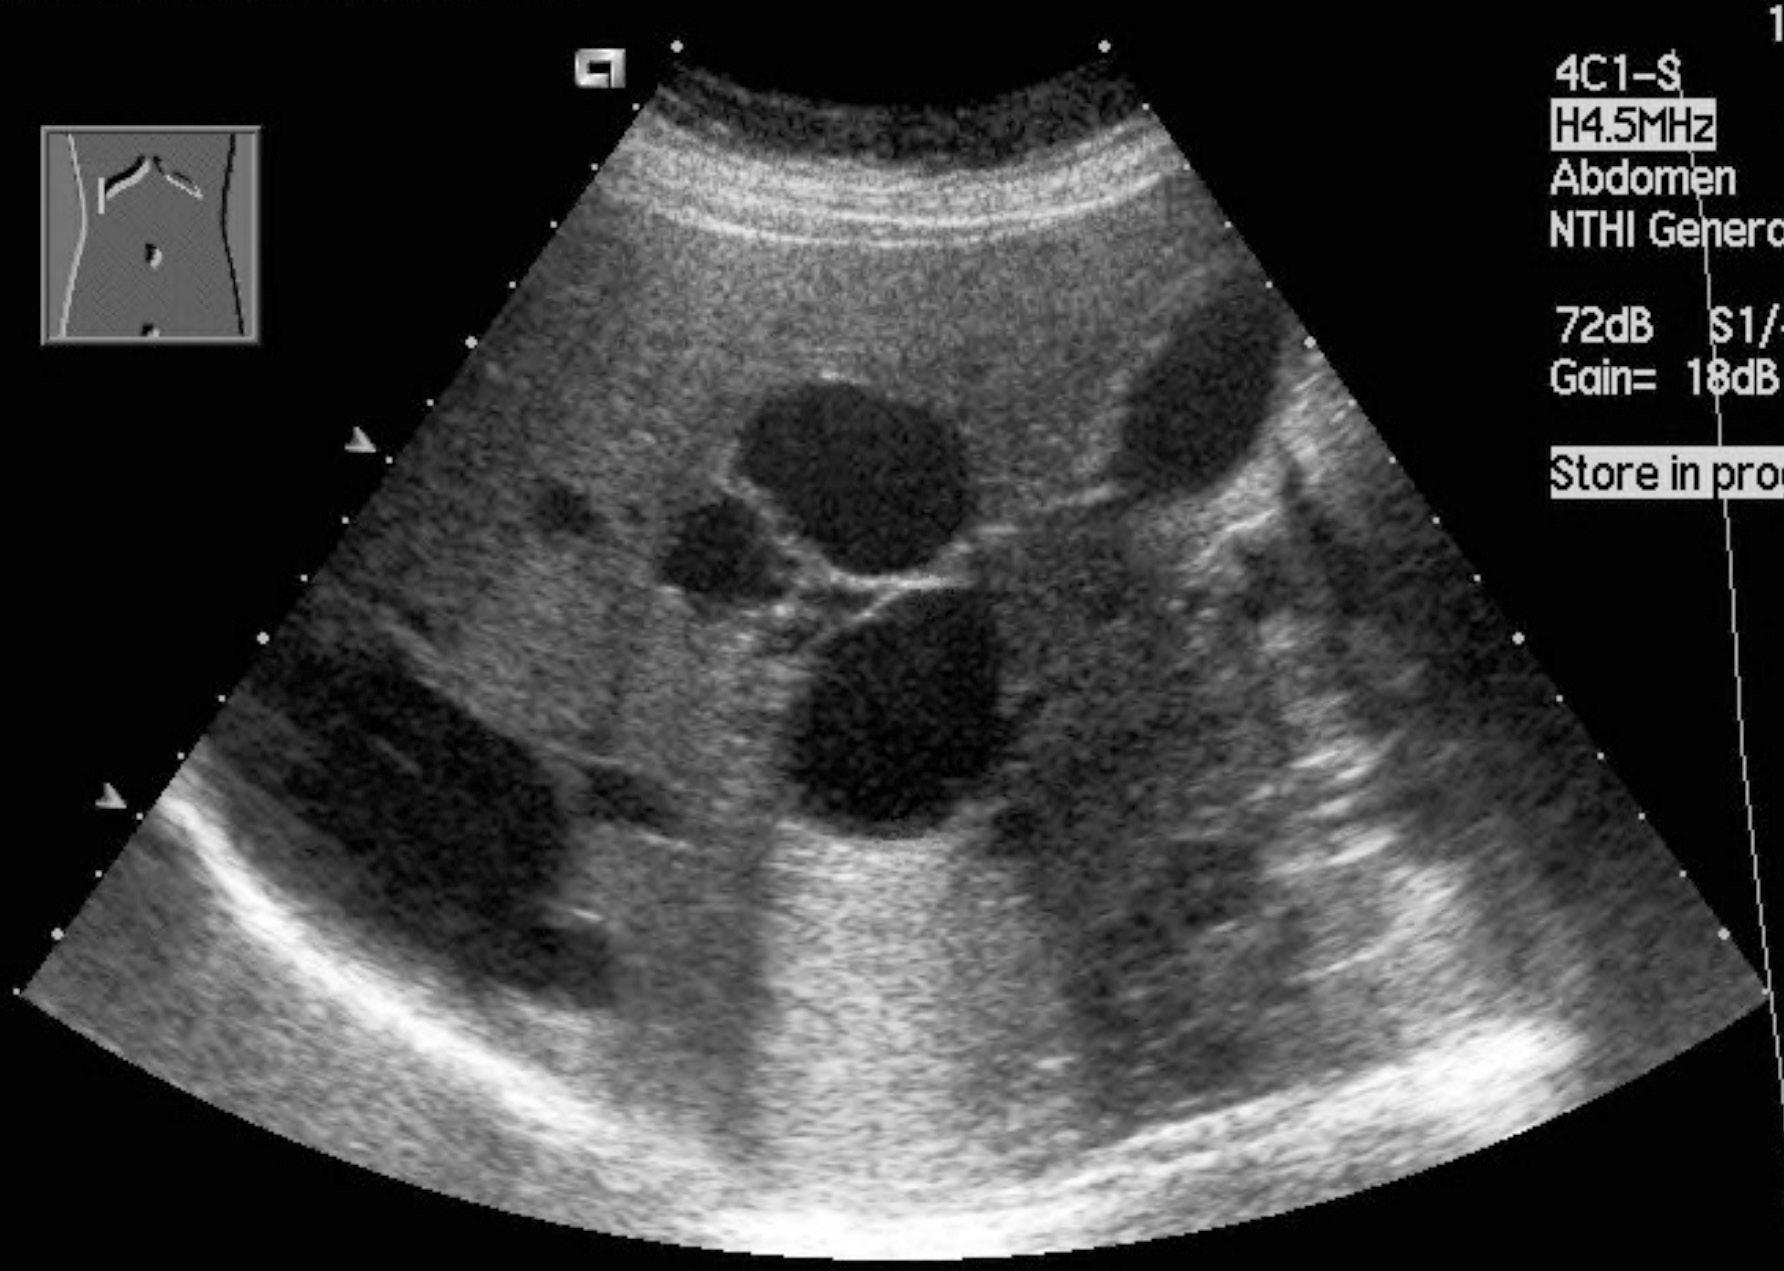
Fig. 2.8 Examples of structures with different echogenicity.
a) In a liver with medium echogenicity, multiple circular anechogenic lesions of different sizes corresponding to cysts are apparent. b) In another patient, an anechogenic gallbladder is shown under the liver, where a strong echo is visible ( ) accompanied by an acoustic shadow ( ). It is a typical image of a stone. c) Another patient – in the posterior part of the liver, a circular hyperechogenic lesion corresponding to the haemangioma is seen. a

b
(or hyperechoic) (with higher echogenicity – lighter on the screen – the tissues with more distinct interfaces), isoechogenic (isoechoic) (with the same echogenicity), hypoechogenic (hypoechoic) (with lower echogenicity – darker on the screen – homogeneous tissue with a lower number of lesser interfaces), and anechogenic (anechoic) (without internal echoes – the image is black or dark – fluids) (Fig. 2.8,
Table 2.1 Echogenicity of some tissues.
Echogenicity Examples of tissue
anechogenic fluid (e.g. urine, bile, cysts’ content, blood in vessels)
hypoechogenic renal parenchyma, lymph nodes, haematoma (usually heterogeneous, often hypo- and hyperechogenic), abscess content, empyema
middle echogenicity normal liver, spleen, thyroid gland
hyperechogenic liver with steatosis, fibrosis, or cirrhosis; pancreas in the elderly or obese patients, haematoma
strong echo with an acoustic shadow bone, calcification, stone, gas (e.g. air in trachea or intestine) Table 2.1). Significantly echogenic lines (strong echo) accompanied by an acoustic shadow in the direction from the probe (an area where no waves spread) indicate the presence of bone, stone, calcification, or gas (Fig. 2.8b). In describing the US finding, the terms hyperechogenic/hypoechogenic most commonly relate to the normal echogenicity of an organ or tissue.
US images can be obtained in different planes. When we are looking at the image, the principle is that, in images in the transverse plane, the left side of a patient is on the right (similar to radiographs), while in images in the sagittal or coronal plane the cranial direction is on the left (Fig. 2.9). A real-time dynamic image is obtained by means of US, allowing us to choose the most favourable projection plane and also to monitor the movement (e.g. vascular pulsation, heart movement, or organ movement during breathing).
In echocardiography, the M-mode (motion mode), producing a set of curves that record the movement of, for example, heart valves, can be used.
Doppler technique. It uses the Doppler phenomenon – changes in the frequency of waves reflected from a moving object. The speed and direction of motion of the object can be determined from the wave frequency change. The movement of blood cells in blood vessels is most commonly examined in diagnostics. Doppler information can be imaged in colours – colour mapping of moving objects against

right

a
left
b

superior inferior

c
Fig. 2.9 Thyroid imaging. a) The position of the probe on the neck to obtain an image in the transverse plane. b) Transverse plane image. The trachea is in the middle of the image and an acoustic shadow can be seen behind it. c) A probe positioned on the neck to obtain an image of the left thyroid lobe in the sagittal plane. d) Image of the left lobe of the thyroid gland in the sagittal plane. The position of the probe in the radiographs (b) and (d) is indicated by a pictogram which is usually located in a corner of the image. d

