2 minute read
The Characteristics of Nonemployer Manufacturing Businesses in Miami Dade County

A nonemployer business is one that has no paid employees, has annual business receipts of $1,000 or more, and is subject to federal income taxes. (U.S. Census)
Advertisement
Make it Miami
U.S. Census analysis for the change in nonemployer establishments nationally shows a significant increase in their number. However, the economic impact, as measured by the share of nonemployer establishment revenues in total revenues, has not increased in roughly 20 years. Nonemployer establishments grew by 2.0 percent from 2015 to 2016 but their real revenues grew by just 0.2 percent, evidence of a very small economic impact. In fact, over the medium term there has been a slight decline in the nonemployer establishment share of all revenue between 2007 and 2016, from 3.3 to 3.1 percent of all revenue.
This section presents the characteristics of nonemployer manufacturing businesses in Miami-Dade County, including the number of establishments, receipts, and average receipts in all sectors of business and the manufacturing sector. The most current data available released by the U.S. Census is for 2016.
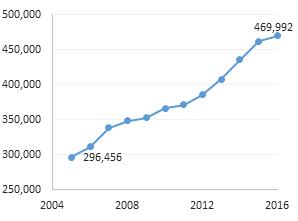
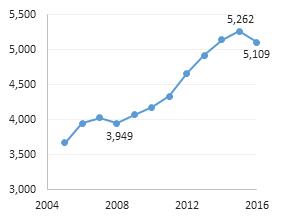
Miami-Dade County had an increase in establishments for all sectors of business every year from 2005 to 2016; with an overall 59% increase from 2005 to 2016 (See Figure 12). Miami-Dade County had an increase in nonemployer manufacturing establishments every year from 2005 to 2016, except for 2007 to 2008; with an overall 39% increase from 2005 to 2016 (See Figure 13).
Figure 12: Number of Non-Employer Business Establishments in Miami-Dade Year-Over-Year
Figure 13: Number of Non-Employer Manufacturing Establishments in MiamiDade Year-Over-Year
Miami-Dade County had an increase in receipts for all sectors of business every year from 2005 to 2016, except for 2007 to 2009 and 2015 to 2016; with an overall 23% increase from 2005 to 2016 after adjusting for inflation (See Figure 14). Miami-Dade County has had an increase in receipts for the manufacturing sector every year from 2005 to 2016, except for 2007 to 2009 and 2015 to 2016; with an overall 10% increase from 2005 to 2016 after adjusting for inflation (See Figure 15).
Figure 14: Non-Employer Business Receipts in Miami-Dade, Year-Over-Year
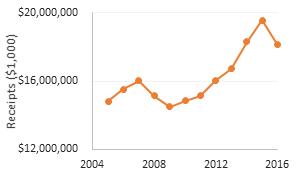
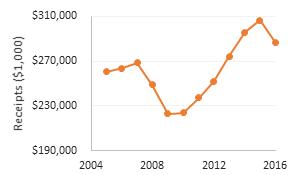
Figure 15: Non-Employer Manufacturing Receipts in Miami-Dade, Year-Over-Year
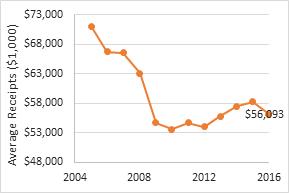
Miami-Dade County had a decrease in average receipts for all sectors of business every year from 2005 to 2016, except for 2010 to 2012 and 2013 to 2015; with an overall 23% decrease from 2005 to 2016 after adjusting for inflation (See Figure 16). Miami-Dade County had a decrease in average receipts in the manufacturing sector every year from 2005 to 2016, except for 2010 to 2011 and 2012 to 2015; with an overall 21% decrease from 2005 to 2016 after adjusting for inflation (See Figure 17).
Figure 16: Average Non-Employer Business Receipts in Miami-Dade, Year-Over-Year
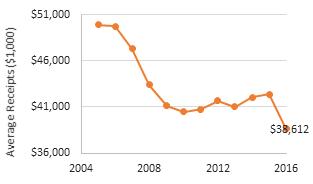
Figure 17: Average Non-Employer Manufacturing Receipts in Miami-Dade, Year-Over-Year