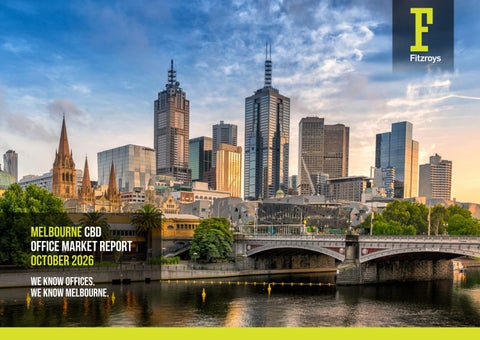
MELBOURNE CBD OFFICE MARKET REPORT OCTOBER 2026 WE KNOW OFFICES. WE KNOW MELBOURNE.
CONTENTS 03
SUPPLY
05
PRE COMMITMENTS
06
DEMAND
08
VICTORIAN EMPLOYMENT
09
TENANT ENQUIRY
11
VACANCY
13
VACANCY BY GRADE
14
OUTLOOK
15
RENTS & INCENTIVES
16
OFFICE LEASING TEAM
SUPPLY In line with Victoria’s growing economy, Melbourne’s CBD office market continued to increase with total stock now surpassing 5.3 million square metres for the first time
MELBOURNE CBD OFFICE SPACE BY PRECINCT Melbourne CBD Office Space by Precinct
on record. Melbourne’s CBD office market increased by 29,823 square metres over the first half of 2026 and remains Australia’s second largest office market.
33%
Melbourne’s CBD office market grew as a result of the recent completion of the new
5%
developments of 7 Spencer Street and 51 Flinders Lane which collectively added 73,300 square metres to the market. In contrast, 46,575 square metres were
9%
withdrawn from the CBD office market largely through refurbishments with some stock permanently removed due to obsolescence and mooted for redevelopment. The Western precinct continues to hold the most office space in the Melbourne CBD with 33% followed by the Docklands which comprises 1.2 million square metres having increased by almost 60% over the past 10 years. As at July 2026, A-Grade space accounts for more than half of all office space across the Melbourne CBD. Over the past 10 years, the level of A-grade office stock has grown the most with 569,752 square metres added to the Melbourne CBD market.
Civic Docklands Eastern Flagstaff North Eastern Spencer Western
10%
5%
14% 24% Source: Property Council of Australia
In contrast, the levels of both C-Grade and D-Grade office stock in the Melbourne CBD office market declined over the past decade as the demands of tenants have led to the withdrawal of several obsolete buildings.
3
FITZROYS CBD OFFICE MARKET REPORT | OCTOBER 2026
In terms of quality of space, as at July 2026, A-Grade quality office space accounts for more than half of all office space across the Melbourne CBD. Over the past 10 years, the level of Agrade office stock has grown the most with 569,752 square metres added to the Melbourne CBD market. In contrast, the levels of both C-Grade and D-Grade office stock in the Melbourne CBD office market declined over the past decade as the demands of tenants have led to the withdrawal of several obsolete buildings to be redeveloped for either alternative uses or new office developments.
SUPPLY
Impacted by the persistently elevated vacancy rates and high construction costs, the level of new development across the Melbourne CBD office market continues to decline. Currently there are four new developments which are under construction or have begun siteworks. Looking ahead through to 2029, the pipeline of new supply is expected to deliver almost 135,000sqm of new and refurbished space across the Melbourne CBD, around 40% the longterm average. Of the stock currently under development and refurbishment, the location of the new supply is largely focused in the Western precinct followed by the Docklands and Civic precincts.
MELBOURNE CBD NEW OFFICE SUPPLY
Impacted by persistently elevated vacancy rates and high construction costs, the level of new development across the Melbourne CBD office market continues to decline. Currently there are only four new developments which are under construction or have begun siteworks. Looking ahead through to 2029, the
square metres
400,000
pipeline of new supply is expected to deliver 135,000sqm of new and refurbished
Under Construction
space across the Melbourne CBD, around 40% of the long-term average. Of the stock currently under development and refurbishment, the location of the new
Melbourne CBD New Office Supply Completions
Forecast
300,000
supply is largely in the Western precinct followed by the Docklands and Civic precincts. 200,000
100,000
0
2013 2014 2015 2016 2017 2018 2019 2020 2021 2022 2023 2024 2025 2026 2027 2028 Source: Property Council of Australia
Pre-commitments
4
FITZROYS CBD OFFICE MARKET REPORT | OCTOBER 2026
While just over half of the space that is under construction is pre-committed, given the relatively modest level of new supply, the volume of un-committed space stock which will be delivered to the market, is unlikely to substantially adversely affect the vacancy rate of Melbourne CBD office market in coming years; in fact, with development activity projected to remain below average levels for the medium term, it is likely that pre-leasing activity within offices under construction will rise as tenants relocate from older buildings.
PRE-COMMITMENTS While just over half of the space under construction is pre-committed,
Beyond those offices currently under construction, there are some
given the relatively modest level of new supply, the volume of un-committed
projects holding development approvals, that have been postponed including
space delivered to the market is unlikely to substantially adversely affect the
60 Collins Street (42,182sqm) and 600 Collins Street (60,000sqm).
vacancy rate in coming years. In fact, with development activity projected to remain below average levels for the medium term, it is likely that pre-leasing activity within offices under construction will rise as tenants relocate from older buildings.
Given the elevated vacancy rate, it is likely that there will be no significant new office developments until after 2030 with refurbishments the likely main source of additional office space.
cbd OFFICE projects - under construction/SITEWORKS Building Address
Type
Tenant
Total NLA (sqm approx)
Target Completion
435 Bourke Street
New Development
CBA, Baker McKenzie, Korda Mentha, Host Plus
62,500
Q4 2026
720 Bourke Street
Refurbishment
Coles
29,000
Q3 2027
26 Flinders Street
New Development
N/A
10,000
Q1 2028
393 Swanston Street
New Development
N/A
13,000
Q3 2028
25 Swanston Street
New Development
N/A
16,000
Q4 2028
5
FITZROYS CBD OFFICE MARKET REPORT | OCTOBER 2026
DEMAND Despite the uncertainty resulting from global economic conditions, tenant enquiry
In terms of net absorption by precinct, over the six months to July 2026, the Eastern
levels within the CBD are improving. The Melbourne CBD recorded its strongest annual
precinct led all other Melbourne CBD office precincts, having recorded net absorption
level of net absorption in the 12 months to July 2026 in seven years.
of 18,911 square metres followed by the Flagstaff precinct which recorded net
According to the Property Council of Australia, the Melbourne CBD office market recorded positive net absorption of 26,779 square metres in the six months to July 2026, equating to a total of 54,808 square metres absorbed over the year to July 2026. In fact, the Melbourne CBD office market recorded the strongest annual level of net absorption level across all of Australian office market in the 2026 financial year. Boosted by tenants’ growing optimism and knowledge of the constrained development pipeline, tenants are bringing forward their space commitments. Annual tenant demand levels have reached seven-year highs, with occupiers remaining focused on better quality well-located offices offering superior amenities. This flight to quality trend is demonstrated by A-grade offices outperforming all other grades in the Melbourne CBD with 53,460 square metres absorbed within A-grade office stock over the six months to July 2026. While Premium-grade offices recorded
absorption of 15,455 square metres. The Civic and Docklands precincts recorded positive net absorption in the first half of
Demand
2026 however, the Western Core, Spencer and North Eastern precincts, all recorded
Despite the uncertainty from globaltoeconomic negative net absorptionresulting over the six months July 2026. conditions, promisingly, leasing activity is picking up across the Melbourne CBD with tenant enquiry levels having also risen. The Melbourne CBD office market recorded its strongest annual level of net absorption in the 12 months to July 2026 in seven years. square metres
Melbourne CBD Annual Net Absorption
150,000 100,000 50,000
negative net absorption, overall, prime (Premium and A-grade) stock recorded positive net absorption over the first half of 2026. In contrast, B-grade and C-grade
MELBOURNE CBD ANNUAL NET ABSORPTION
10-year average 17,800sqm
0
offices both recorded negative net absorption in the six months to July 2026, equating to secondary office space experiencing negative net absorption of 11,698 square metres in the six months to July 2026. In fact, over the past eight financial years, secondary office space in the Melbourne CBD office market recorded negative annual net absorption.
6
FITZROYS CBD OFFICE MARKET REPORT | OCTOBER 2026
-50,000 -100,000 -150,000
Source: Property Council of Australia
VICTORIAN EMPLOYMENT
Victoria's labour market has weakened noticeably through 2026. The state's unemployment rate climbed to 5.1% in July 2026, the highest in the nation and the state's worst reading since October 2021. Employment has only grown modestly in 2026 to date, adding only 13,700 jobs with full-time roles shrinking offset by growth in part-time roles. The state's long-declining manufacturing sector has left it overly reliant on lower-productivity service industries, while job advertisements have also been trending down. Absent a pickup in business investment, Victoria's jobless rate is likely to keep drifting higher through the rest of 2026.
Victoria’s labour market has weakened noticeably through 2026. The state’s unemployment rate climbed to 5.1% in July 2026, the highest in the nation and the state’s worst reading since October 2021. Employment has only grown modestly in 2026 to date, adding only 13,700 jobs with full-time roles shrinking offset by growth in part-time
annual employment change
VICTORIAN EMPLOYMENT (ALL)
Victorian Employment
300,000
roles. The state’s long-declining manufacturing sector has left it overly reliant on lower-productivity service industries, while job advertisements have also been trending down. Absent a pickup in business investment,
200,000
100,000
Victoria’s jobless rate is likely to keep drifting higher through the rest of 2026.
0
-100,000
Source: ABS / Fitzroys
In terms of net absorption by precinct, over the six months to July 2026, the Eastern core led all other Melbourne CBD office precincts, having recorded net absorption of 18,911 square metres followed by the Flagstaff precinct which recorded net absorption of 15,455 square metres. The Civic and Docklands precincts also recorded positive net absorption in the first half of 2026, however the Western Core, Spencer and North Eastern precincts all recorded negative net absorption over the six months to July 2006. 7
FITZROYS CBD OFFICE MARKET REPORT | OCTOBER 2026
Tenant Enquiry
TENANT ENQUIRY Despite the uncertain economic conditions, tenant enquiry in the Melbourne CBD office market has strengthened through the first half of 2026, reaching its strongest levels
SIGNIFICANT BRIEFS
since 2020. Seemingly out of alignment with the elevated vacancy rate, the pick up in
Tenant
NLA (sqm) Required
tenant demand may be stimulated by the constrained development pipeline rather than
Deloitte
22,000 - 27,000
underlying economic weakness. For smaller occupiers, fitted space continues to be
HESTA
9,000- 11,000
Sportsbet
8,000 - 10,000
Dorevitch Pathology (Fringe)
7,500 - 11,000
Demand remains strongest for high-quality space in the Melbourne CBD’s Eastern Core,
Nine
7,000 - 9,000
particularly Premium and A-grade towers along Collins, Exhibition and Bourke Streets,
WSP
5,000 - 7,000
where proximity to public transport, key amenities and high sustainability credentials
MUFG Pension & Market Services
5,000 - 7,000
continue to drive tenant preference.
La Trobe University
4,000 - 6,000
Federal Government Office Accomodation
4,500 - 5,000
City FM
4,500 - 5,000
favoured as tenants prioritise minimal disruptions to business operations and an aversion to fund fitouts themselves.
Tenant enquiry for Melbourne CBD office accommodation remains diverse, with demand continuing to be led by Finance and Insurance followed by Professional Services, IT and Telecommunications, Healthcare and Logistics. In contrast, office demand from the State Government sector continues to decline. The outlook for tenant enquiry is becoming more positive. With no new office construction currently anticipated to 2030, the growing disconnect between improving tenant demand and a constrained future supply pipeline, is expected to support tighter market dynamics.
8
FITZROYS CBD OFFICE MARKET REPORT | OCTOBER 2026
TENANT ENQUIRY LEASING TRANSACTIONS - CBD & DOCKLANDS
9
Building Address
Grade
Tenant
NLA (sqm)
700 Bourke Street
A
NAB
63,000
181 William Street
A
Court Services Australia
10,000
120 Harbour Esplanade
A
CQU
8,922
8 Exhibition Street
Premium
Insignia
8,424
One Melbourne Quarter, 699 Collins Street
A
Jetstar
7,000
2 Lonsdale Street
A
IBAC
5,783
35 Collins Street
A
BDO
5,200
51 Flinders Lane
New
WPP
4,600
161 Collins Street
A
APA
3,900
435 Bourke Street
New
Korda Mentha
3,600
435 Bourke Street
New
Hostplus
3,600
530 Collins Street
Premium
Toll
3,485
567 Collins Street
Premium
Vestas
2,604
530 Collins Street
Premium
Equity Trustees
2,516
130 Lonsdale Street
A
ESS Super
2,400
80 Collins Street
A
AON
2,235
664 Collins Street
A
SG Fleet Australia Pty Ltd
2,235
567 Collins Street
Premium
Oracle
2,100
51 Flinders Lane
New
FM Global
2,025
181 William Street
A
Engineers Australia
1,975
101 Collins Street
Premium
BGH Capital Group
1,821
8 Exhibition Street
Premium
Kingside
1,618
FITZROYS CBD OFFICE MARKET REPORT | OCTOBER 2026
VACANCY
Vacancy The vacancy rate of the Melbourne CBD office market marginally fell to 18.9% over the six months to July 2026, down from 19.0% six months earlier, aided by the above-average level of withdrawal of stock. According to the Property Council, the total Melbourne CBD office vacancy rate continues to sit more than double its 30-year average of 9.2%.In comparison to the other Australian CBD office markets, Melbourne’s vacancy is higher than all other markets with Sydney’s CBD vacancy rate sitting at 13.3% - slightly lower than its level recorded in January 2026 and Brisbane at 10.2%. Elsewhere the office vacancy rate rose in Adelaide, and Canberra in the six months to July 2026. Overall, the total Australian CBD office vacancy rate increased to 14.9% as at July 2026, the highest rate since 1995. Outside of the CBD office markets, the overall vacancy rate of the Australian non-CBD office markets remained elevated, increasing to 18.9%, its highest rate since 1993.
The vacancy rate of the Melbourne CBD office market fell only marginally to 18.9% over the six months to July 2026, down from 19.0% six months earlier. This was aided by the above average level of withdrawal of stock. According to the Property Council, the total Melbourne CBD office vacancy rate continues to sit more than double its 30-year average of 9.2%. In comparison to the other Australian CBD office markets, Melbourne’s vacancy is higher than all other markets with Sydney’s CBD vacancy rate sitting at 13.3% and Brisbane at 10.2%. Elsewhere the office vacancy rate rose in Adelaide and Canberra in the six months to July 2026. Overall, the total Australian CBD office vacancy rate increased to 14.9% as at July 2026, the highest rate since 1995. Outside of the CBD office markets, the overall vacancy
Brisbane 10.2%
Perth 15.4%
Sydney 13.3% Canberra 14.7%
rate of the Australian non-CBD office markets increased to 18.9%, its highest rate since 1993.
Adelaide 16.3% Melbourne 18.9%
Elsewhere in Melbourne, the vacancy rate of the St Kilda Road office market continued to increase, having risen to record high as at July 2026, reaching 31.8%. The
Hobart 5.2%
vacancy rate in the Southbank office market increased to 18.8%; its highest level since 1995 with vacancy remaining relatively steady in the East Melbourne office precinct at 10.0%.
Elsewhere in Melbourne, the vacancy rate of the St Kilda Road office market continued to
increase, having risen toJuly record high as at July 2026, reaching 31.8%, while2026 the vacancy rate in Market 2026 January the Southbank office market also rose, increasing to 18.8%; its highest level since 1995 with vacancy remaining relatively steady in the East Melbourne office market at 10.0%.
Stock (sqm)
Market St Kilda Road
Southbank St Kilda Road EastSouthbank Melbourne
East Melbourne
Vacancy Rate
July 2026 589,868 31.8% Stock (sqm) Vacancy Rate 413,159 18.8%31.8% 589,868 413,159 182,472 10.0%18.8% 182,472 10.0%
Vacancy Rate
January 2026 Vacancy Rate 15.0%31.6% 10.1%15.0% 10.1%
31.6%
Source: Property Council of Australia
10
FITZROYS CBD OFFICE MARKET REPORT | OCTOBER 2026
VACANCY
Vacancy by Grade Despite the mixed fortunes of Premium and A-grade Melbourne CBD office stock, the prime vacancy rate of the Melbourne CBD office market fell in the six months to July 2026, its first decline in six years. Boosted by the withdrawal of space for refurbishment, the vacancy rate of Premium office stock in the Melbourne CBD office market fell to 13.1%, albeit continues to remain more than double the 10-year average. In contrast, despite positive take up, the vacancy rate of A-grade office space in the Melbourne CBD office market, continued to increase, rising to 20.8% - its highest level in 22 years. Although the vacancy rate of B-grade and D-grade Melbourne CBD offices recording marginal declines, the secondary office vacancy rate of the Melbourne CBD office market rose to 18.6% over the six months to July2026.
MELBOURNE CBD OFFICE VACANCY
The vacancy rate of prime grade buildings fell in the six months to July 2026, its first decline in six years. Boosted by the withdrawal of space for refurbishment, the vacancy rate of Premium office stock in the Melbourne CBD office market fell to 13.1%, albeit continues to remain more than double the 10-year average. In contrast,
20.0%
Prime
despite positive take up, the vacancy rate of A-grade office space in the Melbourne CBD office market, continued to increase, rising to 20.8% - its highest level in 22
Melbourne CBD Office Vacancy
total vacancy
Secondary
Total
15.0%
years. SUB LEASE VACANCY The sub-lease vacancy rate and the quantum of sub-lease vacancy has continued to fall in the CBD, having declined to six-year lows as at July 2026. As at July 2026,
10.0%
5.0%
sub-lease vacancy totalled 44,868 square metres, resulting in a sub-lease vacancy rate of 0.8%, with both measures now also below their respective 10-year averages.
0.0%
Collectively, Premium and A-grade office space account for 89% of total sub-lease vacancy across the Melbourne CBD office market as at July 2026. With the exception of Flagstaff, all individual office precincts recorded decreases in sub-lease levels
Source: Property Council of Australia
over the six months to July 2026. The North Eastern precinct still records the highest level of sub-lease space with almost 13,300 square metres, accounting for approximately 30% of the Melbourne CBD office market’s total sub-lease vacancy.
11
FITZROYS CBD OFFICE MARKET REPORT | OCTOBER 2026
Sub-lease Vacancy Pleasingly, both the sub-lease vacancy rate and the quantum of sub-lease vacancy on offer across the Melbourne CBD office market has continued to fall, having declined to six-year lows as at July 2026. As at July 2026, sub-lease vacancy totalled 44,868 square metres, resulting in a sub-lease vacancy rate of 0.8%, with both measures now also below their respective 10-year averages. Collectively, Premium and A-grade office space account for 89% of total sub-lease vacancy across the Melbourne CBD office market as at July 2026. With the exception of Flagstaff, all individual office precincts recorded decreases in sub-lease levels over the six
VACANCY
Vacancy by Precinct Across Melbourne’s CBD office market, by precinct, vacancy rates fluctuated – impacted by the withdrawal and addition of stock along with tenant commitments. The Civic, Flagstaff and Spencer precincts recorded decreases in their vacancy rates in the six months to July 2026. In contrast, the vacancy rates of the Docklands, Eastern, North Eastern and Western precincts increased over the six months to July 2026. Collectively, the Western and Docklands precincts account for 60% of the Melbourne CBD office market, whereas the precinct with the lowest level of vacant office space was the North Eastern precinct which accounted for less than 6% of all office vacancy across the Melbourne CBD office market.
VACANCY BY PRECINCT
MELBOURNE OFFiceVacancy vacancy by by precinct Melbourne CBDCBD Office Precinct
square metres
The Civic, Flagstaff and Spencer precincts recorded decreases in their vacancy rates in the six months to July 2026. In contrast, the vacancy rates
400,000
Jul-26
of the Docklands, Eastern, North Eastern and Western precincts increased over the six months to July 2026. Collectively, the Western and Docklands precincts account for 60% of the Melbourne CBD office market, whereas the
Jan-26
Jul-25
Docklands
Eastern
300,000
precinct with the lowest level of vacant office space was the North Eastern precinct which accounted for less than 6% of all office vacancy.
200,000
100,000
0
Civic
Flagstaff
North Eastern
Spencer
Western
Source: Property Council of Australia
12
FITZROYS CBD OFFICE MARKET REPORT | OCTOBER 2026
OUTLOOK
Outlook While the total vacancy rate of the Melbourne CBD office market recorded a marginal decrease over the six months to July 2026, for the short term; the vacancy rate is projected to remain relatively stable as the government contracts and full-time employment across the state also declining. Although the attractive leasing terms on offer within the CBD office market will stimulate tenants to move, the constrained development pipeline of projects currently under construction and unlikelihood of launch of additional new office developments is expected to underpin a decline in the total vacancy rate in coming years.
While the total vacancy rate of the Melbourne CBD office market recorded a marginal decrease over the six months to July 2026, the vacancy rate is projected to remain relatively stable as government contracts and full-time
total vacancy
25.0%
Forecast
employment across the state declines. A combination of attractive leasing terms and the constrained development pipeline is expected to underpin a
MELBOURNE CBD vacancy projection Melbourne CBD Vacancy Projection
20.0%
decline in the total vacancy rate in coming years. 15.0% 10.0% 5.0% 0.0%
Source: Property Council of Australia / Fitzroys
13
FITZROYS CBD OFFICE MARKET REPORT | OCTOBER 2026
RENTS & INCENTIVES
Although average gross face Melbourne CBD office rents increased over the year to July 2026, growth was diverse across grades and precincts, reflecting the demand for quality of individual office buildings and competing vacancies. On average, Melbourne CBD office prime net face rents increased by 2.9% over the year to July 2026, however incentive levels continue to remain at historic highs mirroring the elevated vacancy rate. While secondary net face rental levels also increased, average levels rose marginally overt the 12 months to July 2026, reflecting the modest tenant demand and competitive leasing terms on offer with Premium and A-grade office stock. Looking forward, prime offices in the Melbourne CBD are projected to record more solid net effective rental growth from early-2027 as incentives levels begin to trend down from their current historical highs. In contrast, rental growth for secondary offices will likely stay modest until vacancy rates peak, with tenants remaining selective due to the abundance of potential opportunities to relocate.
Melbourne CBD office prime net face rents on average increased by 2.9% over
annual change
the year to July 2026 however, incentive levels continue to remain at historic
10%
Prime Melbourne CBDCBE Office Face Rents PRIME MELBOURNE OFFICE Net NET FACE RENTS
highs mirroring the elevated vacancy rate. While secondary net face rental levels increased, average levels rose marginally over the 12 months to July 2026, reflecting the modest tenant demand and competitive leasing terms on
8%
offer with Premium and A-grade office stock. Looking forward, prime offices in the Melbourne CBD are projected to record net effective rental growth from 2027 as incentives levels begin to plateau and trend down from their current historical highs. In contrast, rental growth for
6%
4%
secondary offices will likely stay modest until vacancy rates peak, with tenants remaining selective due to the volume of potential relocation options.
2%
0%
Civic
Docklands
Eastern
Flagstaff
North Eastern
Spencer
Western Source: Fitzroys
14
FITZROYS CBD OFFICE MARKET REPORT | OCTOBER 2026
OFFICE LEASING TEAM Phillip Cullity DIRECTOR cullityp@fitzroys.com.au
established
1973
Stephen Land ASSOCIATE DIRECTOR lands@fitzroys.com.au
Sam Flockart LEASING NEGOTIATOR flockarts@fitzroys.com.au
WE KNOW OFFICES. WE KNOW MELBOURNE.
MELBOURNE CBD OFFICE MARKET REPORT
We Know Melbourne. Endnotes: All data presented in this report is considered to be true and correct at the time of publication and for general information only; Fitzroys make no warranties or representations with respect to the accuracy or completeness of that information after publication and bear no liability with respect to this information. Fitzroys strongly recommends that readers obtain any appropriate professional financial or investment advice relevant to their particular circumstances. To the maximum extent permitted by law, Fitzroys disclaims all liability for any loss, damage, expense and costs incurred by any person arising out of accessing, downloading, using or relying on any information in this report. Links to external websites: This report contains reference links to external websites which may contain views or recommendations of third parties, hypertext links, frames or other references to other parties and their websites. Fitzroys does not warrant or accept any legal liability whatsoever arising from or in connection with, the accuracy, reliability, currency or completeness of any material contained on any linked site.
16
Licensed Estate Agents Auctioneers Asset Managers Consultant and Valuers fitzroys.com.au 9275 7777 360 Collins Street Melbourne