FISHER’S
NANTUCKET REAL ESTATE
SEPT ‘26 REVIEW
KEY MARKET METRICS
Market Insights BY JEN ALLEN
ALL PROPERTY TYPES
2026
% CHANGE YOY
5-YEAR AVG.
218
277
-21% f
300
Dollar Volume ($ in 000s)
$947,137
$1,116,166
-15% f
$992,974
Median Home Sale Value
$3,997
$3,300
21% d
$3,497
Sale Price to Last Ask
95%
94%
1d
95%
Active Listings
163
185
-12% f
178
Projected Absorption
5
6
-18% f
5.4
New Monthly Contracts
43
61
-30% f
47
Transactions
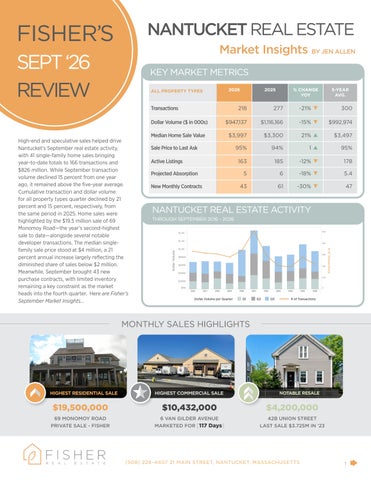
NANTUCKET REAL ESTATE ACTIVITY THROUGH SEPTEMBER 2016 - 2026
Dollar Volume
# of Transactions
High-end and speculative sales helped drive Nantucket’s September real estate activity, with 41 single-family home sales bringing year-to-date totals to 166 transactions and $826 million. While September transaction volume declined 15 percent from one year ago, it remained above the five-year average. Cumulative transaction and dollar volume for all property types quarter declined by 21 percent and 15 percent, respectively, from the same period in 2025. Home sales were highlighted by the $19.5 million sale of 69 Monomoy Road—the year’s second-highest sale to date—alongside several notable developer transactions. The median singlefamily sale price stood at $4 million, a 21 percent annual increase largely reflecting the diminished share of sales below $2 million. Meanwhile, September brought 43 new purchase contracts, with limited inventory remaining a key constraint as the market heads into the fourth quarter. Here are Fisher’s September Market Insights...
2025
Dollar Volume per Quarter
Q1
Q2
Q3
# of Transactions
MONTHLY SALES HIGHLIGHTS
HIGHEST RESIDENTIAL SALE
HIGHEST COMMERCIAL SALE
NOTABLE RESALE
$19,500,000
$10,432,000
$4,200,000
69 MONOMOY ROAD PRIVATE SALE - FISHER
6 VAN GILDER AVENUE MARKETED FOR [117 Days]
42B UNION STREET LAST SALE $3.725M IN ‘23
(508) 228–4407 21 MAIN STREET, NANTUCKET, MASSACHUSETTS
1
FISHER’S SEPT ‘26 REVIEW Market Insights BY JEN ALLEN SINGLE-FAMILY SALES ACTIVITY HIGH END AND SPECULATIVE SALES LED SEPTEMBER TRANSACTIONS
2026
Transactions Total Sales Dollar Volume
2025
% Change
5 Year Avg.
166
190
-13% f
169
$826,141,929
$886,625,425
-7% f
$797,678,169
Avg. Selling Price
$4,976,759
$4,666,450
7% d
$4,730,193
Median Selling Price
$3,997,000
$3,300,000
21% d
$3,497,400
Avg. Months on Market
4.6
4.0
15% d
3.7 96%
Avg. Price as % of Last Ask
95%
94%
1d
Avg. Price as % of Original Ask
92%
90%
2d
93%
Avg. Price as % of Assessed Value
153%
161%
-8 f
165%
• Single-family home sales (excluding condos, co-ops & 40B or covenant properties) totaled 41 transactions in September, a decline of 15 percent from one year ago but ahead of the five-year average while monthly dollar volume fell by a commensurate amount. Cumulative dollar volume through the end of the third quarter measured 166 single-family home sales totaling $826 million, a respective decline of 13 percent and 7 percent from the same period in 2025. • September sales included the second highest sale of the year thus far with the $19.5 million transfer of 69 Monomoy Road. It also included a handful of higher end speculative sales. These developer transactions included the $12 million sale of 15 Deer Run Road, the $9.375 million sale of 6 Gull Island Lane, the $6.25 million sale of 10 Silver Street and the $4.9 million sale of 4 Sunset Hill Lane. Through September, there have been 12 speculative sales compared to 14 at the same time with an average sale price of approximately $6 million, slightly lower than one year ago.
MEDIAN SELLING PRICE & DAYS ON MARKET • The median single-family home value was $4 million as of September 30, 2026, 21 percent higher than in 2025 and 14 percent higher than the five-year average. The year-over-year rise in the median sale value can be largely attributed to the sizable decline in home sales under $2 million. These sales represented 20 percent of transaction activity in 2025 and 21 percent over the five-year average. Thus far in 2026, they have represented just 10 percent. While other price points have also seen an upward shift in 2026, this segment was the most pronounced.
MARKETING TIMES TRENDED SLIGHTLY UPWARD
• After plummeting to 2.7 months on the market in 2022, the average marketing time for single-family home was 4.6 months as of September 30, 2026. This represented a slight rise from the 4 months average time in 2025. September sales averaged 3.6 months of marketing so it’s possible the metric continues to drop as we head into the fourth quarter.
Avg. Days on Market
CONTRACT ACTIVITY NEW PURCHASES MARKEDLY LOWER IN SEPTEMBER
Median Selling Price
• During the month of September, there were 43 new purchase contracts recorded, a nearly identical number to July but a significant drop from August activity. With just over 100 homes for sale, we suspect the drop is largely due to limited inventory but certainly wasn’t aided by the recent increase in mortgage rates. • Of the contracts that were publicly recorded during September, the majority (19%) were for properties last priced between $2 million and $3 million. Properties last listed between $4 million and $5 tallied 14 percent while there were two contracts (5%) for properties last listed above $10 million.
July
August
September
(508) 228–4407 21 MAIN STREET, NANTUCKET, MASSACHUSETTS
2