May Market Insights - Nantucket Real Estate

Page 1


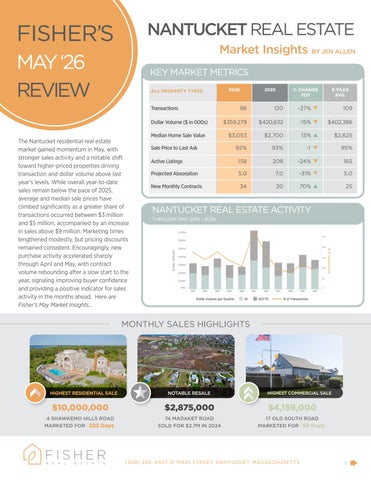
The Nantucket residential real estate market gained momentum in May, with stronger sales activity and a notable shift toward higher-priced properties driving transaction and dollar volume above last year’s levels. While overall year-to-date sales remain below the pace of 2025, average and median sale prices have climbed significantly as a greater share of transactions occurred between $3 million and $5 million, accompanied by an increase in sales above $9 million. Marketing times lengthened modestly, but pricing discounts remained consistent. Encouragingly, new purchase activity accelerated sharply through April and May, with contract volume rebounding after a slow start to the year, signaling improving buyer confidence and providing a positive indicator for sales activity in the months ahead. Here are Fisher’s May Market Insights...
KEY MARKET METRICS
MAY ‘26 REVIEW

Market Insights BY

RESIDENTIAL SALES ACTIVITY

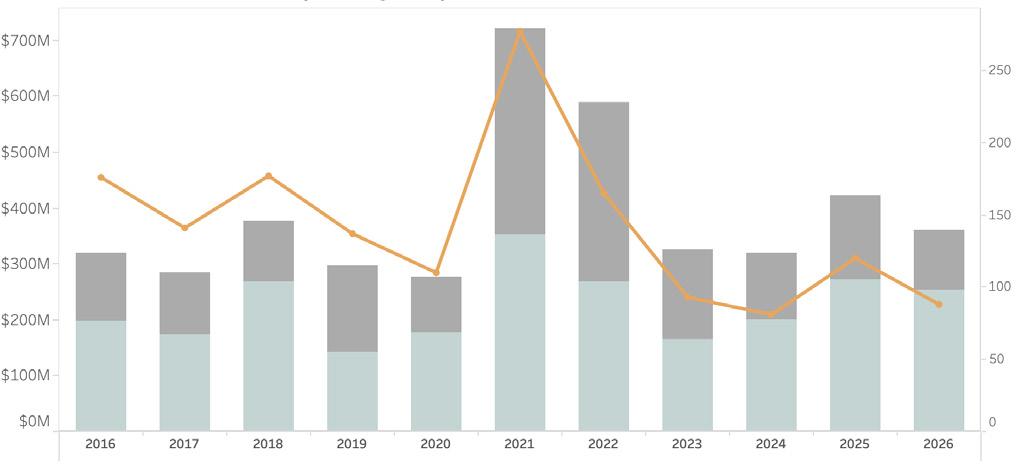
• With transaction and dollar volume notably lower than in 2025, it’s interesting to see the average and median home sale prices increase so significantly through the first five months of the year. At this time last year, the exact opposite trend occurred.

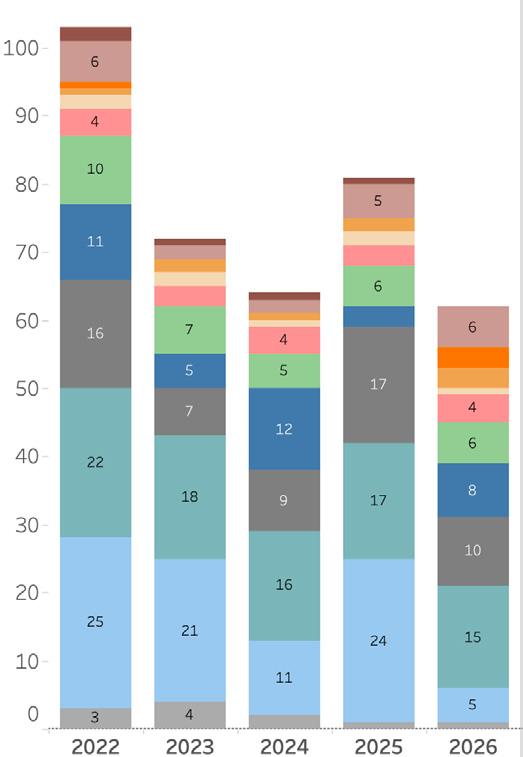
• The 2026 sales distribution by price point shows a higher percentage of sales in the $3 million to $5 million range (up 20 percent) compared to one year ago, but also fewer sales between $1 million and $2 million (down 23 percent). Additionally, there have thus far been three home sales above $9 million versus just one at this same point in 2025. This shift in sales is the primary factor behind the higher median and average sales values. As the year progresses, more data will help clarify trends impacting property values.

• An analysis of the handful of resales (properties that have previously sold without significant renovation between sales) we have thus far in 2026 suggests annualized appreciation rates range from one percent to 10 percent.

NEW PURCHASE ACTIVITY

• May saw 21 single-family home sales (excluding condos, co-ops, and 40B/covenant properties), three transactions ahead of last year’s count but a 42% increase in dollar volume thanks to higher price point sales. In fact, the average sale price for the month of May as compared to one year ago was $1.2 million higher. Relative to the five-year average, transaction volume was two sales fewer though dollar volume was nearly identical.

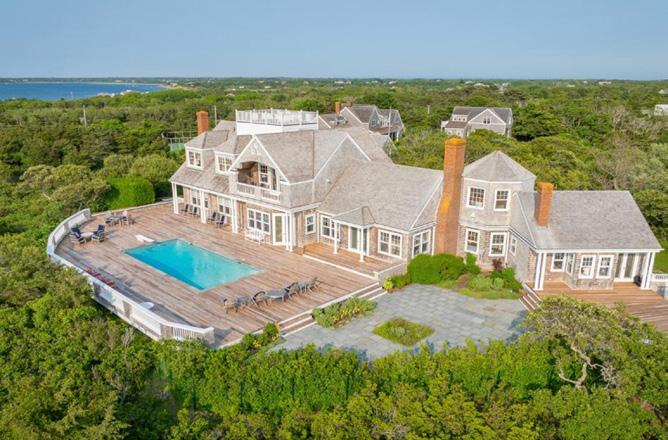
• Monthly sales ranged from a $250,000 land sale (non-conforming parcel purchased by an abutter) to the $10 million sale mentioned on page one. That highest sale is well shy of the $14.25 million bellwether in May ’25 so the assortment of sales generally trended higher across the board rather than having one high-end sale pull up the average.

• This shift in the price distribution of sales contributed to notably higher average and median sale prices, both on a monthly and cumulative, year-to-date basis. Marketing times increased to 5.3 months from 4.8 months one year ago and were also higher

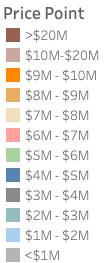
RESIDENTIAL SALES ANALYSIS BY PRICE POINT SHIFT IN SALES BY PRICE POINT YIELDS HIGHER MEDIAN SALE VALUE

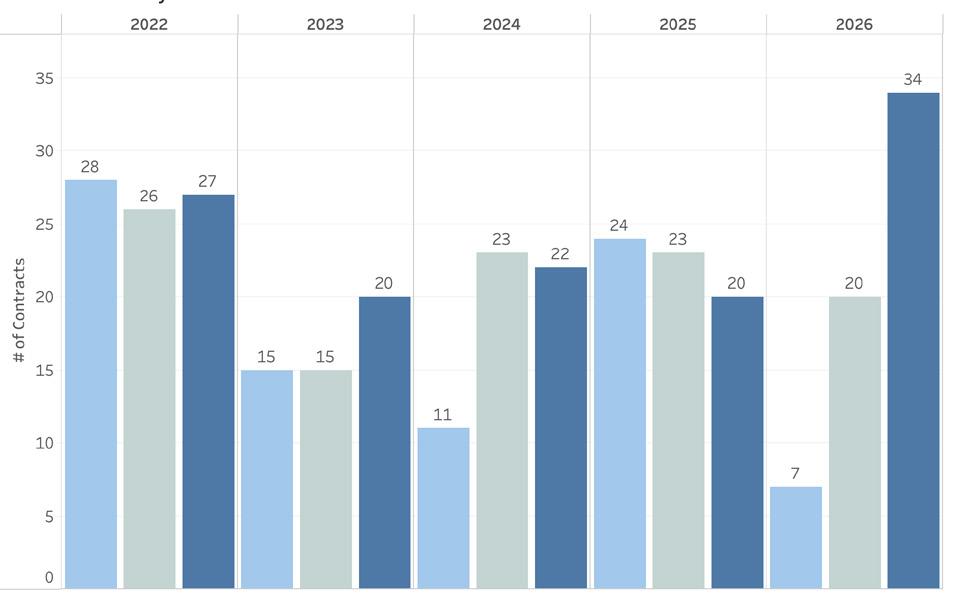
• As we touched on last month, we had a muted start to year on both a sales and contract basis. We saw a shift in Apri with a near tripling of contract activity from March and this rebound continued into May. Through the month of May, 34 contracts were publicly recorded, a sizable increase from the month prior and for what we saw at this point last year.

• Of the contracts that were publicly recorded during April, the majority (44 percent) were for properties last priced between $2 million and $3 million. There was also an uptick of contracts for properties last priced between $1 million to $2 million (15 percent) which may help offset the median sale value growth. For the higher end of the market above $5 million, new contracts represented 15 percent of total activity, a decline from the 32 percent we saw at this time last year.

Turn static files into dynamic content formats.

Create a flipbook
May Market Insights - Nantucket Real Estate by fishernantucket - Issuu