MARKET METRICS
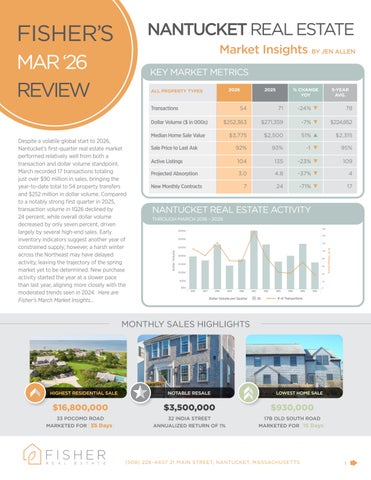
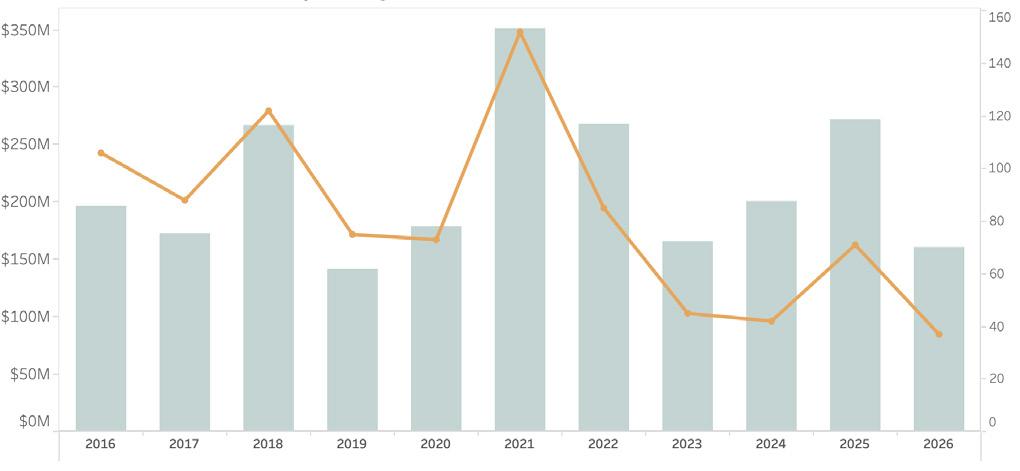
Despite a volatile global start to 2026, Nantucket’s first-quarter real estate market performed relatively well from both a transaction and dollar volume standpoint. March recorded 17 transactions totaling just over $90 million in sales, bringing the year-to-date total to 54 property transfers and $252 million in dollar volume. Compared to a notably strong first quarter in 2025, transaction volume in 1Q26 declined by 24 percent, while overall dollar volume decreased by only seven percent, driven largely by several high-end sales. Early inventory indicators suggest another year of constrained supply; however, a harsh winter across the Northeast may have delayed activity, leaving the trajectory of the spring market yet to be determined. New purchase activity started the year at a slower pace than last year, aligning more closely with the moderated trends seen in 2024. Here are Fisher’s March Market Insights...
Market Insights BY
JEN ALLEN
RESIDENTIAL SALES ACTIVITY
TRANSACTIONS DECLINED, DOLLAR VOLUME IMPROVED
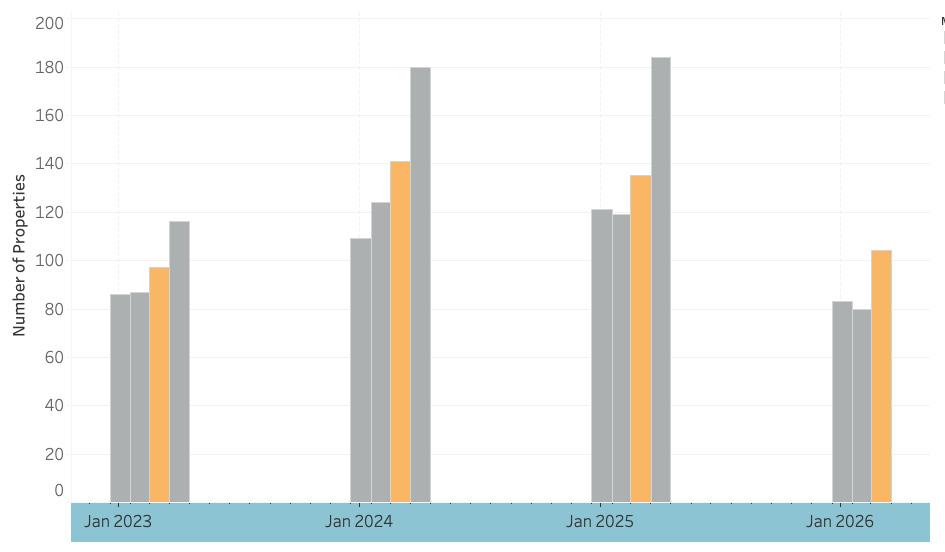
• As of March 31, 2026, there were only 104 properties listed for sale including residential, commercial, and land listings. This marks the lowest inventory level since 2023 and represents a 23 percent decline year-over-year. Inventory typically peaks in July, so the next several months will provide greater clarity on supply trends for 2026.
• The most significant year-over-year declines occurred in the $3 million to $4 million and $6 million to $8 million price segments. The $5 million to $6 million range was the only category to see an increase in available listings compared to 2025.
• Total months of supply, defined as the time required to sell all current listings based on trailing 12-month sales, stood at three months, a slight decrease from this time last year. This metric varies by price segment and remains an important indicator for both buyers and sellers.
CONTRACT ACTIVITY
• While the number of single-family home sales in March (13) matched last year’s total, dollar volume reached $90 million -- more than double that of the same period in 2025. This increase was largely driven by eight transactions above $5 million, compared to just one in March of last year. As a result, first-quarter single-family home sales totaled 40 transactions and $228 million, representing a 13 percent decline in transactions but a nine percent increase in dollar volume.
• This concentration of higher-end sales pushed the average sale price to $5.7 million through the first three months of the year, a 25 percent increase compared to 2025. The median sale price also rose significantly, climbing from $3.3 million to $4.69 million. Historically, these elevated figures tend to normalize as transaction volume increases throughout the course of the year.
• Average days on market held steady at 4.9 months, consistent with 1Q25, while the average sale price relative to both original and final list prices remained largely unchanged. Inventory, however, declined sharply, with just 75 single-family homes available as of March 31, 2026.
INVENTORY BY PRICE POINT
REDUCED INVENTORY TRENDED EVEN LOWER
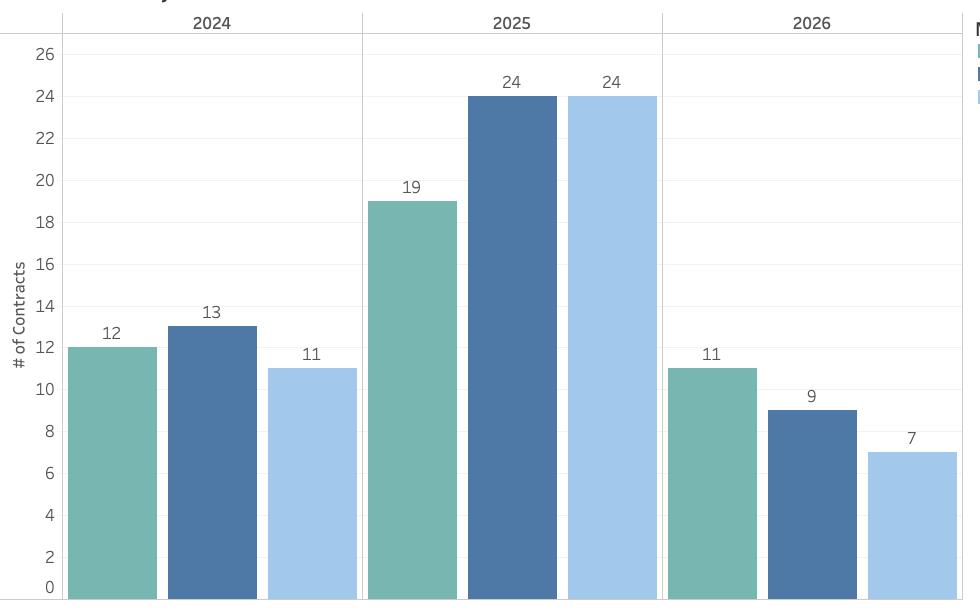
• First quarter contract activity did not end the first quarter on as high of a note as it did one year ago. There were just seven recorded purchase contracts during the month of March, down from 24 contracts one year ago. In fact, the entire first quarter of 2026 amounted to just 27 new recorded contracts, which was closer to the monthly contract rate in 1Q25. The first quarter of 2026 trend more closely tracks the first quarter of 2024 so it will be interesting to see if the trajectory diverges from here or remains similar to 2024.
• Unlike one year ago where there was a higher proportion of sales activity for properties less than $2 million relative to other price points, early 2026 contracts show a similar percentage of sub-$2 million transactions but also activity across the upper end price points. In fact, the percentage of sub-$2million contracts is actually higher on a percentage basis thus far in 2026 but contracts for homes above $5 million balance out the distribution and may continue to lift the average and median sale values.