FISHER’S JUNE ‘26 REVIEW
KEY MARKET METRICS
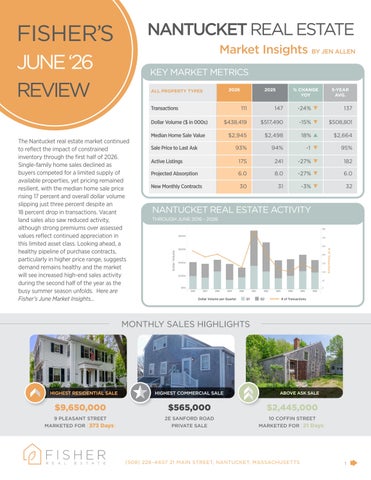
The Nantucket real estate market continued to reflect the impact of constrained inventory through the first half of 2026. Single-family home sales declined as buyers competed for a limited supply of available properties, yet pricing remained resilient, with the median home sale price rising 17 percent and overall dollar volume slipping just three percent despite an 18 percent drop in transactions. Vacant land sales also saw reduced activity, although strong premiums over assessed values reflect continued appreciation in this limited asset class. Looking ahead, a healthy pipeline of purchase contracts, particularly in higher price range, suggests demand remains healthy and the market will see increased high-end sales activity during the second half of the year as the busy summer season unfolds. Here are Fisher’s June Market Insights...
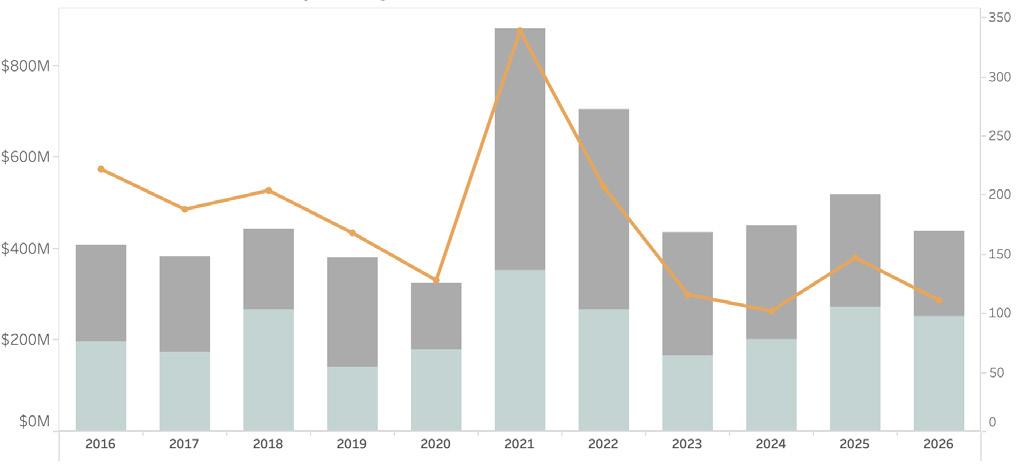
NANTUCKET REAL ESTATE ACTIVITY THROUGH JUNE 2016 - 2026
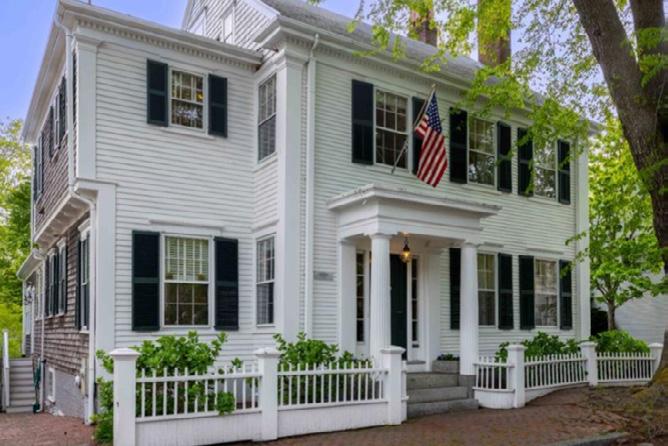
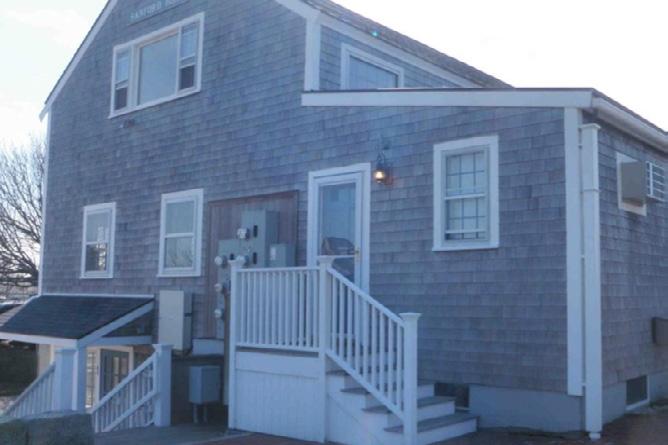
MONTHLY SALES HIGHLIGHTS
Market Insights BY JEN
ALLEN
RESIDENTIAL SALES ACTIVITY
• First half single-family home sales (excluding condos, co-ops & 40B or covenant properties) totaled 80 transactions and $382 million in aggregate dollar volume. This represented a sizable 18 percent decline in transaction activity from one year ago but just a three percent fall in total dollar volume.
• The decline in transaction activity is largely attributed to the decline in property inventory. As of June 30, 2026, there were 146 single-family homes on the market. This is 26 percent lower than one year ago. Based on anecdotal buyer interest, the demand is present, there just isn’t sufficient supply to satisfy it, which is keeping transaction activity reduced.
• The median single-family home sale value increased 17 percent. This is likely driven by multiple factors, not least of which is the scarcity placing upward pressure on property values. This effective “price creep” can be seen in the higher percentage of home sales between $4 million to $6 million as compared to in 2025, causing an upward drift in the median home sale value.
• Interestingly, average marketing times are slightly longer than one year ago. This is because strong buyer demand is helping to clear out older inventory that has lingered on the market. As these properties finally trade, they raise the average marketing time. We expect this will decline as some of the recent, quick contract activity hits the sales books.
• In addition to residential sales, vacant land sales also saw a decline from 2025 figures. Through June 30, 2026, vacant land sales measured 17 transactions totaling $26 million, 30 percent less transaction volume from one year ago and a 50 percent decline in dollar volume.
• As is typical of vacant land transactions on the island, there has been a wide array of transaction types. The highest sale of the year thus far was the $6 million sale of 2.84 acres in Shawkemo, and the lowest sale was for $775,000 for a 4,700 square foot parcel of land along Surfside Road, ideal for employee housing given its zoning. In the middle of these two sales was the resale of 74 Madaket Road which sheds light on appreciation rates. It is a 1.84-acre parcel between Town and Cliff that traded for $2.7 million in October of 2024 and $3.1 million in May of 2026. Excluding transaction costs, this represented an annualized return of nine percent.
• While the small number of transactions and the wide degree in variation makes comparison metrics challenging (last year most of the land sales were commercial) the metric that stands out the most for vacant land sale activity thus far is the average sale price to the Town’s assessed value as it jumped to 349 percent, from 224 percent. This is well above the same metric for residential properties and something we’ll be diving into for more insights.
MARKET WIDE CONTRACT ACTIVITY
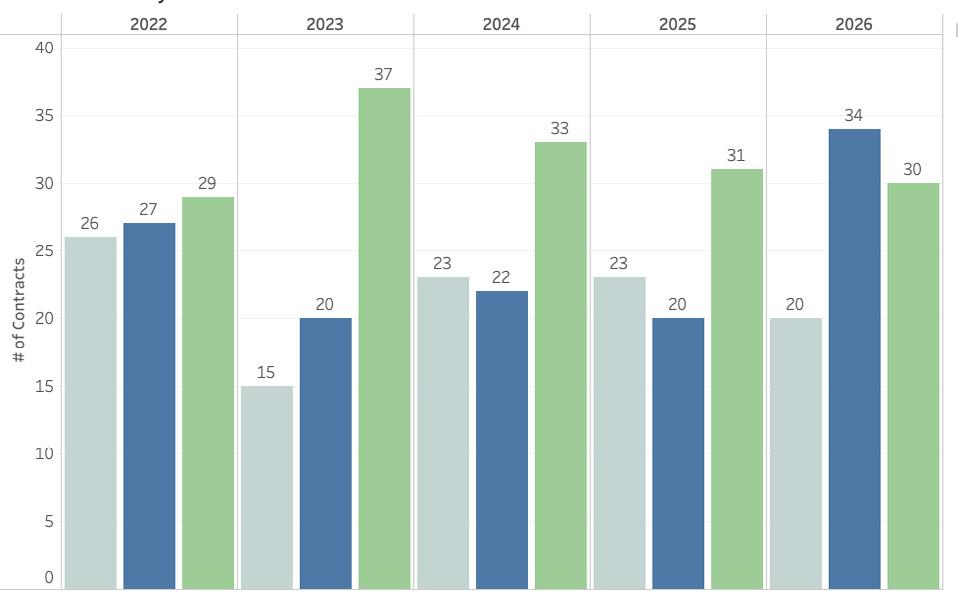
• During the month of June, there were 30 new purchase contracts recorded, nearly identical to 2025 activity and both months are likely understated given that new purchase contracts are not always immediately record in the MLS. The 30 contracts in June represented a slight decline from May activity but were consistent with the preceding two years.
• Of the contracts that were publicly recorded during June, the majority (31 percent) were for properties last listed between $2 million and $3 million, a notably higher percentage than one year ago when many contracts were for properties listed between $1 million and $2 million (much of this was employee housing). There was also a jump in contracts between $4 million and $5 million. Two contracts were publicly marked for properties last listed above $10 million, which is more than last year but below the five-year average. There are at least a handful of contracts above $25 million which are not yet public. All this activity suggests we may continue to see a higher than typical median home sale value and that high end sales will start to perk up.
• On an anecdotal basis, this year’s purchase contracts still tend to have limited contingencies. Just as has been the case the last few years, they often solely include an inspection period. July and August are the most active contract months of the year so we will see what the next 45 days bring and what we can predict for third quarter trends.