FISHER’S
NANTUCKET REAL ESTATE
AUG ‘26 REVIEW
KEY MARKET METRICS
Market Insights BY JEN ALLEN 2026
ALL PROPERTY TYPES
% CHANGE YOY
5-YEAR AVG.
167
215
-22% f
191
Dollar Volume ($ in 000s)
$706,253
$831,766
-15% f
$733,554
Median Home Sale Value
$4,912
$4,490
9% d
$3,891
Sale Price to Last Ask
95%
94%
1 d
95%
Active Listings
173
215
-20% f
192
Projected Absorption
5.6
6.9
-18% f
7.0
New Monthly Contracts
64
57
12% d
55
Transactions
NANTUCKET REAL ESTATE ACTIVITY THROUGH AUGUST 2016 - 2026
Dollar Volume
# of Transactions
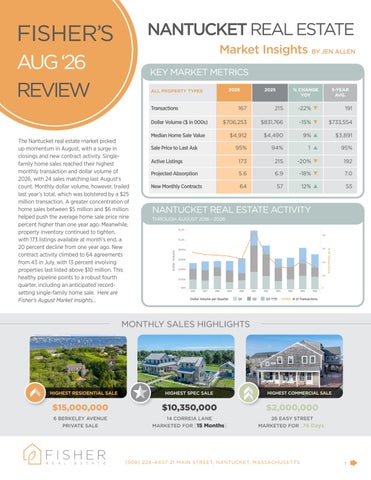
The Nantucket real estate market picked up momentum in August, with a surge in closings and new contract activity. Singlefamily home sales reached their highest monthly transaction and dollar volume of 2026, with 24 sales matching last August’s count. Monthly dollar volume, however, trailed last year’s total, which was bolstered by a $25 million transaction. A greater concentration of home sales between $5 million and $6 million helped push the average home sale price nine percent higher than one year ago. Meanwhile, property inventory continued to tighten, with 173 listings available at month’s end, a 20 percent decline from one year ago. New contract activity climbed to 64 agreements from 43 in July, with 13 percent involving properties last listed above $10 million. This healthy pipeline points to a robust fourth quarter, including an anticipated recordsetting single-family home sale. Here are Fisher’s August Market Insights...
2025
Dollar Volume per Quarter
Q1
Q2
Q3 YTD
# of Transactions
MONTHLY SALES HIGHLIGHTS
HIGHEST RESIDENTIAL SALE
HIGHEST SPEC SALE
HIGHEST COMMERCIAL SALE
$15,000,000
$10,350,000
$2,000,000
6 BERKELEY AVENUE PRIVATE SALE
14 CORREIA LANE MARKETED FOR [15 Months]
26 EASY STREET MARKETED FOR [74 Days]
(508) 228–4407 21 MAIN STREET, NANTUCKET, MASSACHUSETTS
1
FISHER’S AUG ‘26 REVIEW Market Insights BY JEN ALLEN RESIDENTIAL SALES ACTIVITY ROBUST TRANSACTION & DOLLAR VOLUME
2026
Transactions
2025
% Change
5 Year Avg.
125
142
-12% f
133
$614,037,929
$637,650,075
-4% f
$597,472,345
Avg. Selling Price
$4,912,303
$4,490,493
9% d
$4,504,261
Median Selling Price
$3,850,000
$3,187,500
21% d
$3,321,500
Total Sales Dollar Volume
Avg. Months on Market
4.9
4.2
16% d
3.9
Avg. Price as % of Last Ask
95%
94%
1d
96%
Avg. Price as % of Original Ask
91%
89%
1d
92%
Avg. Price as % of Assessed Value
145%
162%
-17 f
163%
• August single-family home sales (excluding condos, co-ops, and 40B/covenant properties) included 24 transactions, the same as last year’s count but lower in comparative dollar volume due to a $25 million sale during this same period. The August surge represented the highest transaction and dollar volume recorded so far this year. Based on pipeline sales, continued robust volume in the fourth quarter, including a new record high for a single-family home. • August sales ranged from a $1.1 million land sale along Old South Road to a $15 million property in Monomoy that will be fully redeveloped. The average home sale price sits nine percent higher than one year ago and just below $5 million thanks to a notable rise in home sales between $5 million and $6 million compared to one year ago. • The average marketing time lengthened 4.9 months from 4.2 months while pricing discounts narrowed slightly from one year ago.
VACANT LAND SALES ACTIVITY
• Vacant land sales have thus far been far less active in 2026 as compared to previous years. Through August 31, 2026, vacant land sales measured 24 transactions totaling $52 million, a respective decline of 35 percent and 45 percent from one year ago. Year to date activity was also lower than five-year average which measured 32 transactions totaling $78 million in dollar volume. • While 2026 transactions have included more numerous high-end sales than one year ago, there have been fewer lower price parcels trading. At this same time one year ago, there were six land sales for less than $1 million. So far this year, there have been none. •Inventory is also notably lower which is contributing to fewer sales. As of August 31, 2026, there were 12 land parcels listed for sale compared to 20 one year ago and 31 in 2024. As we often report, there are many residential sales that “act” more like land sales from the standpoint that the buyer will either tear the home down or comprehensively renovate it. However, if we are strictly compared vacant land sales, this year’s activity is constrained by limited inventory.
PROPERTY INVENTORY & CONTRACT ACTIVITY INVENTORY DECLINED, CONTRACTS INCREASED
LIMITED INVENTORY CONSTRAINING SALES
2026
Transactions Total Sales Dollar Volume
2025
% Change
5 Year Avg.
24
37
-35% f
32
$52,087,800
$94,372,403
-45% f
$78,256,673
Avg. Selling Price
$2,367,627
$2,550,605
-7% f
$2,555,226
Median Selling Price
$1,510,000
$1,600,000
-6% f
$1,760,500
1.3
4.9
-73% f
2.7
94%
94%
0r
95%
Avg. Months on Market Avg. Price as % of Last Ask Avg. Price as % of Original Ask
92%
90%
2d
94%
Avg. Price as % of Assessed Value
294%
232%
62 d
233%
• As of August 31, 2026, there were 173 properties (residential, land & commercial) listed for sale, 20 percent lower than one year ago. The total months’ supply (how long it would take to sell all listings based on trailing 12-month sales) measured 5.6 months. Given that trailing 12-month sales are effectively similar as they were one year ago, the faster absorption is largely due to the reduction in available inventory. • The number of listed properties by price point is lower in nearly every price point. However, the number of properties listed between $6 million to $8 million is the same as one year ago while there is one more listing listed between $9 million and $10 million. Listings between $2 million to $3 million show the steepest decline and are 60 percent lower than they were two years ago. • August was not only a busy month for sales but also new contract activity which rose to 64 contracts from the 43 recorded in July. Most contracts, 19 percent, were for properties last priced between $4 million to $5 million. There was also a healthy amount, 13 percent, marked for properties last listed above $10 million. As is often typical, the fourth quarter is likely to be the highest of the year.
June
July
August
(508) 228–4407 21 MAIN STREET, NANTUCKET, MASSACHUSETTS
2