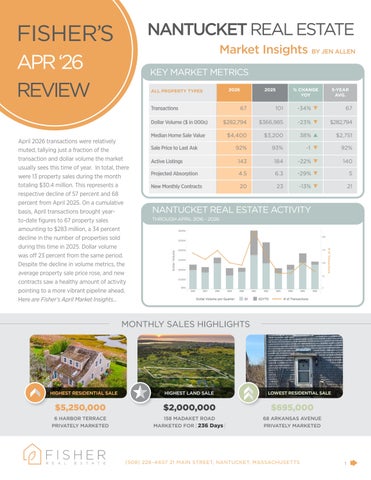
April 2026 transactions were relatively muted, tallying just a fraction of the transaction and dollar volume the market usually sees this time of year. In total, there were 13 property sales during the month totaling $30.4 million. This represents a respective decline of 57 percent and 68 percent from April 2025. On a cumulative basis, April transactions brought yearto-date figures to 67 property sales amounting to $283 million, a 34 percent decline in the number of properties sold during this time in 2025. Dollar volume was off 23 percent from the same period. Despite the decline in volume metrics, the average property sale price rose, and new contracts saw a healthy amount of activity pointing to a more vibrant pipeline ahead. Here are Fisher’s April Market Insights...
KEY MARKET METRICS
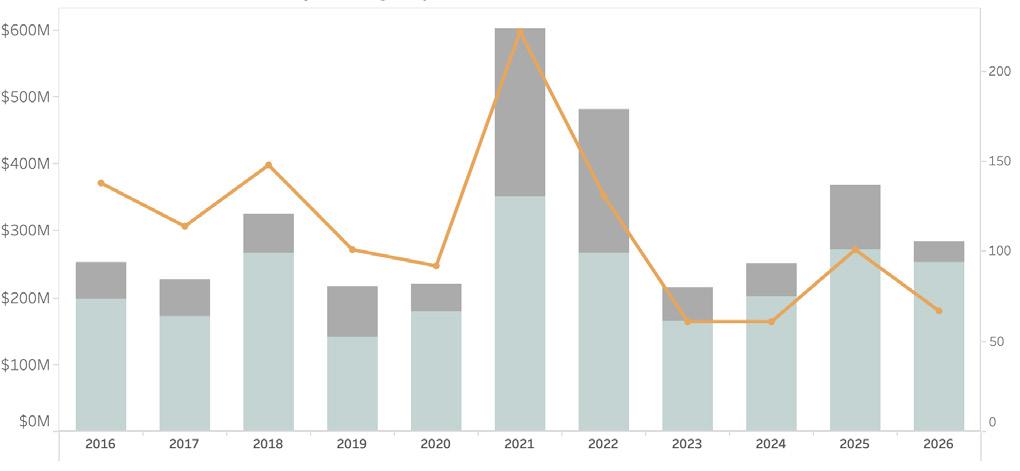
NANTUCKET REAL ESTATE ACTIVITY THROUGH APRIL 2016 - 2026
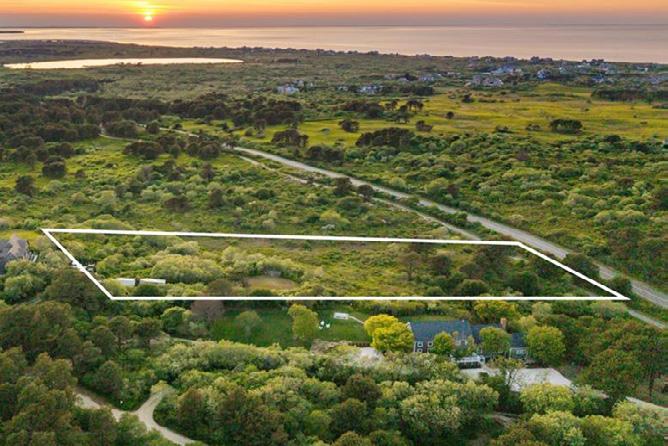
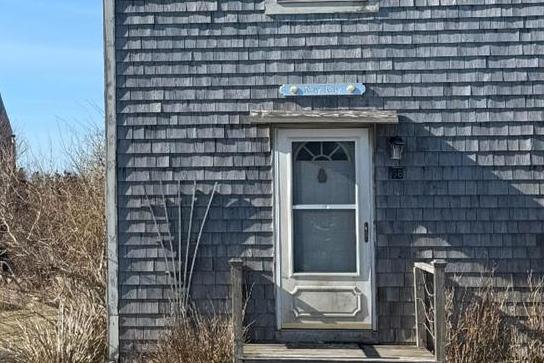
MONTHLY SALES HIGHLIGHTS
Market Insights BY
JEN ALLEN
SINGLE FAMILY HOME SALES
• As of April 30, 2026, there were just 142 properties listed for sale including residential, commercial, and vacant land listings. This is 23 percent lower than one year ago. As we frequently note, property inventory typically peaks in July, so we have another two to three months before we see a more complete picture of how this year’s inventory will settle.
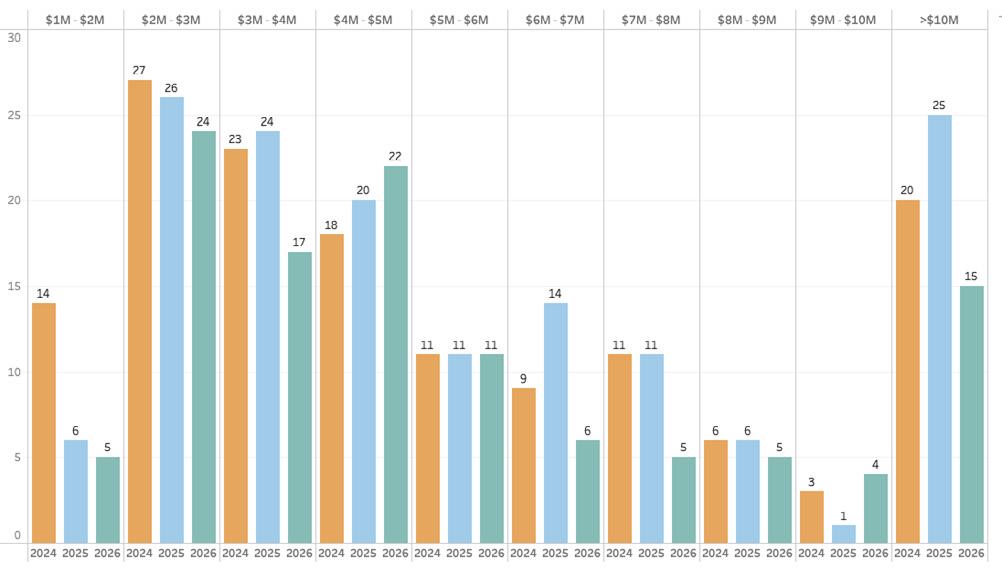
• Naturally, due to the decline in overall single-family home inventory, most price points saw a year-over-year drop in the number of properties listed for sale. It’s therefore interesting to note the price points that saw an increase. This included the $4 million to $5million segment and the $9 million to $10 million segment. The price points that saw the most substantial decline in available inventory were homes listed between $6 million to $8 million and also $3 million to $4 million.
• The total months’ supply, or how long it would take to sell all listings based on trailing 12-month sales, measured 4.5 months, nearly two months faster compared to this time last year. This likely has more to do with the reduction in inventory than the pace of trailing 12-month sales.
• April single-family home sales included just seven transfers during the month, one-third of the amount of home sales from one year ago. While transaction and dollar volume were lower, the median and average home sale prices were roughly in line with one year ago. Discount metrics improved modestly. The average marketing time increased significantly largely due to two outlier properties that took more than two years to sell.
• Not only was activity more subdued compared to other April performances, but higher end sales were also notably fewer. For instance, in April 2025, there were six home sales above $5 million. In April 2026, there was just one (see above). This all could be a function of both the lousy new England winter weather early in the year and the unsettled political environment that began in late February/March.
• Another potential reason for the reduced sales volume is the dearth of available home inventory. As of April 30, 2026, there were just 114 single-family homes listed for sale. This is 21 percent lower than during the same time in both 2025 and 2024.
PROPERTY INVENTORY BY PRICE POINT DECLINES ACROSS MOST PRICE POINTS CONTRACT ACTIVITY & PRICE REDUCTIONS
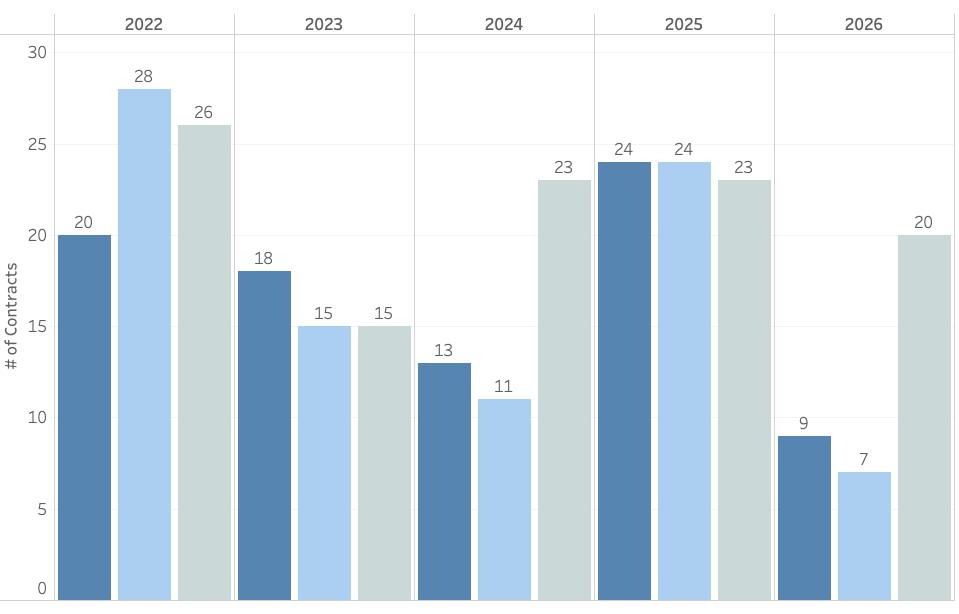
• After a subdued first quarter for new purchase activity, April contracts rebounded. There were 20 new purchase contracts recorded during the month, a marked increase from the nine contracts posted in February and the seven contracts in March. Relative to previous April activity, 2026 is just slightly lower than in 2025 and 2024. This suggests the slower transaction pace may soon shift.
• Of the contracts that were publicly recorded during April, the majority were for properties last priced between $2 million and $3 million while six contracts were executed properties last listed above $5 million. This is a significantly higher proportion of higher end contracts than we saw during this period last year so it could just be that the higher end of the market had a slower start compared to previous years.
• During the 30-day period ending April 30, 2026, there were 18 price reductions compared to the exact same amount at this time last year. The average price reduction (from the original list price) was 10 percent, which is on par with the averages we usually see in price reduction activity.