

(21-036938-01)


(21-036938-01)
Final Report
22 September 2021
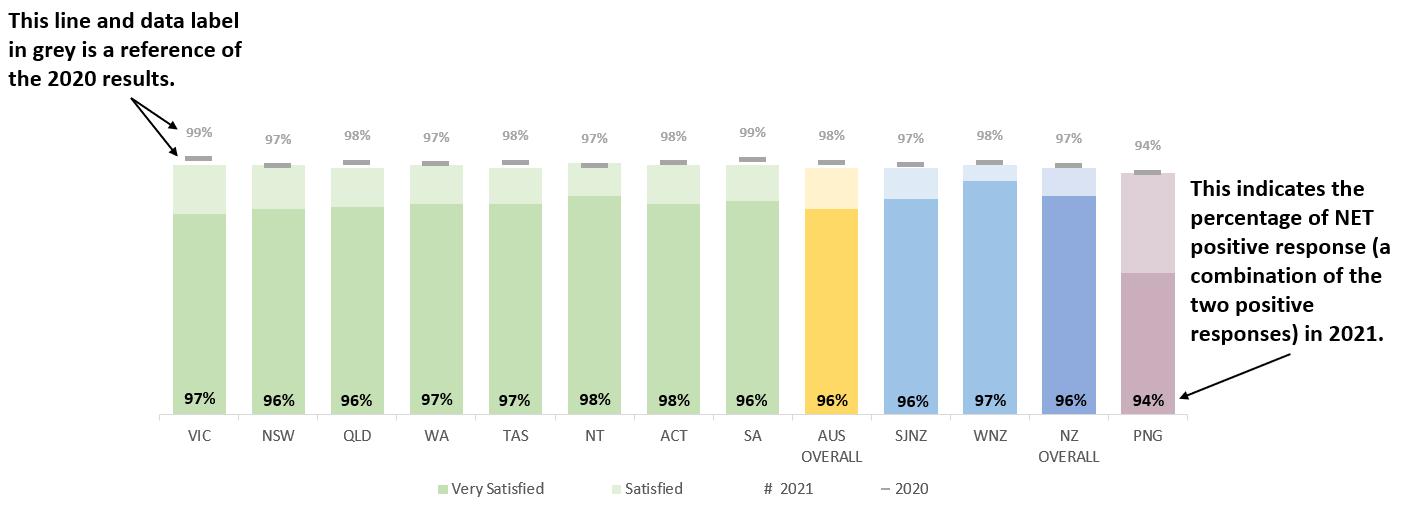
Over nine-in-ten of patients from Australia (97%), New Zealand (96%) and Papua New Guinea (94%) were satisfied with most recent experience using their local ambulance service.
Satisfaction among respondents with the Ambulance Service remained overwhelmingly positive across all services; 80% of Australian respondents and 85% of New Zealand respondents stated they were ‘very satisfied’; 16% of Australian respondents and 11% of New Zealand respondents were ‘satisfied’ with their most recent experience.
Five of the eight Australian services demonstrated a decrease in NET satisfaction. This decrease was statistically significant in Victoria and South Australia.
When comparing St John and Wellington Free Ambulance Services, those in Wellington (91%) were more likely to report being ‘very satisfied’ compared to St John (84%) services.
Across all services, the proportion of respondents that reported being satisfied ranged from 94% to 98%. There were no significant differences observed with overall satisfaction when comparing the results between service regions.
62% of Australian patients were connected to call taker quicker than they expected and 91% of patients found the call taker to be helpful & reassuring.
Whilst experiences with call takers are largely positive, a decline in positive experiences with ambulance call takers was observed in Australia in 2021. Despite this decline, only 1% of patients found the call takers to be unhelpful, and 6% felt they waited for longer to be connected than they should have.
Papua New Guinea registered improved results when comparing 2021 results with 2020, the proportion of respondents reporting positive experiences for the time taken to be connected and helpfulness of call taker increased.
Nearly nine-in-ten (88%) patients in New Zealand found the call taker helpful and reassuring, a statistically significant decline of 4 percentage points from the previous year (92%).
Over half of patients across Australia (57%) and New Zealand (53%) felt the length of time they waited for the ambulance to arrive was quicker than they thought it would be.
Across Australia, the proportion of respondents that reported the wait for an ambulance was quicker than expected ranged from 54% to 68%, with Western Australia reporting the most positive results
In New Zealand positive experiences with ambulance wait times decreased significantly in 2021 when compared to 2020, when a positive response of 58% was recorded.
Papua New Guinea reported very positive experiences with wait times, 91% felt the ambulance arrived quicker than expected.
97% of Australian patients felt their overall experience of care was ‘good’ or ‘very good’.
Results indicate that a high standard of care is consistently provided in each State and Territory. Satisfaction remained overwhelmingly positive in 2021, ranging from 96% to 98%.
91% of Papua New Guinea patients felt their overall experience of care was ‘good’ or ‘very good’
Only 1% of patients that completed the survey reported the care they received from the paramedics as ‘very poor’ or ‘poor’ in both Australia and Papua New Guinea
Over nine-in-ten patients in Australia (92%), New Zealand (96%) and Papua New Guinea (91%) reported having high levels of trust and confidence in the ambulance staff.
Whilst a statistically significant decline in Australia and New Zealand was reported (95% and 97% respectively in 2020), levels of trust and confidence in the ambulance staff remain very high
There was little disparity when comparing Australian states. All services recorded a NET Confidence score of between 91% and 95%.
The proportion of service users in Papua New Guinea reporting confidence in the service staff significantly increased from 69% in 2020.
In Australia, over nine in ten patients (95%) said they experienced a ‘very clear’ or ‘clear’ explanation of their condition and reasons for treatment.
The proportion of Australian patients reporting receiving a ‘very clear’ or ‘clear’ explanation remained unchanged from 2020, indicating a consistent high level of communication from service staff.
In New Zealand and Papua New Guinea, nearly nine in ten (88% and 87% respectively) patients reported they received a ‘very clear’ or ‘clear’ explanation. Both countries saw a significant decrease of seven percentage points each compared to the previous year.
95% of Australian patients reported they were comfortable during their ambulance journey.
The comfort during the ambulance journey reported by Australian services users remained fairly consistent with 2020 findings (96%). Victoria reported a statistically significant decline from 96% to 93%, however there was little disparity between 2020’s results for the rest of the state services.
94% of New Zealand patients felt ‘very comfortable’ or ‘comfortable’ during the ambulance journey, unchanged from the previous year.
Nine-in-ten (90%) of Papua New Guinea patients rated their level of comfort during the journey as ‘very comfortable’ or ‘comfortable’, a significant increase from 71% in 2020.
The Council of Ambulance Authorities (CAA) represents the eleven statutory ambulance services across Australia, New Zealand and Papua New Guinea. CAA represents a unified voice for the pre-hospital sector working to respond to changing community needs with patient-centred practices.
The CAA has administered the Patient Experience Survey since 2002 in Australia, 2007 in New Zealand and 2020 in Papua New Guinea. The survey is used to monitor patient experience in order to identify the quality of ambulance services, as reported by recent service users. This information helps the CAA and its members to better understand the recent experiences of treatment and care provided by services and identify aspects of service delivery that could be improved. Patients, or their carers, are asked to rank their satisfaction with ambulance services and treatment, including telephone assistance, timeliness of response, treatment received, competency of staff, journey comfort and overall satisfaction.
In Australia, the survey is conducted as a mailout, in New Zealand via SMS and in Papua New Guinea it is conducted in-person. The survey is administered to a sample of patients who have been transported by services in an emergency or urgent context. Individual ambulance services in each state are responsible for data collection.
The CAA developed a core set of questions for the patient experience survey. All Australian services were instructed not to modify the questions (except to update with locally relevant language, such as ‘paramedic’ or ‘ambulance officer’). The questionnaire is included as an appendix to this report. Services were also able to add any additional questions at the end of the survey. Services were responsible for finalising the formatting of the questionnaire (e.g. adding logos or any additional graphic work). The CAA provided an example cover letter which services could update with their own information.
Services were then responsible for randomly drawing a sample of n=3,000 Code 1 and Code 2 patients to send the sample to. A definition of Code 1 and Code 2 is provided below.
Emergency incidents
Urgent incidents
Count the number of Code 1 incidents, defined as emergency events requiring one or more immediate ambulance responses under lights and sirens where the incident is potentially life threatening.
Count the number of Code 2 incidents, defined as urgent incidents requiring an immediate response by one or more ambulances without warning devices, with arrival desirable within 30 minutes.
The survey was printed and mailed by all services within Australia. As was the case in 2020, participants were given two options to complete the survey: either via the hardcopy questionnaire provided in the survey pack via an online survey link. In New Zealand, services conduct the survey using a different approach. Sampled patients are sent an SMS invitation that allows them to complete the survey online over their mobile device. In Papua New Guinea the survey was conducted in-person in the native language of the patient, results were then translated back to English for the purposes of analysis. The fieldwork period differed amongst the services, all responses within Australia and
Papua New Guinea were received between June and July 2021. New Zealand data collection methods differ in that surveys are run throughout the year. For the sake of reporting a robust sample size, multiple months of New Zealand survey data has been included in this report.
Services were responsible for conducting data entry into a spreadsheet template provided by the CAA. All spreadsheet data was then delivered to Ipsos for analysis and reporting. Responses that did not indicate if they were the ‘patient’ or ‘relative/carer of the patient’ were removed from the survey and were therefore not included in response rate calculations.
Table 2. Response Rate 2017-2021
based on incidence data provided by CAA.
Response rates for the 2021 survey ranged between 14% and 33%, eventuating in a response rate of 23% in Australia. This represented a decrease in the response rate recorded in 2020 of 27%. Despite the decrease in the response rates the 2021 sample is the largest achieved over the life of the CAA Patient Experience Survey, this is due to the increased size of the mailout in 2021 from 1,300 to 3,000. All rates were calculated assuming an effective mail-out size of 3,000 in each state and territory in Australia, with the exception of Northern Territory with an effective mail-out size of 1,300
A margin of error is included in the table, this denotes a range of values that you can be 95% certain contains the true mean of the population. For example, if a service has a MoE of 3%, we can be 95% confident that the true measure if we were to survey an entire population would fall within 3% of the figure reported. These values are derived by calculating the size of the sample in relation to the Road and Air Patient incident data.
The following report details findings for Patient Experience surveys completed in 2021. Surveys that were received that did not indicate whether the respondent was the ‘the patient that was transported’ or ‘a relative, or carer of the patient’ (Q1) were excluded from the survey. All percentages have been reported excluding any ‘Don’t know’, ‘Can’t recall’, ‘Not Applicable’ or missing answers, where these exist.
Questions compare 2021 results with those collected in 2020. ‘Overall Satisfaction’ (Q10) data is displayed details the ‘NET Satisfied’ figure achieved for each service since 2015. As with previous iterations of the report, ‘NET Positive’ and ‘NET Negative’ scores (e.g. Q2, NET quicker and NET slower) are reported consistently with the manner that ‘NET Satisfied’ and ‘NET Dissatisfied’ have been reported in previous waves of the study.
To better represent the total patient population of each state and territory the Australian and New Zealand Overall figures have been weighted according to recent Road and Air Patient incident data. Using this population data, the results of services were weighted up or down to reflect the population that used a service. This process is consistent with that applied to previous reports. Demographic data has not been weighted. No weighting was applied to Papua New Guinea results.
Results in the report have been rounded to the nearest integer, this approach applies a rule that when a digit at one decimal place is less than 5, then it is round down, which means the digit remains the same; if the digit at one decimal place is 5 or greater, this is then rounded up. This means that the sum of all proportions may not equate to 100%.
All questions are reported through categorical tables and charts for 2021 results, displaying results for each service and at the overall Australia, New Zealand and Papua New Guinea level. Statistically significant differences within countries (i.e. between states in Australia and services in New Zealand) as well as any differences between countries (i.e. Australia vs. New Zealand vs. Papua New Guinea) are not displayed in charts but have been noted in the commentary. Similarly, state level results where compared against the Australian average and where significant differences where observed these were discussed.
Please see example below of how to interpret the charts.
Responses relating to patient demography, person completing the survey and frequency of usage for 2021 are outlined below. Demographic data is presented at a National level and is unweighted.

Base Australia n=5,216; New Zealand n=1,810; Papua New Guinea n=1,094; excludes ‘missing’ and ‘other’ responses
Across all three countries, more females participated in the survey than males. In both Australia (84%) and New Zealand (76%), the majority of respondents were aged over 50. Respondents aged between 71 to 80 years accounted for the highest proportion of total respondents in both Australia (28%) and New Zealand (24%).
The age composition varied slightly between services; Victoria, New South Wales, Western Australia, Tasmania, the Northern Territory and South Australia having the oldest profiles with at least 85% of their respondents being made up of service users aged 51 years and above. In comparison, Queensland and the Australian Capital Territory (both 23%) had a larger proportion of younger users aged 50 years or younger of their services.
The age profile of respondents from Papua New Guinea tended to be younger than Australia and New Zealand, the majority under 50 years of age (68%) and a third (32%) making up those patients aged 50 years and over.
Person completing the survey
There were differences observed between Australia, New Zealand and Papua New Guinea in terms of the person completing the survey. In Australia, nearly a quarter of surveys (23%) were completed by a relative or carer of the patient, compared to 15% in New Zealand. In Papua New Guinea, nearly three quarters (71%) were carers or relatives of the patient compared to 29% who were the patient that was transported. The proportion of carers/patients in Australia and New Zealand has remained consistent for the previous four years of the study.
The breakdown of who completed the survey was consistent between services within both Australia and New Zealand between 2020 and 2021, whereas in Papua New Guinea there was a larger proportion of relatives/carers who completed the survey this year
Frequency of usage in the last 12 months
In Australia, half of respondents reported using the ambulance service once in the last 12 months (50%), with a further 43% using it between two and five times. Seven percent of respondents (7%) indicated they had used the ambulance service ‘more than five times’ in the last year.
The findings varied between state services, those respondents in Queensland (60%), Victoria (55%) and South Australia (54%) were more likely to say they had used the service more than once in the last 12 months.
In Papua New Guinea, nearly two thirds (63%) of respondents reported using the ambulance service once in the past 12 months, up 20 percentage points from 2020. A third of respondents (33%) used the service between two and five times in the preceding year
This question was not asked in New Zealand.
Base Australia n=5,099; New Zealand n=1,774; Papua New Guinea n=1,093 (excludes ‘missing’)
As with previous waves of the study, overall satisfaction figures across all services remained very positive: 96% of Australian and New Zealand service users, and 94% of Papua New Guinea service users reported being either ‘very satisfied’ or ‘satisfied’ with their overall experience.
Despite a significant decline in NET satisfaction in Australia from 98% in 2020 to 96% this year, overall satisfaction remained overwhelmingly positive, just 2% of patients in Australia and New Zealand reported being ‘very dissatisfied’ or ‘dissatisfied’. The decline in this year’s result at the national level in Australia was driven by the larger services including NSW, Queensland and Victoria all recording a lower proportion of ambulance service users being satisfied with overall experience than in previous years

Q10. How satisfied were you overall with your last experience using the Ambulance Service? (Base Australia 2021 n=5,099, 2020 n=2,719; New Zealand 2021 n=1,774, 2020 n=1,638; Papua New Guinea 2021 n=1,093, 2020 n= 65; excludes ‘missing’)
While minor changes were observed in the overall satisfaction result between 2020 and 2021 for almost all services, two services experienced a significant decrease in NET Satisfaction. In Victoria, NET Satisfaction decreased significantly from 99% in 2020 to 97% in 2021, whilst South Australia decreased from 99% to 96%.
In Papua New Guinea, satisfaction remained very positive with a total of 94% selecting they were either ‘very satisfied’ or ‘satisfied’ with their overall experience, consistent with the previous year
Table 4. Overall satisfaction (Q10) – Time series
Q10. How satisfied were you overall with your last experience using the Ambulance Service? (Base Australia 2021 n=5,099; New Zealand 2021 n=1,744; Papua New Guinea 2021 n=1,093; excludes ‘missing’)
The reported NET satisfaction of Australian respondents has been the lowest in six waves of the study, however still a very strong positive result New Zealand’s overall satisfaction (96%) is consistent with the previous years Papua New Guinea maintained a NET satisfaction of 94%, consistent with the 2020 result
The consistently positive results suggest that standards of service delivery have become entrenched all services in all three countries
Time taken to be connected
Table 5. Time taken to be connected (Q2) – Australia and Papua New Guinea 2021
2. Which of the following would best describe how you felt about the length of time you waited to be connected to the Ambulance Service call taker? (Base Australia n=4,345; Papua New Guinea n=1,093; excludes ‘missing’, ‘don’t know/can’t say’)
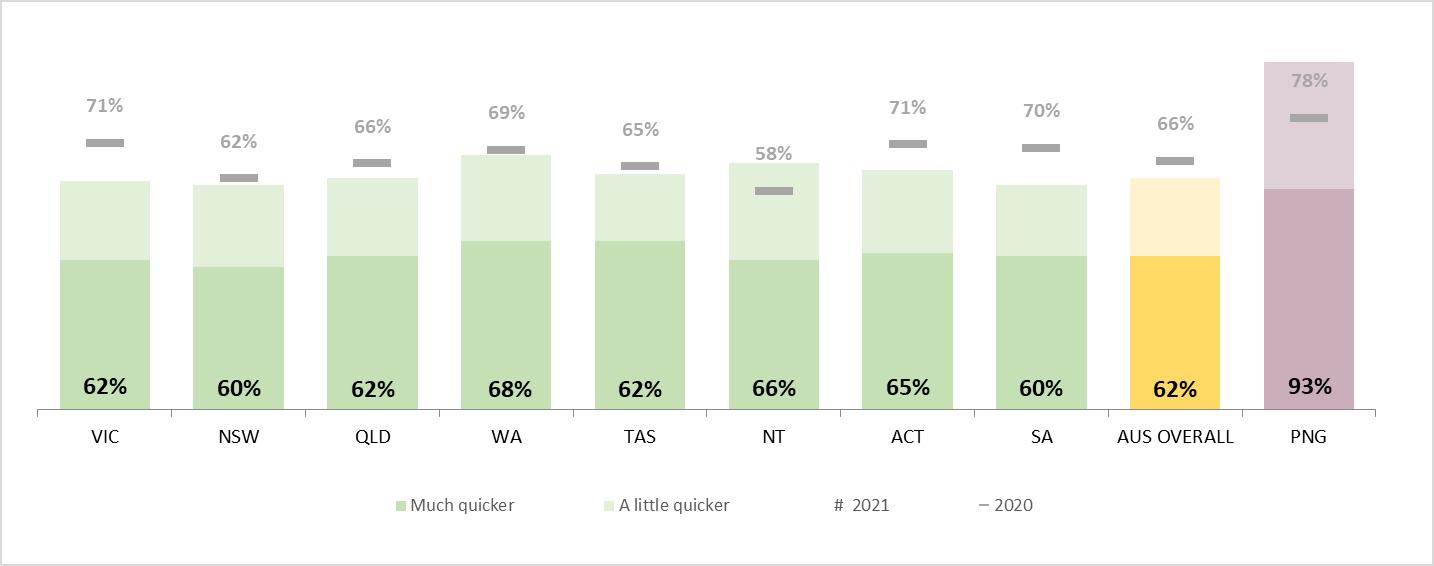
In Australia overall, six in ten respondents (62%) indicated that they were connected to the Ambulance Service call taker either ‘much’ or ‘a little’ quicker than expected, with about four in ten (41%) of the participants responding it was ‘much quicker than I thought it would be’. Nearly one third of participants (32%) indicated that the time taken to be connected was as expected, while only 6% were connected either ‘a little’ or ‘much’ slower than expected. Western Australia (68%) and the Northern Territory (66%) were the most satisfied regarding the time taken to be connected.
Over nine in ten (93%) of Papua New Guinea participants reported they felt the time to be connected was either ‘much’ or ‘a little’ quicker than expected, with 6% of patients indicating the time to be connected to the Ambulance Service caller met their expectations. Only 15 respondents (1%) felt that the connection wait time was slower than anticipated.
This question was not asked in New Zealand.
Figure 3. Time taken to be connected – Australia and Papua New Guinea (Q2) – 2020 vs 2021
2. Which of the following would best describe how you felt about the length of time you waited to be connected to the Ambulance Service call taker? (Base Australia 2020 n=2,323, 2021 n=4,345; Papua New Guinea 2020 n=65, 2021 n=1,093; excludes ‘missing’, ‘don’t know/can’t say’)
Regarding the time taken to be connected, overall in Australia there was a significant decline of four percentage points in NET positive results to 62%, with 6% of respondents indicating that the length of time waited to be connected to a call taker was slower than expected. While NET positive results declined in most Australian states, Victoria (62%) and South Australia (60%) saw the most significant decreases
The Northern Territory was the only Australian service to experience an improvement in reported times to be connected to the call taker this year (66%, up from 58% in 2020).
Papua New Guinea saw an improvement in the length of time taken to be connected to the ambulance service call taker, up 15 percentage points from 2020 to 93%.
Assistance provided by call taker
Table 6. Assistance provided by call taker (Q3) – All Services 2021
3. Throughout the 000/111 call, how helpful and reassuring was the Ambulance Service call handler you were speaking with? (Base Australia n=4,189; New Zealand n=842; Papua New Guinea n=1,088; excludes ‘missing’, ‘don’t know/can’t say’)
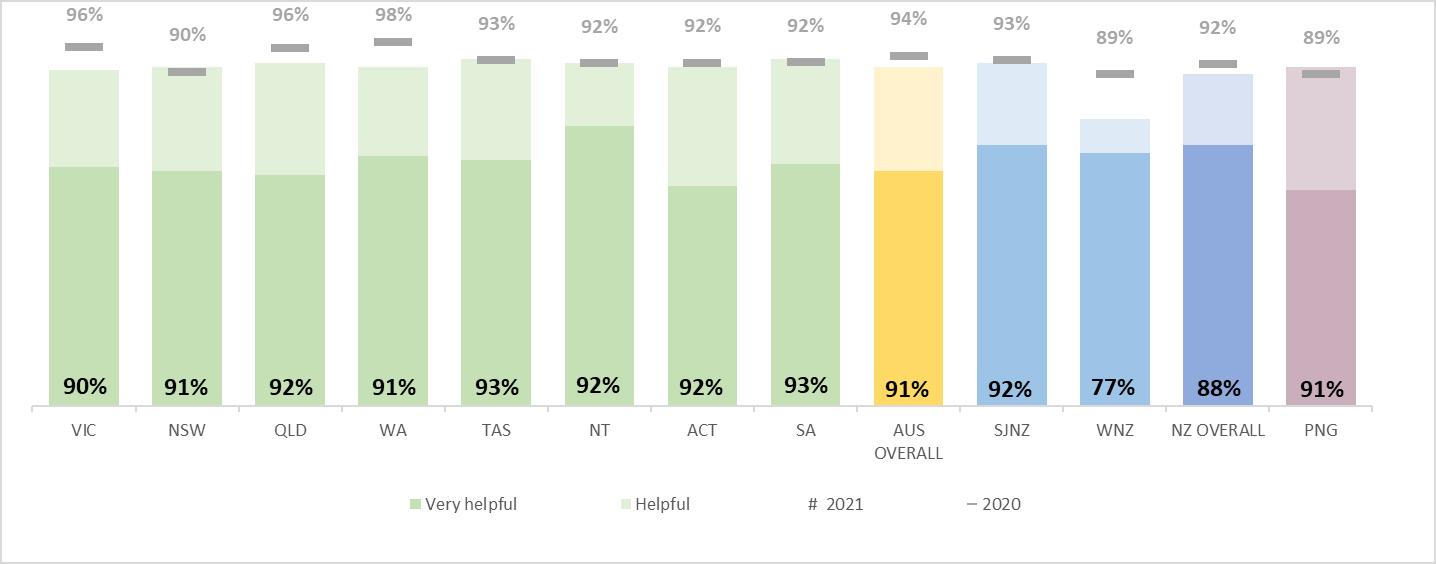
Approximately nine in ten respondents in New Zealand (88%), Australia and Papua New Guinea (both 91%) indicated that the assistance provided by the call taker was either ‘very helpful and reassuring’ or ‘helpful and reassuring’. 0% of respondents in the Australian Capital Territory reported that the call taker was unhelpful, and only a range of 1% to 2% in the rest of the Australian states
In New Zealand, a high proportion of Wellington respondents felt that the call handler was unhelpful (18%), driving the overall New Zealand NET negative result of 7%
Figure 4 Assistance provided by call taker – All Services (Q3) – 2020 vs 2021
3. Throughout the 000/111 call, how helpful and reassuring was the Ambulance Service call handler you were speaking with? (Base Australia 2021 n=4,189, 2020 n=2,238; New Zealand 2021 n=842, 2020 n=820; Papua New Guinea 2021 n=1,088, 2020 n= 65; excludes ‘missing’, ‘don’t know/can’t say’)
Australian overall results experienced a significant decrease in NET positive results in 2021 to 91% when compared against the previous year (94%). This was driven by significant decrease in those reporting the call taker was ‘Very helpful’ or ‘Helpful’ in Victoria (90%), Queensland (92%) and Western Australia (91%). However, for the fifth consecutive year, only 1% of Australians indicated that the call taker was unhelpful, with a significantly larger proportion of Australians indicating that the Ambulance Service call handler’s helpfulness and reassurance was ‘OK’ this year (8%, up from 5% in 2020).
Similarly, in New Zealand, the proportion of respondents who said the call taker was ‘Very helpful’ or ‘Helpful’ decreased significantly, from 92% to 88%. Wellington’s significant decline from 89% to 77% was the key contributor to this shift. The significantly greater proportion of Wellington patients rating the call taker as unhelpful (18%, up from 1% in 2020) drove less positive result when looking at experiences with the call taker
Papua New Guinea saw an improvement overall with over nine in ten (91%) respondents indicating that the call handler was either ‘very helpful’ or ‘helpful’, up 2 percentage points from 89% last year. Only 19 respondents (2%) reported a negative result.
“Medical guidance provided by the call taker. Clear explanation of what was happening.” – Patient, WA
“They made me feel that I was not wasting their time, that it was ok to call. I always worry that someone else may need them more, everyone has been caring and kind a compassionate calm and re-assuring. Keep doing a wonderful job. I feel safe that this service is available.” – Patient, VIC
Time taken for ambulance to arrive
Table 7. Time taken for ambulance to arrive (Q4) – All Services 2021
4.Which of the following would best describe how you felt about the length of time you waited for the ambulance to arrive? (Base Australia n=4,837; New Zealand n=1,696; Papua New Guinea n=1,092; excludes ‘missing’, ‘don’t know/can’t say’)
In Australia, over half of respondents (57%) said that the ambulance arrived ‘much’ or ‘a little’ quicker than expected, with 35% of respondents reporting that it arrived ‘much’ quicker. The Northern Territory and Western Australia recorded the most positive experiences when it came to ambulance wait times, just under half (48%) of respondents from the Northern Territory and 43% from Western Australia reported that the ambulance arrived ‘much quicker’ than they thought it would
In New Zealand, over half of the participants (53%) indicated the ambulance arrived either ‘much’ or ‘a little’ quicker than expected. An overwhelming 91% of Papua New Guinea respondents reported they felt the ambulance either arrived ‘much’ or ‘a little’ quicker than expected.
Figure 5. Time taken for ambulance to arrive – All Services (Q4) – 2020 vs 2021

4. Which of the following would best describe how you felt about the length of time you waited for the ambulance to arrive? (Base Australia 2021 n=2,561, 2020 n=4,837; New Zealand 2021 n=1,696, 2020 n=1,588; Papua New Guinea 2021 n=1,092, 2020 n=65; excludes ‘missing’, ‘don’t know/can’t say’)
Victoria, Queensland, ACT and South Australia all reported a significant decline with the satisfaction of timeliness of ambulance arrival. This culminated in the Australia overall result decreasing significantly, down by seven percentage points from the previous year to 57%. Western Australia’s satisfaction in wait times increased marginally by one percentage point to 68%, the highest positive score across the Australian services.
Similarly, NET positive results in New Zealand declined significantly to 53%, down five percentage points from the previous year. This was primarily driven by a significant decrease in satisfaction of timeliness of ambulance arrival in Wellington, down 13 percentage points to 44%.
Papua New Guinea saw an overwhelming improvement in positive experiences with wait times, 91% reporting the ambulance arrived quicker than they expected, up 28 percentage points from 2020.
Table 8. Reasonable time for an ambulance (Q9) – Australia 2021
9. Considering all circumstances, if you had an emergency in your home, what do you feel would be a reasonable time to wait for an ambulance to arrive? (Base Australia n=4,474; Papua New Guinea n=1,093; excludes ‘missing’, ‘don’t know/can’t say’, and responses over 120 minutes)
The survey asked respondents what they considered to be a reasonable wait time for an ambulance to arrive to their home. This was an open-ended question, requesting participants to write any value in minutes. When a respondent answered with a range, (e.g. 10 to 5 minutes), the maximum value was reported, which is important to note when interpreting data. Table 8 displays:
• mean (the average)
• the minimum answer provided in each state and across the country
• first quartile Q1 (the point where 25% of answers are below this point and 75% above)
• median or second quartile (the mid-point where half the answers are below this point and half above)
• third quartile Q3 (the point where 75% of answers are below this point and 25% above)
• the maximum answer provided in each state and across the country.
Across Australia on average, respondents reported that 19 3 minutes was a reasonable time to wait for an ambulance if they had an emergency in their home. As in 2020, those from Tasmania had the most lenient expectations of ambulance wait times with an average wait time of 22.9 minutes. This was followed by Queensland with an average wait time of 20.5 minutes. These figures were both significantly greater when compared against the Australian average. The Australian Capital Territory had the quickest perceived reasonable wait time of 15.9 minutes.
Papua New Guinea’s reasonable wait time of 19.6 minutes was similar to the Australian average. This question was not asked in New Zealand.

9. Considering all circumstances, if you had an emergency in your home, what do you feel would be a reasonable time to wait for an ambulance to arrive? (Base Australia 2021 n=4,474, 2020 n=2,285; excludes ‘missing’, ‘don’t know/can’t say’, and responses over 120 minutes)
Australians overall were more tolerant of wait times in 2021 with a reasonable wait time expected of 19.3 minutes, over two minutes longer compared to 2020. All states and territories, with the exception of the Northern Territory, increased their leniency regarding wait times. A significant increase in what was considered a reasonable wait time was observed when comparing 2020 and 2021 results among Victoria (19.4 minutes), Queensland (20.5 minutes) and in Western Australia (18.2 minutes)
This was the first year the question had been asked in Papua New Guinea. The question was not asked in New Zealand
“Arrived quickly, crew seemed very confident and competent. Made me feel assured. Used a little humour to lighten the situation.” – Patient, VIC
“They arrived quickly and were able to assess quickly and give me pain relief for my condition.” – Patient, ACT
“There was nothing to fault with the speed of arrival, care and general handling of call out. Clear language used by staff.” – Carer, St John
Care Provided Table 9. Paramedics’ care
5. Could you rate how you felt about the level of care provided to you by the ambulance paramedics? (Base Australia n=5,132; Papua New Guinea n=1,092; excludes ‘missing’, ‘don’t know/can’t say’)
Overall, respondents’ experiences with the care provided by the ambulance paramedics were overwhelmingly positive. 87% Australian patients reported their care as ‘very good’, with a further one in ten (10%) indicating their care was ‘good’. Only 1% of the overall Australian sample reported their care as poor. A very high level of satisfaction was reported across all states and territories, ranging from 96% to 98%, indicating that the level of care provided by the ambulance paramedics was either ‘very good’ or ‘good’.
Similarly, the experience of care received by patients in Papua New Guinea was overwhelmingly positive with ninetyone percent (91%) indicating it was ‘very good’ or ‘good’.
This question was not asked in New Zealand.
7. Paramedics’ care – Australia and Papua New Guinea (Q5) – 2020 vs 2021

5. Could you rate how you felt about the level of care provided to you by the ambulance paramedics? (Base Australia 2021 n=5,132, 2020 n=2,719; Papua New Guinea 2021 n=1,092, 2020 n=65; excludes ‘missing’, ‘don’t know/can’t say’)
For the fifth consecutive year, overall Australian respondents’ experiences regarding the level of care were almost entirely positive. Despite Victoria and Queensland both reporting a significant decline of 2 percentage points to 97%, only 1% of respondents from both states felt that that the level of care provided by the paramedics was ‘very poor’ or ‘poor’.
Papua New Guinea NET positive result declined by three percentage points to 91% However, this remains a very strong result, and similar to the Australian results only 1% of respondents reported a negative experience.
“I felt safe & cared for. Good communication from paramedics. Calm & organised.” – Patient, WA
“I was treated with great care and respect. I couldn't ask for anything more.” – Patient, NSW
“They were comforting, confident, communicative, caring, knowledgeable and provided the necessary and appropriate care.” – Carer, QLD
Table 10. Trust and confidence in quality of care and treatment (Q6) – All services 2021
6. How would you rate the level of trust and confidence you had in the ambulance service staff and their ability to provide quality care and treatment? (Base Australia n=5,133; New Zealand n=1,201; Papua New Guinea n=1,091; excludes ‘missing’, ‘don’t know/can’t say’)
Reported levels of trust and confidence in the quality of care and treatment provided by ambulance service staff were high across the board, with Australia averaging 92% and all Australian services recording a positive score of between 91% and 95%. The small range of variation across services indicates that nationwide there are high levels of trust in ambulance service staff.
In New Zealand, this question was only asked to patients of St John Ambulance Service. An overwhelming 96% of patients reported either ‘very high’ or ‘high’ levels of confidence and trust and only 20 respondents (2%) reported low levels of confidence.
In Papua New Guinea, just over nine in ten respondents (91%) indicated the level either ‘very high’ or ‘high’ levels of confidence and trust and only 15 respondents (1%) indicated they had low levels of confidence.

6. How would you rate the level of trust and confidence you had in the ambulance service staff and their ability to provide quality care and treatment? (Base Australia 2021 n=5,133, 2020 n=2,726; New Zealand 2021 n=1,201, 2020 n=1,212; Papua New Guinea 2021 n=1,091, 2020 n=65; excludes ‘missing’, ‘don’t know/can’t say’)
Overall results for Australian services saw a significant decrease in 2021, down three percentage points from 95% in 2020 to 92%. The Victorian service experienced a significant decrease in the proportion of respondents that
reported ‘Very high’ or ‘High’ levels of confidence, down 4 percentage points from 96% in 2020 to 92% this year However, Victoria maintained a 1% proportion of respondents indicating they had a low level of confidence, meaning there was a larger proportion of Victorians reporting that they were ‘Confident’ (from 3% in 2020 to 7% in 2021). Tasmania was the only state to record a marginal increase in the levels of trust and confidence, up 1 percentage point from the previous year to 94% in 2021.
This question was only asked of St John ambulance service patients in New Zealand. Whilst results in New Zealand remain overwhelmingly positive for this measure, a significant decrease was observed this year, the NET positive score dropping one percentage point from 97% to 96%.
Papua New Guinea recorded a significant improvement in levels of confidence, with 91% of respondents indicating that they had ‘very high’ or ‘high’ levels of trust and confidence, a 22-percentage point increase compared to 2020.
“The ambulance crew were very kind and caring. Very pleasant people with whom I had a great deal of confidence.” – Carer, TAS
“The ambulance staff were very kind and caring, they accommodated us in any way possible and we trusted them completely. Having a sense of humour was great as well, they were so good to us, I'm very grateful.”
–Carer, St John
“They were very calm and gave me a feeling of confidence.” – Patient, SA
Service staff explanations
Table 1. Service staff explanations (Q7) – All services 2021
7. Did the Ambulance service staff explain, in a way you could understand, your condition and reasons for the treatment they were providing? (Base Australia n=4,883; New Zealand n=544; Papua New Guinea n=1,093; excludes ‘missing’, ‘don’t know/can’t say’)
In Australia, a majority (95%) of respondents felt that the ambulance service staff provided a ‘very clear’ (71%) or ‘reasonably clear’ (23%) explanation of their condition and reasons for treatment. Only 2% of all Australian respondents considered their explanation unclear. There was little variation between the states and territories, all services reporting a range between 93% to 97% when looking at the proportion who reported receiving a clear explanation
In New Zealand, this question was only asked of Wellington patients this year. 88% of respondents indicated that the ambulance service staff’s explanation was clear, with over two-thirds (67%) reporting that the explanation was ‘very clear’
In Papua New Guinea, results were similar to New Zealand with 87% of respondents receiving a ‘very clear’ or ‘clear’ explanation from the Ambulance service staff.
Figure 9. Service staff explanations – All Services (Q7) – 2020 vs 2021

7. Did the Ambulance service staff explain, in a way you could understand, your condition and reasons for the treatment they were providing? (Base Australia 2021 n=4,883, 2020 n=2,616; New Zealand 2021 n=544, 2020 n=736; Papua New Guinea 2021 n=1,093, 2020 n=65; excludes ‘missing’, ‘don’t know/can’t say’)
Overall, results in Australia were consistent compared to 2020 Victoria saw a significant decline of four percentage points to 93% in 2021, whereas New South Wales recorded a significant improvement of four percentage points to 94%. All other states and territories remained fairly consistent from the previous year, with only marginal changes in results observed
New Zealand saw a significant decline overall of eight percentage points, from 95% in 2020 to 87% this year. Papua New Guinea recorded a similar decline of seven percentage points to 87% in 2021.
“The crew were very helpful and understanding and also explained what they were doing as they went along.”
– Patient, NT
“The paramedics were very thorough in their questioning with regard to my symptoms. They explained their thoughts and advised me of everything they were about to do.” – Patient, QLD
“Very quick arrival. Explained things very well.” – Patient, ACT
Table 2 Quality of the ride (Q8) – All Services 2021
8. Giving consideration to the situation you were in and local road conditions, how would you rate your level of comfort with the paramedic’s handling of the vehicle during your ambulance journey? (Base Australia n=4,888; New Zealand n=1,623; Papua New Guinea n=1,089; excludes ‘missing’, ‘don’t know/can’t say’)
Among all Australian patients, an overwhelming majority (95%) reported a comfortable experience, with seven in ten (71%) respondents reporting that the ride was ‘very comfortable’ and a quarter (25%) indicating that it was ‘comfortable’. No respondents from Western Australia felt that the ambulance journey was ‘uncomfortable’ or ‘very uncomfortable’.
New Zealand recorded results consistent with Australia, 94% of participants indicating they were comfortable and only 2% of respondents reporting being uncomfortable during their journey. Nine in ten (90%) patients in Papua New Guinea reported the paramedics’ handling of the vehicle was either ‘very comfortable’ or ‘comfortable’, and only 18 respondents (2%) who felt the journey was uncomfortable.
Figure 1. Quality of the ride – All Services (Q8) – 2020 vs 2021

8. Giving consideration to the situation you were in and local road conditions, how would you rate your level of comfort with the paramedic’s handling of the vehicle during your ambulance journey? (Base Australia 2021 n=4,888, 2020 n=2,630; New Zealand 2021 n=1,623, 2020 n=1,444; Papua New Guinea 2021 n=1,089, 2020 n=65; excludes ‘missing’, ‘don’t know/can’t say’)
Results from 2020 to 2021 were largely consistent across Australia, with only a marginal decline in NET positive results overall The Victorian service reported a significant decrease of three percentage points from 2020 to 93%, whereas the other states and territories remained largely consistent.
New Zealand results also remained consistent with no changes in the overall results.
In Papua New Guinea, a significantly higher proportion of respondents indicated that the journey was either ‘very comfortable’ or ‘comfortable’, up 19 percentage points from 2020 to 90%.
“The driver was careful, and the paramedics treated my wife quickly, great service.” – Carer, PNG
“Got my mother safely and as comfortably as possible over pothole riddled road for half the journey.”
– Carer, NSW
“Very comfortable trip.” – Patient, ACT
Please answer the questions below by placing a tick in the appropriate box. If you don’t understand any questions, please use the ‘don't know’ option and move to the next question. Please refer to your most recent experience with the ambulance service when answering these questions. If the question is not relevant to your recent experience, mark the ‘NA’ box and move on to the next question. Please note that your personal opinions will be kept confidential and that no information which could identify you will be released. Information obtained from you will be combined with the other responses and used for analytical purposes only.
Q1 Is the person completing this survey:
The patient that was transported A relative, or carer of the patient.
If you are completing the survey on behalf of the patient, wherever possible the questions should be answered from the patient’s perspective. However, some questions may relate more to your experience and can be answered from your perspective.
Q2 Thinking about your 000/111 call to the Ambulance Service, which of the following would best describe how you felt about the length of time you waited to be connected to the Ambulance Service call taker?
Much quicker than I thought it would be
A little quicker than I thought it would be
About what I thought it would be
A little slower than I thought it would be
Much slower than I thought it would be
Don’t know / Can’t Recall/ Did not make the call
Q3 Throughout the 000/111 call, how helpful and reassuring was the Ambulance Service call handler you were speaking with?
Very helpful & reassuring Helpful & reassuring Ok Not helpful & not reassuring Very unhelpful & not at all reassuring
Don’t know / Can’t Recall / Did not make the call
Q4 Which of the following would best describe how you felt about the length of time you waited for the ambulance to arrive?
Much quicker than I thought it would be
A little quicker than I thought it would be
About what I thought it would be
A little slower than I thought it would be
Much slower than I thought it would be
Don’t know / Can’t Recall
Q5 Please rate how you felt about the level of care provided to you by the ambulance paramedics overall, including arrival, treatment and transport?
Very Good Good
Poor Don’t know / Can’t Recall
Q6 How would you rate the level of trust and confidence you had in the ambulance services staff and their ability to provide quality care and treatment?
Don’t know / Can’t Recall
Q7 Did the paramedic explain, in a way you could understand, your condition and reasons for the treatment they were providing? A very clear and thorough explanation of my condition & reasons for treatment were provided A reasonably clear explanation of my condition & reasons for treatment were provided Explanation of condition & treatment were just ok Some explanation was given but I could not understand it No not at all Don’t know / Can’t Recall This was not possible
Q8 How would you rate your level of comfort with the paramedic’s handling of the vehicle during your ambulance journey (taking into consideration the situation you were in and local road conditions)?
Very Comfortable Comfortable Ok Uncomfortable Very Uncomfortable Don’t know / Can’t Recall
Now think about your overall experience with the Ambulance Service
Q9 Thinking about your most recent ambulance experience, what do you feel would have been a reasonable time to wait for the ambulance to arrive?
No of minutes
Q10 Please rate how satisfied were you overall with your last experience using the Ambulance Service.
Don’t know / Can’t Recall
Q11a) What were the best things about your experience with the ambulance service?
Q11b) What could the ambulance service do to improve the service provided to patients?
And finally, a few quick questions about you (the patient).
Q12 Which of the following best describes you (the patient)?
Male Female Other
Q13 Please select the age group you (the patient) falls into.
Q14 How many times have you (the patient) used the Ambulance Service in the last 12 months?
Once
Between 2-5 times
Q15 What is your (the patient’s) postcode?
Postcode ____________
More than 5 times
The Ambulance Service respects your privacy and would like to thank you for taking the time to complete this questionnaire. Please place the completed questionnaire in the reply-paid envelope provided and post.
Q10. How satisfied were you overall with your last experience using the Ambulance Service, were you?
Q2. Which of the following would best describe how you felt about the length of time you waited to be connected to the Ambulance Service call taker?
Q3. Throughout the 000/111 call, how helpful and reassuring was the Ambulance Service call handler you were speaking with?
Q4. Which of the following would best describe how you felt about the length of time you waited for the ambulance to arrive?
Q9. Considering all circumstances, if you had an emergency in your home, what do you feel would be a reasonable time to wait for an ambulance to arrive? (mins)
AUSTRALIA
Q5. Could you rate how you felt about the level of care provided to you by the ambulance paramedics?
Q6. How would you rate the level of trust and confidence you had in the ambulance services staff and their ability to provide quality care and treatment?
Q7. Did the Ambulance service staff explain, in a way you could understand, your condition and reasons for the treatment they were providing?
Q8. Giving consideration to the situation you were in and local road conditions, how would you rate your level of comfort with the paramedic’s handling of the vehicle during your ambulance journey?

2/141 Sir Donald Bradman Drive, Hilton 5083
Published: 22 September 2021