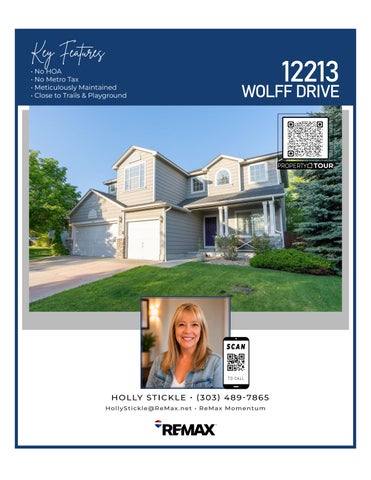
Key Features
• No HOA • No Metro Tax • Meticulously Maintained • Close to Trails & Playground
12213
WOLFF DRIVE
H O L LY ST I C K L E • ( 3 03 ) 4 8 9 - 78 6 5 HollyStickle@ReMax.net • ReMax Momentum
Expert
Holly Stickle
Holly Stickle ReMax Hall of Fame, e-PRO REALTOR®
With 20 years of experience working with both buyers and sellers, I have a vast understanding of Colorado’s residential real estate market. I’m honored to have earned numerous awards and recognition among my peers, including the prestigious ReMax Hall of Fame award. I love being a part of this huge milestone in people’s lives, and will work hard to take great care of your referrals. When not working, you’ll find me cooking, reading and walking my sweet Golden Retriever, Dash. Thanks for reading!
LET MY EXPERTISE WORK FOR YOU H O L LY ST I C K L E • ( 3 03 ) 4 8 9 - 78 6 5 HollyStickle@ReMax.net
Equal Housing Opportunity. If you have a brokerage relationship with another agency, this is not intended as a solicitation. All information deemed reliable but not guaranteed.
DISCLAIMER
This Homebook is provided “as is” without warranty of any kind, either express or implied, including without limitations any warrantees of merchantability or fitness for a particular purpose. There is no representation of warranty that this information is complete or free from error, and the provider does not assume, and expressly disclaims, any liability to any person or entity for loss or damage caused by errors or omissions in this book. The information contained in the REiSource report is delivered from your First American Title Insurance Company, who reminds you that you have the right as a consumer to compare fees and serviced levels for Title, Escrow, and all other services associated with property ownership, and to select providers accordingly. Your home is the largest investment you will make in your lifetime and you should demand the very best. First American, the eagle logo, First American Title, and firstam.com are registered trademarks or trademarks of First American Financial Corporation and/or its affiliates.
© 2023 First American Financial Corporation and/or its affiliates. All rights reserved. NYSE: FAF
Subject Property : 12213 Wolff Dr Broomfield CO 80020 Owner Information Owner Name : Tunehorst Robert R Jr Mailing Address : 12213 Wolff Dr, Broomfield CO 80020-5629 R027 Owner Occupied O Indicator : Location Information Legal Description : Subd: Country Vista Filing No 1 Lot: 22 Block: 3 County : Broomfield, Co Census Tract / Block : 308.00 / 3 Township-Range- Sect : 01S-68W-31 Legal Lot : 22 Legal Block : 3
Alternate APN : 1573-31-3-13-022 Subdivision : Country Vista Filing 1 Map Reference : 1S-68W-31-SW School District : Adams 12 5 Star Schl Munic/Township : Adams
APN : R0022019 Last Market Sale Information Recording/Sale Date : 07/29/2019 / 07/25/2019 Sale Price : $480,000 Document # : 8538 Deed Type : Warranty Deed
1st Mtg Amount/Type : $471,306 / Fha 1st Mtg Document # : 8539 1st Mtg Term : 30 Price Per SqFt : $192.31
Title Company : First American Title Insurance Seller Name : Campolieto Marc J Prior Sale Information Prior Rec/Sale Date : 06/30/2006 / 06/29/2006 Prior Sale Price : $300,000
Prior Deed Type : Warranty Deed Prior 1st Mtg Amt/Type : $286,000 / Private Party
Prior Doc Number : 8457
Customer Name : De Anna Harwood Customer Company Name : First American Title Prepared On : 10/05/2026 © 2026 CoreLogic. All rights reserved
Property Characteristics Gross Area : 2,496
Year Built / Eff : 1995
Living Area : 2,496
# of Stories : 2
Tot Adj Area : 2,496 Above Grade : 1890 Bedrooms : 3
Parking Type : Attached Garage Garage 3 Capacity : Basement Area : 606
Bath(F/H) : 4
Finish Bsmnt Area : FINISHED
Fireplace : Y
Basement Type : Finished
Roof Material : Asphalt Heat Type : Forced Air Cooling Type : Forced Air Exterior wall : Frame Brick Air Cond : Central Condition : Average
Property Information Land Use : Sfr County Use : Residential Single Family
Zoning : R-PUD Lot Acres : 0.17
Lot Size : 7,328 State Use : Single Fam Res Imps
Tax Information Total Value : $650,320
Tax Year : 2025
Current Assessed 2026 Year :
Land Value : $145,000
Property Tax : $5,066.08
Current Year Total $45,850 Value :
Improvement $505,320 Value : Assessed Year : 2025
Tax Rate Area : 145
Market Value : $650,320
Current Year $35,630 Improvement Value : Current Year Land $10,220 Value :
Improve % : 78%
Customer Name : De Anna Harwood Customer Company Name : First American Title Prepared On : 10/05/2026 © 2026 CoreLogic. All rights reserved
Subject Property : 12213 Wolff Dr Broomfield CO 80020
Customer Name : De Anna Harwood Customer Company Name : First American Title Prepared On : 10/05/2026 © 2026 CoreLogic. All rights reserved
Customer Name : De Anna Harwood Customer Company Name : First American Title Prepared On : 10/05/2026 © 2026 CoreLogic. All rights reserved
Local Business Attractions / Recreation Name
Address
Telephone
Distance (Miles)
Colorado Swim School
5075 W 120th Ave Broomfield Co
(303) 439-7946
0.16
Crna Ski Colorado
5023 W 120th Ave Broomfield Co
(859) 582-9828
0.18
Colorado Krav Maga Inc.
5109 W 120th Ave Broomfield Co
(720) 214-1691
0.2
Otf Broomfield, Inc.
1285 E 1st Ave Unit C Broomfield Co
(303) 469-4019
0.36
Banks / Financial Name
Address
Telephone
Distance (Miles)
U.s. Bank National Association
4660 W 121st Ave Ste 1 Broomfield Co
(720) 566-7700
0.29
First National Bank Of Omaha
12009 Sheridan Blvd Broomfield Co
(720) 566-3300
0.3
Jpmorgan Chase Bank, National Association
4580 W 121st Ave Broomfield Co
(303) 466-1003
0.34
Firstbank
5130 W 120th Ave Westminster Co
(303) 404-3000
0.35
Eating / Drinking Name
Address
Telephone
Distance (Miles)
Domino's Pizza
5159 W 120th Ave Broomfield Co
(303) 466-4664
0.2
Subway Sandwiches
4651 W 121st Ave Broomfield Co
(303) 469-9280
0.21
United Chinese Restaurant Ii Inc
12161 Sheridan Blvd Unit Broomfield Co
(303) 469-2230
0.24
Deli Zone
12161 Sheridan Blvd Unit Broomfield Co
(720) 974-0521
0.25
Health Care Services Name
Address
Telephone
Distance (Miles)
Lisa Shaheen Fnp, Llc
4644 Winona Pl Broomfield Co
(720) 320-5030
0.14
Arisone Home Health Care, Inc.
5023 W 120th Ave Ste 256 Broomfield (720) 469-9910 Co
0.18
Quest Counseling Services, Llc
5023 W 120th Ave Ste 304 Broomfield (303) 578-8320 Co
0.18
Guerillahealer
5023 W 120th Ave Ste 151 Broomfield (802) 363-1353 Co
0.18
Customer Name : De Anna Harwood Customer Company Name : First American Title Prepared On : 10/05/2026 © 2026 CoreLogic. All rights reserved
Hospitality Name
Address
Telephone
Distance (Miles)
Inland Pacific Colorado, L.l.c
11798 Quitman Pl Westminster Co
(303) 410-5050
0.77
Cp Boulder Llc
11702 Perry St Westminster Co
(720) 938-7960
0.83
Organizations / Associations Name
Address
Telephone
Distance (Miles)
Mile High Labrador Retriever Mission
4780 W 125th Ave Broomfield Co
(303) 464-9974
0.22
Empowering Grace International
4600 W 124th Ave Broomfield Co
(720) 457-3643
0.26
The Living Stone Church
1380 Stonehaven Ave Broomfield Co (806) 290-1438
0.33
Lifeline Church
12530 Forest View St Broomfield Co
0.54
(303) 887-3353
Personal Services Name
Address
Telephone
Distance (Miles)
Rachas, Inc.
5105 W 120th Ave Broomfield Co
(720) 328-4319
0.18
Bfg Broomfield, Llc
4650 W 120th Ave Unit 1 Broomfield Co
(720) 882-9200
0.46
Diversity Capital Partners Llc
4550 Main St Unit 400 Westminster Co (720) 464-7000
0.48
Pure Barre Broomfield
11961 Bradburn Blvd Westminster Co
0.54
(720) 633-6398
Shopping Name
Address
Telephone
Distance (Miles)
Lindenfarms Llc
5023 W 120th Ave Pmb 197 Broomfield Co
(303) 800-5414
0.18
The Sherwin-williams Company
5055 W 120th Ave Broomfield Co
(303) 469-7454
0.19
Dollar Tree, Inc.
5113 W 120th Ave Broomfield Co
(757) 407-0869
0.2
General Nutrition Center(gnc)
4800 W 121st Ave Ste 2 Broomfield Co
(720) 887-4611
0.28
Customer Name : De Anna Harwood Customer Company Name : First American Title Prepared On : 10/05/2026 © 2026 CoreLogic. All rights reserved
12203 WOLFF DR # 1 Owner Name : Willis Lisa C Sale Date : 04/22/2025 Total Value : $604,760
Distance 0.01 Miles Subdivision : Country Vista Filing 1 Recording Date : 04/25/2025 Sale Price : $693,000
Bed / Bath : 3 / 4
Property Tax : $4,710.92
Land Use : Sfr
Lot Acres : 0.23
Stories : 2
Living Area : 2,095
Yr Blt / Eff Yr Blt : 1995 /
APN : R0022018
12223 WOLFF DR
Distance 0.01 Miles
Owner Name : Warnock Susan H Sale Date : 02/21/2017 Total Value : $586,120
Recording Date : 02/24/2017 Sale Price : $415,000 Property Tax : $4,565.80
Bed / Bath : 3 / 3
Lot Acres : 0.16
Land Use : Sfr
Living Area : 2,238
Yr Blt / Eff Yr Blt : 1995 /
APN : R0022020
Subdivision : Country Vista Filing 1 4881 YATES CT
Distance 0.02 Miles
Owner Name : Warnock Jed H Sale Date : 11/19/2015 Total Value : $669,470
Recording Date : 11/23/2015 Sale Price : $415,000 Property Tax : $5,215.40
Bed / Bath : 4 / 4
Lot Acres : 0.15
Land Use : Sfr
Living Area : 2,844
Yr Blt / Eff Yr Blt : 1995 /
APN : R0022017
Subdivision : Country Vista Filing 1 12254 WOLFF CT
Distance 0.03 Miles
Owner Name : Evanko Brian Sale Date : 07/18/2022 Total Value : $535,890
Subdivision : Country Vista Filing 1 Recording Date : 07/19/2022 Sale Price : $657,000
Bed / Bath : 3 / 3
Property Tax : $4,174.56
Land Use : Sfr
Lot Acres : 0.17
Stories : 2
Living Area : 1,820
Yr Blt / Eff Yr Blt : 1995 /
APN : R0022021 Customer Name : De Anna Harwood Customer Company Name : First American Title Prepared On : 10/05/2026 © 2026 CoreLogic. All rights reserved
4901 YATES CT
Distance 0.03 Miles
Owner Name : Liu Qingxia Sale Date : 09/10/2025 Total Value : $609,300
Recording Date : 09/12/2025 Sale Price : $641,500 Property Tax : $4,746.12
Bed / Bath : 3 / 4
Lot Acres : 0.14
Land Use : Sfr
Living Area : 2,239
Yr Blt / Eff Yr Blt : 1995 /
APN : R0022016
Subdivision : Country Vista Filing 1 12244 WOLFF CT
Distance 0.03 Miles
Owner Name : Batts Barbara Sale Date : 08/25/2016 Total Value : $626,040
Subdivision : Country Vista Filing 1 Recording Date : 08/25/2016 Sale Price : $399,500
Bed / Bath : 3 / 4
Property Tax : $4,876.68
Land Use : Sfr
Lot Acres : 0.16
Stories : 2
Living Area : 2,506
Yr Blt / Eff Yr Blt : 1995 /
APN : R0022022
4840 YATES CT
Distance 0.04 Miles
Owner Name : Jump William J Sale Date : 07/28/2006 Total Value : $646,870
Recording Date : 08/07/2006 Sale Price : $280,000 Property Tax : $4,259.96
Bed / Bath : 2 / 3
Lot Acres : 0.15
Land Use : Sfr
Living Area : 2,623
Yr Blt / Eff Yr Blt : 1994 /
APN : R0021990
Subdivision : Country Vista Filing 1 4921 YATES CT
Distance 0.04 Miles
Owner Name : Zarifa Sandra A Sale Date : 06/09/2017 Total Value : $650,390
Subdivision : Country Vista Filing 1 Recording Date : 06/13/2017 Sale Price : $455,000
Bed / Bath : 3 / 4
Property Tax : $5,066.52
Land Use : Sfr
Lot Acres : 0.14
Stories : 2
Living Area : 2,274
Yr Blt / Eff Yr Blt : 1995 /
APN : R0022015 Customer Name : De Anna Harwood Customer Company Name : First American Title Prepared On : 10/05/2026 © 2026 CoreLogic. All rights reserved
4860 YATES CT
Distance 0.04 Miles
Owner Name : Hughes Daniel T Sale Date : 06/26/1998 Total Value : $586,650
Subdivision : Country Vista Filing 1 Recording Date : 07/06/1998 Sale Price : $179,900
Bed / Bath : 3 / 2
Property Tax : $4,569.96
Land Use : Sfr
Lot Acres : 0.15
Stories : 2
Living Area : 1,682
Yr Blt / Eff Yr Blt : 1994 /
APN : R0021989
4820 YATES CT
Distance 0.04 Miles
Owner Name : Peterson Scott L Sale Date : 06/08/2026 Total Value : $656,470
Recording Date : 06/09/2026 Sale Price : $610,000 Property Tax : $5,114
Bed / Bath : 4 / 4
Lot Acres : 0.15
Land Use : Sfr
Living Area : 2,789
Yr Blt / Eff Yr Blt : 1995 /
APN : R0021991
Subdivision : Country Vista Filing 1
Customer Name : De Anna Harwood Customer Company Name : First American Title Prepared On : 10/05/2026 © 2026 CoreLogic. All rights reserved
Census Tract / block: 308.00 / 3
Year: 2020
Household Population
Population by Age
Count:
5,920
0 - 11
Estimate Current Year:
5,882
12 - 17
Estimate in 5 Years:
5,734
18 - 24
5.66%
Growth Last 5 Years:
3.92%
25 - 64
59.34%
Growth Last 10 Years:
-197.41%
65 - 74
6.99%
75+ Household Size
Household Income
Current Year:
2,044
0 - $25,000
3.08%
Average Current Year:
2.9
$25,000 - $35,000
0.88%
Estimate in 5 Years:
2,515
$35,000 - $50,000
3.96%
Growth Last 5 Years:
5.48%
$50,000 - $75,000
7.39%
Growth Last 10 Years:
-2.69%
$75,000 - $100,000
17.42%
Male Population:
53.63%
Above $100,000
67.27%
Female Population:
46.37%
Married People:
63.1%
Unmarried People:
36.9%
Average Household Income:
$149,052
Housing Median Mortgage Payments
Home Values
Under $300:
0.49%
Below $100,000:
11.66%
$300 - $799:
10.69%
$100,000 - $150,000:
0.65%
$800 - $1,999:
33.03%
$150,000 - $200,000:
0%
Over $2,000:
55.8%
$200,000 - $300,000:
0.76%
Median Home Value:
$586,300
$300,000 - $500,000:
13.76%
Unit Occupied Owner:
90.66%
Above $500,000:
73.18%
Median Mortgage:
$1,481
Customer Name : De Anna Harwood Customer Company Name : First American Title Prepared On : 10/05/2026 © 2026 CoreLogic. All rights reserved
Rent Payments
Year Built
Unit Occupied Renter:
9.34%
1999 - 2000
Median Gross Rent:
$2,685
1995 - 1998
Less Than $499
0%
1990 - 1994
$500 - $749
0%
1980 - 1989
15.66%
$750 - $999
0%
1970 - 1979
6.31%
$1000 and Over
100%
1900 - 1969
0.63%
Public Pre-Primary School:
1.03%
Not Enrolled in School:
72.43%
Private Pre-Primary School:
2.06%
Not A High School Graduate:
6.21%
Public School:
22.89%
Graduate Of High School:
13.8%
Private School:
4.68%
Attended Some College:
16.54%
Public College:
3.71%
College Graduate:
42.27%
Private College:
1%
Graduate Degree:
21.18%
52.21%
Private Worker:
66.6%
Government Worker:
16.9%
Self Employed Worker:
7.24%
Unpaid Family Worker:
4.52%
Education Enrollment
Workforce Occupation:
Manager/Prof: Technical: Sales:
19.42%
Administrative: Private House Hold: Service:
Farming: 11.06%
Protective Services:
6.95%
Skilled: Blue-Collar:
17.31%
Commute Time
Less Than 15 Min:
18.15%
15 min - 28 min:
34.13%
30 min - 57 min:
40.56%
Over 60 min:
7.17%
Customer Name : De Anna Harwood Customer Company Name : First American Title Prepared On : 10/05/2026 © 2026 CoreLogic. All rights reserved
DENVER METRO Adams, Arapahoe, Boulder, Broomfield, Denver, Douglas, Elbert & Jefferson Counties
SCHOOL DISTRICT: ADAMS CO. DIST 12
SCHOOLS: SCHOOL INFORMATION
MOUNTAIN VIEW ELEMENTARY WESTLAKE MIDDLE LEGACY HIGH
DENVER METRO
SCHOOL INFORMATION
Adams, Arapahoe, Boulder, Broomfield, Denver, Douglas, Elbert & Jefferson Counties
DENVER METRO Adams, Arapahoe, Boulder, Broomfield, Denver, Douglas, Elbert & Jefferson Counties
METRO REGION SCHOOL DISTRICTS: ADAMS 12 FIVE STAR SCHOOLS Thornton www.adams12.org
ADAMS 14
Commerce City adams14.org
ADAMS-ARAPAHOE 28J Aurora www.aurorak12.org
BOULDER VALLEY RE-2 Boulder www.bvsd.org
CHERRY CREEK 5
Greenwood Village www.cherrycreekschools.org
CLEAR CREEK RE-1
SCHOOL INFORMATION
Idaho Springs www.ccsdre1.org
DENVER COUNTY 1
GILPIN COUNTY RE-1 Black Hawk www.gilpin.k12.co.us
JEFFERSON COUNTY R-1 Golden www.jeffcopublicschools.org
LITTLETON 6
Littleton www.littletonpublicschools.net
MAPLETON 1 Denver www.mapleton.us
PLATTE CANYON
Bailey www.plattecanyonschools.org
SCHOOL DISTRICT 27J Brighton www.sd27j.org
SHERIDAN 2 Sheridan www.ssd2.org
WESTMINSTER PUBLIC SCHOOLS Westminster wps.org
Denver www.dpsk12.org
DOUGLAS COUNTY RE-1 Castle Rock www.dcsdk12.org
ELIZABETH SCHOOL DISTRICT Elizabeth www.elizabethschooldistrict.org
ENGLEWOOD 1
Englewood www.englewoodschools.net
2026
2025 Final School Performance Framework 6150: Mountain View Elementary School | 0020: Adams 12 Five Star Schools Plan Type
Grade Levels: E - (1 Year)
Official Rating based on SINGLE-YEAR SPF Report
52.4/100
Improvement Plan
Points Earned -
The performance framework evaluates district and school performance on Academic Achievement, Academic Growth, and Postsecondary & Workforce Readiness indicators. The percentage of points earned across all indicators determines the final accreditation rating for a district or the final plan type for a school, which is displayed above. The cut points for final ratings established by the State Board of Education are shown at the right of this page. Failure to meet finance, assessment, and safety assurances may result in a lowered rating. Refer to the scoring guide near the end of this report for more details on how ratings are determined.
Indicator Rating Totals Performance Indicator
Percent of Points Earned
Points Earned/ Eligible
Academic Achievement
63.2%
25.3/40
Meets
Academic Growth
45.2%
27.1/60
Approaching
Rating
52.4%
Performance Improvement Priority Imp. Turnaround
School plan types are based on the total percentage of points earned.
Performance Plan: 53.0% - 100%
Assurances Rating Participation
Improvement Plan: 42.0% - 52.9%
Meets 95% Participation
Priority Improvement Plan: 34.0% - 41.9%
Test Participation Rates and Total Participation Rate Descriptor* Total Records
Valid Scores
Total Participation Rate
Parent Excusals
Accountability Participation Rate
Rating
English Language Arts
252
232
92.1%
18
100.0%
Meets 95% Participation
Math
252
233
92.5%
19
100.0%
Meets 95% Participation
Subject
Does Not Meet 95% Total Participation
Total Participation Rate Descriptor for Planning Purposes:
Turnaround Plan: 0.0% - 33.9%
Insufficient State Data: No reportable achievement and growth data.
Summary of Ratings by EMH Level EMH Level
Performance Indicator
Elementary Academic Achievement Academic Growth
Percent of
Points Earned/
Points Earned
Eligible
Rating
63.2%
25.3/40
Meets
45.2%
27.1/60
Approaching
Points by Level
Overall Rating by Level
52.4%
Improvement
(-) No Reportable Data *State accountability policy requires 95% student participation in state assessments. Students excused from testing by a parent or guardian do not impact the Accountability Participation Rate that determines whether the overall rating is reduced by one level. Districts or schools with less than 95% total participation in ELA and Math receive a "Does Not Meet 95% Total Participation" descriptor that is informational and does not impact framework calculations. The descriptor does not impact framework calculations. First-year in the U.S. Multilingual Learners eligible to take the ELP assessment count as participants for ELA.
2025 Final School Performance Framework 6150: Mountain View Elementary School | 0020: Adams 12 Five Star Schools
Elementary School - (1 Year)
ACADEMIC ACHIEVEMENT Subject CMAS - English Language Arts
CMAS - Math
CMAS - Science
Student Group
Count
Participation Rate
Mean Scale Score
Percentile Rank
Pts Earned/ Eligible
All Students
231
92.1%
750.4
76
6.00/8
Previously Identified for READ Plan Free/Reduced-Price Lunch Eligible
48 63
85.7% 84.0%
709.6 723.6
16
0.00/0 0.50/1
Minority Students
93
91.3%
737.4
45
0.50/1
Approaching Approaching
Multilingual Learners
32
82.1%
717.1
7
0.25/1
Does Not Meet
Students with Disabilities
30
71.4%
700.2
1
0.25/1
Does Not Meet
All Students
231
92.5%
741.6
65
6.00/8
Meets
Free/Reduced-Price Lunch Eligible Minority Students
64 94
86.7% 93.2%
715.2 727.9
9 33
0.25/1 0.50/1
Does Not Meet
Multilingual Learners
33
87.2%
713.1
7
0.25/1
Approaching Does Not Meet
Students with Disabilities
30
71.4%
691.0
1
0.25/1
Does Not Meet
All Students
70
89.7%
740.4
58
6.00/8
Meets
Free/Reduced-Price Lunch Eligible
22
84.6%
717.3
13
0.25/1
Does Not Meet
Minority Students Multilingual Learners
27 n < 16
87.1% -
732.0 -
41 -
0.50/1 0.00/0
Approaching
Students with Disabilities
n < 16
-
-
-
0.00/0
-
*
*
*
*
21.50/34
Meets
TOTAL
Rating Meets -
ACADEMIC GROWTH Subject
Student Group
Count
Median Growth Percentile/Rate
Pts Earned/ Eligible
Rating
CMAS - English Language Arts
All Students
152
44.0
4.00/8
Approaching
Free/Reduced-Price Lunch Eligible
43
32.0
0.25/1
Does Not Meet
Minority Students
61
42.0
0.50/1
Approaching
Multilingual Learners
20
49.5
0.50/1
Approaching
Students with Disabilities
n < 20
-
0.00/0
-
All Students
152
44.5
4.00/8
Approaching
Free/Reduced-Price Lunch Eligible
43
40.0
0.50/1
Approaching
Minority Students
62
39.0
0.50/1
Approaching
Multilingual Learners
22
40.5
0.50/1
Approaching
n < 20
-
0.00/0
-
English Language English Language Proficiency Proficiency On Track to EL Proficiency
37
26.0
0.50/2
Does Not Meet
37
51.4%
0.50/2
Does Not Meet
TOTAL
*
*
11.75/26
Approaching
CMAS - Math
Students with Disabilities
This page displays the performance indicator data for the elementary school level. For the 1-year report, calculations are based on 2025 state assessment results. Multi-year reports include 2023 through 2025 results. Academic Achievement: mean scale scores represent outcomes for designated subjects and student groups; participation rates included on this page count parent excusals as non-participants. Academic Growth: median student growth percentiles and percentages of students on track to meet targets represent outcomes for designated subjects and student groups. For additional information regarding Academic Achievement and Academic Growth points, cut-points, and ratings, refer to the scoring guide at the end of this document. Multilingual Learners describes students that are Non-English Proficient (NEP), Limited English Proficient (LEP), and Fluent English Proficient (FEP) - Monitor Year 1, Monitor Year 2, Exited Year 1, & Exited Year 2. (*) Not Applicable; (-) No Reportable Data
Scoring Guide for 2025 District/School Performance Frameworks Performance Indicator Measure/Metric
Rating
Mean Scale Score was: Academic Achievement & ELP On Track Growth
Exceeds • at or above the 85th percentile Meets • at or above the 50th percentile but below the 85th percentile Approaching • at or above the 15th percentile but below the 50th percentile Does Not Meet • below the 15th percentile Students Previously Identified for a READ Plan (bonus point) • CMAS ELA Mean scale score at or above 725 (Approaching Expectations cut-score) Median Growth Percentile was:
• at or above 65 Academic Growth • at or above 50 but below 65 • at or above 35 but below 50 • below 35 Mean CO SAT Reading and Writing (EBRW) scale score was**: 1-Year 3-Year • at or above 553.1 553.6 • below previous cut but at or above 494.6 496.4 • below previous cut but at or above 448.1 455.8 • below 448.1 455.8 Mean CO SAT Math scale score was**: 1-Year 3-Year • at or above 527.0 523.3 • below previous cut but at or above 465.8 466.0 • below previous cut but at or above 423.3 426.4 • below 423.3 426.4 Dropout Rate: The district or school dropout rate was (of all schools in 2017): Postsecondary and • at or below 0.5% Workforce Readiness • at or below 2.0% but above 0.5% • at or below 5.0% but above 2.0% • above 5.0% Matriculation Rate (of all schools in 2018): • at or above the 75.8% • at or above 61.1% but below 75.8% • at or above 46.8% but below 61.1% • below 46.8% Graduation Rate and Disaggregated Graduation Rate (Best of 4-, 5-, 6-, or 7-year): • at or above 95.0% • at or above 85.0% but below 95.0% • at or above 75.0% but below 85.0% • below 75.0%
Exceeds Meets Approaching Does Not Meet
Exceeds Meets Approaching Does Not Meet Exceeds Meets Approaching Does Not Meet Exceeds Meets Approaching Does Not Meet
Point Value Each Disaggregated Group
All Students 8 6 4 2
1.00 0.75 0.50 0.25 1 bonus point
All Students 8 6 4 2
Each Disaggregated Group
ELP
1.00 0.75 0.50 0.25
2.0 1.5 1.0 0.5
All Students
Each Disaggregated Group
4 3 2 1 All Students 4 3 2 1 All Students 8 6 4 2
1.00 0.75 0.50 0.25 Each Disaggregated Group 1.00 0.75 0.50 0.25 Each Disaggregated Group 2.0 1.5 1.0 0.5 All Students 4 3 2 1 Each Disaggregated Group 2.0 1.5 1.0 0.5
Exceeds Meets Approaching Does Not Meet Exceeds Meets Approaching Does Not Meet
ELP On Track Growth 2.0 1.5 1.0 0.5
All Students 8 6 4 2
Academic Achievement: Mean Scale Score by Percentile Cut-Points
The Academic Achievement Indicator reflects achievement as measured by the mean scale score on Colorado's standardized assessments. The presented targets for the Achievement Indicators have been established utilizing baseline year data.* English Language Arts & Mathematics Science Reading & Writing for CO PSAT CO PSAT CO PSAT CO PSAT CO PSAT Elementary Middle Elementary Middle Elem Middle High 1-Year 3-Year 1-Year 3-Year Percentile 15th percentile 722.3 724.1 415.1 416.8 719.1 716.5 387.4 393.4 717.9 714.2 721.4 50th percentile 739.5 740.1 458.9 456.7 734.3 731.2 430.2 431.4 736.9 732.8 734.6 85th percentile 755.9 757.3 505.0 508.0 751.9 746.2 480.4 480.5 753.2 749.3 746.4
Percent of Students On Track for ELP Growth Targets Percentile 15th percentile 50th percentile 85th percentile
ELP On Track Growth Elem Middle High 52.1% 13.8% 14.1% 64.4% 24.2% 22.7% 76.7% 37.3% 35.1%
Cut-Points for Each Performance Indicator Achievement; Growth; Postsecondary Readiness
Cut-Point: The district or school earned...of points eligible Exceeds • at or above 87.5% Meets • at or above 62.5% but below 87.5% Approaching • at or above 37.5% but below 62.5% Does Not Meet • below 37.5%
Cut-Points for Plan/Category Type Assignment
Total Framework Points
District 74.0% 56.0% 44.0% 34.0% 25.0%
School not applicable 53.0% 42.0% 34.0% 25.0%
Total Possible Points by Performance Indicator Indicator
Total Possible Points
Achievement
36 points (8 per subject for all students, 4 per subject by disaggregated group)
40%
30%
Growth
28 total points (8 per subject for all students, 4 per subject by disaggregated group, 2 for ELP growth, 2 for ELP On Track Growth)
60%
40%
not applicable
30%
Elementary/Middle High/District
52 total points (16 for graduation, 4 for Postsecondary matriculation, 16 for dropout, 8 per CO Readiness SAT subject)
Accreditation Category/Plan Type Accredited w/Distinction (District only) Accredited (District) or Performance Plan (School) Accredited w/Improvement Plan (District) or Improvement Plan (School) Accredited w/Priority Improvement Plan (District) or Priority Improvement (School) Accredited w/Turnaround Plan(District) or Turnaround Plan (School)
* School data used as baseline: 2016 for CMAS & CoAlt ELA & Math (g3-8). 2024 for 1yr and 2025 for 3yr CO PSAT & CoAlt EBRW/ELA & Math (g9-10). 2024 for CMAS and CoAlt Science (g5, 8, 11). 2024 for ELP On Track to Proficiency Growth as planned prior to the COVID-19 pandemic. ** 2024 school data used as baseline for 1 yr CO SAT & CoAlt EBRW/ELA & Math (g11) and 2025 data for 3yr.
July 22, 2025
2025 Final School Performance Framework 9444: Westlake Middle School | 0020: Adams 12 Five Star Schools Plan Type
Grade Levels: M - (1 Year)
Official Rating based on SINGLE-YEAR SPF Report
62.8/100
Performance Plan
Points Earned -
The performance framework evaluates district and school performance on Academic Achievement, Academic Growth, and Postsecondary & Workforce Readiness indicators. The percentage of points earned across all indicators determines the final accreditation rating for a district or the final plan type for a school, which is displayed above. The cut points for final ratings established by the State Board of Education are shown at the right of this page. Failure to meet finance, assessment, and safety assurances may result in a lowered rating. Refer to the scoring guide near the end of this report for more details on how ratings are determined.
Indicator Rating Totals Performance Indicator
Percent of Points Earned
Points Earned/ Eligible
Rating
Academic Achievement
63.2%
25.3/40
Meets
Academic Growth
62.5%
37.5/60
Meets
62.8% Performance Improvement Priority Imp. Turnaround
School plan types are based on the total percentage of points earned.
Performance Plan: 53.0% - 100%
Assurances Rating Participation
Improvement Plan: 42.0% - 52.9%
Meets 95% Participation
Priority Improvement Plan: 34.0% - 41.9%
Test Participation Rates and Total Participation Rate Descriptor* Total Records
Valid Scores
Total Participation Rate
Parent Excusals
Accountability Participation Rate
Rating
English Language Arts
848
733
86.4%
106
99.5%
Meets 95% Participation
Math
848
742
87.5%
103
99.6%
Meets 95% Participation
Subject
Does Not Meet 95% Total Participation
Total Participation Rate Descriptor for Planning Purposes:
Turnaround Plan: 0.0% - 33.9%
Insufficient State Data: No reportable achievement and growth data.
Summary of Ratings by EMH Level Percent of
Points Earned/
EMH Level
Performance Indicator
Points Earned
Eligible
Rating
Middle
Academic Achievement
63.2%
25.3/40
Meets
Academic Growth
62.5%
37.5/60
Meets
Points by Level
Overall Rating by Level
62.8%
Performance
(-) No Reportable Data *State accountability policy requires 95% student participation in state assessments. Students excused from testing by a parent or guardian do not impact the Accountability Participation Rate that determines whether the overall rating is reduced by one level. Districts or schools with less than 95% total participation in ELA and Math receive a "Does Not Meet 95% Total Participation" descriptor that is informational and does not impact framework calculations. The descriptor does not impact framework calculations. First-year in the U.S. Multilingual Learners eligible to take the ELP assessment count as participants for ELA.
2025 Final School Performance Framework 9444: Westlake Middle School | 0020: Adams 12 Five Star Schools
Middle School - (1 Year)
ACADEMIC ACHIEVEMENT Subject
Student Group
Count
Participation Rate
Mean Scale Score
Percentile Rank
Pts Earned/ Eligible
CMAS - English Language Arts
All Students
717
86.4%
753.4
79
6.00/8
Meets
Free/Reduced-Price Lunch Eligible
188
81.0%
725.5
18
0.50/1
Approaching
Minority Students
284
84.8%
738.2
44
0.50/1
Approaching
Multilingual Learners
112
82.4%
720.5
9
0.25/1
Does Not Meet
Students with Disabilities
76
73.8%
706.6
1
0.25/1
Does Not Meet
All Students
727
87.5%
744.2
80
6.00/8
Meets
Free/Reduced-Price Lunch Eligible
194
83.1%
716.9
16
0.50/1
Approaching
Minority Students
290
86.2%
729.1
44
0.50/1
Approaching
Multilingual Learners
118
86.6%
713.1
9
0.25/1
Does Not Meet
Students with Disabilities
76
73.8%
701.9
1
0.25/1
Does Not Meet
All Students
233
83.4%
744.2
76
6.00/8
Meets
Free/Reduced-Price Lunch Eligible
55
72.2%
718.4
21
0.50/1
Approaching
Minority Students
100
84.4%
733.9
53
0.75/1
Meets
Multilingual Learners
31
78.0%
703.0
4
0.25/1
Does Not Meet
Students with Disabilities
21
75.0%
694.2
1
0.25/1
Does Not Meet
*
*
*
*
22.75/36
Meets
CMAS - Math
CMAS - Science
TOTAL
Rating
ACADEMIC GROWTH Subject
Student Group
Count
Median Growth Percentile/Rate
Pts Earned/ Eligible
Rating
CMAS - English Language Arts
All Students
683
54.0
6.00/8
Meets
Free/Reduced-Price Lunch Eligible
173
45.0
0.50/1
Approaching
Minority Students
266
47.0
0.50/1
Approaching
Multilingual Learners
103
42.0
0.50/1
Approaching
Students with Disabilities
65
42.0
0.50/1
Approaching
All Students
693
48.0
4.00/8
Approaching
Free/Reduced-Price Lunch Eligible
182
42.0
0.50/1
Approaching
Minority Students
275
43.0
0.50/1
Approaching
Multilingual Learners
110
40.5
0.50/1
Approaching
Students with Disabilities
67
41.0
0.50/1
Approaching
English Language English Language Proficiency Proficiency On Track to EL Proficiency
53
53.0
1.50/2
Meets
53
37.7%
2.00/2
Exceeds
TOTAL
*
*
17.50/28
Meets
CMAS - Math
This page displays the performance indicator data for the middle school level. For the 1-year report, calculations are based on 2025 state assessment results. Multi-year reports include 2023 through 2025 results. Academic Achievement: mean scale scores represent outcomes for designated subjects and student groups; participation rates included on this page count parent excusals as non-participants. Academic Growth: median student growth percentiles and percentages of students on track to meet targets represent outcomes for designated subjects and student groups. For additional information regarding Academic Achievement and Academic Growth points, cut-points, and ratings, refer to the scoring guide at the end of this document. Multilingual Learners describes students that are Non-English Proficient (NEP), Limited English Proficient (LEP), and Fluent English Proficient (FEP) - Monitor Year 1, Monitor Year 2, Exited Year 1, & Exited Year 2. (*) Not Applicable; (-) No Reportable Data
Scoring Guide for 2025 District/School Performance Frameworks Performance Indicator Measure/Metric
Rating
Mean Scale Score was: Academic Achievement & ELP On Track Growth
Exceeds • at or above the 85th percentile Meets • at or above the 50th percentile but below the 85th percentile Approaching • at or above the 15th percentile but below the 50th percentile Does Not Meet • below the 15th percentile Students Previously Identified for a READ Plan (bonus point) • CMAS ELA Mean scale score at or above 725 (Approaching Expectations cut-score) Median Growth Percentile was:
• at or above 65 Academic Growth • at or above 50 but below 65 • at or above 35 but below 50 • below 35 Mean CO SAT Reading and Writing (EBRW) scale score was**: 1-Year 3-Year • at or above 553.1 553.6 • below previous cut but at or above 494.6 496.4 • below previous cut but at or above 448.1 455.8 • below 448.1 455.8 Mean CO SAT Math scale score was**: 1-Year 3-Year • at or above 527.0 523.3 • below previous cut but at or above 465.8 466.0 • below previous cut but at or above 423.3 426.4 • below 423.3 426.4 Dropout Rate: The district or school dropout rate was (of all schools in 2017): Postsecondary and • at or below 0.5% Workforce Readiness • at or below 2.0% but above 0.5% • at or below 5.0% but above 2.0% • above 5.0% Matriculation Rate (of all schools in 2018): • at or above the 75.8% • at or above 61.1% but below 75.8% • at or above 46.8% but below 61.1% • below 46.8% Graduation Rate and Disaggregated Graduation Rate (Best of 4-, 5-, 6-, or 7-year): • at or above 95.0% • at or above 85.0% but below 95.0% • at or above 75.0% but below 85.0% • below 75.0%
Exceeds Meets Approaching Does Not Meet
Exceeds Meets Approaching Does Not Meet Exceeds Meets Approaching Does Not Meet Exceeds Meets Approaching Does Not Meet
Point Value Each Disaggregated Group
All Students 8 6 4 2
1.00 0.75 0.50 0.25 1 bonus point
All Students 8 6 4 2
Each Disaggregated Group
ELP
1.00 0.75 0.50 0.25
2.0 1.5 1.0 0.5
All Students
Each Disaggregated Group
4 3 2 1 All Students 4 3 2 1 All Students 8 6 4 2
1.00 0.75 0.50 0.25 Each Disaggregated Group 1.00 0.75 0.50 0.25 Each Disaggregated Group 2.0 1.5 1.0 0.5 All Students 4 3 2 1 Each Disaggregated Group 2.0 1.5 1.0 0.5
Exceeds Meets Approaching Does Not Meet Exceeds Meets Approaching Does Not Meet
ELP On Track Growth 2.0 1.5 1.0 0.5
All Students 8 6 4 2
Academic Achievement: Mean Scale Score by Percentile Cut-Points
The Academic Achievement Indicator reflects achievement as measured by the mean scale score on Colorado's standardized assessments. The presented targets for the Achievement Indicators have been established utilizing baseline year data.* English Language Arts & Mathematics Science Reading & Writing for CO PSAT CO PSAT CO PSAT CO PSAT CO PSAT Elementary Middle Elementary Middle Elem Middle High 1-Year 3-Year 1-Year 3-Year Percentile 15th percentile 722.3 724.1 415.1 416.8 719.1 716.5 387.4 393.4 717.9 714.2 721.4 50th percentile 739.5 740.1 458.9 456.7 734.3 731.2 430.2 431.4 736.9 732.8 734.6 85th percentile 755.9 757.3 505.0 508.0 751.9 746.2 480.4 480.5 753.2 749.3 746.4
Percent of Students On Track for ELP Growth Targets Percentile 15th percentile 50th percentile 85th percentile
ELP On Track Growth Elem Middle High 52.1% 13.8% 14.1% 64.4% 24.2% 22.7% 76.7% 37.3% 35.1%
Cut-Points for Each Performance Indicator Achievement; Growth; Postsecondary Readiness
Cut-Point: The district or school earned...of points eligible Exceeds • at or above 87.5% Meets • at or above 62.5% but below 87.5% Approaching • at or above 37.5% but below 62.5% Does Not Meet • below 37.5%
Cut-Points for Plan/Category Type Assignment
Total Framework Points
District 74.0% 56.0% 44.0% 34.0% 25.0%
School not applicable 53.0% 42.0% 34.0% 25.0%
Total Possible Points by Performance Indicator Indicator
Total Possible Points
Achievement
36 points (8 per subject for all students, 4 per subject by disaggregated group)
40%
30%
Growth
28 total points (8 per subject for all students, 4 per subject by disaggregated group, 2 for ELP growth, 2 for ELP On Track Growth)
60%
40%
not applicable
30%
Elementary/Middle High/District
52 total points (16 for graduation, 4 for Postsecondary matriculation, 16 for dropout, 8 per CO Readiness SAT subject)
Accreditation Category/Plan Type Accredited w/Distinction (District only) Accredited (District) or Performance Plan (School) Accredited w/Improvement Plan (District) or Improvement Plan (School) Accredited w/Priority Improvement Plan (District) or Priority Improvement (School) Accredited w/Turnaround Plan(District) or Turnaround Plan (School)
* School data used as baseline: 2016 for CMAS & CoAlt ELA & Math (g3-8). 2024 for 1yr and 2025 for 3yr CO PSAT & CoAlt EBRW/ELA & Math (g9-10). 2024 for CMAS and CoAlt Science (g5, 8, 11). 2024 for ELP On Track to Proficiency Growth as planned prior to the COVID-19 pandemic. ** 2024 school data used as baseline for 1 yr CO SAT & CoAlt EBRW/ELA & Math (g11) and 2025 data for 3yr.
July 22, 2025
2025 Final School Performance Framework 5043: Legacy High School | 0020: Adams 12 Five Star Schools Plan Type
Grade Levels: H - (1 Year)
Official Rating based on SINGLE-YEAR SPF Report
75.2/100
Performance Plan
Points Earned
75.2%
The performance framework evaluates district and school performance on Academic Achievement, Academic Growth, and Postsecondary & Workforce Readiness indicators. The percentage of points earned across all indicators determines the final accreditation rating for a district or the final plan type for a school, which is displayed above. The cut points for final ratings established by the State Board of Education are shown at the right of this page. Failure to meet finance, assessment, and safety assurances may result in a lowered rating. Refer to the scoring guide near the end of this report for more details on how ratings are determined.
Indicator Rating Totals
Performance Improvement Priority Imp. Turnaround
School plan types are based on the total percentage of points earned.
Performance Indicator
Percent of Points Earned
Points Earned/ Eligible
Rating
Academic Achievement
71.4%
21.4/30
Meets
Academic Growth
72.3%
28.9/40
Meets
Postsecondary & Workforce Readiness
83.0%
24.9/30
Meets
Performance Plan: 53.0% - 100%
Rating
Improvement Plan: 42.0% - 52.9%
Assurances
Participation
Meets 95% Participation
Priority Improvement Plan: 34.0% - 41.9%
Test Participation Rates and Total Participation Rate Descriptor*
Subject
Total Records
Valid Scores
Total Participation Rate
Parent Excusals
Accountability Participation Rate
Rating
English Language Arts
1,494
1,343
89.9%
99
96.3%
Meets 95% Participation
Math
1,494
1,343
89.9%
99
96.3%
Meets 95% Participation Does Not Meet 95% Total Participation
Total Participation Rate Descriptor for Planning Purposes:
Turnaround Plan: 0.0% - 33.9%
Insufficient State Data: No reportable achievement and growth data.
Summary of Ratings by EMH Level Percent of
Points Earned/
EMH Level
Performance Indicator
Points Earned
Eligible
Rating
High
Academic Achievement
71.4%
21.4/30
Meets
Academic Growth
72.3%
28.9/40
Meets
Postsecondary & Workforce Readiness
83.0%
24.9/30
Meets
Points by Level
Overall Rating by Level
75.2%
Performance
(-) No Reportable Data *State accountability policy requires 95% student participation in state assessments. Students excused from testing by a parent or guardian do not impact the Accountability Participation Rate that determines whether the overall rating is reduced by one level. Districts or schools with less than 95% total participation in ELA and Math receive a "Does Not Meet 95% Total Participation" descriptor that is informational and does not impact framework calculations. The descriptor does not impact framework calculations. First-year in the U.S. Multilingual Learners eligible to take the ELP assessment count as participants for ELA.
2025 Final School Performance Framework 5043: Legacy High School | 0020: Adams 12 Five Star Schools
High School - (1 Year)
ACADEMIC ACHIEVEMENT Student Group
Count
Participation Rate
Mean Scale Score
Percentile Rank
Pts Earned/ Eligible
CO PSAT - Reading All Students & Writing Free/Reduced-Price Lunch Eligible
867
89.4%
503.9
84
6.00/8
Meets
171
79.0%
426.1
23
0.50/1
Approaching
Minority Students
316
85.8%
472.8
60
0.75/1
Meets
Multilingual Learners
59
78.8%
373.0
1
0.25/1
Does Not Meet
Students with Disabilities
70
70.3%
377.1
1
0.25/1
Does Not Meet
All Students
874
89.4%
490.9
90
8.00/8
Exceeds
Free/Reduced-Price Lunch Eligible
176
79.0%
412.8
35
0.50/1
Approaching
Minority Students
323
85.8%
457.1
72
0.75/1
Meets
Multilingual Learners
66
78.8%
365.6
3
0.25/1
Does Not Meet
Students with Disabilities
70
70.3%
352.2
1
0.25/1
Does Not Meet
All Students
107
21.5%
742.6
77
6.00/8
Meets
Free/Reduced-Price Lunch Eligible
21
24.2%
728.1
29
0.50/1
Approaching
Subject
CO PSAT - Math
CMAS - Science
Minority Students Multilingual Learners Students with Disabilities TOTAL
Rating
39
21.5%
734.3
49
0.50/1
Approaching
n < 16
-
-
-
0.00/0
-
18
58.1%
727.2
27
0.50/1
Approaching
*
*
*
*
25.00/35
Meets
ACADEMIC GROWTH Student Group
Count
Median Growth Percentile/Rate
Pts Earned/ Eligible
Rating
CO PSAT/SAT All Students Reading & Writing Free/Reduced-Price Lunch Eligible
852
52.0
6.00/8
Meets
147
44.0
0.50/1
Approaching
Minority Students
300
51.0
0.75/1
Meets
Multilingual Learners
34
33.0
0.25/1
Does Not Meet
Students with Disabilities
39
51.0
0.75/1
Meets
All Students
1,217
52.0
6.00/8
Meets
Free/Reduced-Price Lunch Eligible
207
43.0
0.50/1
Approaching
Minority Students
429
48.0
0.50/1
Approaching
Multilingual Learners
63
40.0
0.50/1
Approaching
Students with Disabilities
72
40.0
0.50/1
Approaching
English Language English Language Proficiency Proficiency On Track to EL Proficiency
44
70.0
2.00/2
Exceeds
44
40.9%
2.00/2
Exceeds
TOTAL
*
*
20.25/28
Meets
Subject
CO PSAT/SAT Math
This page displays the performance indicator data for the high school level. For the 1-year report, calculations are based on 2025 state assessment results. Multi-year reports include 2023 through 2025 results. PSAT/SAT cut scores for the multi-year reports were renormed based on 2025 results. Academic Achievement: mean scale scores represent outcomes for designated subjects and student groups; participation rates included on this page count parent excusals as non-participants. . Academic Growth: median student growth percentiles and percentages of students on track to meet targets represent outcomes for designated subjects and student groups. For additional information regarding Academic Achievement and Academic Growth points, cut-points, and ratings, refer to the scoring guide at the end of this document. Multilingual Learners describes students that are Non-English Proficient (NEP), Limited English Proficient (LEP), and Fluent English Proficient (FEP) - Monitor Year 1, Monitor Year 2, Exited Year 1, & Exited Year 2. (*) Not Applicable; (-) No Reportable Data
2025 Final School Performance Framework 5043: Legacy High School | 0020: Adams 12 Five Star Schools
High School - (1 Year)
POSTSECONDARY AND WORKFORCE READINESS Subject Student Group CO SAT - Reading All Students & Writing Free/Reduced-Price Lunch Eligible Minority Students Multilingual Learners Students with Disabilities CO SAT - Math All Students
Count 452 69 157 n < 16 22 452
Best Rate * * * * * *
Rate/Score 560.7 482.8 534.9 419.7 557.8
Participation Rate 90.9% 80.5% 85.2% 73.3% 90.9%
Pts Earned/ Eligible 4.00/4 0.50/1 0.75/1 0.00/0 0.25/1 4.00/4
Free/Reduced-Price Lunch Eligible Minority Students Multilingual Learners Students with Disabilities All Students Free/Reduced-Price Lunch Eligible
69 157 n < 16 22 2,386 605
* * * * * *
472.5 530.4 401.9 0.7% 1.5%
80.5% 85.2% 73.3% * *
0.75/1 1.00/1 0.00/0 0.25/1 6.00/8 1.50/2
Minority Students Multilingual Learners Students with Disabilities All Students 2 Year 4 Year CTE
957 132 200 520 * * *
* * * * * * *
1.1% 4.5% 1.5% 76.9% 14.4% 55.4% 10.2%
* * * * * * *
1.50/2 1.00/2 1.50/2 4.00/4 0.00/0 0.00/0 0.00/0
Meets Approaching Meets Exceeds -
Military
*
*
1.9%
*
0.00/0
* 531 127 179 28 32 *
* 5yr 4yr 5yr 5yr 5yr *
3.7% 96.2% 91.3% 95.0% 92.9% 93.8% *
* * * * * * *
0.00/0 8.00/8 1.50/2 2.00/2 1.50/2 1.50/2 41.50/50
Exceeds Meets Exceeds Meets Meets Meets
Dropout Rate
Matriculation Rate
Postsecondary Program Graduation Rate All Students Free/Reduced-Price Lunch Eligible Minority Students Multilingual Learners Students with Disabilities TOTAL
Rating Exceeds Approaching Meets Does Not Meet Exceeds Meets Exceeds Does Not Meet Meets Meets
REFERENCE TABLE: DISAGGREGATED GRADUATION RATES Student Group
4-Year Rate
5-Year Rate
6-Year Rate
7-Year Rate
Best Rate
All Students
96.2%
96.2%
95.7%
95.0%
5yr
Free/Reduced-Price Lunch Eligible
91.3%
85.7%
85.7%
86.1%
4yr
Minority Students
93.7%
95.0%
92.4%
93.0%
5yr
Multilingual Learners
87.1%
92.9%
82.2%
86.0%
5yr
Students with Disabilities
82.6%
93.8%
79.3%
90.2%
5yr
CO SAT: represent outcomes for designated subjects and student groups; participation rates count parent excusals as non-participants. For the 1-year report, calculations are based on 2025 state assessment results. Multi-year reports include 2023-2025 results. Cut-scores for the multi-year reports were re-normed based on 2025 results. Dropout Rates: represent percentages of students enrolled in grades 7-12 for districts and 9-12 for schools at any time during the year who left and did not subsequently enroll in another Colorado school. 1-Year calculations are based on the 2024 End of Year (EOY) data submission. Multi-year reports include 2022 through 2024 records. Matriculation Rates: represent percentages of high school graduates with a qualifying credential, enrollment, or enlistment status in a Career & Technical Education (CTE) program, a 2- or 4-year institute of higher education, a branch of the military, or a postsecondary program. Beginning in 2024, high school graduates who were enrolled in ASCENT, P-TECH, or TREP programs (i.e., Postsecondary Program) during their 5th year of high school count as successes. 1-Year calculations are based on the 2024 graduation cohort. Multi-year reports include 2022 through 2024 records. Graduation Rates: represent percentages of students graduating high school within designated timeframes. Ratings are based on the best of the 4-, 5-, 6-, and 7-year graduation rates. AYGs designate Anticipated Years of Graduation, which are defined as four years after the year that students initially enroll in 9th grade. Calculations for 1-Year and Multi-Year reports are based on data for students with AYGs between 2021 and 2024. For additional information about ratings, refer to the scoring guide on the last page of this report. Multilingual Learners describes students that are Non-English Proficient (NEP), Limited English Proficient (LEP), and Fluent English Proficient (FEP) - Monitor Year 1, Monitor Year 2, Exited Year 1, & Exited Year 2. (*) Not Applicable; (-) No Reportable Data
Scoring Guide for 2025 District/School Performance Frameworks Performance Indicator Measure/Metric
Rating
Mean Scale Score was: Academic Achievement & ELP On Track Growth
Exceeds • at or above the 85th percentile Meets • at or above the 50th percentile but below the 85th percentile Approaching • at or above the 15th percentile but below the 50th percentile Does Not Meet • below the 15th percentile Students Previously Identified for a READ Plan (bonus point) • CMAS ELA Mean scale score at or above 725 (Approaching Expectations cut-score) Median Growth Percentile was:
• at or above 65 Academic Growth • at or above 50 but below 65 • at or above 35 but below 50 • below 35 Mean CO SAT Reading and Writing (EBRW) scale score was**: 1-Year 3-Year • at or above 553.1 553.6 • below previous cut but at or above 494.6 496.4 • below previous cut but at or above 448.1 455.8 • below 448.1 455.8 Mean CO SAT Math scale score was**: 1-Year 3-Year • at or above 527.0 523.3 • below previous cut but at or above 465.8 466.0 • below previous cut but at or above 423.3 426.4 • below 423.3 426.4 Dropout Rate: The district or school dropout rate was (of all schools in 2017): Postsecondary and • at or below 0.5% Workforce Readiness • at or below 2.0% but above 0.5% • at or below 5.0% but above 2.0% • above 5.0% Matriculation Rate (of all schools in 2018): • at or above the 75.8% • at or above 61.1% but below 75.8% • at or above 46.8% but below 61.1% • below 46.8% Graduation Rate and Disaggregated Graduation Rate (Best of 4-, 5-, 6-, or 7-year): • at or above 95.0% • at or above 85.0% but below 95.0% • at or above 75.0% but below 85.0% • below 75.0%
Exceeds Meets Approaching Does Not Meet
Exceeds Meets Approaching Does Not Meet Exceeds Meets Approaching Does Not Meet Exceeds Meets Approaching Does Not Meet
Point Value Each Disaggregated Group
All Students 8 6 4 2
1.00 0.75 0.50 0.25 1 bonus point
All Students 8 6 4 2
Each Disaggregated Group
ELP
1.00 0.75 0.50 0.25
2.0 1.5 1.0 0.5
All Students
Each Disaggregated Group
4 3 2 1 All Students 4 3 2 1 All Students 8 6 4 2
1.00 0.75 0.50 0.25 Each Disaggregated Group 1.00 0.75 0.50 0.25 Each Disaggregated Group 2.0 1.5 1.0 0.5 All Students 4 3 2 1 Each Disaggregated Group 2.0 1.5 1.0 0.5
Exceeds Meets Approaching Does Not Meet Exceeds Meets Approaching Does Not Meet
ELP On Track Growth 2.0 1.5 1.0 0.5
All Students 8 6 4 2
Academic Achievement: Mean Scale Score by Percentile Cut-Points
The Academic Achievement Indicator reflects achievement as measured by the mean scale score on Colorado's standardized assessments. The presented targets for the Achievement Indicators have been established utilizing baseline year data.* English Language Arts & Mathematics Science Reading & Writing for CO PSAT CO PSAT CO PSAT CO PSAT CO PSAT Elementary Middle Elementary Middle Elem Middle High 1-Year 3-Year 1-Year 3-Year Percentile 15th percentile 722.3 724.1 415.1 416.8 719.1 716.5 387.4 393.4 717.9 714.2 721.4 50th percentile 739.5 740.1 458.9 456.7 734.3 731.2 430.2 431.4 736.9 732.8 734.6 85th percentile 755.9 757.3 505.0 508.0 751.9 746.2 480.4 480.5 753.2 749.3 746.4
Percent of Students On Track for ELP Growth Targets Percentile 15th percentile 50th percentile 85th percentile
ELP On Track Growth Elem Middle High 52.1% 13.8% 14.1% 64.4% 24.2% 22.7% 76.7% 37.3% 35.1%
Cut-Points for Each Performance Indicator Achievement; Growth; Postsecondary Readiness
Cut-Point: The district or school earned...of points eligible Exceeds • at or above 87.5% Meets • at or above 62.5% but below 87.5% Approaching • at or above 37.5% but below 62.5% Does Not Meet • below 37.5%
Cut-Points for Plan/Category Type Assignment
Total Framework Points
District 74.0% 56.0% 44.0% 34.0% 25.0%
School not applicable 53.0% 42.0% 34.0% 25.0%
Total Possible Points by Performance Indicator Indicator
Total Possible Points
Achievement
36 points (8 per subject for all students, 4 per subject by disaggregated group)
40%
30%
Growth
28 total points (8 per subject for all students, 4 per subject by disaggregated group, 2 for ELP growth, 2 for ELP On Track Growth)
60%
40%
not applicable
30%
Elementary/Middle High/District
52 total points (16 for graduation, 4 for Postsecondary matriculation, 16 for dropout, 8 per CO Readiness SAT subject)
Accreditation Category/Plan Type Accredited w/Distinction (District only) Accredited (District) or Performance Plan (School) Accredited w/Improvement Plan (District) or Improvement Plan (School) Accredited w/Priority Improvement Plan (District) or Priority Improvement (School) Accredited w/Turnaround Plan(District) or Turnaround Plan (School)
* School data used as baseline: 2016 for CMAS & CoAlt ELA & Math (g3-8). 2024 for 1yr and 2025 for 3yr CO PSAT & CoAlt EBRW/ELA & Math (g9-10). 2024 for CMAS and CoAlt Science (g5, 8, 11). 2024 for ELP On Track to Proficiency Growth as planned prior to the COVID-19 pandemic. ** 2024 school data used as baseline for 1 yr CO SAT & CoAlt EBRW/ELA & Math (g11) and 2025 data for 3yr.
July 22, 2025
Public Schools :
Elementary Schools
Mountain View Elementary School
Distance 0.59 Miles
12401 Perry Street Broomfield CO 80020 Telephone : (720) 972-5520 Lowest Grade : Pre-K Kindergarten : Yes Enrollment : 517
School District : Adams 12 Five Star Schools Highest Grade : 5th School Enrollment : Total Expenditure/Student : 24
Birch Elementary School
Distance 0.97 Miles
1035 Birch Broomfield CO 80020 Telephone : (720) 561-8800 Lowest Grade : Pre-K Kindergarten : Yes Enrollment : 299
School District : Boulder Valley School District No. Re2 Highest Grade : 5th School Enrollment : Total Expenditure/Student : 81
Ryan Elementary School
Distance 1.1 Miles
5851 West 115th Avenue Westminster CO 80020 Telephone : (303) 982-3105 Lowest Grade : Pre-K
School District : Jefferson County School District No. R-1 Highest Grade : 5th
Kindergarten : Yes
School Enrollment :
Enrollment : 511
Total Expenditure/Student :
Customer Name : De Anna Harwood Customer Company Name : First American Title Prepared On : 10/05/2026 © 2026 CoreLogic. All rights reserved
Emerald Elementary School
Distance 1.54 Miles
275 Emerald St Broomfield CO 80020 Telephone : (720) 561-8500 Lowest Grade : Pre-K Kindergarten : Yes Enrollment : 383
School District : Boulder Valley School District No. Re2 Highest Grade : 5th School Enrollment : Total Expenditure/Student : 81
Middle Schools
Broomfield Heights Middle School
Distance 1.99 Miles
1555 Daphne Street Broomfield CO 80020 Telephone : (720) 561-8400 Lowest Grade : 6th Kindergarten : No Enrollment : 490
School District : Boulder Valley School District No. Re2 Highest Grade : 8th School Enrollment : Total Expenditure/Student : 81
High Schools
Broomfield High School
Distance 1.56 Miles
1 Eagle Way Broomfield CO 80020 Telephone : (720) 561-8100 Lowest Grade : 9th School Enrollment : Total Expenditure/Student : 81
School District : Boulder Valley School District No. Re2 Highest Grade : 12th Enrollment : 1693 Advanced Placement : No
Customer Name : De Anna Harwood Customer Company Name : First American Title Prepared On : 10/05/2026 © 2026 CoreLogic. All rights reserved
Jefferson Academy Secondary
Distance 1.84 Miles
11251 Reed Way Broomfield CO 80020 Telephone : (720) 887-1992 Lowest Grade : 7th
School District : Jefferson County School District No. R-1 Highest Grade : 12th
School Enrollment :
Enrollment : 696
Total Expenditure/Student :
Advanced Placement : No
Customer Name : De Anna Harwood Customer Company Name : First American Title Prepared On : 10/05/2026 © 2026 CoreLogic. All rights reserved
HIGHER EDUCATION State of Colorado
FOUR YEAR INSTITUTIONS: ADAMS STATE UNIVERSITY
719.587.7011 208 Edgemont Blvd. • Alamosa, 81101 www.adams.edu
COLORADO CHRISTIAN UNIVERSITY
303.963.3000 8787 W Alameda Ave. • Lakewood, 80226 www.ccu.edu
*COLORADO COLLEGE
800-462-7845 or 720-279-0159 555 17th St., Ste. 1000 Denver, CO 80202 www.csuglobal.edu
*COLORADO TECHNICAL UNIVERSITY (CTU) 855.227.0555 1575 Garden of the Gods Rd. #100 Colorado Springs, 80907 www.coloradotech.edu
COLUMBIA COLLEGE DENVER
(719) 389-6344 14 E Cache La Poudre St. Colorado Springs, 80903 coloradocollege.edu/visit
303.771.0176 15500 E. Centretech Pkwy. Aurora, 80011 www.ccis.edu
COLORADO MESA UNIVERSITY
DEVRY UNIVERSITY
*COLORADO SCHOOL OF MINES
*FORT LEWIS COLLEGE
970.248.1020 1100 North Ave. • Grand Junction, 81501 coloradomesa.edu
SCHOOL INFORMATION
COLORADO STATE UNIVERSITY GLOBAL
303.273.3000 1500 Illinois St. • Golden, 80401 www.mines.edu
*COLORADO STATE UNIVERSITY (CSU) (970) 491-1111 711 Oval Drive, Fort Collins CO 80521 www.colostate.edu
*COLORADO STATE UNIVERSITY - PUEBLO
719.549.2100 2200 Bonforte Blvd. • Pueblo, 81001 www.csupueblo.edu
303.280.7400 1870 W 122nd Ave. Westminster, 80234 www.devry.edu
877.352.2656 1000 Rim Dr. • Durango, 81301 www.fortlewis.edu
METROPOLITAN STATE UNIVERSITY OF DENVER 303.556.5740 890 Auraria Pkwy. • Denver, 80204 www.msudenver.edu
NAZARENE BIBLE COLLEGE 719.884.5000 2020 N Academy Blvd Colorado Springs, 80909 www.nbc.edu
NAROPA UNIVERSITY
800-772-6951 2130 Arapahoe Ave. • Boulder, 80302 www.naropa.edu
2026
*REGIS UNIVERSITY
800.388.2366 3333 Regis Blvd. • Denver, 80221 www.regis.edu
ROCKY MOUNTAIN COLLEGE OF ART & DESIGN
303.753.6046 1600 Pierce St. • Lakewood, 80214 www.rmcad.edu
UNITED STATES AIR FORCE ACADEMY (719) 333-2025 2354 Fairchild Dr, Air Force Academy, CO 80840 www.usafa.edu
*UNIVERSITY OF COLORADO BOULDER (CU BOULDER) (303) 492-4636 Boulder, CO 80309 www.colorado.edu
*UNIVERSITY OF COLORADO - COLORADO SPRINGS (UCCS) 719.255.8227 1420 Austin Bluffs Pkwy Colorado Springs, 80918 www.uccs.edu
*UNIVERSITY OF COLORADO DENVER (CU DENVER)
303.315.5969 1201 Larimer St. • Denver, 80204 www.ucdenver.edu
*UNIVERSITY OF DENVER (DU) 303.871.2000 Denver, CO 80210 www.du.edu
1
HIGHER EDUCATION State of Colorado
FOUR YEAR TWO YEAR INSTITUTIONS Cont. INSTITUTIONS: *UNIVERSITY OF NORTHERN COLORADO (UNC)
AIMS COMMUNITY COLLEGE
970.351.1890 501 20th St. • Greeley, 80639 www.unco.edu
970.330.8008 5401 W. 20th St. • Greeley, 80634 all locations: www.aims.edu/locations www.aims.edu
WESTERN COLORADO UNIVERSITY
ARAPAHOE COMMUNITY COLLEGE
970.943.2119 1 Western Way • Gunnison, 81231 www.western.edu
WILLIAM HOWARD TAFT UNIVERSITY (877) 894-8238 1325 S Colorado Blvd Suite B-404, Denver, CO 80222 www.taft.edu
*METROPOLITAN STATE UNIVERSITY OF DENVER
SCHOOL INFORMATION
(303) 556-5740 890 Auraria Pkwy, Denver, CO 80204 www.msudenver.edu
*COLORADO MESA UNIVERSITY 970.248.1020 1100 North Ave, Grand Junction, 81505 www.coloradomesa.edu
COLORADO CHRISTIAN UNIVERSITY (303) 963-3000 8787 W Alameda Ave, Lakewood, CO 80226 www.ccu.edu
303.797.4222 • 5900 S. Santa Fe Dr. Littleton, 80120 303.660-3160 • 4500 Limelight Ave. Castle Rock, 80109 303-734-3853 •10035 Peoria St. Lone Tree, 80134 www.arapahoe.edu
COLORADO NORTHWESTERN COMMUNITY COLLEGE (800) 562-1105 www.cncc.edu
COLORADO MOUNTAIN COLLEGE for all locations: coloradomtn.edu/where-we-are www.coloradomtn.edu
COMMUNITY COLLEGE OF AURORA 303.360.4700 www.ccaurora.edu
COMMUNITY COLLEGE OF DENVER (303) 556-2600 800 Curtis St, Denver, CO 80204 www.ccd.edu
FRONT RANGE COMMUNITY COLLEGE
303.404.5000 3645 W. 112th Ave. • Westminster, 80031 Boulder and Larimer County locations: www.frontrange.edu
2026
LAMAR COMMUNITY COLLEGE
719.336.2248 2401 S Main St. • Lamar, CO 81052 www.lamarcc.edu
MORGAN COMMUNITY COLLEGE
970.542.3100 920 Barlow Rd. • Fort Morgan, 80701 www.morgancc.edu
NORTHEASTERN JUNIOR COLLEGE 970.521.6600 100 College Ave. • Sterling, 80751 www.njc.edu
OTERO COLLEGE
(719) 384-6800 1802 Colorado Ave. • La Junta, 81050 www.otero.edu
PIKES PEAK STATE COLLEGE 719.502.2000 5675 S Academy Blvd. Colorado Springs, 80906 www.pikespeak.edu
PUEBLO COMMUNITY COLLEGE
(719) 549-3200 900 W Orman Ave. • Pueblo, 81004 www.pueblocc.edu
RED ROCKS COMMUNITY COLLEGE
303.914.6600 13300 W 6th Ave. • Lakewood, 80228 www.rrcc.edu
TRINIDAD STATE COLLEGE 719.846.5011 600 Prospect St. • Trinidad, 81082 1011 Main St. • Alamosa, 81101 www.trinidadstate.edu *TOP RANKED IN COLORADO
2
UTILITIES NATURAL GAS: XCEL ENERGY (800) 895-4999
ELECTRICITY: XCEL ENERGY (800) 895-4999
WATER & SEWER:
POPULAR UTILITY COMPANIES
CITY OF BROOMFIELD (855) 442-6900
HOA
NONE
UTILITIES PHONE SERVICE: OOMA
(888) 711-6662 www.ooma.com
VOIPLY (Landline) 844-843-4175 www.voiply.com
PHONE AND INTERNET PROVIDERS: ALLO FIBER
866-481-2556 allocommunications.com
AT&T
REPUBLIC SERVICES
NEXTLIGHT
5280 WASTE SOLUTIONS
VERIZON
ALTITUDE WASTE SOLUTIONS
800.934.6489 xfinity.com
(Longmont) 303.774.4494 mynextlight.com
855.632.3154 verizon.com
VIAERO WIRELESS
(government assistance program) 877-484-2376 www.viaero.com
866-861-6075 att.com
SATELLITE & CABLE:
CENTURY LINK
800-347-3288 directv.com
855.526.1062 centurylink.com
POPULAR UTILITY COMPANIES
XFINITY
HUGHESNET 844-737-2700 hughesnet.com
RISE BROADBAND 855-275-9473 risebroadband.com
SPECTRUM 855-860-9068 spectrum.com
T-MOBILE 844.503.1423 t-mobile.com
VIASAT
(855) 463-9333 viasat.com
DIRECTV
DISH
877-621-0194 dish.com
XFINITY
800.934.6489 xfinity.com
SPECTRUM 855-860-9068 spectrum.com
(720) 884-0300 • info@5280waste.com 5280waste.com
(Westminster, Adams County Unincorporated and Federal Heights) 303.487.1515 • altitudetrash.com
MOUNTAIN HIGH
DISPOSAL (Aurora and Northern Colorado) 970.834.1144 mountainhighdisposal@gmail.com
MOUNTAIN WEST DISPOSAL
(NoCo) 970.460.9842 mountainwestdisposal.com
HBS TRASH SERVICES (South Metro and SoCo) 720.547.8600 hbstrash.com
APEX WASTE SOLUTIONS (Metro and SoCo) Denver / Parker: 303-841-7144 Colorado Springs: 719-999-0500 apexwasteco.com
INFINITE DISPOSAL RESIDENTIAL TRASH: WASTE CONNECTIONS 844-708-7274 wasteconnections.com
WASTE MANAGEMENT 866.909.4458 wm.com
2026
877.692.9729 republicservices.com
(Colorado Springs) 719.999.0500 infinitedisposal.com
CAREFREE DISPOSAL (Colorado Springs) 719.635.9999 carefreedisposal.com
SOCO WASTE (Colorado Springs) 719.357.8855 socowaste.com
UTILITIES RESIDENTIAL TRASH cont: WASTE SYSTEMS INC. (Southern Colorado Springs) 719.390.5097 wastesysinc.com
ENERGY & GAS SERVICE: ATMOS ENERGY 888.286.6700 atmosenergy.com
XCEL ENERGY 800.895.4999 xcelenergy.com
COLORADO NATURAL GAS 800-720-8193 coloradonaturalgas.com
BLACK HILLS ENERGY
POPULAR UTILITY COMPANIES
888-890-5554 blackhillsenergy.com
COLORADO SPRINGS UTILITIES
(719) 448-4800 or (888) 278-6847 www.csu.org
SOLAR PROVIDERS: INDEPENDENT POWER 303-443-0115 solarips.com
NAMASTE SOLAR 303.447.0300 namastesolar.com
APOLLO ENERGY 720.582.8258 harnessoursun.com
COMPLETE ENERGY SOLUTIONS (Arvada) 888.947.8626 densolar.com
SUNRUN
(Denver Metro) 833-324-5886 sunrun.com
CASCADE SOLAR & ELECTRIC 303.928.4123 cascadese.com
ROCKY MOUNTAIN SOLAR SERVICES (Denver Metro) 303-656-0360
GO GREEN ELECTRIC INC 303.731.5198 gogreenelectricinc.com
SMART WAVE SOLAR (Denver Metro) 720-547-3422 smartwavesolar.com
BLUE RAVEN SOLAR 385-220-2516 blueravensolar.com
ENERGY ADVANTAGE ROOFING & SOLAR
720.306.9600 yourenergyadvantage.com/colorado
ION SOLAR
855-208-5625 ionsolar.com/colorado
COMPLETE ENERGY SOLUTIONS (Arvada) 888.947.8626 densolar.com
PHOTON BROTHERS
Service Area: Colorado Front Range Phone: 720-370-3344 Website: photonbrothers.com
ARE SOLAR
Service Area: Denver, Erie, Larkspur / Colorado Denver: 720-706-2773 Erie: 719-212-2999 Larkspur: 719-353-5581 Website: aresolar.com
SANDBOX SOLAR
Service Area: Northern Colorado / Colorado Front Range Phone: 970-673-7733 Email: sales@sandboxsolar.com Website: sandboxsolar.com
SOLAR SIDE UP
Service Area: Denver Metro Phone: 720-740-7085 Website: solarsideup.com
SUNTALK SOLAR
Service Area: Denver Metro and Colorado Springs Main Phone: 303-904-2268 Cell: 720-295-9180 Website: suntalksolar.com
GOLDEN SOLAR
Service Area: Denver Metro Phone: 303-955-6332 Email: gosolar@goldensolar.net Website: goldensolar.net
FLATIRON SOLAR
Service Area: Boulder, Longmont, Northern Colorado Phone: 303-775-4574 Email: info@flatironsolar.com Website: flatironsolar.com
ECOLOGY SOLAR
Service Area: Denver Phone: 720-355-7295 Email: get-solar@ecology.solar Website: ecology.solar
SOLAR POWER PROS 303.797.6527 solarpowerpros.com
2026
First American Title Market Update Broomfield, CO 80020 Single-Family Homes This week the median list price for Broomfield, CO 80020 is $615,000 with the market action index hovering around 37. This is less than last month's market action index of 40. Inventory has increased to 112.
Real-Time Market Profile Median List Price
$615,000
Median Price of New Listings
$631,000
Per Square Foot
$256
Average Days on Market
78
Median Days on Market
49
Price Decreased
58%
Price Increased
1%
Relisted
7%
Inventory
112
Market Narrative
Median Rent
$2,805
Home sales continue to outstrip supply and the Market Action Index has been moving higher for several weeks. This is a Seller’s market so watch for upward pricing pressure in the near future if the trend continues.
Market Action
37
Market Action Index This answers “How’s the Market?” by comparing rate of sales versus inventory. 50
40
Buyer's Market
60
20
80
10
on
100
y
th
37
90
M
a Tod
Las t
0
Seller's Market
70
30
Slight Seller's Advantage
Slight Seller's Advantage
Median List Price $800K
$700K
$600K
$500K Apr 2022
Oct 2022
Apr 2023
Oct 2023
Apr 2024
7-Day Median
Oct 2024
Apr 2025
Oct 2025
Apr 2026
Oct 2026
90-Day Median
Market Segments Each segment below represents approximately 25% of the market ordered by price. Median Price
Sq. Ft.
Lot Size
Beds
Bath
Age
New
Absorbed
DOM
$853,750
3,760
6,500 - 8,000 sqft
4
4
25
0
1
63
$665,000
2,727
6,500 - 8,000 sqft
4
3
44
3
5
42
$577,000
2,236
6,500 - 8,000 sqft
4
3
49
1
4
59
$500,000
1,835
6,500 - 8,000 sqft
3
2
49
0
4
38
Mon Oct 05 2026 First American Title Insurance Company, and the operating divisions thereof, make no express or implied warranty respecting the information presented and assume no responsibility for errors or omissions. First American, the eagle logo, First American Title, and firstam.com are registered trademarks or trademarks of First American Financial Corporation and/or its affiliates. Source: Altos Research LLC ©2021 First American Financial Corporation and/or its affiliates. All rights reserved. | NYSE: FAF Powered by Altos Research, Inc. | www.altos.re | Copyright © 2026 Altos Research, Inc.
1 of 1
COLORADO City Information
Broomfield Included on Website: • City Information • Local Banks • Neighboring Towns and Cities • Employment and Retirement • Demographics • City Hall • Schools • Travel and Passport Facilities • Transportation Modes • Leisure and Activities • Vehicle Permits and Licenses • Social Benefits
CITY INFORMATION
And more...
Scan for information
citydirectory.us
DENVER METRO Broomfield County
BROOMFIELD COUNTY BROOMFIELD COUNTY www.broomfield.org MOTOR VEHICLE: ELECTED OFFICIALS & PUBLIC OFFICES ASSESSOR
www.mvdivision@broomfield.org 303.464.5888 BROOMFIELD
George Di Ciero City & County Building 303-464-5819 One DesCombes Dr., Broomfield, CO 80020 CLERK AND RECORDER Visit Broomfield.org/MotorVehicle or Crystal Clemens 303.438.6332 call 303-464-5888 Jay Yamashita
CORONER
Monica Broncucia-Jordan
303.659.1027
DISTRICT ATTORNEY (17TH JUDICIAL DISTRICT) Brian Mason
SHERIFF
Enea Hempelmann
303.659.7720
BROOMFIELD COUNTY LIBRARIES: www.broomfield.org MAIN LIBRARY
720.887.2300 • library@broomfield.org 303.438.6400 3 Community Park Rd. • Broomfield, 80020
COLORADO COUNTY SERVICES
TREASURER AND PUBLIC TRUSTEE Kim Pfeifer
303.464.5810
BROOMFIELD COUNTY COURTHOUSE & GOVERNMENT CENTER: BROOMFIELD MUNICIPAL COURT
303.464.5020 17 Descombes Dr. • Broomfield, 80020
2026
DENVER METRO Broomfield County
BROOMFIELD COUNTY: Broomfield is a consolidated city and county located in the U.S. state of Colorado. Broomfield has a consolidated government which operates under Article XX, Sections 10-13 of the Constitution of the State of Colorado. Broomfield County’s estimated population in 2026 is about 79,945, reflecting a 0.97% annual growth rate World Population Review. Growth rate: +0.97% compared to 2025. Broomfield is a part of the Denver–Aurora–Lakewood, CO Metropolitan Statistical Area and the Front Range Urban Corridor.
HISTORY
Several railroads figure in the development of this area. The Colorado Central Railroad built a narrow gauge line from Golden in 1873, the Denver, Utah and Pacific Railroad arrived in 1881, and the Denver, Marshall and Boulder Railway built a line through what would become Broomfield in 1886. The Denver, Utah and Pacific was widened to standard gauge in 1889. One of the early names for the area was Zang’s Spur, after the railroad spur serving Adolph Zang’s grain fields. The municipality of Broomfield was incorporated in 1961 in the southeastern corner of Boulder County. While it is unsure how it received its name, most researchers guess it is from the broomcorn grown in the area, a tall sorghum that farmers sold for use as brooms and whisk brooms. Over the next three decades, the city grew through annexations. Eventually, Broomfield spilled into portions of four counties: Adams, Boulder, Jefferson and Weld.
COLORADO COUNTY OVERVIEW
In the 1990s, city leaders felt increasing chagrin with the need to deal with four separate court districts, four different county seats, and four separate county sales tax bases. They began pushing to make Broomfield a consolidated city-county similar to Denver, reasoning that they could provide services more responsively if it had its own county government. They sought an amendment to the Colorado State Constitution to create a new county. The amendment was passed in 1998, after which a three-year transition period followed. On November 15, 2001, Broomfield County became the 64th and smallest county of Colorado. It is the most recently created county in Colorado, and also in the United States as a whole if county equivalents are not included.[10] On February 20, 2021, United Airlines Flight 328 experienced an engine failure after takeoff from Denver International Airport and debris from the engine landed in parts of Broomfield.
GEOGRAPHY
Broomfield is located midway between downtown Denver and Boulder along U.S. Route 36. The elevation in Broomfield ranges from 5,096 to 5,856 feet.[13] At the 2020 United States Census, Broomfield had a total area of 21,471 acres (86.890 km2) including 371 acres (1.503 km2) of water.[5] It is the smallest county by area in Colorado and the 5th smallest in the United States. Broomfield is the second most densely populated county in Colorado behind Denver.
ADJACENT COUNTIES Weld County – northeast Boulder County – northwest
Adams County – southeast
Jefferson County – southwest
2026
DENVER METRO Broomfield County
BROOMFIELD COUNTY Cont... DEMOGRAPHICS For county demographics and information visit the below website and enter your county and state, then click on the map next to total population for full details:
COLORADO COUNTY OVERVIEW
data.census.gov
2026
COLORADO Denver Metro SPORTS:
PARKS & RECREATION:
DENVER BRONCOS BRONCOS PARK POWERED BY COMMONSPIRIT CITY PARK 13655 Broncos Parkway Englewood, CO 80112 (303) 649-9000 denverbroncos.com
COLORADO AVALANCHE BALL ARENA 1000 Chopper Cir Denver, CO 80204 (303) 405-1100 nhl.com/avalanche
MAJOR ATTRACTIONS & ACTIVITIES
COLORADO ROCKIES COORS FIELD 2001 Blake St Denver, CO 80205 (303) 292-0200 mlb.com/rockies
DENVER NUGGETS BALL ARENA 1000 Chopper Circle Denver, CO 80204 (303) 405-1100 nba.com/nuggets
COLORADO RAPIDS DICK’S SPORTING GOODS PARK 6000 Victory Way Commerce City, CO 80022 (303) 825-4625 coloradorapids.com
COLORADO MAMMOTH BALL ARENA 1000 Chopper Circle Denver, CO 80204 (303) 405-1101 coloradomammoth.com
Updated 2026
Location: East of downtown Denver, near E. 17th Ave., York St., Colorado Blvd. and E. 23rd Ave. City Park is Denver’s largest urban park, with more than 300 acres of lawns, lakes, walking paths, athletic fields, tennis courts, event space and major cultural attractions. The park is home to the Denver Zoo and the Denver Museum of Nature & Science, with Ferril Lake, flower gardens, monuments, picnic areas and some of the city’s best skyline-and-mountain views. City Park Golf Course remains a public urban course with views of downtown and the mountains. City Park Jazz continues as a beloved free summer concert series. For 2026, the posted schedule runs Sunday evenings from June 7 through Aug. 9, though staging and seating may shift because the historic bandstand was damaged by fire. Definitely check the current schedule before publishing exact event details.
CIVIC CENTER PARK
Address: 101 14th Ave., Denver, CO 80204 Civic Center Park remains Denver’s grand civic gathering space, known for its history, architecture, public art, gardens, events and central downtown location near the Colorado State Capitol, City and County Building, Denver Art Museum and Denver Central Library. Important update: Civic Center Park is under major construction. Phase One of the Civic Center Next 100 project began in November 2025, with completion scheduled for summer 2027. Limited portions of the park remain open, but large events are affected during construction. Civic Center EATS is still active in 2026, scheduled Wednesdays and Thursdays from mid-May through mid-October on Bannock Street and the Civic Center Park Meadow.
CONFLUENCE PARK
Address: 2250 15th St., Denver, CO 80202
Confluence Park sits where Cherry Creek meets the South Platte River, near Lower Downtown and the REI flagship store. The area is considered part of Denver’s SKYLINE PARK birthplace, with the confluence tied to the Location: Along Arapahoe Street between city’s 1858 origins. Today, it’s a popular 15th and 18th streets in downtown Denver. urban riverfront park for walking, biking, kayaking, relaxing along the water and Skyline Park is downtown Denver’s taking in downtown views. three-block urban park along Arapahoe Street. It is currently being reimagined as a more active, accessible public space for residents, workers, students and visitors. Block 1, between 15th and 16th streets, reopened in 2025 with a Street Soccer USA synthetic turf field for drop-in play when not reserved for programming. Block 2, between 16th and 17th streets, is under construction as of February 2026, with completion anticipated in spring 2027.
1
COLORADO Denver Metro ARTS & ENTERTAINMENT: RED ROCKS PARK AND AMPHITHEATRE 18300 W Alameda Pkwy Morrison, CO 80465 (720) 865-2494 redrocksonline.com
ELITCH GARDENS THEME & WATER PARK 2000 Elitch Cir. Denver, CO 80204 (303) 595-4386 elitchgardens.com
MAJOR ATTRACTIONS & ACTIVITIES
WATER WORLD
8801 N. Pecos Street Federal Heights, CO 80260 (303) 427-7873 waterworldcolorado.com
CASA BONITA (RESTAURANT) 6715 W Colfax Ave Lakewood, CO 80214 casabonitadenver.com
MEOW WOLF DENVER: CONVERGENCE STATION 1338 1st St. Denver, CO 80204 (866) 636-9969 meowwolf.com/visit/denver
COLORADO CONVENTION CENTER
DENVER ART MUSEUM
AMERICAN MUSEUM OF WESTERN ART – THE ANSCHUTZ COLLECTION
SANCTUARIES & ZOOS:
700 14th St Denver, CO 80202 (303) 228-8000 denverconvention.com
1727 Tremont Place Denver, CO 80202 (303) 293-2000 anschutzcollection.org
ARVADA CENTER FOR THE ARTS AND HUMANITIES 6901 Wadsworth Blvd Arvada, CO 80003 (720) 898-7200 arvadacenter.org
DENVER CENTER FOR THE PERFORMING ARTS 1101 13th St Denver, CO 80204 Box Office counter: 1301 13th St. Denver, CO 80204 Ticket line: (303) 893-4100 Admin: (303) 893-4000 Website: denvercenter.org (303) 893-4100 denvercenter.org
DENVER MUSEUM OF DENVER BOTANIC GARDENS NATURE & SCIENCE 1007 York St Denver, CO 80206 (720) 865-3500 botanicgardens.org
2001 Colorado Blvd. Denver, CO 80205 (303) 370-6000 dmns.org
HUDSON GARDENS & EVENT CHILDREN’S MUSEUM OF DENVER AT MARSICO CENTER CAMPUS 6115 S Santa Fe Dr Littleton, CO 80120 (303) 797-8565 hudsongardens.org
100 W. 14th Ave. Pkwy. Denver, Colorado (720) 865-5000 denverartmuseum.org
BUTTERFLY PAVILION (303) 469-5441 6252 W 104th Ave. Westminster, CO 80020 butterflies.org
THE WILD ANIMAL SANCTUARY 2999 County Road 53 Keenesburg, CO 80643 (303) 536-0118 wildanimalsanctuary.org
LUVIN ARMS ANIMAL SANCTUARY 3470 County Road 7 Erie, CO 80516 (720) 515-8577 luvinarms.org
DENVER ZOO CONSERVATION ALLIANCE 2300 N Steele St Denver, CO 80205 (720) 337-1400 denverzoo.org
DOWNTOWN AQUARIUM DENVER 700 Water St Denver, CO 80211 (303) 561-4450 aquariumrestaurants.com downtownaquariumdenver
2121 Children’s Museum Dr. Denver, CO 80211 (303) 433-7444 mychildsmuseum.org
2
COLORADO Denver Metro
Denver The Mile High City
Exciting Things to Do in Denver With sunny skies, fresh mountain air and adventure in every direction, Denver makes it easy to fill a day — or a whole getaway — with city energy and Colorado views. Set exactly one mile above sea level, the Mile High City blends urban culture with quick access to the Rocky Mountains.
MAJOR ATTRACTIONS & ACTIVITIES
Start outside. Denver offers nearly 20,000 acres of parkland, more than 250 urban parks and about 850 miles of paved, off-street trails for walking and biking. Spend the morning in a city park, cruise along Cherry Creek or the South Platte River, then use Denver as your basecamp for hiking, mountain biking, camping, fly-fishing and scenic day trips. The city’s creative scene is just as vibrant. Explore major museums, boutique galleries, public art, live music venues and neighborhood art districts filled with color, food and local flavor. From RiNo’s murals to the Art District on Santa Fe, Denver turns a simple stroll into a tiny cultural treasure hunt. There’s something here for every kind of traveler: romantic rooftops, family-friendly attractions, outdoor adventures, craft food and drink, unforgettable concerts and easy access to the mountains. Whether you’re planning a weekend getaway or a longer Colorado vacation, Denver is ready to be your launchpad. SCAN CODE to explore more outdoor adventures, food and drink, arts and culture, and career opportunities in Denver.
denver.org/things-to-do
3
Selling a home in Colorado.
FIRST AMERICAN TITLE INSURANCE COMPANY marketing.direct@firstam.com www.firstam.com
Table of Contents 03 Count on First American Title 04 Benefits of Using a Professional REALTOR® 05 Key Professionals Involved in Your Transaction 06 Your Escrow Professional 07 Terms You Should Know 08 Planning to Sell 09 Home Staging Tips 10 Ready to Show Checklist 11 The Life of an Escrow 12 The Closing Process 13 Understanding Title Insurance 14 The Importance of Title Insurance 15 Seller Checklist 16 Moving Checklist
2
Count on First American Title. Count on us for service. First American Title’s professionals are proud to provide the title insurance that assures people’s home ownership. Backed by First American Title Insurance Company, your transaction will be expertly completed in accordance with state-specific underwriting standards and state and federal regulatory requirements. Count on us for stability. First American Title is the principal subsidiary of First American Financial Corporation, and one of the largest suppliers of title insurance services in the nation. With roots dating back to 1889, we’ve served families for generations. Count on us for convenience. First American Title has a direct office or agent near you. We also have an extensive network of offices and agents throughout the United States, and internationally. Count on us to meet your needs. First American Financial Corporation offers more than title insurance and escrow services through its subsidiaries. Our subsidiaries also provide property data, title plant records and images, home warranties, property and casualty insurance, and banking, trust and advisory services.
Scan the QR code to learn more about your local First American Title.
3
Benefits of using a professional REALTOR®.
Congratulations on your decision to buy a home! It’s a challenging project, and there are many ways a professional can help. Here are some of the many ways you may benefit from working with a REALTOR®: Many more home choices.
It’s a major investment.
Your REALTOR® has thousands of homes to choose from through the Multiple Listing Service (MLS), so you’re more likely to find the home that’s just right for you and find it quicker. In fact, a majority of the homes for sale are listed by REALTORS® and aren’t available to you unless you are working with a REALTOR®.
You use a professional for your legal, financial and health needs. Why gamble on what may be your biggest investment without a professional at your side?
A number of transactions “fall out.” Unfortunately, it’s true. Some transactions fall apart before closing. An experienced REALTOR® may be able to resolve problems and see your transaction through to a successful closing. Knowledge of new home subdivisions. New home subdivisions will welcome you and your REALTOR®. If you’re interested in buying a new home, take your agent with you on your first visit to each subdivision. Your professional REALTOR® is an important source of information who can supply background on the builder, nearby subdivisions, and the local community.
4
Help with FSBO’s. If you consider a “For Sale By Owner,” take your REALTOR® along to help negotiate the contract. There is less liability. You may have more protection from legal and financial liability, especially as real estate transactions become more complicated. The paperwork. Your experienced REALTOR® will negotiate and prepare the purchase contract for you and assist you throughout the escrow process.
Key professionals involved in your transaction.
REALTOR® A REALTOR® is a licensed real estate agent and a member of the National Association of REALTORS®, a real estate trade association. REALTORS® also belong to their state and local Association of REALTORS®. Real Estate Agent A real estate agent is licensed by the state to represent parties in the transfer of property. Every REALTOR® is a real estate agent, but not every real estate agent has the professional designation of a REALTORS®. Listing Agent A key role of the listing agent or broker is to form a legal relationship with the homeowner to sell the property and place the property in the Multiple Listing Service. Buyer’s Agent A key role of the buyer’s agent or broker is to work with the buyer to locate a suitable property and negotiate a successful home purchase. Multiple Listing Service (MLS) The MLS is a database of properties listed for sale by REALTORS® who are members of the local Association of REALTORS®. Information on an MLS property is available to thousands of REALTORS®. Title Company These are the people who carry out the title search and examination, work with you to eliminate the title exceptions you are not willing to take subject to, and provide the policy of title insurance regarding title to the real property. Escrow Officer An escrow officer leads the facilitation of your escrow, including escrow instructions preparation, document preparation, funds disbursement, and more.
5
Your escrow professional may: pen escrow and, if instructed to do so, O deposit your good faith funds in a separate escrow account. rder a title search to determine ownership and O status of the subject real property. I ssue a preliminary report and begin the process of eliminating the title exceptions you and your lender are not willing to take title subject to. equest payoff information for the seller’s loans, R other liens, homeowner’s association fees, etc. oordinate with the buyer’s lender on the C preparation of the Closing Disclosure (CD). rorate fees, such as real property taxes, per the P contract, and prepare the settlement statement. et separate appointments allowing the seller and S you to sign documents and deposit funds. eview documents ensuring all conditions and R legal requirements are fulfilled; request funds from lender. hen all funds are deposited, record documents W with the County Recorder’s Office to transfer the subject real property to you. fter the recordation is confirmed, close escrow A and disburse\funds, including seller’s proceeds, loan payoffs, etc. repare and send final documents to all P parties involved.
6
Terms you should know. Appraisal An estimate of value of property resulting from analysis of facts about the property; an opinion of value.
Annual Percentage Rate (APR) The borrower’s costs of the loan term expressed as a rate. This is not their interest rate.
Beneficiary The recipient of benefits, often from a deed of trust; usually the lender.
Closing Disclosure (CD) Closing Disclosure form designed to provide disclosures that will be helpful to borrowers in understanding all of the costs of the transaction. This form will be given to the consumer three (3) business days before closing.
Close of Escrow Generally the date the buyer becomes the legal owner and title insurance becomes effective.
Comparable Sales Sales that have similar characteristics as the subject real property, used for analysis in the appraisal. Commonly called “comps.”
Consummation Occurs when the borrower becomes contractually obligated to the creditor on the loan, not, for example, when the borrower becomes contractually obligated to a seller on a real estate transaction. The point in time when a borrower becomes contractually obligated to the creditor on the loan depends on applicable State law. Consummation is not the same as close of escrow or settlement.
Deed of Trust An instrument used in many states in place of a mortgage.
Deed Restrictions Limitations in the deed to a parcel of real property that dictate certain uses that may or may not be made of the real property.
Disbursement Date The date the amounts are to be disbursed to a buyer and seller in a purchase transaction or the date funds are to be paid to the borrower or a third party in a transaction that is not a purchase transaction.
Earnest Money Deposit Down payment made by a purchaser of real property as evidence of good faith; a deposit or partial payment.
Easement A right, privilege or interest limited to a specific purpose that one party has in the land of another.
Hazard Insurance Real estate insurance protecting against fire, some natural causes, vandalism, etc., depending upon the policy. Buyer often adds liability insurance and extended coverage for personal property.
Impounds A trust type of account established by lenders for the accumulation of borrower’s funds to meet periodic payments of taxes, mortgage insurance premiums and/or future insurance policy premiums, required to protect their security.
Legal Description A description of land recognized by law, based on government surveys, spelling out the exact boundaries of the entire parcel of land. It should so thoroughly identify a parcel of land that it cannot be confused with any other.
Lien A form of encumbrance that usually makes a specific parcel of real property the security for the payment of a debt or discharge of an obligation. For example, judgments, taxes, mortgages, deeds of trust.
Loan Estimate (LE) Form designed to provide disclosures that will be helpful to borrowers in understanding the key features, costs and risks of the mortgage loan for which they are applying. Initial disclosure to be given to the borrower three (3) business days after application.
Mortgage The instrument by which real property is pledged as security for repayment of a loan.
PITI A payment that includes principal, interest, taxes, and Insurance.
Power of Attorney A written instrument whereby a principal gives authority to an agent. The agent acting under such a grant is sometimes called an “Attorney-in-Fact.”
Recording Filing documents affecting real property with the appropriate government agency as a matter of public record.
Settlement statement Provides a complete breakdown of costs involved in a real estate transaction.
TRID TILA-RESPA Integrated Disclosures
Endorsement As to a title insurance policy, a rider or attachment forming a part of the insurance policy expanding or limiting coverage. 7
Planning to sell. A homeowner’s checklist to prepare your home.
So you’re planning to sell your home. You and your real estate broker have decided on a price, based on current market values, but your home may sell faster and bring a higher price if it shows well. Potential buyers will get the best impression if your home is clean, neat, uncluttered, in good repair, light, airy, fragrant, and quiet. This checklist will help you get your home ready to show. Clean everything in you home.
Unclutter your home before you show it.
Cleanliness signals to a buyer that the home has been well cared for and is most likely in good repair. A messy or dirty home will cause prospective buyers to notice every flaw.
Have a garage sale. Empty closets. Throw away what you can’t sell. The less “stuff” in and around a home, the roomier it will seem.
Let the fresh air in. Get rid of odors that may be unfamiliar or unpleasant. People are most often offended by odors from tobacco, pets, cooking, and musty or sour laundry. Fresh flowers and potpourri can be used to your advantage. Other smells that attract positive attention include fresh baked bread and cinnamon.
Fix anything that is broken. This includes plumbing, electrical systems, switches, windows, TV antennas, screens, doors, and fences; if it can’t be fixed, replace it or get rid of it (no window screens are better than broken ones). A buyer will make a much lower offer if your house is in disrepair and will probably still insist that everything be fixed before taking occupancy. You’re better off if you leave potential buyers no reason to offer less than you are asking.
Painting your home. There’s nothing that improves the value of a home for a lower cost than a fresh coat of paint. And it’s so often easier to paint a room than it is to scrub it. Stick with neutral colors - off-white is the safest. Be sure to avoid black, violet, and pink.
Keep the noise down. Silence is a restful sound that offends no one. Turn off the TV and radio. Soft instrumental music is fine but avoid vocals. If necessary, close the windows to eliminate any street noise.
8
Send your pets away. Send them away or secure them away from the house when prospective buyers are coming. You never know if people will be annoyed or intimidated by your pets or even allergic to them. And you never want a prospective buyer to have to avoid animal droppings.
Send the kids to Grandma’s. Send them to Grandma’s or take them on a walk around the block. Children can be noisy and distracting to someone interested in looking at a home.
Make a great impression. “Home staging is no longer optional in this real estate market, it’s a must.” - Barbara Corcoran
Staging Tips Grab them from the Curb
Consider Replacing Furnishings
Don’t Forget the Floors
Make It Sparkle
Invest in New Artwork
Spring for New Light Fixtures
Pay Attention to Color and Light
Make Repairs
Depersonalize
Apply a Fresh Coat of Paint
Top 5 Dos
Top 5 Don’ts
Spruce Up Your Curb Appeal
Don’t Take it Personally
Clean, Clean, Clean
Don’t Do Major Renovations
Declutter
Don’t Think the House Will Sell Itself
Neutralize
Don’t Run Out and Purchase All
Remove All Big Clunky Furniture
New Furniture Don’t Be Afraid to Ask For Help
9
This checklist will help you get your home ready to show.
Exterior
Put Light Bulbs In
Bathroom (continued)
Clean around service areas/trash cans Haul away rubbish Straighten woodpile Repair leaky faucets Clean up pet droppings Paint or varnish doors Polish door hardware Make sure doorbell/knocker works Paint or replace street numbers on house Make sure septic tank is odor free Clean oil stains from driveway/street Patch/reseal driveway if necessary
Porch lights Carport Garage
Clean tile grout Make sure toilet flushes properly – replace mechanism if necessary Clean exhaust fan/heater – replace if broken or noisy
Replace, repair, and/or paint any damages:
Plaster Wood siding Trim Rain gutters Shutters Doors Window frames Glazing Screens Hardware Fences/gates Outdoor lighting Landscaping
Mow/edge lawn regularly Aerate/feed lawn Overseed bare spots in lawn Water lawn regularly Remove/replace dead plants Prune overgrown/diseased/damaged shrubs Prune or remove shrubs/trees blocking view from windows (unless view is undesirable) Stake up any sagging trees/shrubs Keep flower beds free of weeds Trim around base of trees/walls/fences Repair or remove any broken or damaged landscape accessories such as:
Fences Walls gazebos Fountains Trellises Planters Other Replace any broken stepping stones Adjust any sprinkler system; repair any broken/leaky heads Install fences or shrubs to hide any unsightly views
Clean/Wash Siding Windows Screen Outdoor BBQ AC unit Pool/Spa
10
Closets Keep closets clean and free of clutter Throw out or pack away non-essentials Adjust/repair sliding doors Lubricate sliding door hardware Paint, if needed
All Rooms, Clean especially around: Doors Windows Light switches Baseboards Chair rails Wash lace curtains and have draperies cleaned if necessary Remove or pull back dark curtains Lubricate window slides (soap for wood silicon or a candle stump for metal) Make sure doors open smoothly Clean ceiling light fixtures Check for cobwebs in all corners Fix any scratches in wooden floors Replace worn/broken flooring Remove or replace worn carpet Use area rugs where needed Empty wastebaskets Make the beds Fluff the pillows
Kitchen Keep dishes and food out of sight Clean appliances Clean range hood, including light bulbs Clean behind appliances Keep floor clean Clean light fixture Make sure all electrical outlets work Eliminate cooking odors Deodorize garbage disposal, dishwasher, and refrigerator Repair faucets Put fresh shelf paper in cabinets Organize cupboards Clean out under sink Replace garbage disposal gasket to reduce noise
Bathroom, Keep them spotlessly clean: Shine mirrors Keep wastebaskets empty and clean Clean out cabinets and remove nonessentials Keep fresh, clean towels on towel racks Clean shower door – if sliding door, keep track well lubricated Remove soap residue, mildew and mold from sink/tub/shower Remove stains from porcelain sink tub toilet Replace torn/moldy shower curtain
Garage/Carport/Shed Install 100-watt light bulb Keep area clean/uncluttered Hang up/put away tools Clear away any cobwebs Remove oil/paint stains from floor Adjust tension rod to eliminate sag from overhead garage door Lubricate/adjust/repair garage door opener Paint if needed
Laundry Area Clean out area behind washer/dryer Eliminate any mildew odors
Basement Eliminate any signs of dampness Check for and eliminate cracks
Heating/Air Conditioning Unit Vacuum Replace filter Clean intake vent Remove any stored items
ake sure the temperature in your home is M comfortable – keep it cooler in the summer and warmer in the winter. If it’s cooler outside and you have a fireplace, a nice fire will make your home seem cozy and inviting. Provide an exhaustive written list of the features of your home. now the distance to schools and K shopping centers. efer any prospect that calls or comes by to your R broker for pre-screening and pre-qualification as well as for your own safety. ell your real estate agent all about the home-good T and bad. Let the professional decide how to handle negatives and features or highlight the positives.
The life of an escrow. The Buyer
The Seller
The Escrow Officer
The Lender
Chooses a Real Estate Agent
Chooses a Real Estate Agent
Upon receipt of order and earnest money deposit, orders title examination.
Gets pre-approval letter from Lender and provides to Real Estate Agent.
Accepts Buyer’s offer to purchase.
Accepts Buyer’s application and begins the qualification process. Provides Buyer with Loan Estimate.
Makes offer to purchase. Upon acceptance, opens escrow and deposits earnest money.
Finalizes loan application with Lender. Receives a Loan Estimate from Lender.
Completes and returns opening package from First American Title, including information such as forwarding address, payoff lender contact information and loan numbers.
Orders any work for inspections and/or repairs to be done as required by the purchase agreement.
Completes and returns opening package from First American Title.
Schedules inspections and evaluates findings. Reviews title commitment/preliminary report.
Escrow officer or real estate agent contacts the seller to schedule signing appointment.
Documents are recorded and all proceeds from sale are received. Provides all requested paperwork to Lender (bank statements, tax returns, etc.) All invoices and final approvals should be to the lender no later than 10 days prior to loan consummation.
Lender (or Escrow Officer) prepares CD and delivers to Buyer at least 3 days prior to loan consummation.
Escrow officer or real estate agent contacts the buyer to schedule signing appointment.
Buyer consummates loan, executes settlement documents, & deposits funds via wire transfer.
Documents are recorded and the keys are delivered!
Requests necessary information from buyers and sellers via opening packages.
Reviews title commitment/ preliminary report.
Upon receipt of opening packages, orders demands for payoffs. Contacts buyer or seller when additional information is required for the title commitment/ preliminary report.
All demands, invoices, and fees must be collected and sent to lender at least 10 days prior to loan consummation.
Coordinates with lender on the preparation of the CD.
Reviews all documents, demands, and instructions and prepares settlement statements and any other required documents.
Schedules signing appointment and informs buyer of funds due at settlement.
Orders and reviews title commitment / preliminary report, property appraisal, credit report, employment and funds verification.
Collects information such as title commitment / preliminary report, appraisal, credit report, employment and funds verification. Reviews and requests additional information for final loan approval.
Underwriting reviews loan package for approval.
Coordinates with Escrow Officer on the preparation of the Closing Disclosure, which is delivered to Buyer at least 3 days prior to loan consummation.
Delivers loan documents to escrow.
Upon review of signed loan documents, authorizes loan funding.
Once loan is consummated, sends funding package to lender for review.
Prepares recording instructions and submits docs for recording.
Documents are recorded and funds are disbursed. Issues final settlement statement.
11
The Closing Process We know the home buying process can be confusing. Let’s walk through a brief explanation of what happens after you sign the contract. he signed contract and earnest money are delivered to the settlement agent (note: the title company often acts as T the settlement agent). Now the title order begins and information such as taxes, loan payoffs, lien search, and other information is collected. he title search will determine the legal owner of the property and any outstanding liens and/or assessments. T This search is critical to making sure the property will transfer legally to the buyer. Over the next few weeks the following will occur: inspections, repairs (if necessary), payoffs obtained from current lenders, HOA’s, lienholders, ect, and loan document preparation. It is important the buyers and sellers are responsive to requests for paperwork and information. Once the invoices, payoffs, statements, and loan documents are received, the settlement statement is prepared. This document includes the closing calculations and is used to inform the buyer and seller of their bottom line figures. The closing paperwork must then be signed by the buyer and the seller. This will include documents such as the deed, settlement statement, loan documents (if applicable), and others. ll payees, including the seller, payoff lenders, real estate professionals, and others are paid according to the A settlement statement. The final documents, including the deed and loan instrument, are sent to the county recorder’s office for recordation. After recording, the deed will be sent to the buyer. The title insurance policy is sent to the buyer and the lender.
12
Understanding title insurance. The title industry and title insurance in brief.
Prior to the development of the title industry in the late 1800s, a home-buyer received a grantor’s warranty, attorney’s title opinion, or abstractor’s certificate as assurance of home ownership. The buyer relied on the financial integrity of the grantor, attorney, or abstractor for protection. Today, homebuyers look primarily to title insurance to provide this protection. Title insurance companies are regulated by state statute. They are required to post financial guarantees to ensure that any claims will be paid in a timely fashion. They also must maintain their own “title plants” which house duplicates of recorded deeds, mortgages, plats, and other pertinent county property records.
What is title insurance? Title insurance provides coverage for certain losses due to defects in the title that, for the most part, occurred prior to your ownership. Title insurance protects against defects such as prior fraud or forgery that might go undetected until after closing and possibly jeopardize your ownership and investment.
Why is title insurance needed? Title insurance insures buyers against the risk that they did not acquire marketable title from the seller. It is primarily designed to reduce risk or loss caused by defects in title from the past. A loan policy of title insurance protects the interest of the mortgage lender, while an owner’s policy protects the equity of you, the buyer, for as long as you or your heirs (in certain policies) own the real property.
When is the premium due? You pay for your owner’s title insurance policy only once, at the close of escrow. Who pays for the owner’s policy and loan policy varies depending on local customs.
13
How title insurance differs. Unlike other forms of insurance, title insurance emphasizes loss prevention for the insured. Title professionals perform labor-intensive work to find and address title issues that could threaten your homeownership. This upfront analysis gives you, as a policy holder, the peace of mind that your title risk has been effectively reduced. In contrast, insurance based on loss assumption (such as auto or property and casualty insurance) requires little upfront work because claims cannot be predicted or prevented, and premium funds are needed only in the event of an accident or other covered issue. These types of insurance also require annual coverage payments, unlike title insurance which is paid for only once upon the purchase of your home or establishment of a new mortgage.
The importance of title protection. There are many title issues that could cause you to lose your real property or your mortgage investment. Even the most careful search of public records may not disclose the most dangerous threat: hidden risks. These issues may not be uncovered until years later. Without title insurance from a reputable and financially solvent company, the ownership of your home could be jeopardized.
Here are some examples of title issues that may occur: eeds by persons supposedly single, D but secretly married. Deeds in lieu of foreclosure given under duress arital rights of spouse purportedly, but not M legally, divorced. Impersonation of the true owner of the land. Deeds by minors. Deeds by persons of unsound mind. Deeds to or from defunct corporations. Defective acknowledgments by notaries. Duress in execution of instruments. Erroneous reports furnished by tax officials. Forged deeds, releases, etc. Mistakes in recording legal documents. Surviving children omitted from will. dministration of estate of persons absent but A not deceased. Birth or adoption of children after date of will. laims of creditors against real property sold by heirs C or devisees. eed of community property recited to be D separate property. Deeds by foreign parties.
14
Seller’s Checklist
Prior to Closing: Provide title company with current loan information so a payoff statement can be ordered from your lender. You will need to provide your Social Security Number and you may be required to sign a form authorizing your lender to provide the payoff to First American Title. Complete a Confidential Information Statement if you have a common surname. Provide documentation of any change in marital status (divorce, marriage, death) during current ownership. If the property is inherited we will need a copy of the probated will. Have your Power of Attorney approved prior to closing in the event you will not be present to sign documents. Required at Closing: Driver’s License
Social Security Number
ring extra house keys, garage door openers, warranties or operational manuals for appliances (heating, AC, stove, etc.) B or let your real estate professional know where in the house they are located. Avoiding Closing Delays: Lenders and title insurers may require single owners who have married to have their spouse sign paperwork or a deed at closing. Discuss this with your escrow officer early in the transaction. The Confidential Information Statement should be completed and returned promptly. It will help clarify the identity of the actual person or persons named on judgments in the title search. After Closing: Cancel your homeowner’s insurance if you are moving from the property at closing. If you are remaining at the property after closing, you should notify your agent of this change. Make sure your lender has your forwarding address. The lender will refund monies left in your escrow/impound account and send final paperwork regarding the paid loan. Keep your final settlement statement with tax documents. You will need it when filing taxes.
15
Moving Address Change Checklist Here’s a list of people, businesses and organizations who will need to know you’ve moved to a new location.
16
The Essentials:
Service Providers:
Request a “Change of Address” form at a USPS post office
Cable company
Friends and family
Phone company
Financial Institutions: Banks and credit unions Credit card companies (including department store cards) Lenders (mortgage, home equity, auto, student loan) Insurance companies (health, renters, auto, home, medical, dental, disability, life) Retirement (pension plans, 401K, retirement accounts, Social Security, Veterans Affairs) Investments (investment agencies and brokers)
Utilities: Phone services (cellular, land line) Electric Heating Oils (gas, oil, propane or other fuels) Water (water delivery, water treatment) Sewer Waste Disposal Internet (land line, wi-fi and satellite) Television (cable or satellite TV)
Government Offices: Department of Motor Vehicles IRS Passport Office Veteran Affairs Unemployment Office (if you are currently receiving unemployment benefits)
Jobs:
Housecleaning services Delivery services Accountants Childcare (day-care center, baby sitters) Lawn care service Veterinarian (including pet groomer, pet sitters, and microchip service) Pool services Lawyers
Automobile: Auto insurers (insurance agencies and brokers) Auto lenders (car dealership, bank or loan place) Department of Motor Vehicles (changing your vehicle registration) Membership clubs (AAA or similar) Parking permits Warranty (if a car warranty is still in place) Toll pass (Fast Lane, EZ Pass)
Memberships: House of worship (churches, synagogues, mosques) Health clubs Community groups (PTA, neighborhood associations, civic clubs) Children’s extracurricular activities (dance classes, music lessons, sport clubs) Social clubs, community centers
Subscriptions:
Notify the Human Resources department
Newspapers
Update your personal marketing materials (business cards, websites, resumes)
Magazines (The USPS will only forward magazine subscriptions for two months)
Employment agencies (temp agencies and recruiters)
Movie subscriptions (streaming services or other)
Professional Memberships (licensing and certification boards)
Book and music clubs
Past employers (for W-2)
Health:
Mail order houses
Other: Air miles reward program
Physicians (doctors, dentists, optometrists, etc.)
Register to vote!
Pharmacies
Update personal websites
Health insurers (HMOs, DMOs, agencies and brokers)
Children’s schools
17
First American Title Insurance Company, and the operating divisions thereof, make no express or implied warranty respecting the information presented and assume no responsibility for errors or omissions. First American, the eagle logo, First American Title, and firstam.com are registered trademarks or trademarks of First American Financial Corporation and/or its affiliates.
24DID1518BK1_CP-CO_07 24DID1518BK1_CP-CO_06
©2024 First American Financial Corporation and/or its affiliates. All rights reserved. NYSE: FAF