Transforming Greater Melbourne from a consumer to a producer by 2030
“Nowadays we are in a time where the idea of poetry is again important, because all information is accessible at anytime, so information is no longer interesting. It is more about deciphering something. The door opener for allowing people to decipher something is beauty. It’s not about direct communication, it’s more about poetic communication, and poetry is always about encrypting and deciphering information.”
Joachim Sauter, Professor for New Media Art and Design at the Universität der Künste in Berlin, Founder of ART+COM, Co-founder of Chaos Computer Club
This document was printed using vegetable based inks on FSC accredited paper using best forestry practices. Contact ushello@findinginfinity.com
We proudly acknowledge the people of the Kulin Nation as the owners of the lands on which A New Normal is based, and pay our respect to their Elders past, present and emerging.
We recognise the deep connection of First Peoples to Country and value their contribution to caring for, and managing the land, water, natural and built landscapes and their profound knowledge systems.
We commit to developing reciprocal relationships with our First peoples and as a cornerstone in defining A New Normal for our City.
We also extend our acknowledgement to all Aboriginal and Torres Strait Islander communities and their rich culture, and pays respect to their Elders past, present and emerging.
This strategy and implementation plan for the future of Greater Melbourne was prepared by...
In collaboration with...
special thanks to...
Esther Stewart
Architect Brew Koch
Esther Stewart
Architect Brew Koch
Monash Urban Lab
Esther Stewart
Architect Brew Koch
Monash Urban Lab
With
Executive Summary
This is an updated proposal for Greater Melbourne, building on the original A New Normal project launched in 2021. It expands upon the initial vision and has the potential to:
• Secure our energy supply, water supply & movement network
• Create over 90,600 jobs
• Create a sustainable revenue in less than 10 years
• Position Melbourne as a world leader in economic and environmental transition
The purpose of this document is to bring the private sector, the public sector and the people of Melbourne together in response to increasingly intertwined challenges including the social and economic aftermath of COVID-19, rising global tensions and the ongoing climate emergency. It proposes a vision of transformation for Melbourne to become a self-sufficient and more resilient city.
This report focuses on currently available technology, and can provide a rapid stimulus opportunity. We can transform Melbourne to operate on resources that will never run out - and profit from the transition.
According to the United Nations global carbon emissions must halve by 2030. But national governments — including Australia’s — are struggling to respond in time.
It is now becoming clearer that the transition will not be led by nations. It will be led by cities.
Cities are where the majority of earth’s population live, and are responsible for the majority of global carbon emissions. A city like Melbourne — already one of the wealthiest and most liveable in the world — is perfectly placed to lead the transition by transforming from a consumer to a producer by 2030.
Every year, Greater Melbourne burns enough coal to fill the Royal Exhibition Buildingss 225 times, enough oil to fill it 90 times over, and enough natural gas to fill it 70 times. It produces enough waste to fill Royal Exhibition Buildings 110 times a year, and consumes enough water to fill it 2,250 times.
12 Key Profitable Initiatives Required to Transform Melbourne By 2030:
A New Normal details the opportunity and benefits associated with Melbourne making this transition happen by 2030. It identifies 12 key initiatives that if implemented, can transform Greater Melbourne into a self-sufficient city by 2030.
Let’s not delude ourselves — these shifts are seismic. Fossil fuels and the internal combustion engine have underpinned the global economy for 200 years. So, how do we do it? We electrify transport and buildings. We drastically improve the efficiency of our buildings. We
and power our cities with
We
creating an
A New Normal has seen eight of its fifteen architectural pilot projects approved, securing around $200 million in funding. Of these, three have already been built, while five are in construction or planning. This latest report is an update to the ongoing initiative and confirms that the proposed projects for transforming Melbourne are not only financially viable but also based on proven, scalable technologies already implemented in cities worldwide. These ready-to-deploy solutions show that rapid and profitable transformation is both possible and actively progressing.
This opportunity could position Melbourne as a world leader on such an important transition. The total required investment is estimated to be ~$140 billion. This is equivalent to ~3.3% of Australia’s total superannuation pool ($4.2, trillion as of December 20241). But with the opportunity to generate ~$16 billion annual income, the transformation can pay for itself in less than a decade. In consideration of forecast recession it is important to recognise the employment opportunities this transition offers.
It is estimated to generate over 90,600 annual jobs in construction and installation to 2030, as well as over 43,400 ongoing jobs in operations. This is an opportunity to stimulate the economy whilst creating lasting, meaningful change.Implementing all of these initiatives requires a lot of change in a very short period of time, and humans don’t instinctively like change. It is possible to make this evolution easier by connecting solutions with culture.
An implementation plan for rapid adoption of the solutions across Greater Melbourne has been developed. The approach is to integrate the physical infrastructure that makes our city work with the cultural infrastructure that enables it to thrive. It is designed to familiarise the public with the solutions, while providing our political leaders with much-needed public support helping to de-risk any uncertainty around the transformation.
A New Normal Melbourne: 2021
It all began with a dinner in early 2021 and a simple yet powerful question: What could the future of Melbourne look like? From that moment, the project set out to spark imagination and invite poetic thinking—using small, tangible interventions as the foundation for envisioning large-scale, transformative change.
A New Normal officially launched during Melbourne Design Week 2021, as a collaborative initiative between 17 leading design and architecture practices:
• Clare Cousins Architects
• Dreamer Lab
• Edition Office
• Fender Katsalidis
• Fieldwork
• Foolscap
• Greenaway
• Greenshoot
• Grimshaw
• Ha
• Hassell
• John Wardle Architects
• Kennedy Nolan
• NMBW
• Openwork
• Six Degrees
• WOWOWA
This ambitious project was a citywide invitation—to policymakers, investors, and residents alike—to explore a vision for Melbourne as a self-sufficient, circular economy by 2030. Through deep collaboration, the participating studios proposed the spatial, technological, and financial frameworks required to create a city powered entirely by renewable energy, with an endless water supply, no landfill waste, and systems capable of operating autonomously.
Each team developed prototypes and speculative projects designed to attract real-world investment, with the ultimate aim of constructing permanent, full-scale demonstrators. These pilot projects would serve not just as proofs of concept, but as templates for broader replication and scalable implementation.
The ideas born from this collaboration were compiled into a comprehensive report—outlining project foundations, investment requirements, and pathways for scaling and a launch at Melbourne Design Week 2021 of temporary installations, offering the public a first-hand experience of what a new, sustainable normal could feel like.
The overall strategy outlined in A New Normal projected a capital investment of $100 billion, with the potential to generate over 81,000 new construction jobs and 43,000 ongoing roles by 2030.
Since its launch in 2021, A New Normal has led to eight of the fifteen architectural pilot projects being approved, securing approximately $200 million in funding. These projects are now at various stages of development and will be detailed in the following pages.
These pilot initiatives mark a significant step forward for the city of Melbourne—providing tangible responses to critical questions and offering real-world examples of how targeted policy changes can foster a profitable, regenerative, and costeffective urban future, both locally and beyond.
Melbourne Design Week 2021
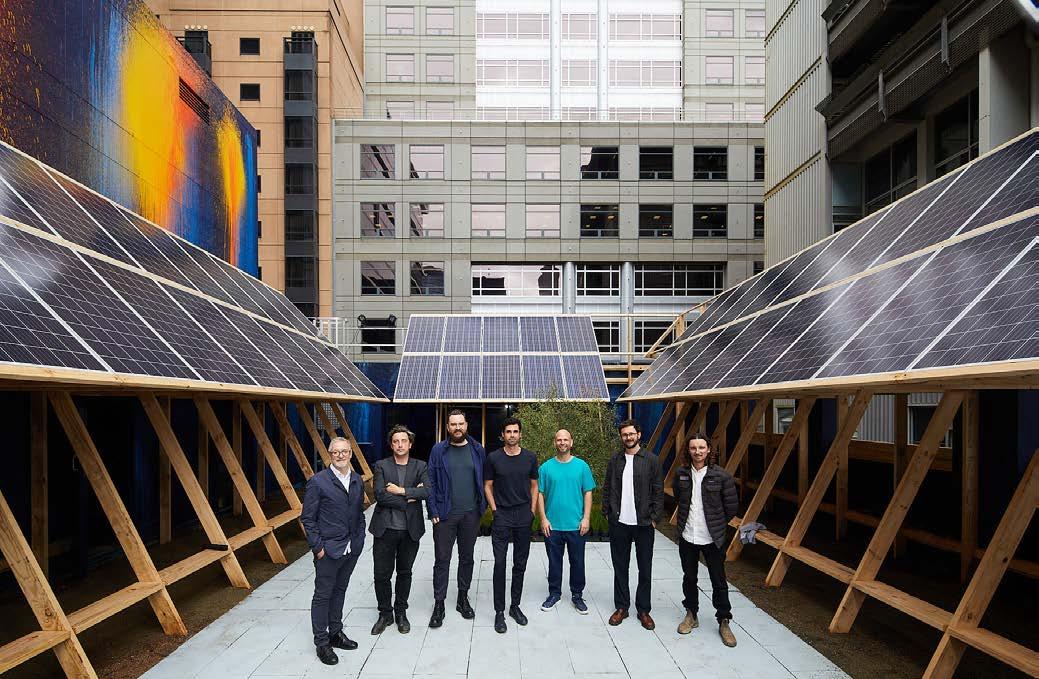
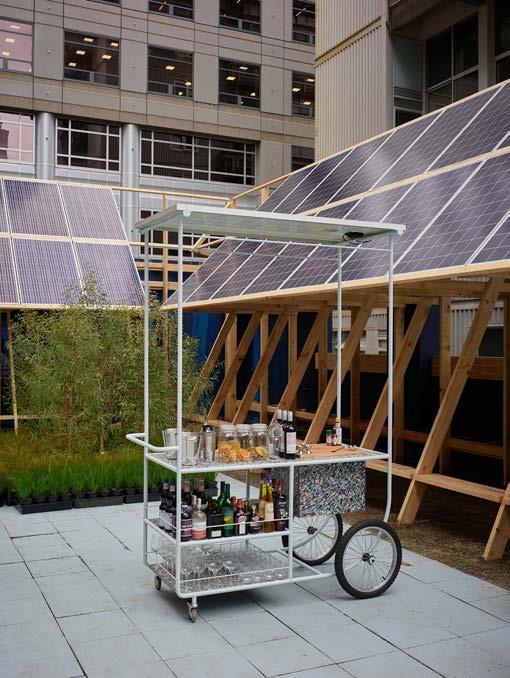
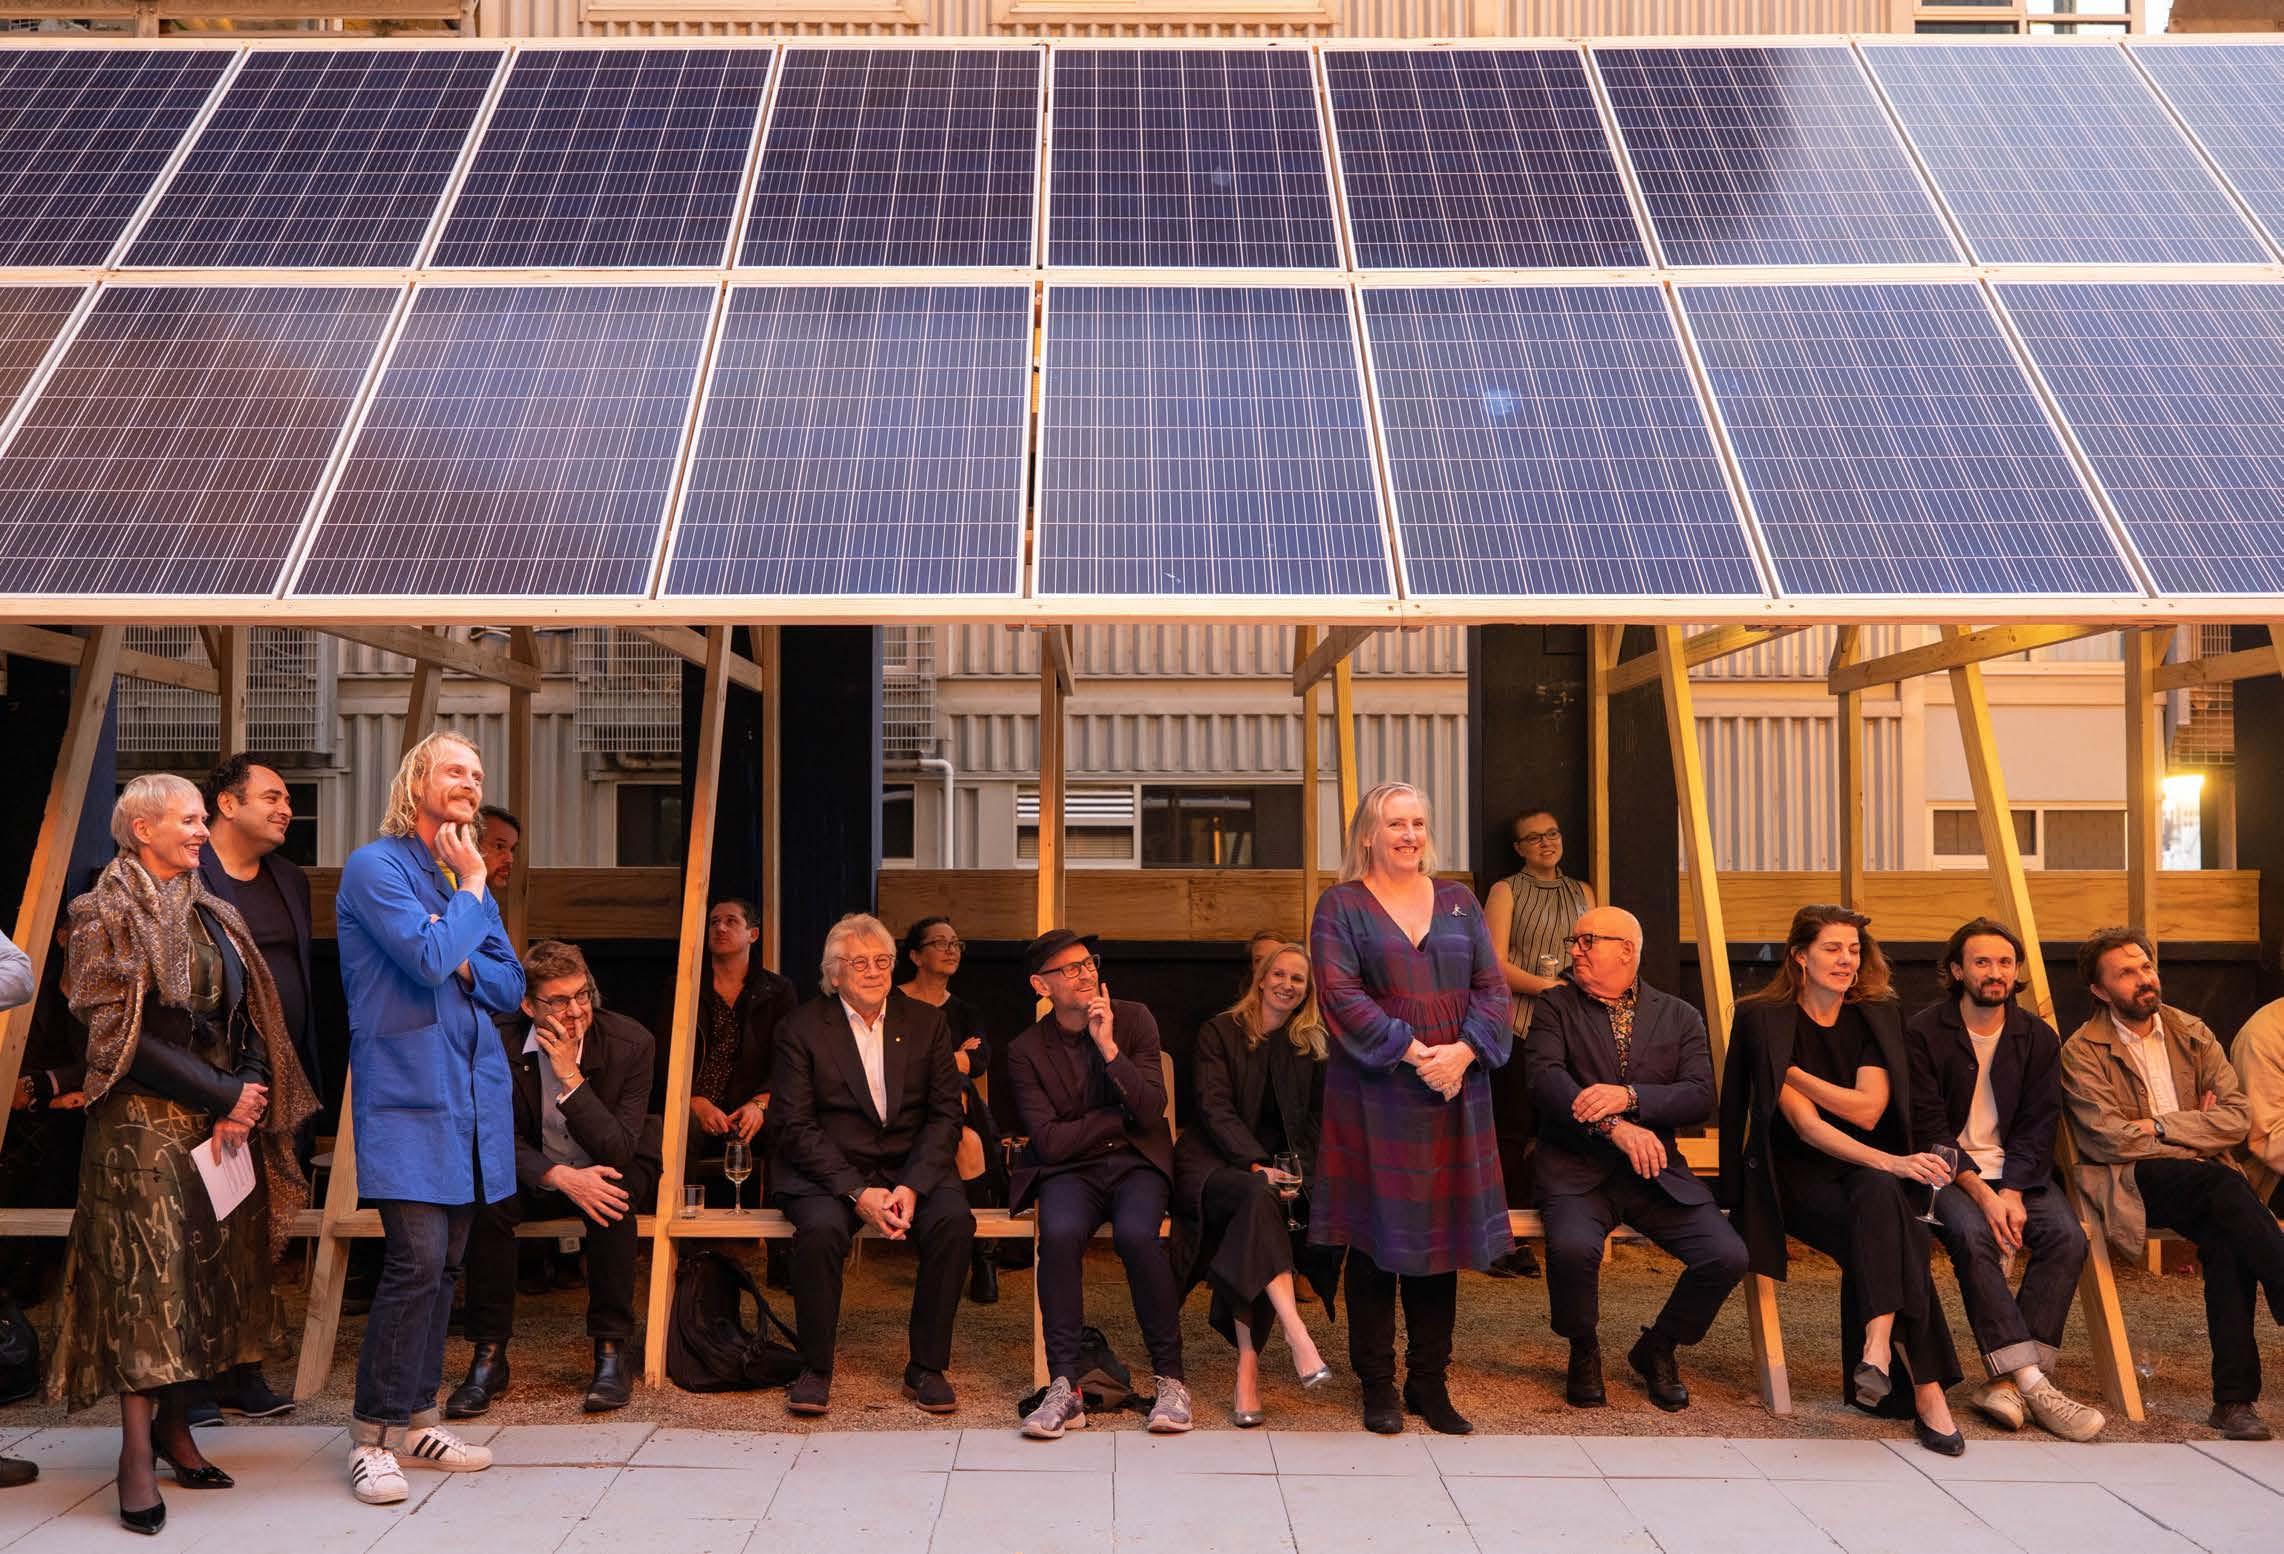
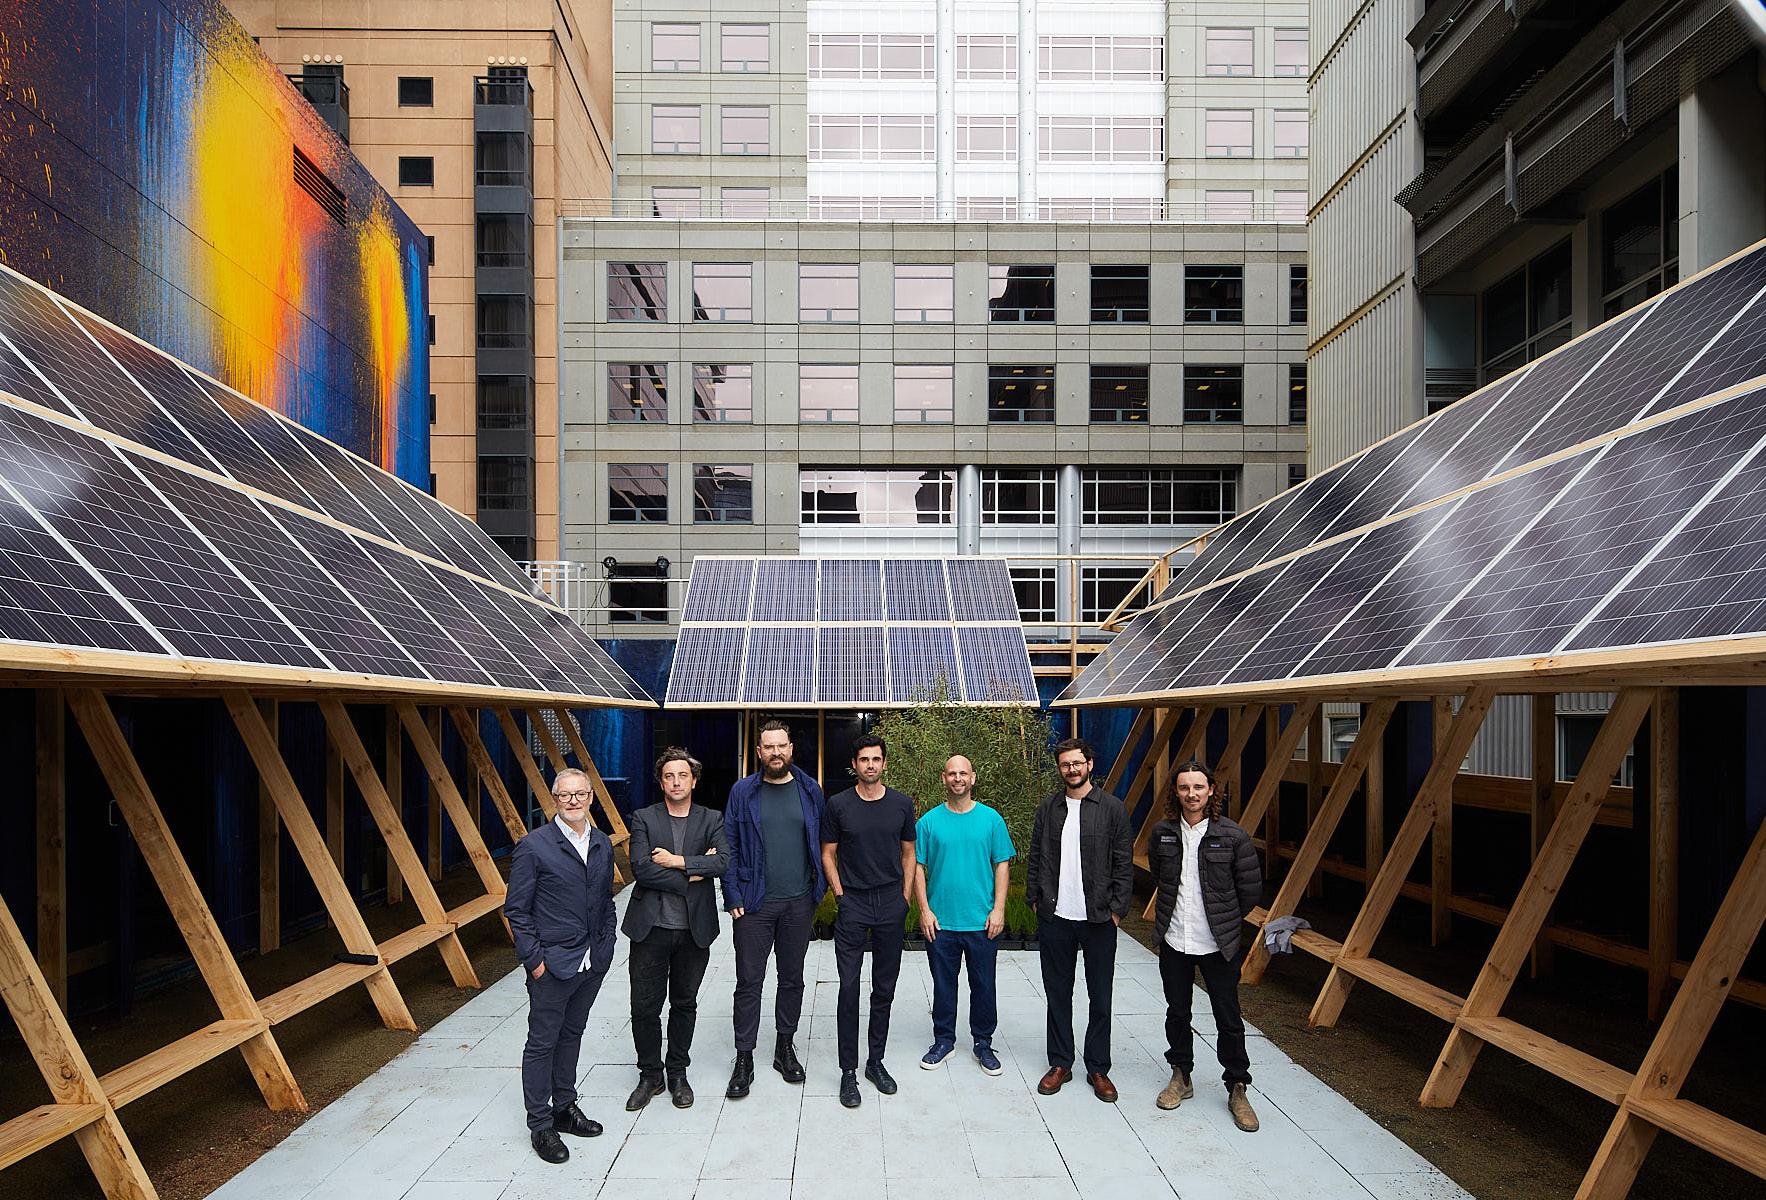
A New Normal debuted during Melbourne Design Week 2021 on the rooftop of 130 Little Collins Street, presenting a bold and imaginative showcase of fifteen proposals from some of Melbourne’s leading architects and designers.
From a sewage treatment plant that doubles as a nightclub to community hubs reimagined from multi-storey car parks, the concepts demonstrated how sustainable technologies can radically improve the city’s health, liveability, and resilience.
The launch featured a series of installations, programs, and talks by some of Australia’s foremost architectural practices, all responding to the Design Week theme: ‘Design the World You Want’.
Press Coverage
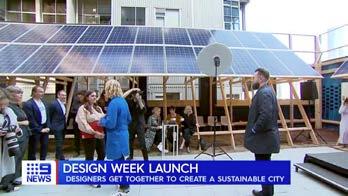
The press coverage for the A New Normal debut and its pilot projects was extensive, overwhelmingly positive and across various media platforms internationally, allowing for eight of the fifteen pilot projects to obtain funding through private and public investment.
Sanders Place Richmond, Victoria
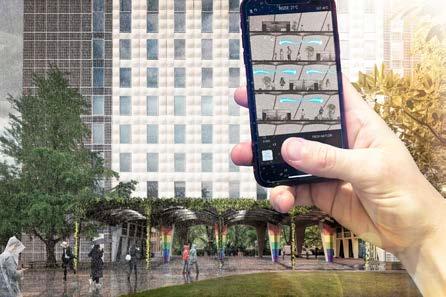
Melbourne has more than 40,000 commercial buildings, all of which need to be retrofit to improve energy efficiency, water use and occupant wellbeing. We chose to start with just one.
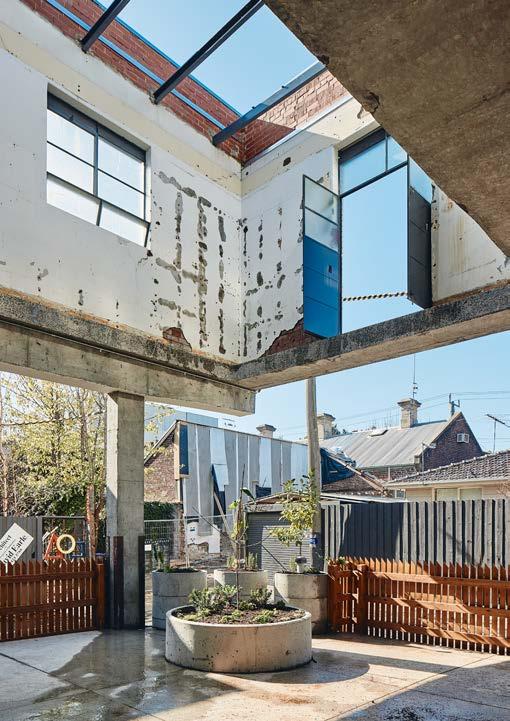
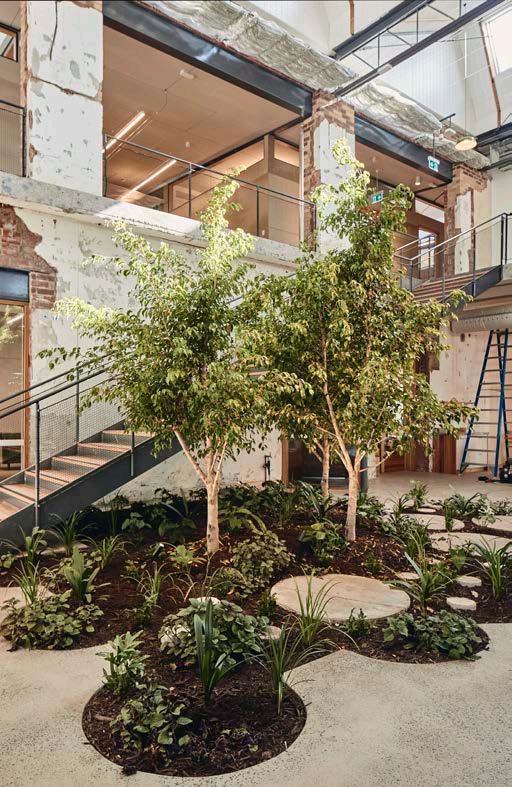
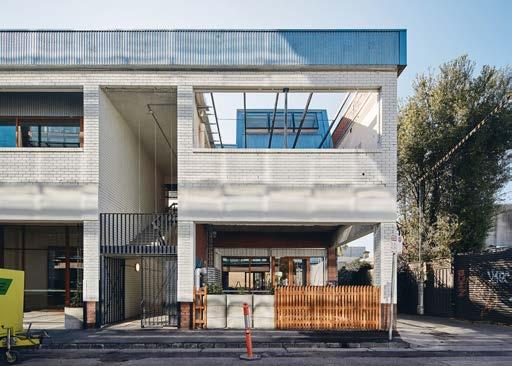
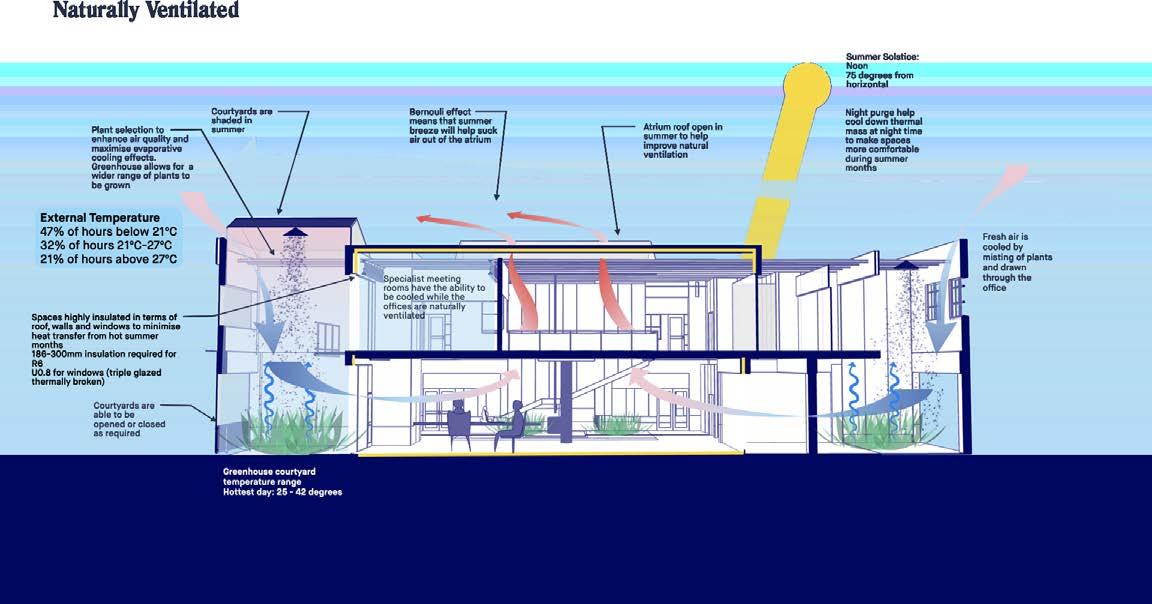
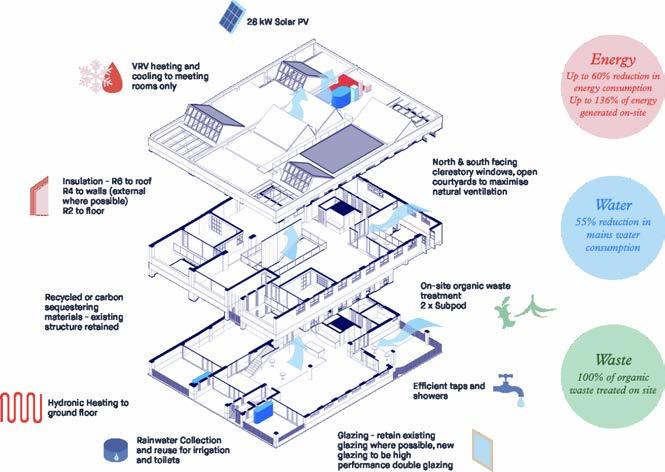
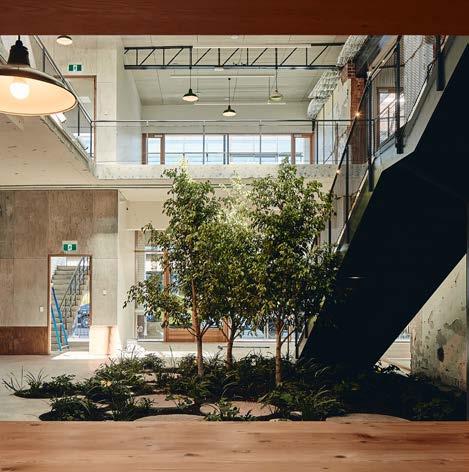
Sanders Place is a thoughtful transformation of a two-storey brick warehouse. While the original brick façade remains, the interior has been reimagined as a bright, open, and uplifting workspace. The addition of an atrium and an exterior courtyard brings in light and air, creating a sense of space and connection to the outdoors.
More than a functional upgrade, this retrofit is a statement about what future-forward, environmentally responsible office design can look like. It embraces biophilic principles, prioritizing natural light, passive cooling, and a welcoming atmosphere—offering a healthier, more inspiring place to work.
Stage: Completed July 2023
Architect: NMBW
Landscape Architect: Openwork
Builder: Never Stop Group
Environmental Design: Finding Infinity
Client: Tripple
Completed Projects
Wilam
Ngrarrang
Fitzroy, Victoria
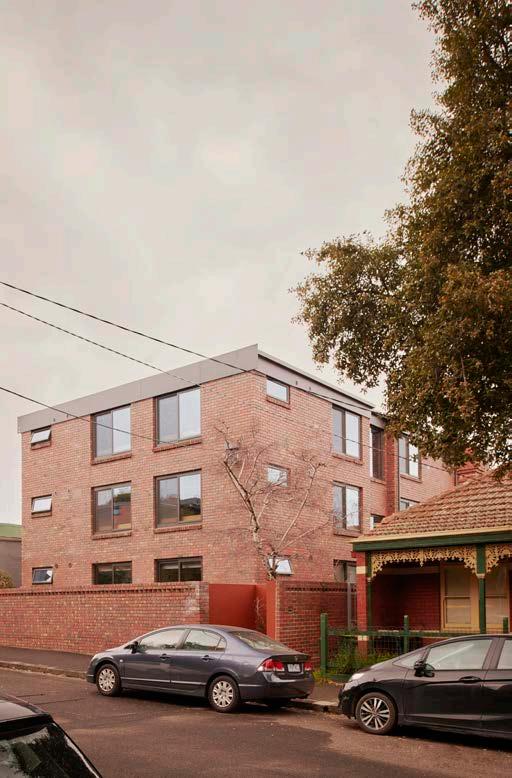
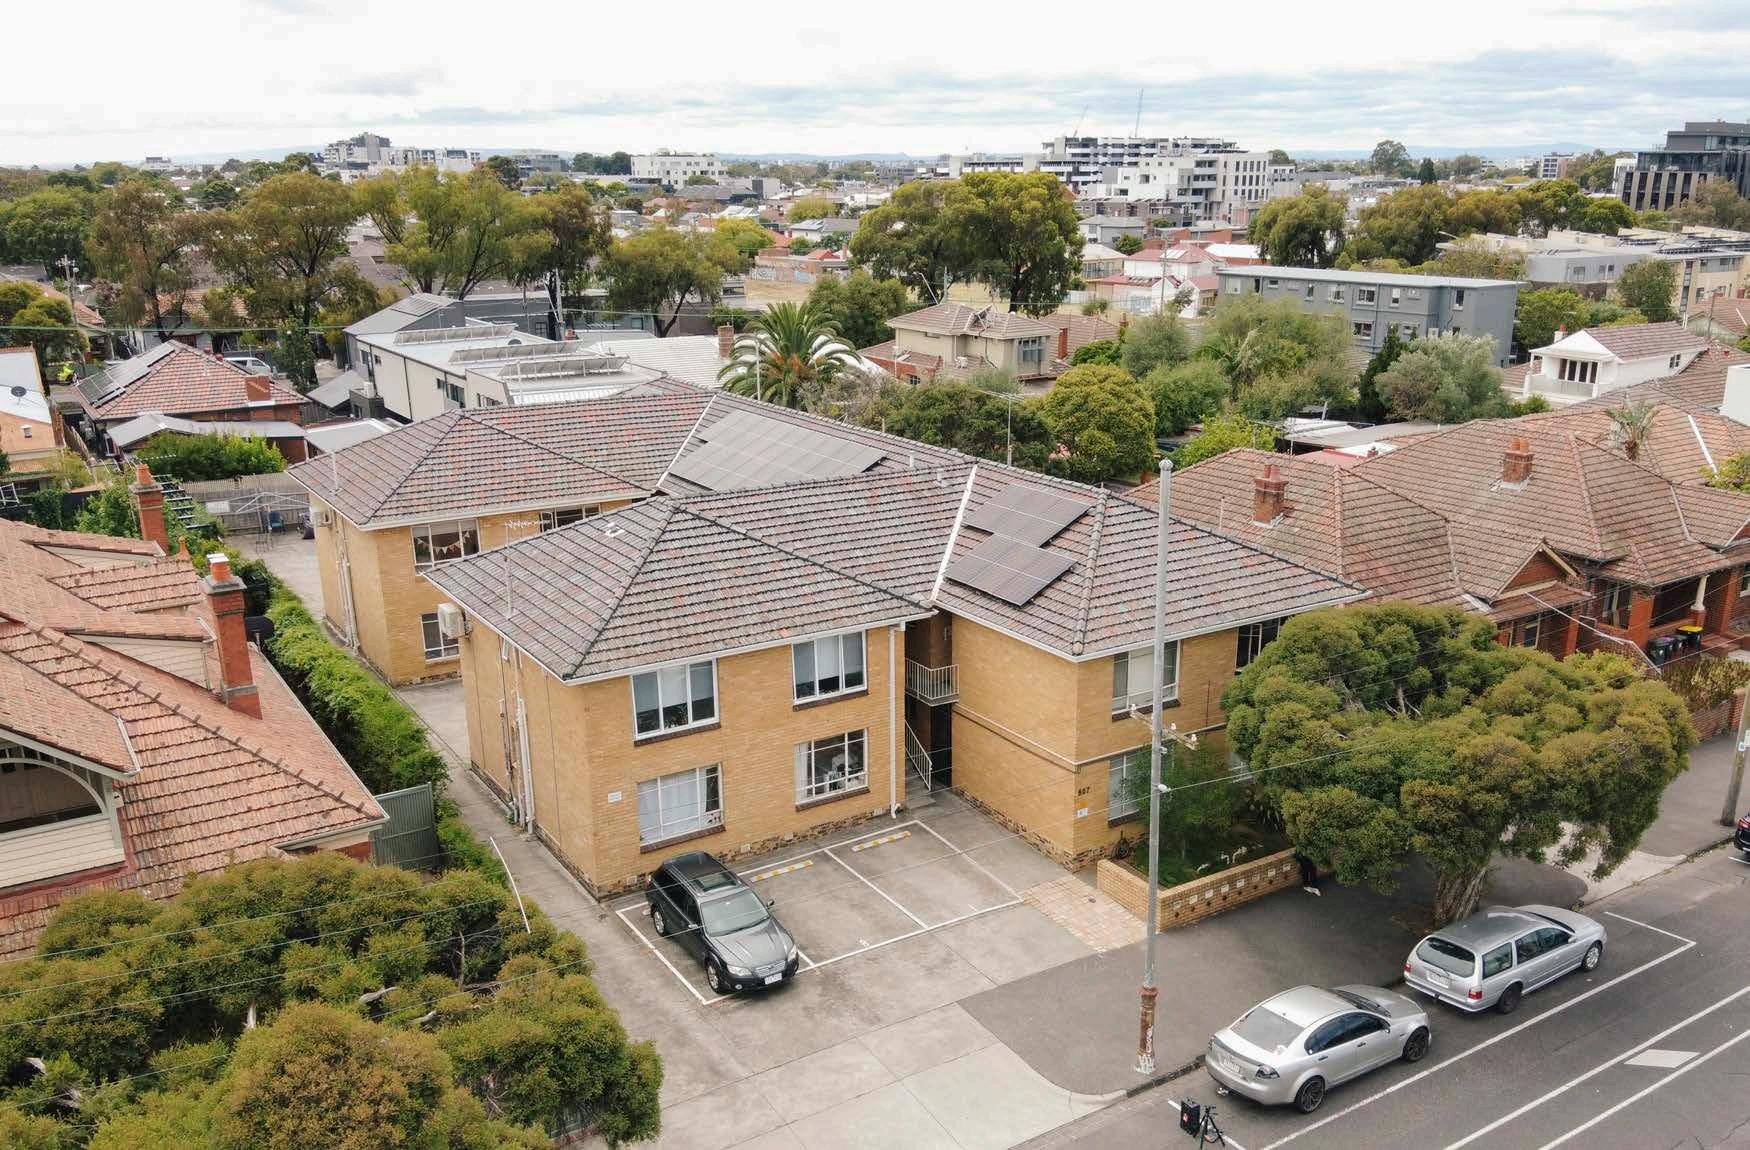
Wilam Ngarrang Apartments is the first plus energy retrofit of an apartment building in Australia. There are currently millions of existing homes throughout Victoria that are in need of a retrofit in order to become more energy efficient and reduce operational carbon emissions79.
This project's aim was to create a financially replicable model of a low impact retrofit without contributing to gentrification in the area. There were several main objectives: achieve net positive energy, minimise grid water demands, minimise carbon in construction, minimise construction waste, and provide affordable rent for tenants, all of which were achieved.
The project achieved an 80% reduction in bills, 82% reduction in embodied carbon emissions compared to a new build, 80% reduction in construction waste and a 35% reduction in mains water consumption.
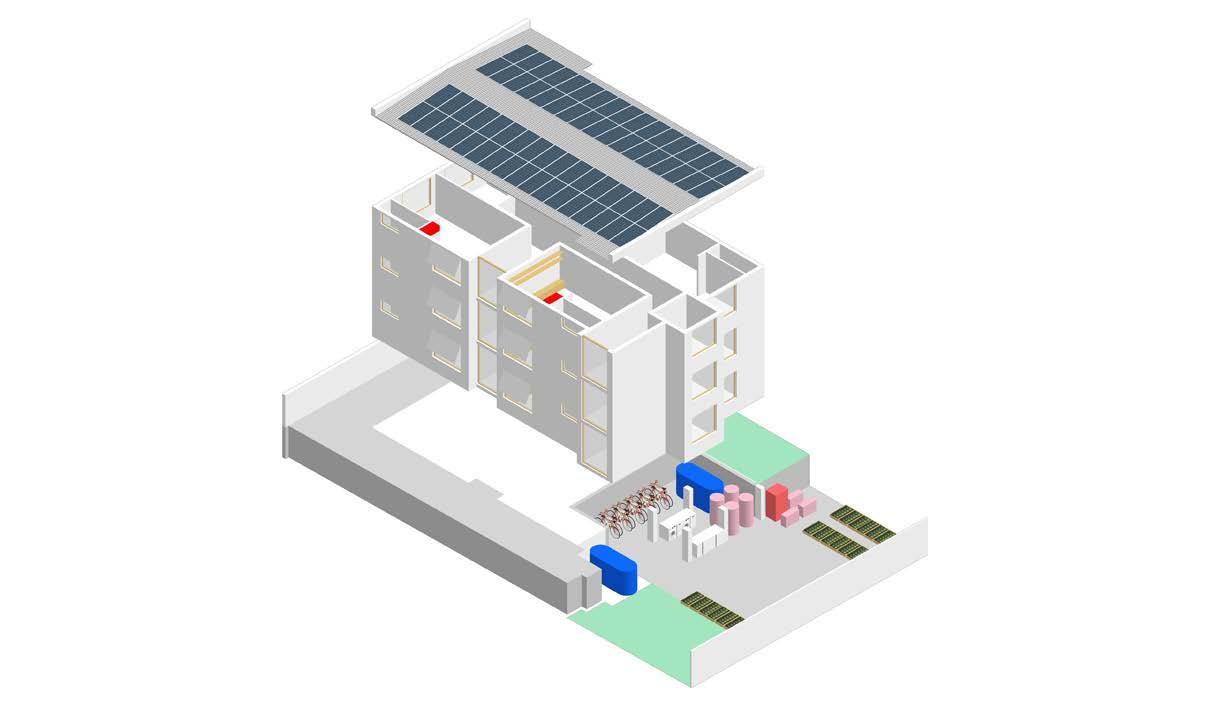
The scope of this retrofit included adding insulation, airtightness improvement, double glazed windows, the installation of a heat recovery ventilation system, a new VRF heating and cooling system offset by solar generation, additional CO2 heat pumps for hot water, a 33kw rooftop solar system and on-site communal composting.
Stage: Completed July 2023
Architect: Kennedy Nolan
Environmental Design: Finding Infinity
Builder: Wilderness Building Co.
Client: Tripple
Completed Projects
Balam Balam Place Brunswick, Victoria
Balam Balam Place is a landmark community redevelopment project in Brunswick, located at 33 Saxon Street. Originally an old school site featuring a heritage house and open grounds, it was purchased by Merri-Bek Council in 2010. From then until 2023, the site served as a contemporary art gallery and vibrant community hub. In 2025, it was reimagined and reopened as Balam Balam Place.
This precinct sets a new benchmark for community spaces—designed not only to meet but exceed council and building code standards. It is a showcase of innovative, sustainable design and community-led development.
Balam Balam incorporates a range of forward-thinking sustainability features through the retro-fit and new construction of the site.
Balam Balam Place stands as a model for future-focused, inclusive, and sustainable community development.
Stage: Completed April 2025
Architect: Kennedy Nolan
Landscape Architect: Openwork
Environmental Design: Finding Infinity
Builder: Mccorkell Constructions
Client: Merribek City Council
Projects in Progress
Matter House Cremorne, Victoria
Matter House is a forward-thinking initiative for a new office building in Cremorne.
The project aspires to set a new benchmark for office developments in the City of Yarra, Melbourne, and across Australia. Rather than aiming for minimum compliance with council and building code requirements, the focus is on achieving maximum performance in a pragmatic and financially viable way. Most of the initiatives are designed not only to minimise environmental impact but also to deliver strong economic value.
Matter House aims to redefine expectations for office buildings in Melbourne through a series of worldleading innovations, including:
• High Performance: Advanced façade and HVAC systems designed for exceptional efficiency and comfort Solar Greenhouse: A dual-purpose rooftop combining solar energy generation with urban food production
• Anaerobic Digester: A renewable energy system that converts food waste from the building and surrounding businesses into energy for the building
This project is positioned to serve as a model for future sustainable developments.
Stage: Planning Approval Recieved
Architect: Hassell
Environmental Design: Finding Infinity
Builder: Cobild
Client: Taboo Group
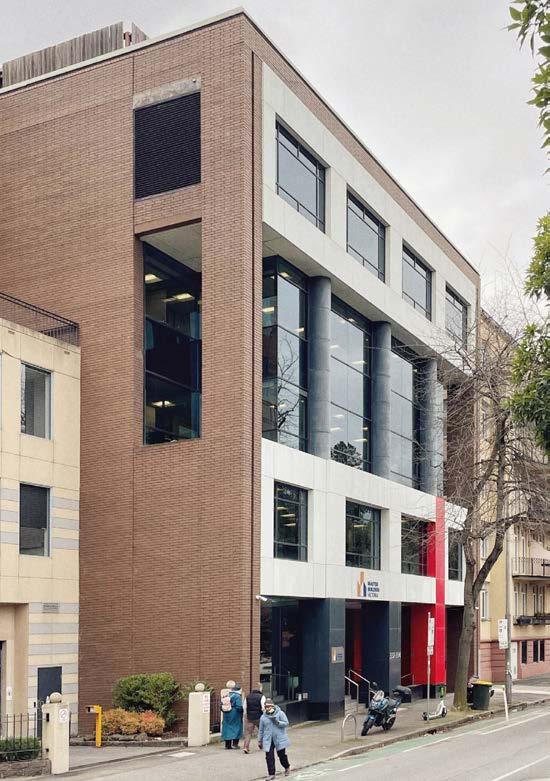
Master Builders MBV-CIC Cremorne, Victoria
The Master Builders Association of Victoria in East Melbourne is undergoning a high-performance retrofit and internal fit-out upgrade.
Originally constructed in 1967, the building saw a major facade reconfiguration in 2006, along with various minor updates over the years.
This latest retrofit is a deliberate and forward-thinking project, designed to exceed standard environmental requirements and adopt responsible demolition practices.
By implementing smart, sustainable strategies—such as a detailed demolition schedule that identifies recyclable components and specifies appropriate waste streams—the project is estimated to achieve an 88% reduction in embodied carbon compared to a new build.
Stage: Construction
Architect: Fieldwork
Environmental Design: Finding Infinity
Client: Master Builders Victoria
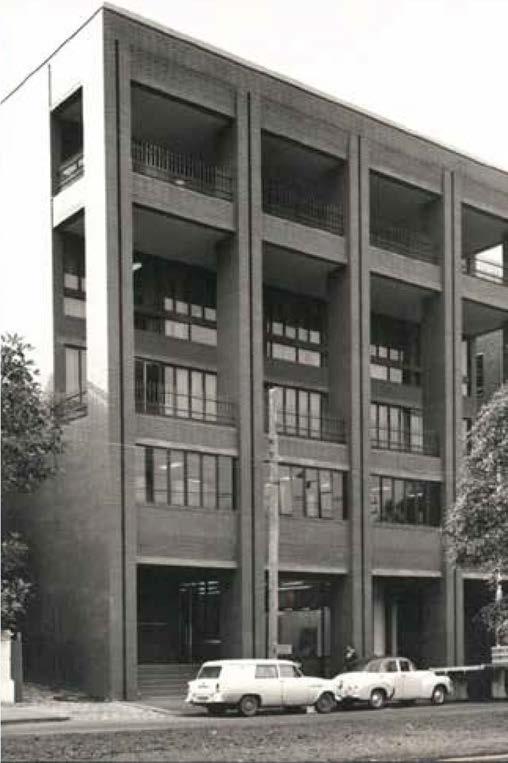
PPTEU
Carlton, Victoria
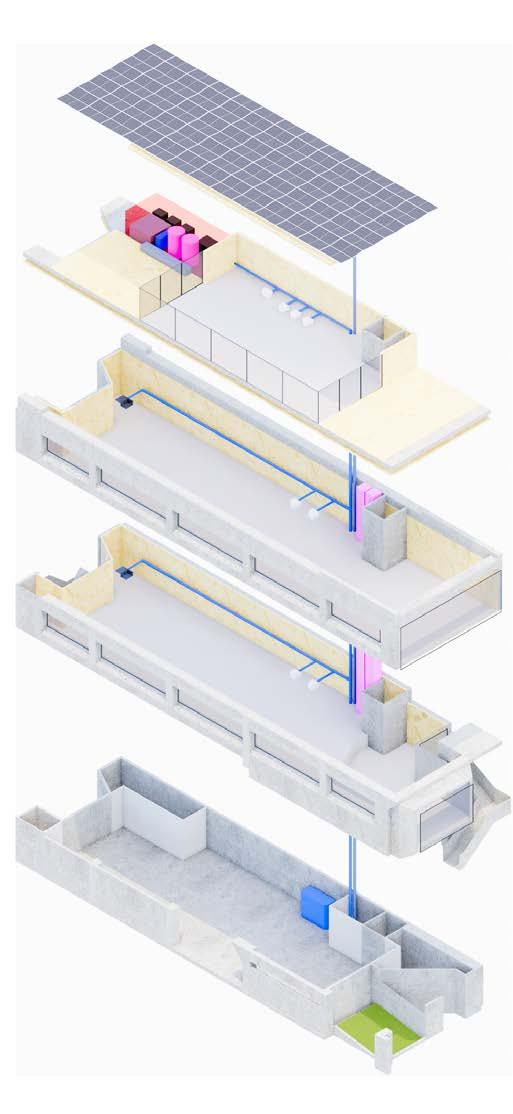
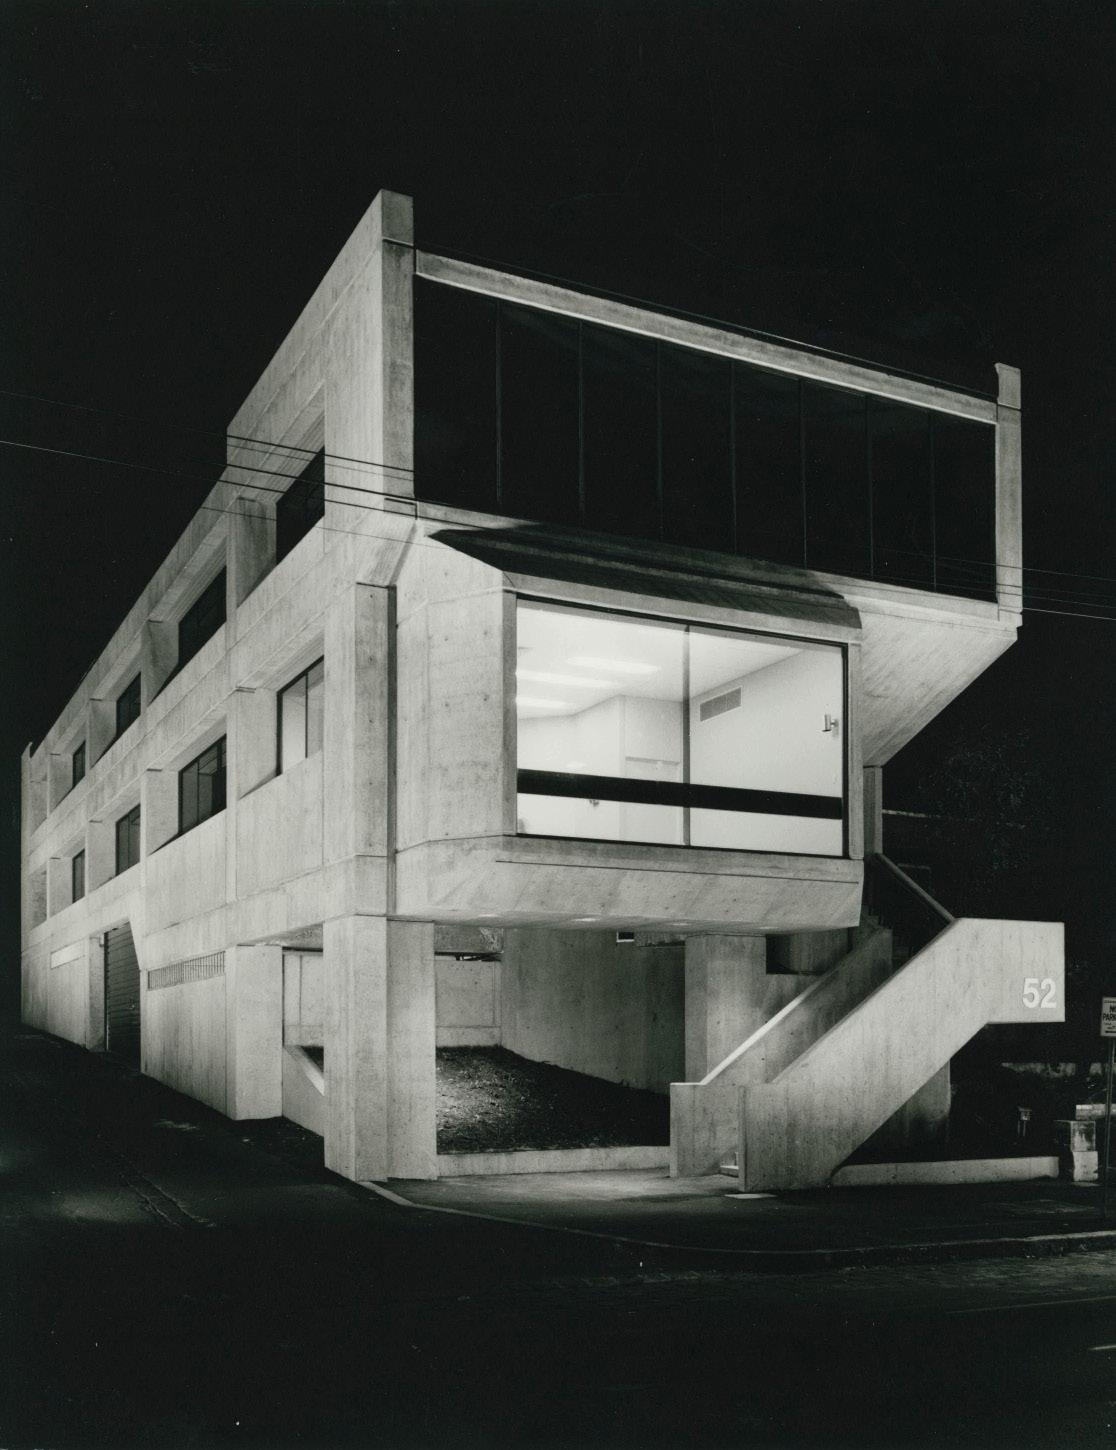
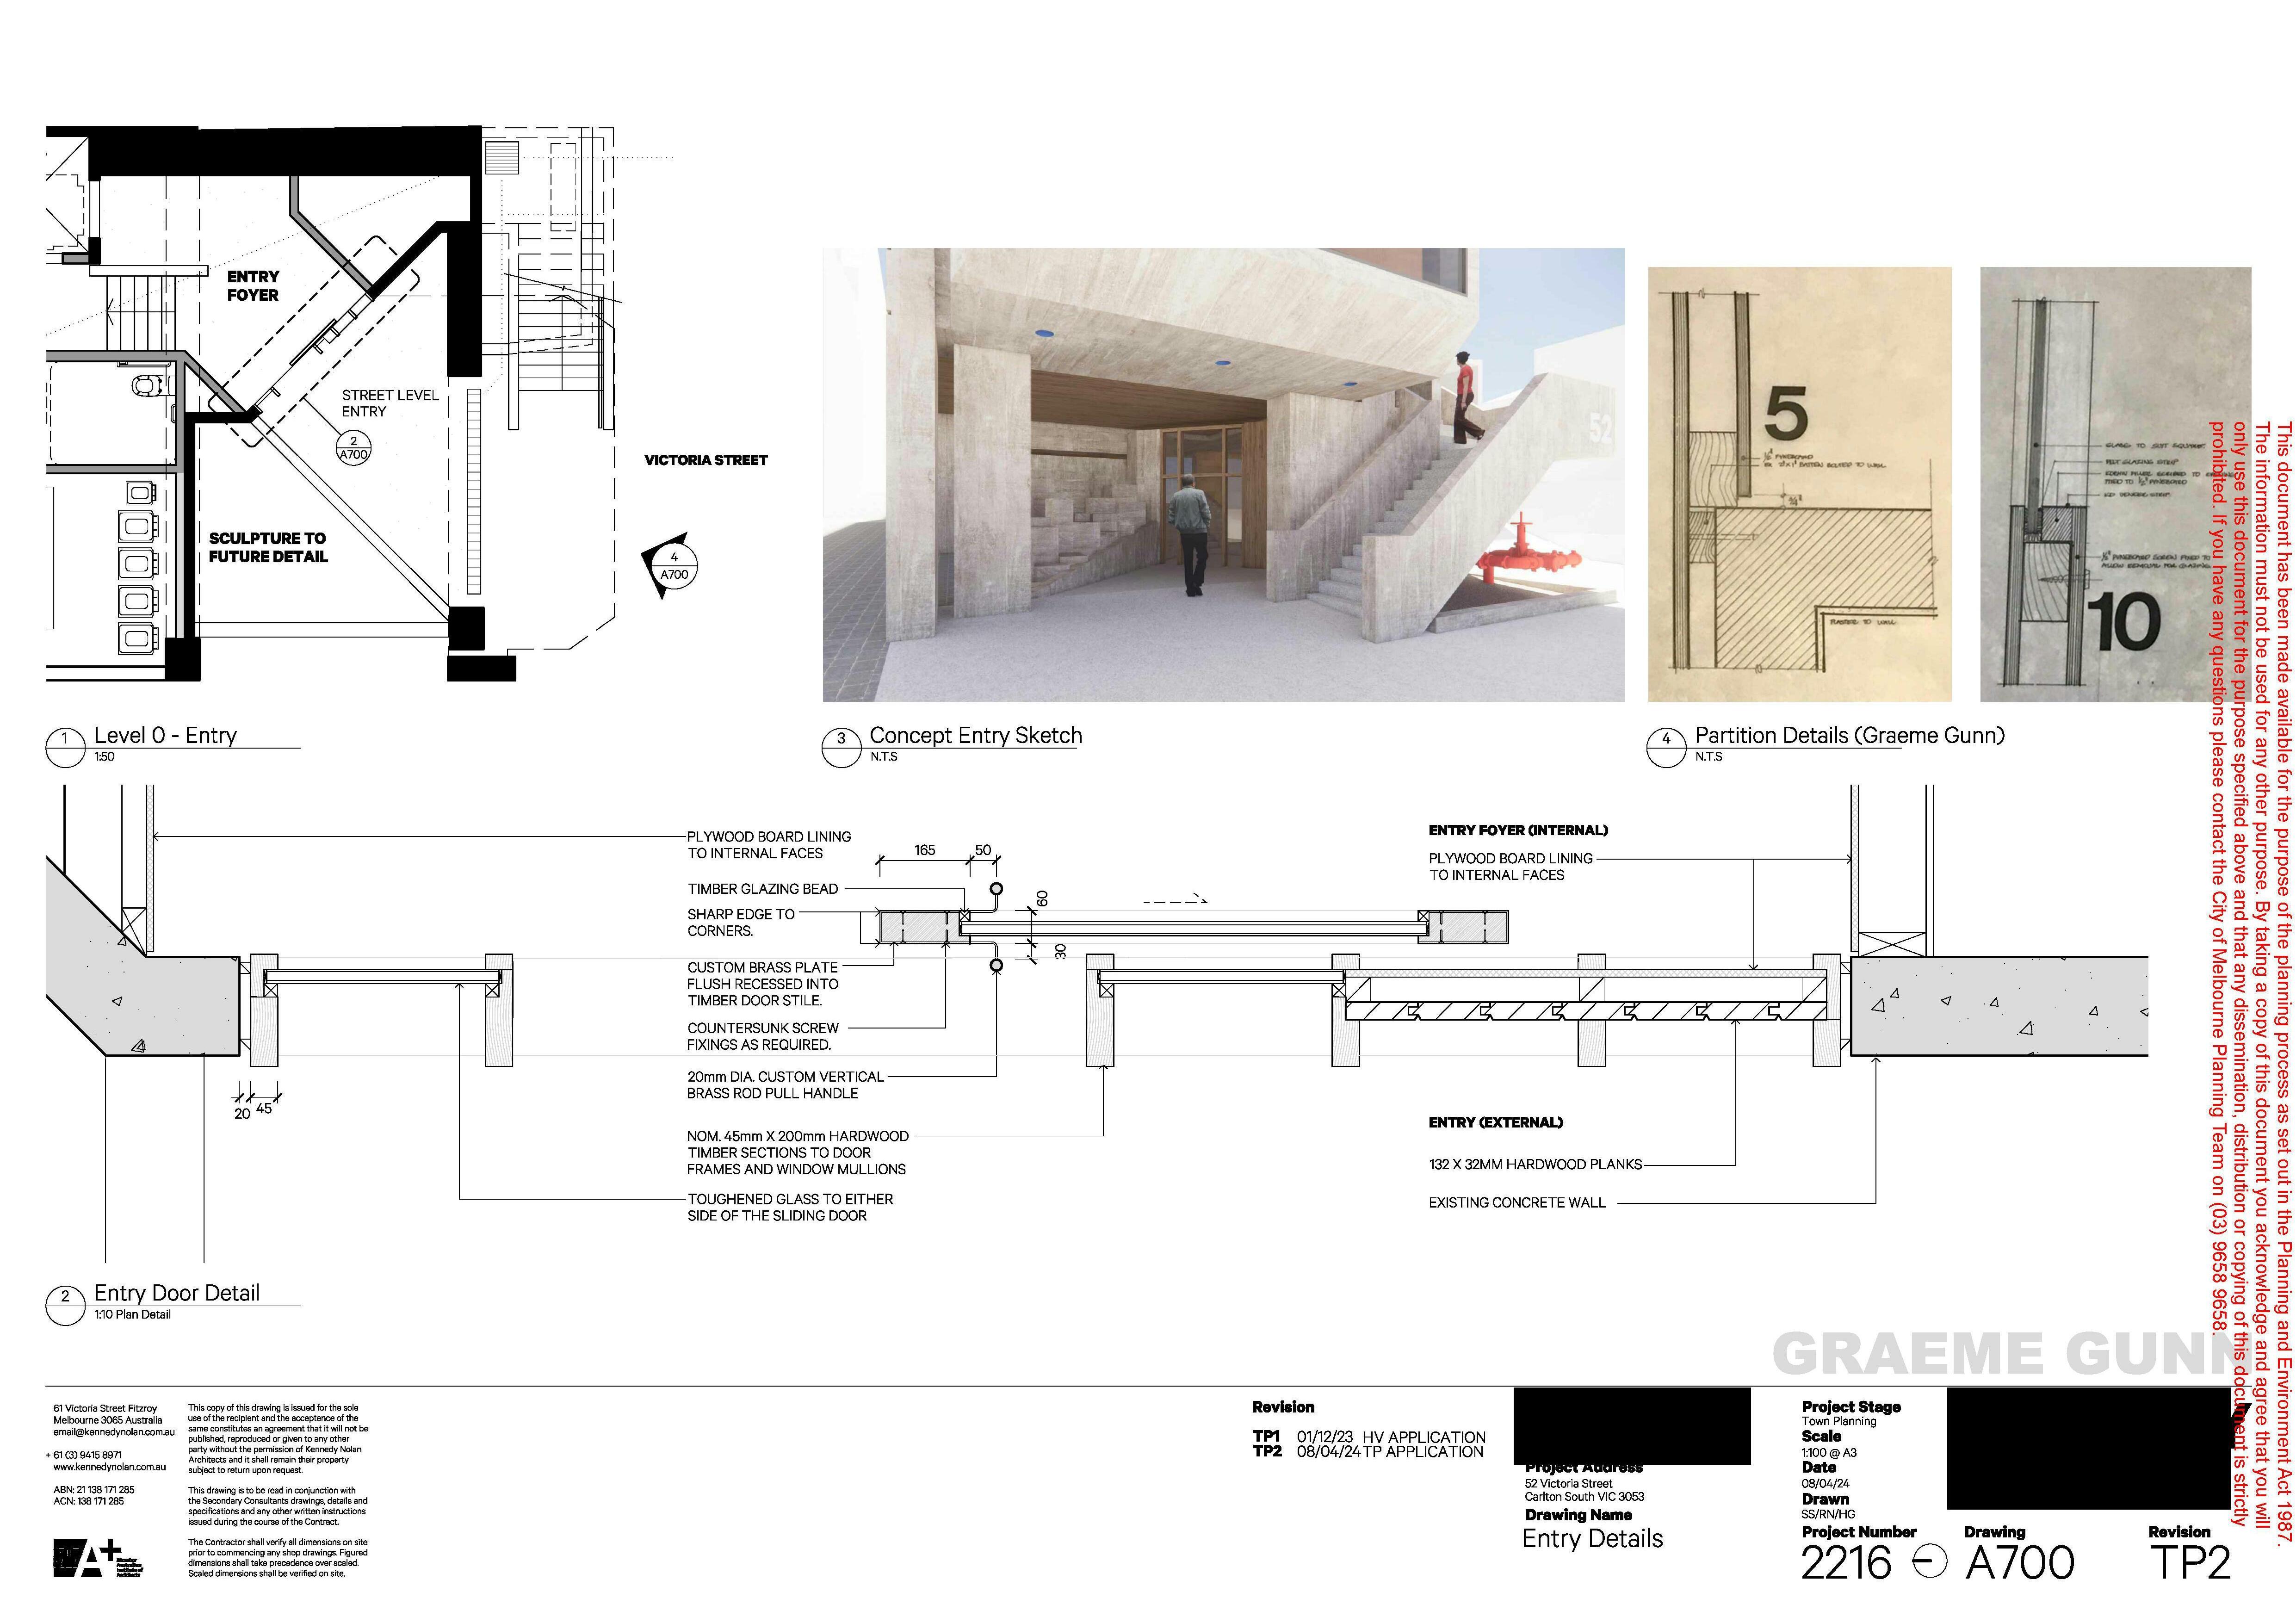
The Plumbers and Gas-fitters Union building, designed by Graeme Gunn, was constructed between 1969 and 1971 on Victoria Street in Carlton.
A comprehensive review of the current PPTEU head office has been undertaken to explore the benefits of a high-performance retrofit focused on energy efficiency. This includes the implementation of targeted initiatives aimed at improving overall building performance and reducing operational costs.
Key Outcomes:
• NABERS rating improvement from 4 to 6 stars
• Glazing upgrades
• Installation of internal insulation
• Enhanced airtightness
• Maximised rooftop solar PV
• Greywater treatment system
• Elimination of PVC piping
Stage: Construction Commenced
Architect: Kennedy Nolan
Environmental Design: Finding Infinity
Client: Plumbers, Pipe-Fitters, GasFitters Union
Introduction
The approach in this document was to first examine Melbourne to understand and establish the baseline demands for the city. This allowed an understanding of the functionality of the city currently. Data was gathered on Melbourne’s consumption of fossil fuels, water, and generation of waste.
The approach was not to propose new technology, but to de-risk the process by understanding where these initiatives have already been implemented in other cities. Case studies from around the world in cities were collated. The projects were broken down into twelve initiatives, all of which have been implemented in a financially viable manner. Some environmental initiatives can be expensive and provide poor returns, however some are profitable. The question was asked: if Melbourne implemented every single profitable initiative over the next decade, targeting the environmental and financial threshold, how far could we get?
The investigation involved the capital cost, annual return, spatial requirements, construction jobs and ongoing jobs created throughout this process. It was found that the initiatives could be implemented across Greater Melbourne to transform the city from a consumer to a producer, while creating profits for investors and a much-needed boost in employment.
But given the urgency and enormity of the change required, how can these initiatives be implemented in time? This document proposes integrating the physical infrastructure that makes our cities work with the cultural infrastructure that enables them to thrive. From prototyping to piloting technologies linked with various cultural activities, the process helps to warm the public up to the transformation and
the introduction of new technology to Australia in general, while providing our political leaders with much-needed public support. All of this enables the private sector to implement, deliver and profit from these imperative initiatives.
The document focuses on Greater Melbourne, which comprises 31 different municipalities:
• City of Melbourne
• City of Port Phillip
• City of Stonnington
• City of Yarra
• City of Banyule
• City of Bayside
• City of Boroondara
• City of Brimbank
• City of Darebin
• City of Glen Eira
• City of Hobsons Bay
• City of Kingston
• City of Manningham
• City of Maribyrnong
• City of Monash
• City of Moonee Valley
• City of Moreland
• City of Whitehorse
• Shire of Cardinia
• City of Casey
• City of Frankston
• City of Greater Dandenong
• City of Hume
• City of Knox
• City of Maroondah
• City of Melton
• Shire of Mornington Peninsula
• Shire of Nillumbik
• City of Whittlesea
• City of Wyndham
• Shire of Yarra Ranges
Ravenhall
Pakenham
Gas sourced from Gippsland Basin
Figure 3: Greater Melbourne resource map
Melbourne is the 16th wealthiest9 and 4th most liveable city globally10. However, it sits just outside the top 1% in terms of emissions per capita11
Greater Melbourne covers around 9,900 square kilometres12 and consists of 33 municipalities13, with a population of over 5.35 million14.
Erected in 1880, the Royal Exhibition Buildingis one of the most iconic, monumental public buildings in Melbourne15
Energy
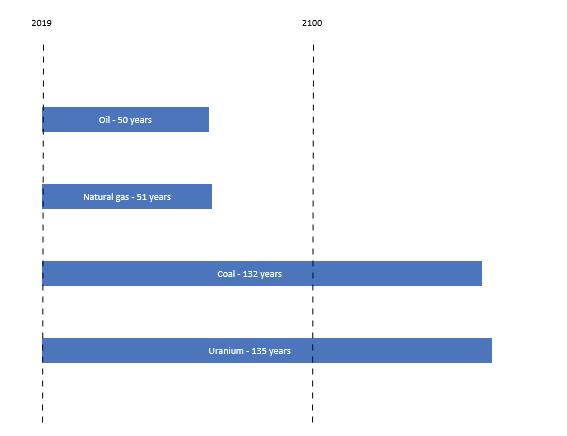
To power the city, Greater Melbourne burns enough brown coal to fill the Royal Exhibition Building 225 times annually, enough oil to fill it 90 times and enough natural gas to fill it 70 times16. At current consumption rates, the finite resources that power our energy system will be exhausted globally in two lifetimes17
Water
Melbourne consumes enough water to fill Royal Exhibition Building 2,250 times annually. Greater Melbourne receives 10 times more water (as rainfall) than it consumes. Only 16% of the wastewater we treat is reused, 84% is disposed of at sea. The demand for water continues to rise with increasing temperatures and population growth. A 40% shortfall between demand and supply is projected globally by 203022. Our supplamentary plan, desalination is significantly more cost intensive than recycling water and is highly energy intensive18.
Waste
Melbourne sends enough waste to landfill to fill the Royal Exhibition Building 110 times annually. 18% of this waste is organic matter19, which is often wrapped in plastic bags and dumped in landfill to rot, creating methane — a greenhouse gas 28-36 times more damaging than carbon dioxide20.
It is inevitable that our cities will become self-sufficient. But will the change come quickly enough?
In Melbourne, we have an opportunity to move ahead of the curve — and transform from a consumer to a producer by 2030. This could position Melbourne as a world leader on such an important transition, enabling us to export the knowledge and expertise in the future.
This means moving beyond:
• fossil fuels
• the internal combustion engine for transportation
• the disposal of treated wastewater
• single use plastics
• organic waste to landfill
• the sale of any consumer product destined for landfill
Let’s not delude ourselves — these shifts are seismic. Every item on the list above is deeply entrenched in our current way of life. Fossil fuels and the internal combustion engine have underpinned the global economy for 200 years.
So, how do we do it?
We electrify transport and buildings. We drastically improve the efficiency of our buildings. We introduce energy storage and power our cities with renewable resources. We treat and reuse water, creating an endless supply. We use organic waste as a fuel for heat and power plants. We end the concept of landfill.
It is possible.
We can transform Melbourne to operate on resources that will never run out — and profit from the transition.
Figure 7: Transport and buildings are electrified, ending our consumption of fossil fuels. Buildings and transport become more
This is how we will transform our water system to close the loop and provide an unlimited supply.
Bitumen and concrete covered roads mean the water can’t get into the ground anymore, instead it collects chemicals and goes into our waterways, so we can’t swim in our creeks and rivers anymore.
By increasing surface permeability, water sensitive urban design and the reduction of combustion engine cars we store more water in the ground and we improve the quality of water in our creeks and rivers.
Figure 8: We treat and reuse all of our sewer water and harvest stormwater for reuse to minimise or even eliminate water requirements from catchments outside of Greater Melbourne.
This is how we will transform our waste system to become circular and no longer send resources to landfill.
Figure 9: Food waste is treated through anaerobic digestion, and all waste destined for landfill is avoided.
Perpetual Motion 01.
2.9 Million Cars in Greater Melbourne 25 = oil
Halve the amount of cars through increase shared ownership and electrify the other half Electrify the rest Halve them.
Incentivise active transport friendly urban design.
Enhance active transport and public transport networks, reduce private vehicle use and electrify the remainder.
Expand and electrify current public transport networks
Annual healthcare savings of $0.5bn1.2bn/year* 26 27
Annual fuel savings of $1.6bn/year*
Annual construction jobs up to 2030 x 19,700* x 1,300* Number of jobs ongoing
*Based on estimates by Finding Infinity
The Challenge
There are roughly 2.9 million passenger vehicles in Greater Melbourne, or around 0.6 vehicles per capita25. Comparatively, Copenhagen has around 0.24 vehicles per capita while London has around 0.3 vehicles per capita28. Transport accounts for around 25% of Greater Melbourne’s total emissions29. Emissions from private vehicles cost the public health system approximately $500 million - $1.2 billion every year due to health costs associated with air pollution26 27.
It is time to prioritise pedestrians, active transport and public transport. Phase out the internal combustion engine, convert the transport system to be entirely electric:
Where Is This Currently Happening?
Bogota
Bogotá’s rapid bus system serves about two million riders a day, reducing the need for private vehicles.
• The reduced transport times led to an improved traffic flow in the city.
• From 2013 to 2019, the annual average estimated reduction of CO2 emissions amounts to 578,918 tCO2eq.
• There has been a reduction of 92% in road related deaths.
• The social well-being of residents has increased as a result of less time spent in congestion, less respiratory diseases and less noise pollution31.
Tyrol
Tyrol is introducing ride-sharing benches to initiate carpooling practices as an addition to public transport.
• Encourages car-free living.
• Low initial investment and construction costs.
• Reduced urban pollution .
• Community-initiated public transport32.
• Improve infrastructure to expand pedestrian and active transport network.
• Expand public transport network
• Incentivise urban design that supports multi-modal and humanpowered transport.
• Phase out the sales of cars with internal combustion engines.
• Incentivise car-pooling and carsharing to bridge the gap of public transport.
• Incentivise retrofits of existing ICE vehicles to electrify remaining public and private vehicles.
• Adopt Vehicle-to-Grid technology to utilize EV batteries as energy storage.
Japan
Giken’s Automated Parking Facility ECO Cycle™ promotes cycling lifestyle, solving the last kilometres problem.
• Developed with the concept of “ Culture Aboveground, Function Underground”. With a compact entrance booth, it requires minimal space above ground and provides more than 200 parking spaces underground.
• Eliminating the risk of theft and exposure to weather34.
Paris
Paris recently ordered 800 electric buses in Europe’s biggest electric bus purchase.
• The public transport operator aims to convert two thirds of its 4,700 buses to electric by 2025.
• The remaining buses will run on bio-gas
• After 2025 any replacement buses purchased will be electric35.
Shenzhen
Shenzhen’s public transport operator recently purchased 16,000 electric buses and 20,000 electric taxis, converting their entire network to electric while halving their fuel bills.
• Removed 440,000 tonnes of annual CO2 emissions.
• Halved their fuel bills.
• Most of the buses charge for around 2 hours for a full day’s service.
• Fully electric public transport achieved in 2018 .
• More than 20,000 taxis are now electric (over 99% of taxis in the city)37
Oslo Oslo has effectively removed cars from the city centre, by removing on-street car parks in the inner ring streets.
• Reduced inner-city pedestrian death-rate.
• Replacing the space with bike lanes. benches and miniature parks to increase urban quality and encourage biking and walking.
• As a result, traffic in the city decreased by 28%38.
Copenhagen Copenhagen has converted 43% of buses to electric in collaboration with Movia, and plans to convert all buses to zero emission.
• This reduced emissions by approx. 17,000 tons of CO2 per year.
• Ensures clearer air for the citizens, improving living quality and health33.
Melbourne
Jaunt Motors in Melbourne are investing in electrification of existing cars.
• By converting iconic cars, it sparks interested in the electric car industry.
• Promotes car conversion over replacement36
Perpetual Motion
A New Normal Solution
Transform existing petrol stations and car repair shops to become workshops where internal combustion engine vehicles are converted to electric vehicles. As part of this, upskill mechanics to perform these conversions, stimulating the mechanical and electrical workforce. It is estimated that at high quantities, the cost is equivalent to $22,900 per car conversion39 40 41.
Through the encouragement of more localised living and working habits, increased utilisation of public transport facilities, the global trend of increased uptake in car sharing, and human powered transport infrastructure, the approach is to target halving the number of cars on the road – going from about 1 car per 1.7 people to 1 car per 3.4 people. This will leave around 1.45 million cars to convert to electric25.
Electric vehicles are significantly more efficient than combustion engine vehicles. Combustion engines convert around 12-30% of the energy in the fuel to power at the wheels, compared to electric vehicles which convert around
What is the environmental impact?
~23.3% reduction in emissions46 (assuming electricity used is renewable – see initiatives five & six), however this results in a ~18% increase in electricity consumption47.
*Calculations prepared by Finding Infinity
77% of grid electricity to power42. 570 mechanical workshops — each converting 10 cars per week — could complete the transition by 203025. This can be incentivised through government subsidies, which are justified through future healthcare savings. The benefit to consumers is an over 43% reduction in fuel costs annually43.
In Melbourne, the trams and metro trains are already currently electric44. Rural trains and buses are expected to be transforming anyway by 203045. Naturally commercial fleets can also fit into this scheme.
How much space will it take?
Savings in car parking space outweigh the space taken up by conversion stations. There are over 39,000 private and commercial parking spaces in Melbourne CBD48, if we halve the number of people who drive to work, we free up over 19,000 inner city parks.
How much will it cost?
The cost of converting ~1.48 million cars has been estimated to be ~$34 bn39 40 41. This will be through a combination of government subsidies and individual investment.
What is the return on investment?
Healthcare savings have been estimated to be $0.5-1.2 bn/year26 27 and fuel saving $1.6 bn/year*, meaning the conversions pay for themselves in under 14 years.
Car Conversions:
Grimshaw x Greenshoot x Greenaway Architects Perpetual Motion
Project Summary
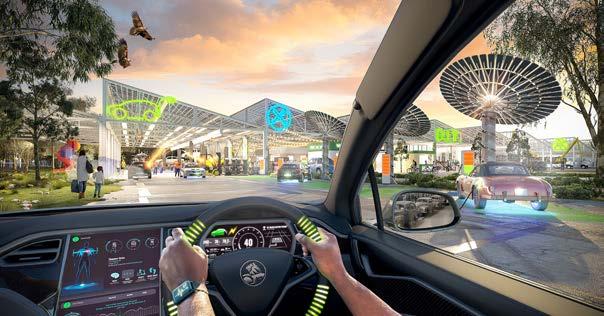
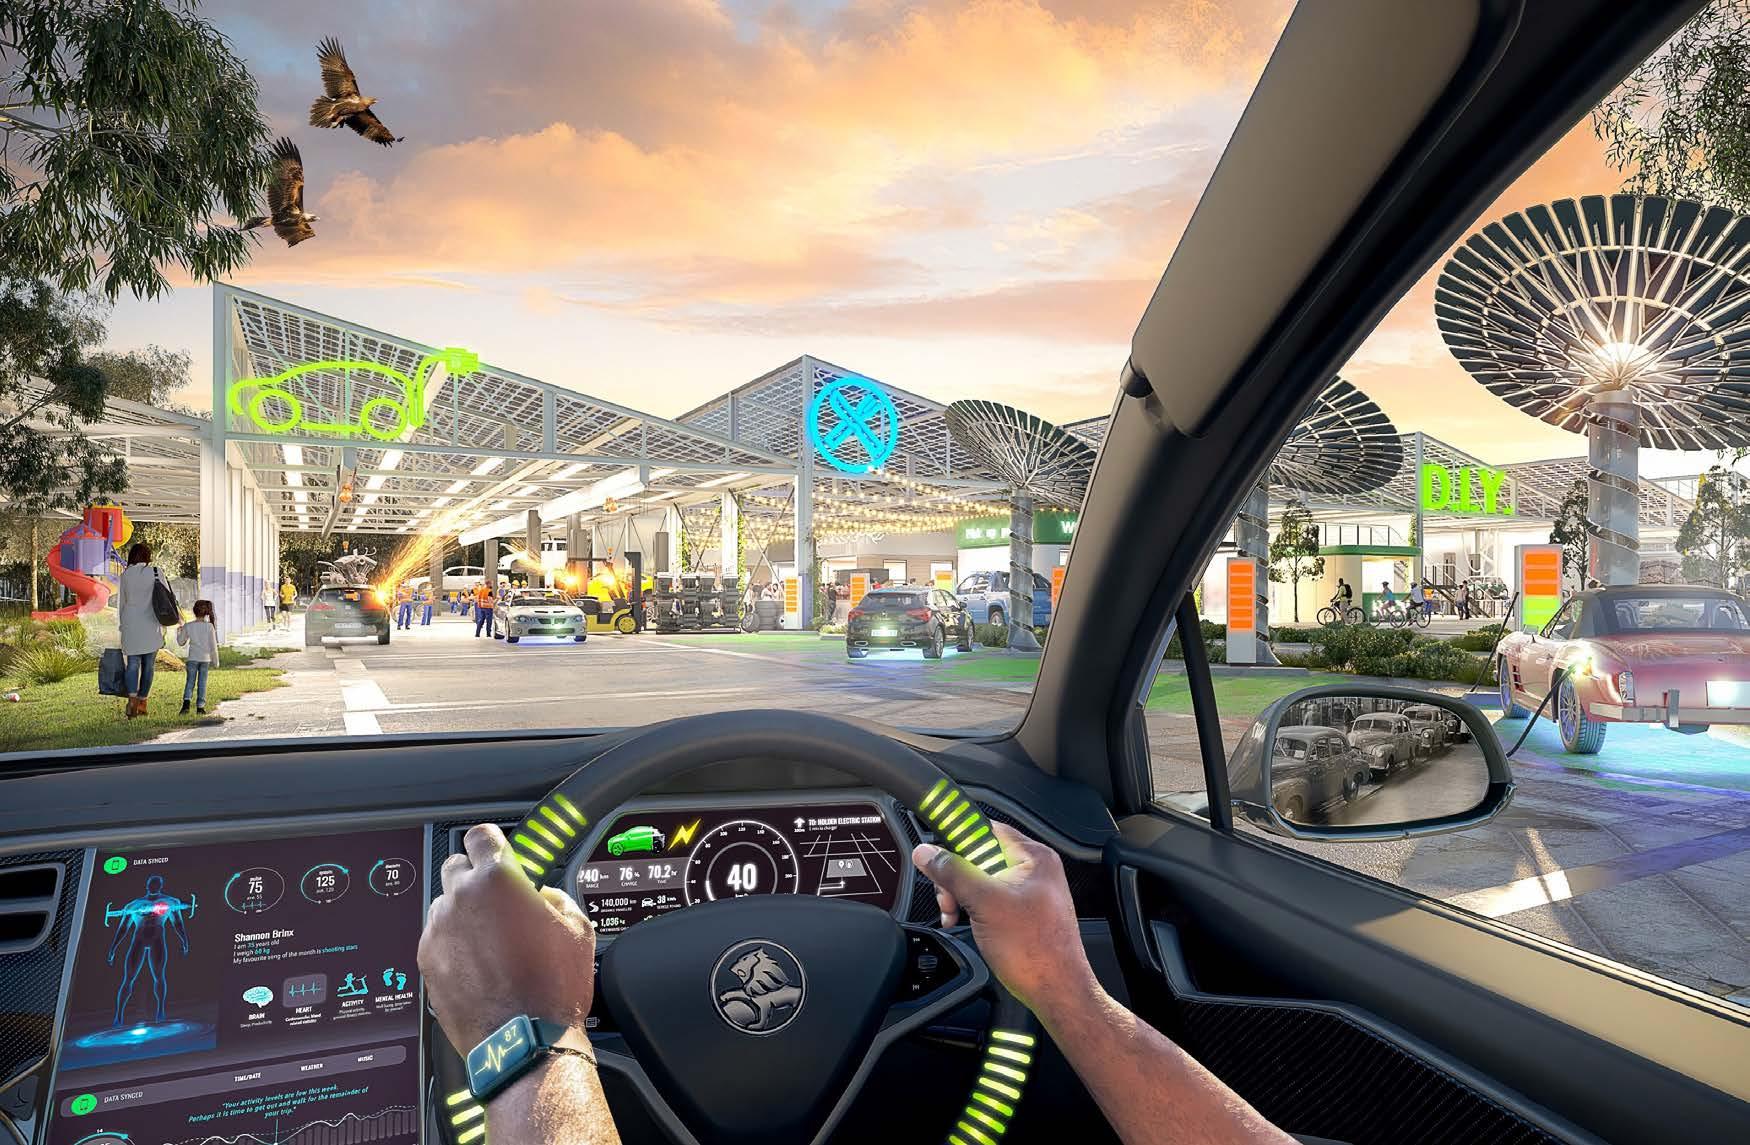
The electrified vehicle ‘pit stop’ aims to connect people to the process of electrifying existing cars through the ‘new normal’ service station car conversion experience - cars are converted and charged, and their spare parts repurposed and recycled, whilst powered by solar.
People reconnect to their own health and wellbeing at the same time by the installation of feedback loop ‘Mobile GP’ installed into their vehicles.
Due to the conversion of existing cars, the facility enables current technology vehicles to remain relevant in a future age of automotive technology. DIY is supported by a RACV helpdesk, and creates an opportunity for the next generations of mechanics to upskill.
The process is about empowering personal choice to convert their vehicles whilst encouraging citizens to reconnect with health and wellbeing. The service station represents in real time - choice, social interaction through DIY, convenience - which slowly adapts the cities transport networks into living arteries for our cities which are healthier places to be, and that allow natural systems and habitats to regenerate.
Perpetual Motion
Upgrading the Train: Foolscap
Project Summary
Work; Eat; Sleep; Relax; Repeat!
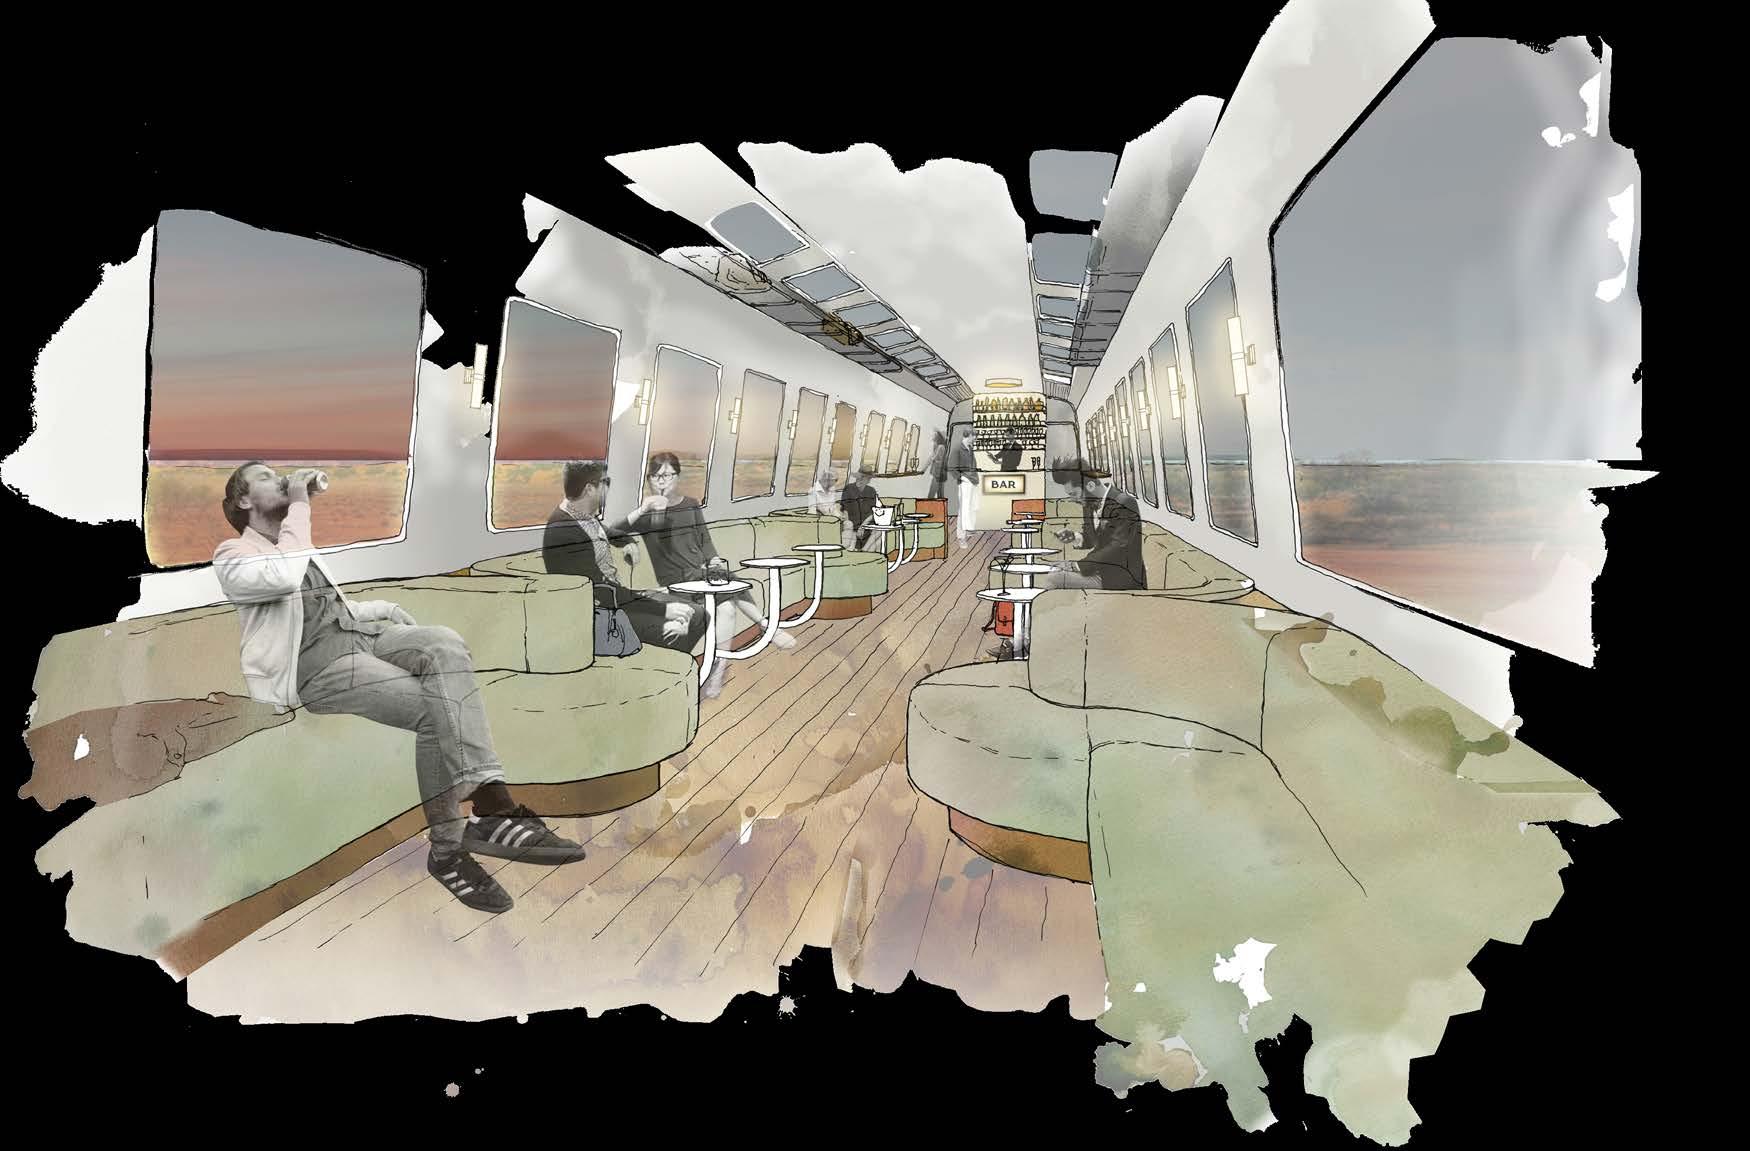
By 2030, we need to provide a legitimate, electric alternative to air travel. As a way of encouraging consumers to use the train more, to demonstrate to our political leaders that Australian’s enjoy and want a better train system that is fast and electric, we start by improving the experience on our existing trains. The trains between Melbourne, Sydney & Adelaide become the most desirable path between cities because the experience is tailored to the next generation.
Not fast, not slow, our proposal is a celebration of medium-paced travel, which repurposes existing rail infrastructure to connect Australia’s largest urban centres: Melbourne, Sydney and Adelaide. Through great design, we can create demand for trains, improve efficiency—and have fun doing it.
Currently, the XPT trains are the only long-distance public transport option for travelling between Melbourne and Sydney. These trains are up to 37 years old and run on diesel-powered engines. They’re old, tired, and far from an inspiring way to travel.
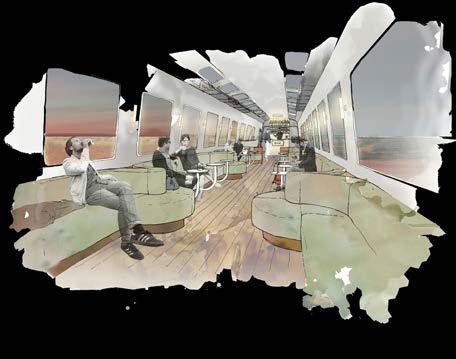
This proposition, which could be kickstarted immediately, would see old carriages stripped down to their shell, before being repurposed as mobile F+B destinations.
The opportunities are endless: we’ve included a café, restaurant, bar, lounge, co-working facilities and sleeper cars to celebrate the rich hospitality culture of our cities. The result: a reimagining of the past, to create future-forward travel experiences in convivial, relaxed style.
www.foolscapstudio.com.au
Motion
Middle Ring Community Coworking to Reduce Fossil Fuels: Public Realm Lab & Beth Arnold
Project Summary
Middle ring workplace campus to support a de-centralised and electrified Melbourne. Reflecting the vibrancy and diversity of Melbourne’s outer suburbs, this proposal is about changing the ecological impact of CBD working as well as who and how we work in the near future.
Key Statistics
• 1.2 million people drive in a private vehicle to work in Greater Melbourne each day, including 120,000 people to Melbourne CBD.The median distance traveled to work by established area residents is 12 km.
• The median distance traveled to work by growth area residents is 22 km.
• Growth area melbourne is a childcare desert , and is ranked low in livability despite being where most children in Greater Melbourne call home.
• Every year, there are 7 million tonnes (Mt) of CO2 emissions from cars in Greater Melbourne or ~15% of Melbourne’s emissions.
• Reducing car journeys by half by converting to public and human powered transport could reduce Melbourne’s emissions by ~7% .
• There are ~2,000 potential vibrant, walkable activity centres within 1km of train stations and 500m of tram stops that could be used to house a newly de-centralised workforce.
• By developing 2,000 activity centres, we can deliver 15,000 commercial spaces to support local businesses and 560,000 new workstations for office employees.If 560,000 commuters switch from driving to public transport or walking, it could reduce carbon emissions by up to 0.25 Mt of CO2 annually - or 0.5% of Greater Melbourne’s total emissions.
Esther Stewart
Electrify Architecture 02.
The Challenge
The grid can never fully decarbonise without removing natural gas.
Even ignoring carbon emissions, there are serious concerns around both the health impacts and future supply of gas.
The New England Journal of Medicine noted “gas is associated with health and environmental hazards and reduced social welfare at every stage of its life cycle”52. Currently gas consumption in buildings and industry accounts for 40% of Greater Melbourne’s stationary energy consumption53 54 55.
Despite having profitable solutions to get off gas such as heat pumps and induction cooking, the transition is moving far too slowly.
Where Is This Currently Happening?
San Diego
San Diego leaders have approved a ban on natural gas in an attempt to shrink the city’s carbon footprint and reach net-zero emissions by 2035.
• A fossil fuel ban was approved for all new construction projects and a commitment to electrify all existing buildings over the next 11 years.
• The vision to decarbonise all existing buildings will have a significant impact that could create thousands of new jobs through the San Diego area.58 .
Canberra
Canberra has introduced a regulation to prevent new gas connections from the end of 2023.
• Incentivise those with gas connections to switch to electric through rebates.
• Over the next 17 years, The Electrification of Government Gas Assets Program (EoGGA) will replace gas-powered assets used within Government owned buildings59
New buildings must be constructed without gas connections; existing buildings will require retrofitting to function without gas.
In buildings, gas heaters and hot water units can be replaced with heat pumps, which run on electricity — and can generate three to five times more heat with the same amount of energy input56. Gas stoves can be replaced with efficient induction units, gas ovens by electrical ovens57
In industry, electrification is not only viable for logistics and manufacturing, but can give manufacturing industries a competitive advantage through the availability of abundant and affordable clean energy.
Netherlands
A National Energy and Climate plan (NECP) in the Netherlands intends to aid continent-wide decarbonisation efforts.
• 300,000 existing homes and buildings will be made energy-efficient every year by a consortium between the construction, engineering and energy sectors
• From 2018, all new government buildings must be “nearly-energy-neutral”60.
Wollongong
Dr Saul Griffith, the founder of Rewiring Australia, is on a mission to electrify the nation, one suburb at a time, beginning with his own suburb, Woollongong.
• Project Electrify 2515 is an aim to convert or remove all households and machinery in the postcode of 2515 to be off fossil fuels.
• The project asks residents to be a part of the pilot project, and acts as a proof of concept at a community scale to eventually roll out further through other areas of Australia.
• Targeting for 50% reductions by 203061 62.
Electrify Architecture
A New Normal Solution
Ban gas connections to new buildings and installation of new gas appliances — and phase out gas connections to existing buildings by 2030.
We need to rapidly electrify Greater Melbourne:
• Ban the replacement of any gas equipment by 2025
• Electrify all existing buildings by 2030
• All gas heaters and hot water units should be replaced with heat pumps at the end of their working lives or by 2030 at the latest
• All other gas appliances can be replaced with efficient electrical equivalents when heating and hot water systems are replaced — enabling gas connections to be removed entirely.
• Enable easy access to finance for all building typologies for replacing appliances with repayments through savings in energy bills.
• Leverage Government procurement to support local manufacturing of electric appliances.
• Work with the hospitality sector in particular to understand and improve electrification of kitchens and venues to improve health outcomes and save businesses money.
What is the environmental impact?
It would reduce gas consumption by around 18 TWh, but could increase electrical consumption by around 26%. Overall, with renewable electricity, emissions would be reduced by 5.5 million tonnes of CO267.
• Prioritise retrofits of affordable and social housing to reduce cost of living pressure.
• Victoria has already phased out new residential gas connections from 2024, with plans to expand the legislation to include new commerical building and existing residential buildings63.
The cost and return has been estimated based on converting all households to 100% electric at the end of the working lives of their heating and hot water systems.
Non-residential costs and returns have not been considered in this section. These costs are considered in the Efficient Architecture section. The graph to the right does, however, account for their increase in grid electricity consumption.
1.5 million residences with grid connections will each save around $1.5b annually in a combination of gas connection fees, as well as the increased efficiency of electrical equipment64 65 .
Full electrification of residential homes could save each household $1,000 each year and create 975 jobs. 64 65 66.
How much space will it take?
In some buildings this may require additional space, as heat pumps & hot water storage can take up around five times the space of gas hot water. The spatial requirements for single dwelling homes are not dissimilar to gas.
How much will it cost?
The additional cost of replacing every residence’s gas appliances with electrical units has been estimated to be $4.26 billion* 68 69 70 71.
What is the return on investment?
Through savings in gas connection fees as well as improved efficiency of electrical appliances, it has been estimated that this will save residents around $1.5 billion annually64 65, paying itself off in around 2.9 years*
Electrify Architecture
Southbank Apartments Car Park: Clare Cousins Architects
Project Summary
Through the decommissioning of carbon intensive gas infrastructure and its replacement with a spatially efficient electric alternative, an opportunity for broad scale community development arises…
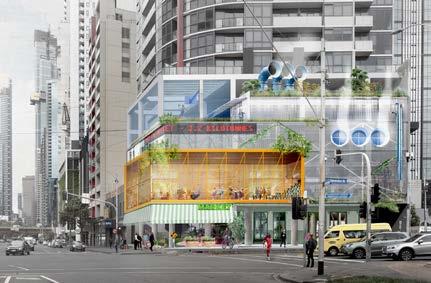
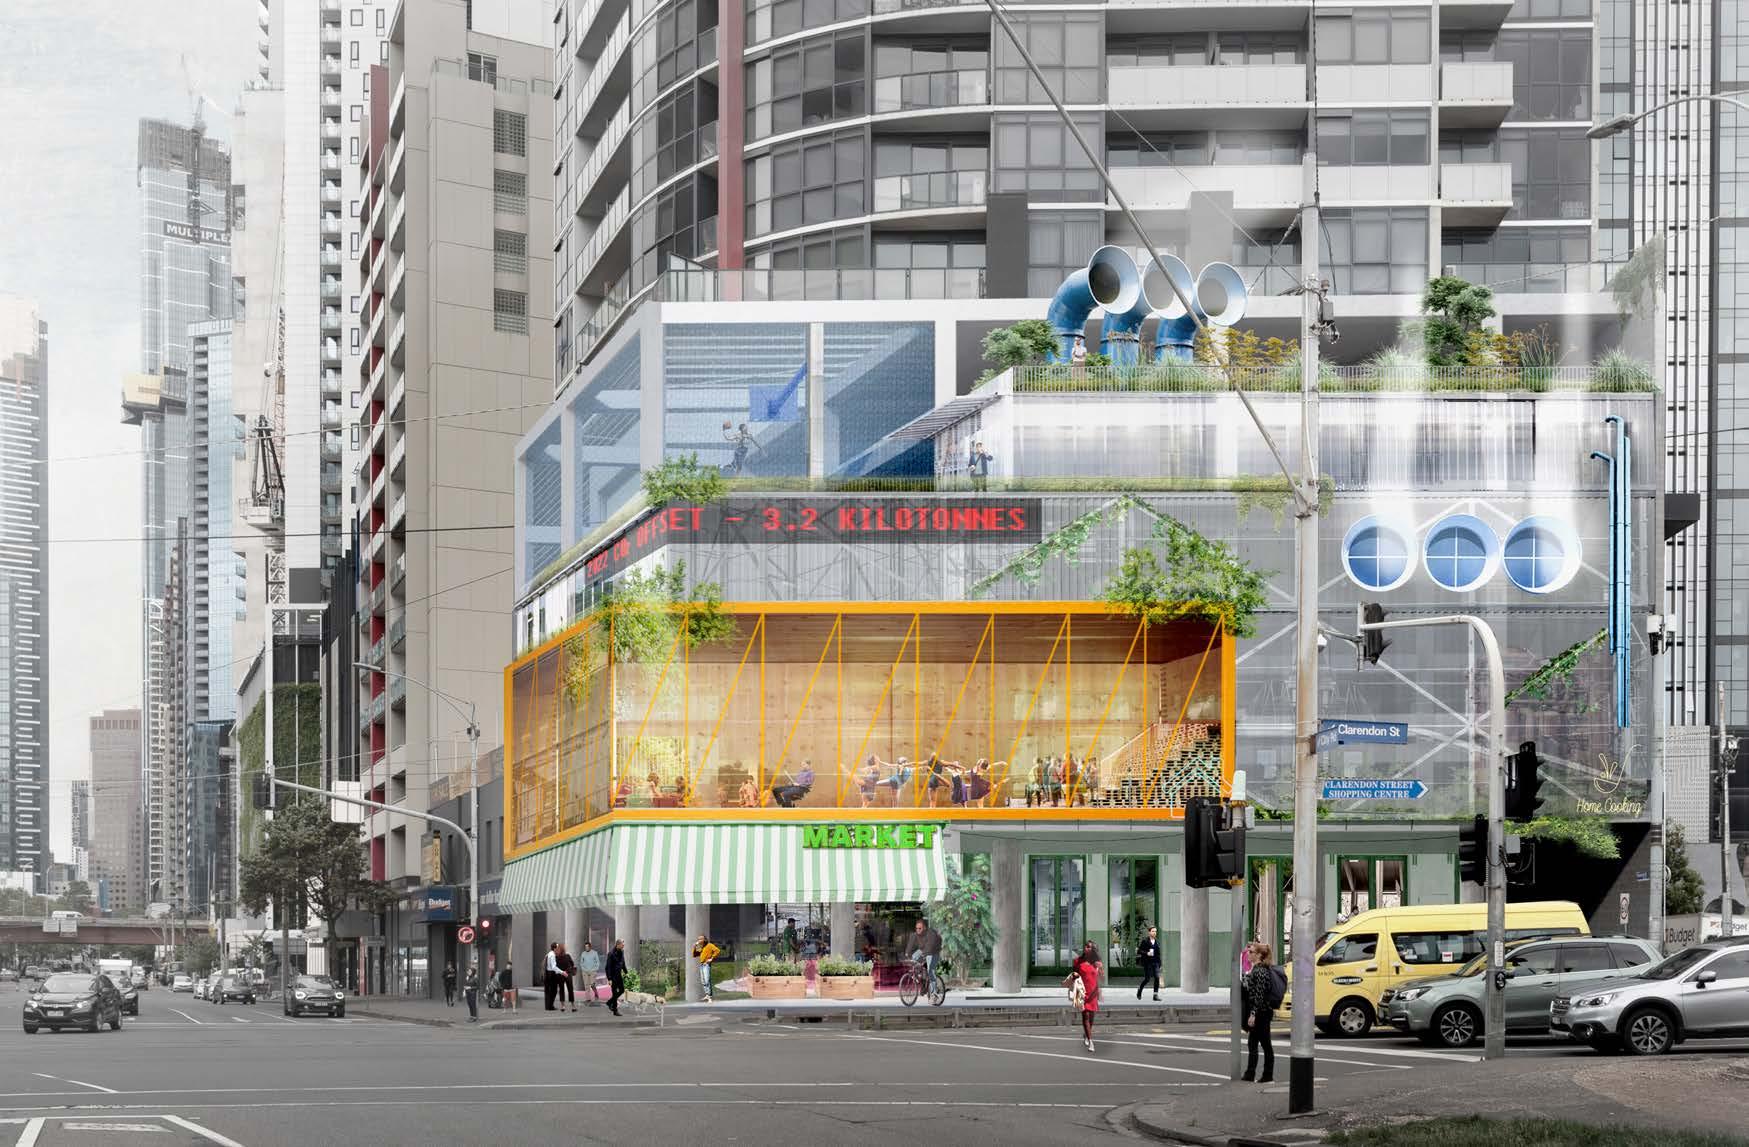
In an effort to help re-pedestrianise Southbank’s problematic commercial zone, City of Melbourne have recently banned exposed podium car parking; opting for a slightly more activated veneer of apartments. If coupled with New Normal initiatives, the momentum toward a pro-pedestrian and genuinely engaged Southbank can be taken to a fully realised and activated outcome. With minimal demolition and by utilising a building podium’s existing structure, this proposal seeks to capitalise on the reclaimed space of an electrified building stock.
These reclaimed spaces are programmed with the much needed community facilities that are painfully absent from the Southbank fabric. Once a car-park, now a basketball court, a coworking space, a ground floor market all provide the civic amenity from which a community can grow.
Efficient Architecture
The Challenge
Existing buildings present a much larger problem — and a larger opportunity — than new buildings.
Existing building stock around the globe is typically inefficient. And nearly two thirds of the building stock that exists today will still be in use in 2050 — we only add 1% of new housing stock per year73
Reducing energy consumption through retrofitting buildings is a significant and cost-effective opportunity.
In their Energy Efficient Buildings Plan, Beyond Zero Emissions (BZE) estimate that energy efficiency could result in a reduction of 53% in residential energy consumption (23% when not including the savings from electrification discussed previously) and 44% in nonresidential consumption66.
Where Is This Currently Happening?
Germany
Ecoworks revolutionises the construction industry by developing products and processes that enable rapid serial renovation of existing buildings.
• The core product is prefabricated elements for facade and roof.
• The Living Lab Mönchengladbach were 20 residential units transformed into energyplus houses that met NetZero standards.
• A new photovoltaic system and minimal thermal bridges within the facade elements, achieved a significant increase in energy efficiency.
• Energy requirements before renovation were 292 kWh/m2a and after dropped to a significant 22 kWh/m2 74
Netherlands
Launched in 2013, Energiesprong is a marketled initiative for retrofitting homes to net zero energy using prefabricated elements and innovate technologies.
• Carbon reduction through energy efficient whole house upgrades using a business and policy model.
• Energy use reductions of 150kWh/m2 and 70% reduction in total energy consumption.
• Emphasize health and comfort that will optimise designs for repeatable manufacturing and installation of specific building typologies75.
Shanghai
Changning District has established a dedicated entity in sustainable building retrofitting.
• China’s first online platform for monitoring energy performance in buildings, working closely with municipal and national government to offer subsidies to incentivise investments in retroffiting.
• Retrofits have been rolled out across half of the public and commercial space, with energy reductions of between 20% and 30% per building.
• Overall preventing emissions of approximately 190,000 tonnes of carbon dioxide annually, which is the equivalent of removing 65,000 cars from the streets76.
Melbourne
The William Ngarrang Retrofit project set an example of environmental, social and financial benefits of retrofitting existing apartment blocks in Melbourne’s inner city.
• Kennedy Nolan completed a minimal -intervention upgrade an existing 70’s block, overall improving its thermal performance, extend its life-span and increase amenity for tenants.
• Key targets consisted of: a net-positive energy output, zero-waste operations, zerowaste construction as well as others.
• 80% reduction in bills for tenants77
UK
The Retrofit for the Future programme explores how existing homes can be improved to use less energy, cut carbon and save costs.
• It is a £17m programme funded by the Technology Strategy Board.
• Claims to reduce energy usage and carbon emissions as much as 80%.
• Fabric insulation installation help reduce space heating demand by as much as 95%78
Efficient Architecture
A New Normal Solution
Mandate the retrofit of all existing buildings using only profitable initiatives.
This approach will reduce the environmental impact of buildings, lower costs for owners and occupants, and improve health, comfort, and resilience.
Governments and banks should assist in financing upgrades, allowing these to occur at no up-front cost to residents, tenants and building owners — but instead be paid off through savings in future energy bills.
Existing buildings need to be professionally reviewed, with all costeffective initiatives identified being implemented on a case by case basis. Depending in on individual feasibility, initiatives may include:
• Improving building fabric
• Building sealing
• Glazing
• Insulation
• Thermal breaks
• Upgrading inefficient water heating and HVAC
• Heat recovery ventilation
• Upgrading inefficient appliances
What is the environmental impact?
A 31% reduction in energy consumption for residential buildings79 and 29% for commercial office buildings80.
and electronics
• Replacing inefficient lighting with LEDs
• Upgrading water fixtures and fittings.
Savings estimates are based on the BZE Energy Efficient Buildings Plan66, scaled by population to reflect Melbourne. Jobs, costs, efficiency improvements and savings for residential building electrification are not included in this section as they have already been considered in the previous section, however non-residential electrification is included.
How much space will it take?
Spatial requirements are generally minimal. Some increases in wall thickness may be required to accommodate additional insulation.
How much will it cost?
We estimate the capital cost for Greater Melbourne at $45.7 bn*.
What is the return on investment?
This is estimated to save around $4.5 billion annually, resulting in a simple payback of around 10 years*.
Our cities are home to solid, functional, beautiful structures from all ages of history. How can they be part of a future in which buildings touch the earth more lightly, and deliver more for people whilst consuming less?
What better way than to wrap them up in a quilt of insulation?
Fabric first upgrades drastically reduce the energy footprint of existing buildings. We propose full Passive House retrofits, which replace inefficient glazing, seal gaps and add appropriate insulation to protect the indoor environments from external extremes. We propose building resilience into our cities without having to start from scratch. We have all the knowledge and technology to do this right now.
This is win-win: improve comfort; improve health; slash emissions. We can – and should – normalise a culture of valuing our existing structures for what they are, and unearthing their hidden potential to be part of our thriving, low impact future.
Efficient Architecture
Schools for the Future:
Kosloff Architecture
Project Summary
This proposal looks to integrate future and flexibility in school design, giving Victoria the opportunity to lead the way in environmental education architecture. Reducing energy, water and waste on-site through practice and education offers an opportunity to transform the educational landscape into a healthier, more adaptable learning environment that serves communities for generations to come.
Key Statistics
Australia has committed to the Paris agreement to pursue efforts to limit temperature increase to 1.5 degrees celsius above pre-industrial levels.
• To meet this target the required upfront embodied carbon reduction in schools needs to reduce from 697 to 21 kgCO2eq/ m2 by 2050.
Greater Melbourne has ~1,750 schools and 800,000 students. Together, they consume annually:
• 3,200 ML of water
• 240,000 m3 of waste
• 266 GWh of electricity
• 250 GWh of gas
• 0.41 Mt CO₂ emissions
Upgrading schools could deliver:
• 30–100% energy savings (150–500 GWh/ year), saving $45–$110M annually
• 120,000–400,000 t CO₂ reduction—equal to removing 25,000–90,000 cars
• 30–100% water savings (1,000–3,200 ML/ year), saving $3–$10M annually
• 35–100% waste diversion (84,000–240,000 m3)—equal to filling 1,300–4,000 school buses
Efficient Architecture
Retrofitting Vacating Buildings into Mix Programs with Resdential: Barraco+Wright
Project Summary
The expansion of Melbourne’s urban form as well as the resources required to build new buildings continue despite the identification of thousands of vacant buildings across the city. This proposal focuses on urban and environmental regeneration through adaptive reuse of existing vacant buildings through mixed programs including residential as an alternative to continued growth.
Key Statistics
• According to Prosper Australia, 10.9% of non-residential properties across Greater Melbourne (approximately 15,000 properties) might be vacant.
• Converting vacant commercial/industrial properties to residential dwellings can provide up to 235,000 new dwellings/ units/apartments. And based on average apartment floor area in Melbourne this is over 40% of the 560,000 new homes required as part of the combined Plan Melbourne and Victorian Housing Statement goals .
• Converting vacant non-residential buildings to dwellings can represent up to 5 MtCO2 of embodied carbon emissions (equivalent to ~12.5 million m3 of concrete), a 40% reduction on building new apartments.
• Savings of ~$400/m2 have been estimated for converting rather than demolishing and rebuilding vacant buildings, suggesting $6.5 billion can be saved across the portfolio.
Esther Stewart
Renewable Energy and Storage
The Challenge
Our energy system runs almost entirely on fossil fuels. These are finite, emit carbon dioxide and other particulates, which have heath and environmental implications82.
The economic cost of air pollution is already 6.1% of the world's GDP, an eyewaters $8.1 trillion USD83. Air pollution lowers life expectancy by 1.8 years globally and kills more people annually than smoking82 84.
Only 38% of Melbourne’s electricity consumption (or 13% of its total energy consumption) currently comes from renewables81.
Where Is This Currently Happening?
Copenhagen Denmark produces 67% of the electricity supply from renewable energy of which wind energy contributes 46.8%.
• Copenhagen contributes significantly to this with 20 turbines for a total of 40MW, located in one of Copenhagen’s harbours, and is highly visible from a number of vistas.
• Copenhagen tackled the challenge of “visual disturbance” in wind power development by fostering the creation of cooperatives among local residents. These cooperatives enabled residents to collectively own and benefit from nearby wind power installations88.
Honululu
The US now has more than 121 gigawatts of solar energy capacity installed, according to the Shining Cities 2022 report, which is enough to power more than 23 million homes.
• Honolulu — the country’s top solar generator — has 1,133 watts of solar capacity installed per person, which is equivalent to more than three solar panels for each person in the city.
• Honolulu boasts over 80,000 solar installations and a total installed solar capacity of 391 GW89.
Buildings must become more energyefficient and fully electrified — but just as importantly, they need to generate their own power.
The most common fear about the transition to renewable energy concerns the volatility of wind and solar generation85. While these fears are understandable, current renewable energy and storage technologies are fully capable of meeting Australia’s energy needs—even during peak demand periods such as winter evenings or overcast days—without relying on traditional 'baseload' generation.86.
Netherlands
A study by Leiden University in the Netherlands and the National Renewable Energy Lab in the US shows that vehicle-to-grid (V2G) technology could supply all of the world’s short-term grid energy storage requirements by 2030.
A vast amount of energy storage will be built into the electrified transportation system through vehicle batteries, limiting the requirement for additional energy storage. Vehicle to grid charging and discharging is becoming increasingly prevalent across the world and this enables our mobile energy storage in our transportation system to act as energy storage for our stationary energy system90.
Additionally, energy will be stored in the form of hot and chilled water and this storage capacity can be used in combination with existing and planned grid-scale pumped hydro energy storage in the Snowy Mountains, other east coast sites & Tasmania87
Adelaide
New data shows South Australia is on track to achieve net 100 per cent of electricity generation from renewables by 2027.
• Sourcing energy from Clements Gap Wind Farm, Streaky Bay Wind Farm and Coonalpyn Solar Farm and additional localised solar systems throughout the CBD centre, the City’s operational greenhouse gas emissions have been reduced by 50%.
• By 2025/26 the project is estimated to reach an 85% target of net renewable energy.
• 75% of Adelaide’s renewable energy is sourced from wind energy, with the remaining 25% generated from solar.
• Saving of $300,000 on electricity and 760 tonnes of CO2 annually.
• $20 billion planning to be invested in the Renewable Energy Project Roadmap92 93
• A participation rate of just 12 – 43% would be enough to provide the entire short-term capacity needed globally.
• The report’s findings include both in-use and end-of-vehicle-life use phases and calculate that V2G could provide 32-62 TWh of short-term storage globally by 205090
Renewable Energy and Storage
A New Normal Solution
Announce a ban on coal fired generation by 2030 and incentivise investment in grid scale renewables in the LaTrobe Valley — while investing in reskilling the labour force in the region.
Currently over 150 km2 of the LaTrobe Valley is occupied by coal generation. Covering only a third of this area with around 5.1 GW of PV* — combined with existing renewables and rooftop PV in Melbourne — would generate enough energy to power well over half the city. The remaining electricity would come from new wind energy projects throughout the region.
Through this it is estimated that around 4,000 renewable energy construction and installation jobs would be created annually to 2030, and around 6,300* ongoing jobs in maintenance and operations.
Solar generation can be combined with agriculture, while wind generation can be combined with forestry to replace cattle grazing, for efficient land use. Finally, in order to make electricity available on demand, convert all parking spaces to allow vehicles to both charge
What is the environmental impact?
100% renewable energy supply for Melbourne, including for all electrified buildings, industry and transport.
and discharge using vehicle to grid (V2G) technology. It is estimated with bulk purchasing and product development V2G chargers will cost around $5,000 per unit including installation94.
This solution creates a distributed storage network across the entire city. Widespread implementation of V2G would allow the 1.5 million electric cars to be used as grid storage — creating an additional 44.5 GWh* of storage capacity. This is 13 times larger than the world’s largest battery (currently in California)92. Buses, logistics fleets and other vehicles will provide additional stability and storage beyond the 1.5 million passenger cars.
How much space will it take?
Around 81 km2 of space on existing rooftops* within Greater Melbourne, as well as around 990 km2 of land* in VIC for grid scale renewables, which can also be used for other purposes.
How much will it cost?
Around $25.5b including small scale generation, grid scale generation and storage*.
What is the return on investment?
Based on average wholesale electricity prices, the expected income has been estimated to be $3.7 billion annually, resulting in a payback of under 10 years.*
Renewable Energy and Storage
Multi-level car park battery bank: Hassell
Project Summary
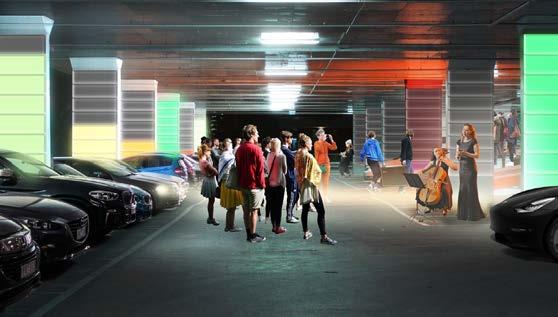
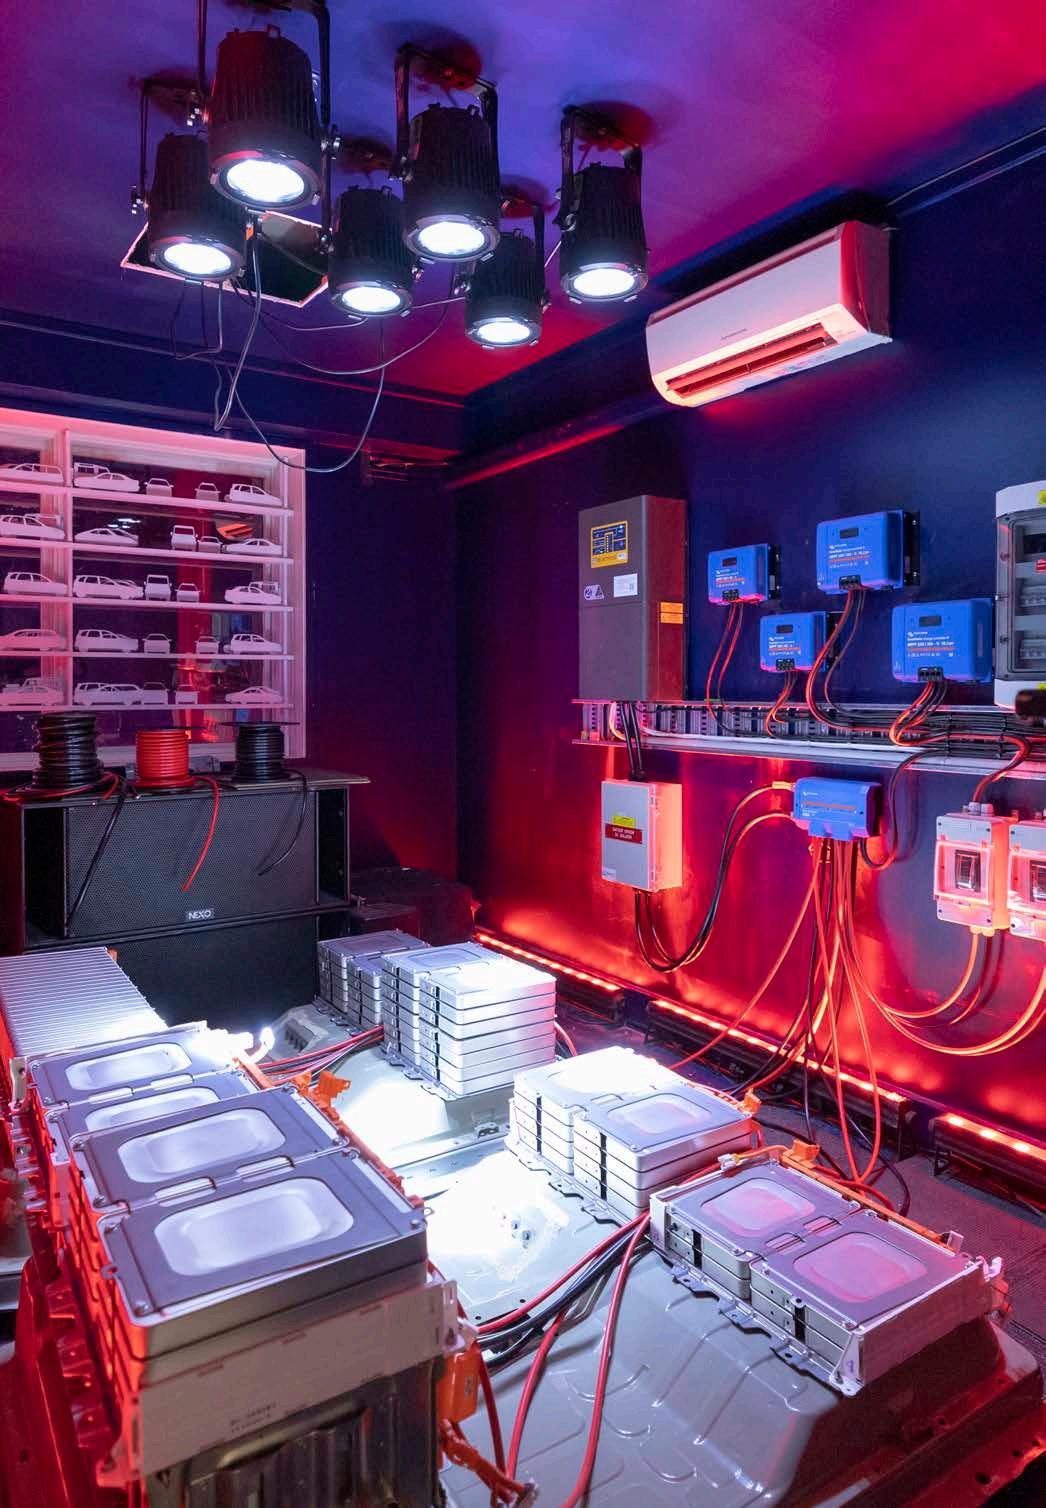
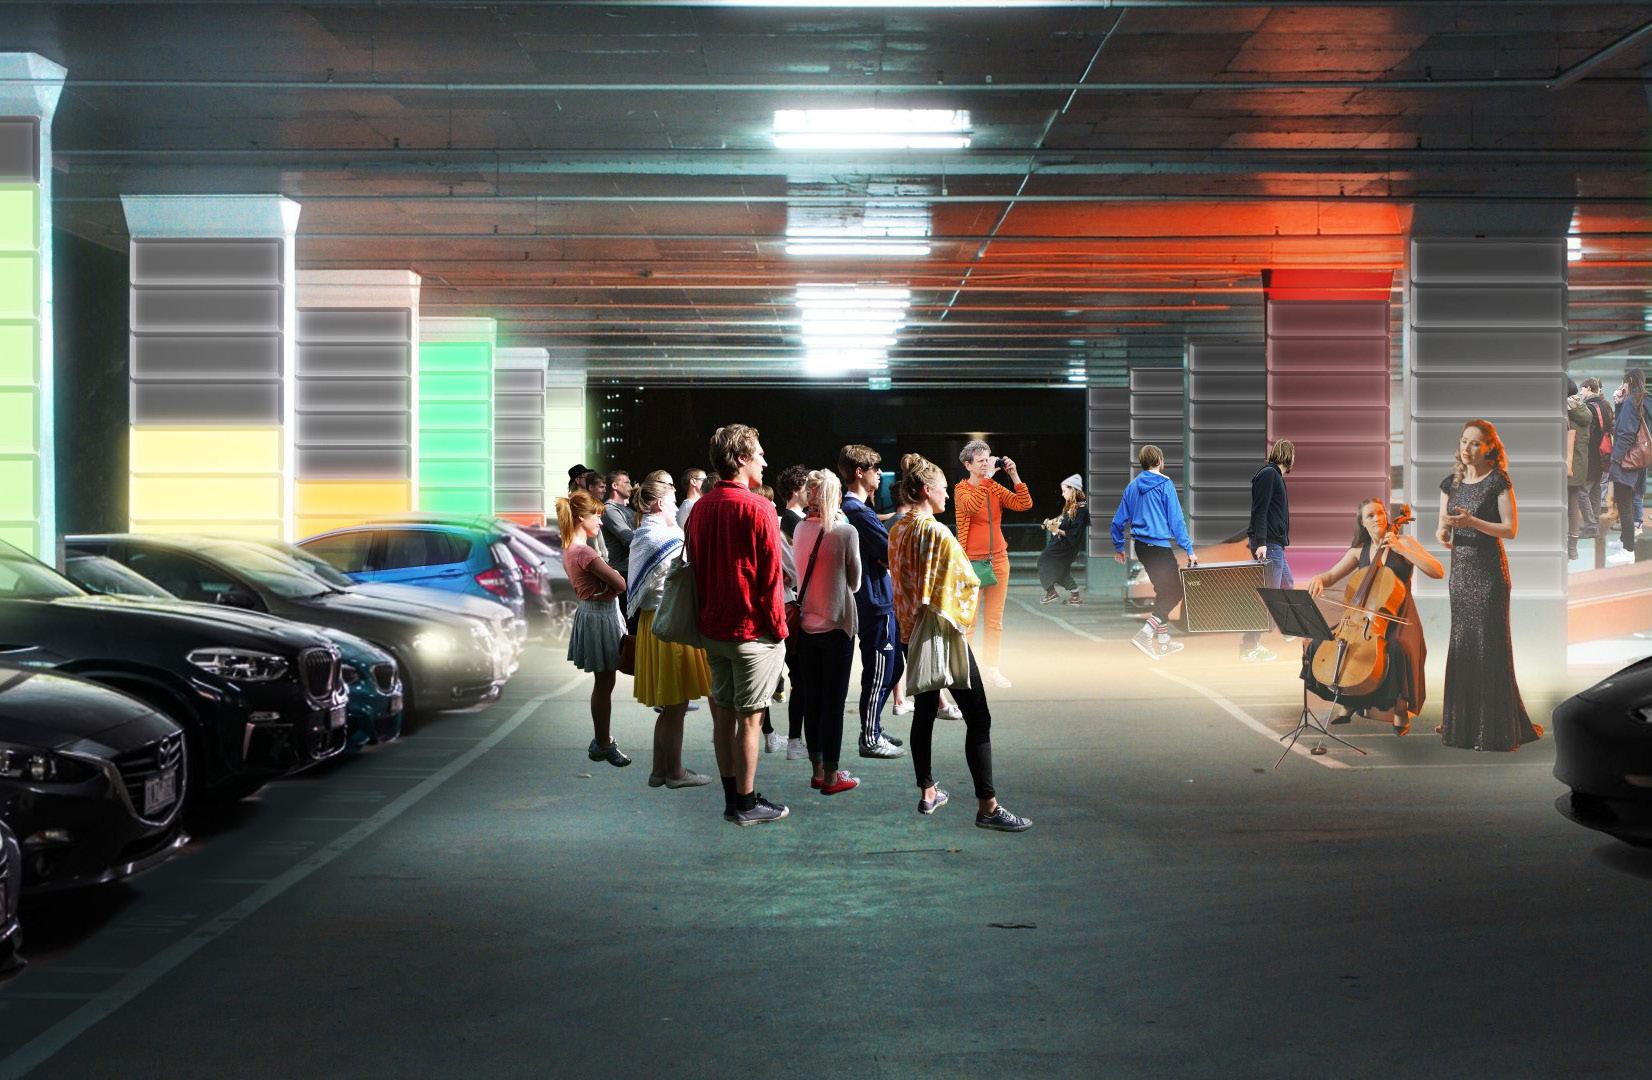
In this project we take an existing multilevel car park in Little Collins Street and alter its purpose. The car park becomes a home for electric cars and their batteries are linked together to store and discharge the energy for the city.
Application of this Vehicle to Grid (V2G) technology in Melbourne is important. As a way of accelerating the uptake of this technology the approach is to create a connection with the people of Melbourne through a multipurpose use of existing carparks. The dual uses being both technology & culture.
When the city’s workers disperse home, the car park is emptied. Performers and the people of Melbourne are invited into this void. The battery powered cars and bikes of the audience then focus their energy on powering the performance. The car park is activated; the surrounding area is transformed. The building connects the cities people, and is enlivened by it.
Renewable Energy and Storage
Melbourne’s Rooftops:
John Wardle Architects
Project Summary
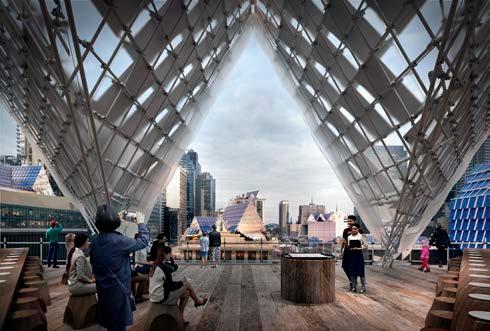
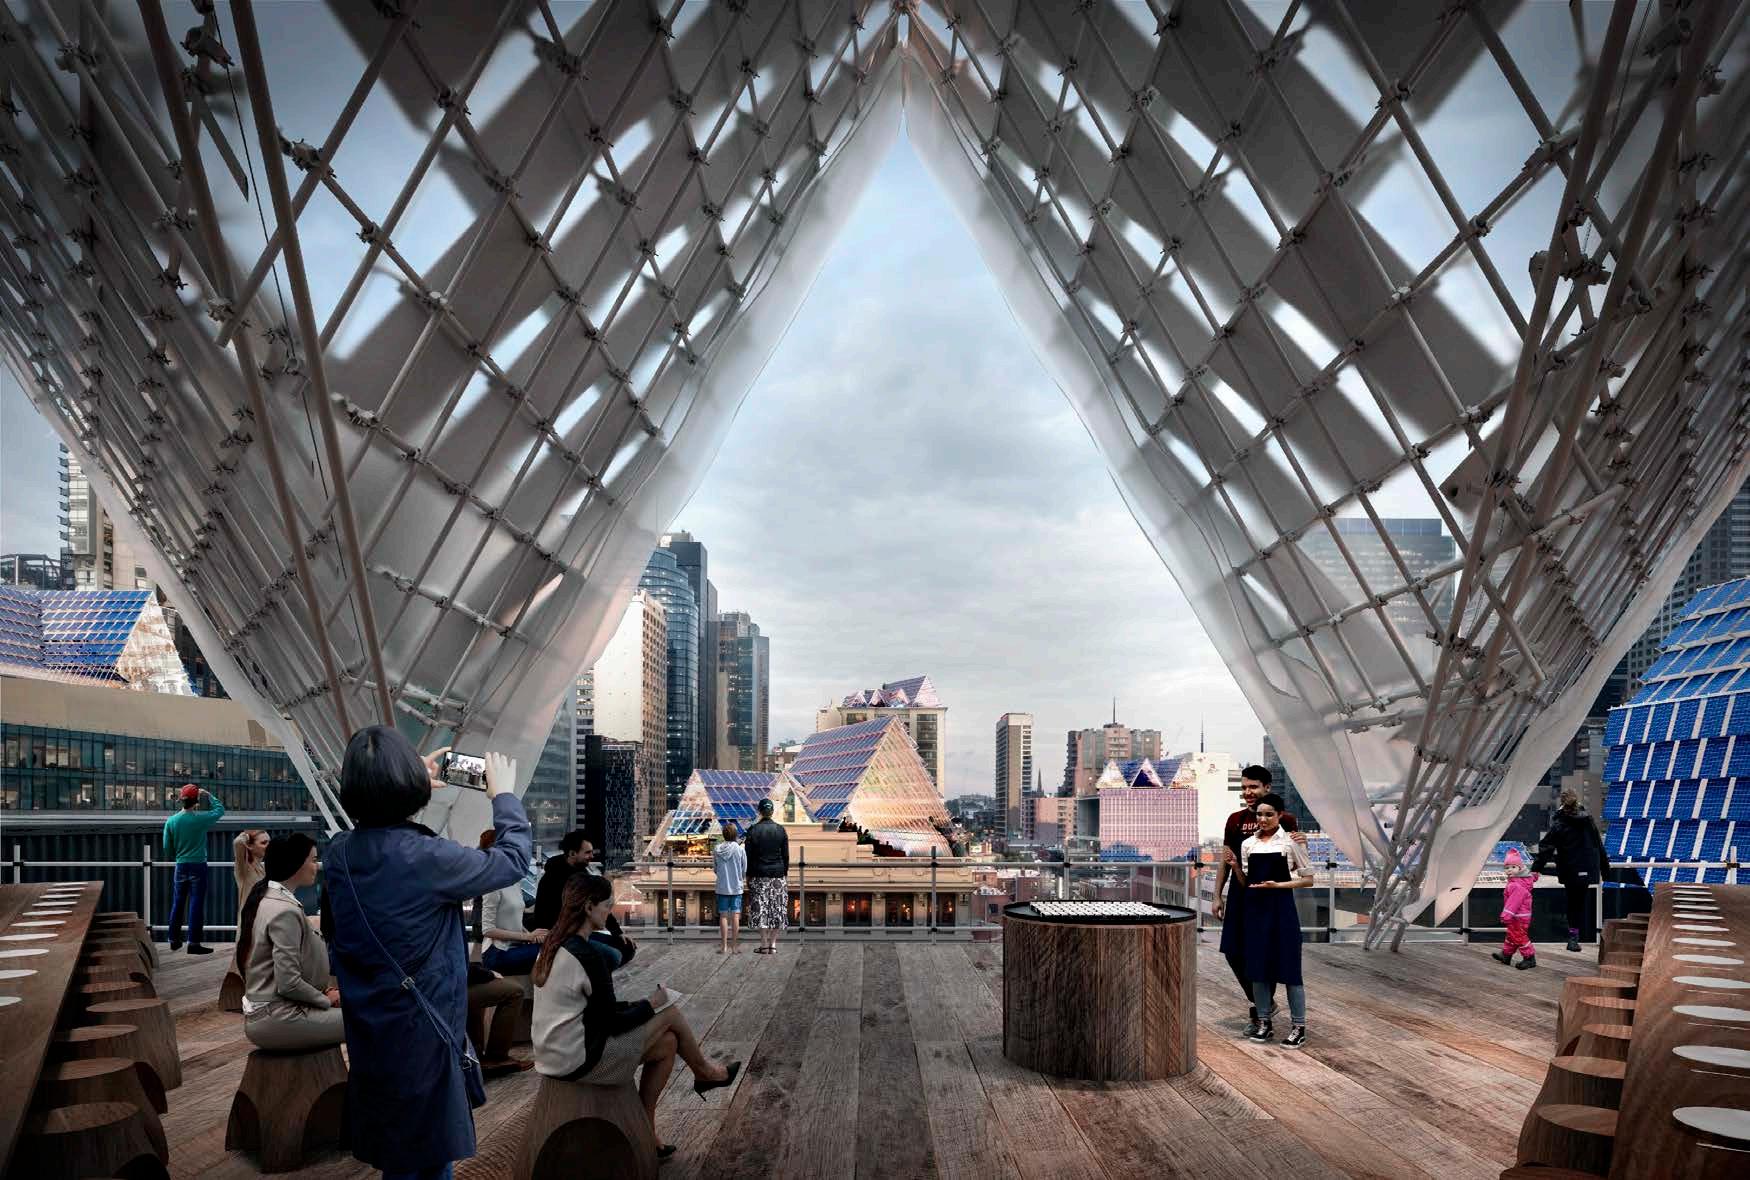
In Melbourne, there is a culture of converting unused rooftops to thriving venues. The vertical laneway of Curtin House famously culminates in a rooftop cinema. In other places, restaurants and bars pop up to occupy the city’s fifth elevation.
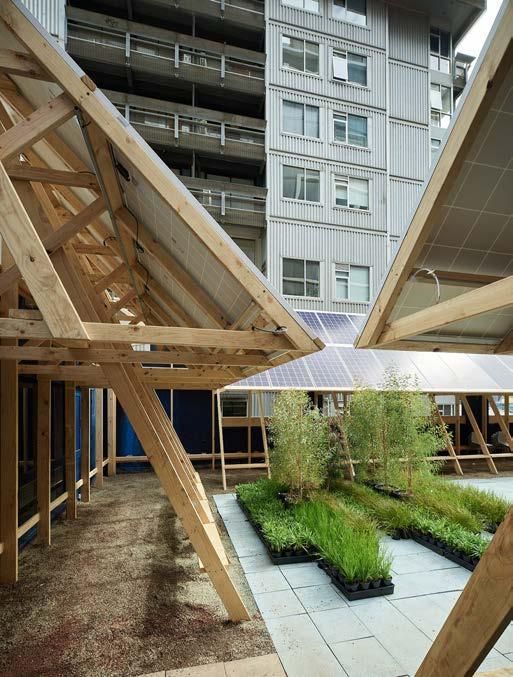
With this in mind, a new solar architecture takes the form of a rooftop module that is made of simple components assembled into a tentlike form. It is both the infrastructure to carry photovoltaics and a new place for Melbournians to experience. These habitable solar arrays recognise an existing pattern of use. There is a layer added to the city - of bars, cafes, clubs, dining and performance – that builds upon what is already here. The new spaces prompt ideas for other uses too - learning spaces, co-working offices, artist studios, gardens and galleries.
These activities are wrapped in photovoltaics that generate all the electricity they need and more, contributing back to the grid. The roofs that enclose them are steeply pitched to maximise the catchment area and to capture the sun. There is a rawness to the supporting structure, with the appearance of temporary scaffolding and the photovoltaic panels are simply bolted together. The open-ended interior space frames views and feels protected, warm and inviting.
The tent forms are infinitely flexible to suit different rooftop conditions and uses.
In plan they can be arranged in a circle, as a starfish, in X and Y-shapes, as a larger field and, of course, in a single line. The modules also support climbing vines and plants to frame garden pockets.
Melbourne’s rooftop culture is amplified, expanded and electrified.
Energy and Storage
Welcome to the Valley of the Sun: Ha
Project Summary
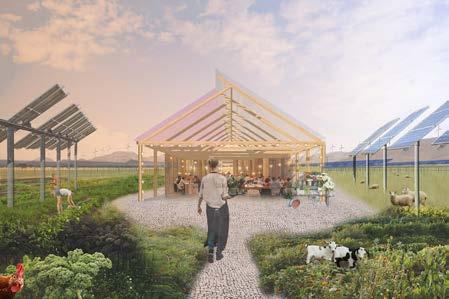
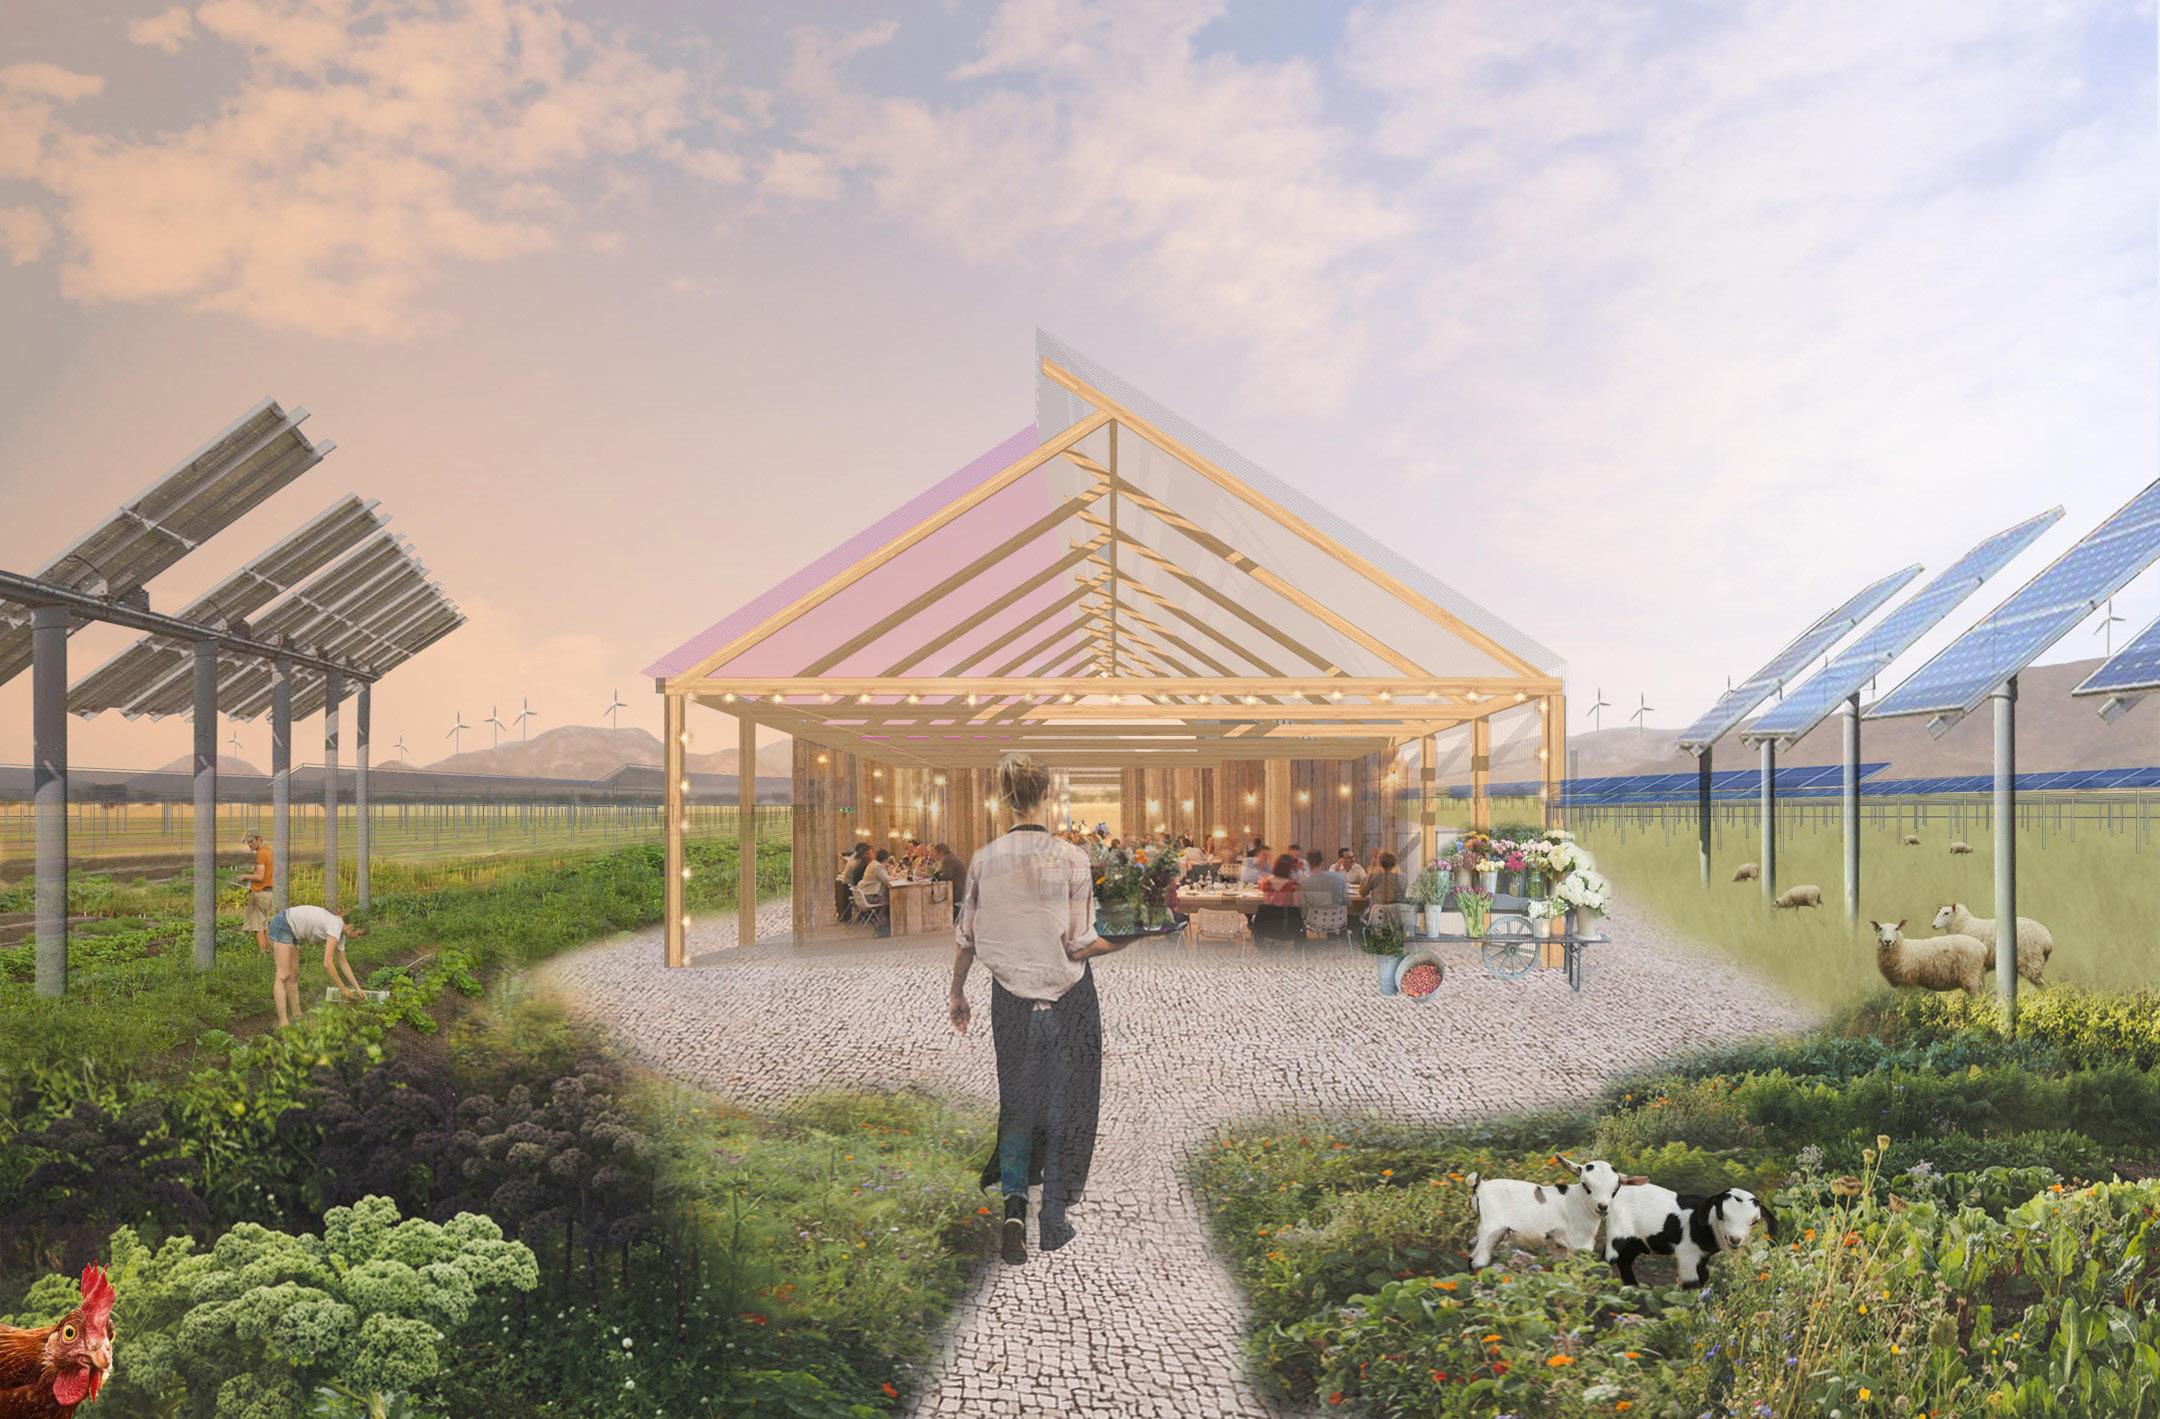
A Latrobe Valley where solar agriculture underpins a 21st century economy — and one that provides 50% of Greater Melbourne’s power.
What is solar agriculture? It’s simple — the mixed use of agricultural land for both food production and energy production (through solar farms). It’s not theoretical. It’s tried and tested. And it delivers.
For the Valley it offers jobs and a safer, cleaner environment — while maintaining the region’s proud identity as an energy producer.
For the City of Melbourne it is not just a clean energy supply, but a vast new food bowl to feed our growing metropolis.
But how do we make sure we bring the local community — and Melburnians — along for the ride?
By quite literally giving them a taste of solar agriculture in the Latrobe Valley.
What you’re looking at is a prefabricated and repeatable greenhouse structure and restaurant. People visit, walk the property — and enjoy a day featuring food grown right there on the property. In a building powered by the solar they see all around them.
It’s an immersive, delicious, experience of our energy future.
With
Water Unlimited
Melbourne might soon run at a water deficit
Melbourne’s population grew by 140,000 in 2024 putting additonal stress on our water supplies 96
Whilst in 2025 storage levels are relatively high over the long term, Victoria will become warmer and drier 95
Desalination is an expensive water source. Around 10% of treated water is reused 96
and cost effective water supply for future generations.
The Challenge
By 2030, almost half the world’s population will be living in “high water stress” — with water becoming increasingly scarce98.
We live in the driest continent on the planet, with rapid population growth and dwindling rainfall. Melbourne’s water supply is also predicted to be put under strain due to population growth and more consisted extreme weather events95.
The current contingency plan for Melbourne is a desalination plant, which produces clean water at roughly
Where Is This Currently Happening?
California Orange County Groundwater Replenishment System (GWRS) - provides 70% of the potable water needs.
• World’s largest advanced water purification system for potable reuse
• The system purifies treated wastewater to produce high-quality drinking water.
• Since 2008, GWRS has been producing up to 100 million gallons of purified water per day, helping to reduce dependence on imported water supplies and replenish groundwater reserves.
• Water comes from Southern California community’s sewer system and Santa Ana River99
Paris
France aims to increase their wastewater usage from 1% to 5% in 5 years and reuse 30% of their treated wastewater.
• Saint-Cloud Drinking Water Refining Plant - 100,000 m3/day and only has a 4000m2 footprint. This is Paris’ main drinking water supply attached to a primary aqueduct.
• Reuse 1.5 million m3, out of the city’s 4.5 million m3 of wastewater
• Planning to counter a water deficit of 8 million m3 by 2025-2030100
twice the cost of treated wastewater. Desalination is twice as expensive to build and twice as expensive to operate in comparison to wastewater treatment. The desalination plant in Melbourne is sized to cover roughly 150 GL/year(only 32% of current consumption) 97. This plant is currently costing the state $567 million every year and producing minimal amounts of water for Victoria97.
Currently Melbourne’s water is supplied through catchments near the city. Sewer water is pumped out of the city to two major treatment plants — and still 90% of treated waste water is disposed of at sea96
Singapore
NEWater is the brand name given to reclaimed water treated and used for drinking in Singapore.
• Currently makes up 40% of the drinking water supply
• Expected to rise to 55% by 2060
• Studies by an international group of experts in engineering, biomedical sciences and water technology found that the quality was well within the WHO and USEPA requirements for drinking water
• Launched in 2003, and has since gone through twice yearly independent audits by international expert panels to ensure high quality and safety.104
Windhoek
Windhoek has been drinking recycled water for over 50 years.
• 1% of rainwater becomes ground water due to extreme heat
• Recycled water is supplied directly to the home tap
• Goreangab uses treatments that mimic “nature but a whole lot faster” and first WWTP in the world to produce purified drinking water directly from sewage water
• Uses a process called Direct Potable Reuse (DPR) which extracts, purifies and pots in under 24 hours.103
Perth
Perth plans to recycle 30% of their wastewater and improve potability.
• Perth is pumping recycled water into ground aquifers and into the main drinking supply
• Sydney has opened a “Demonstration” Recycled water plant in Oxley Park to showcase recycled wastewater and safety
• Toowoomba, QLD has a pipeline for purified wastewater into the towns water supply to secure a larger water reserves in times of drought.102
Tokyo
The Ariake treatment plant is located in the Waterfront Urban Subcenter on the shores of Tokyo Bay.
• Ozone-treated wastewater is being reused for toilet bowl use.
• The heat generated by the wastewater is being used to heat and cool the plant’s management building.
• The Naha WWTP launched a big water reclamation project for reuse of water in urban and agricultural applications.101
A New Normal Solution
Ban the disposal of treated water. Treat and reuse water within the city, creating a water source that will never run out.
Greater Melbourne’s sewer water should be treated to drinking water standard via water treatment plants. These treatment plants can be decentralised and distributed throughout the city, then the water produced fed back into the grid.
These plants could be funded publicly to avoid additional spending on desalination, established through public-private partnerships, or funded through community ownership. While there are many combinations that could work including centralised or semicentralised treatment, decentralised treatment plants are recommended throughout the city in order to minimise pumping energy requirements and encourage decentralised ownership.
What is the environmental impact?
The city becomes water neutral, with a water supply that is unlimited.
How much space will it take?
Around 200 treatment plants, each treating 5 ML/day, taking up about 0.9 km2 each without storage (or equivalent to 70,000 car parking spaces).
How much will it cost?
Around $8 billion in equipment costs.
What is the return on investment?
Based on offsetting current costs for connection of sewer networks, these treatment plants could generate around $0.6 billion annually, paying for themselves in around 15 years.
Project Summary
It is a challenge in any location to encourage the general public to embrace treated water in their daily lives. Knowing this, it’s important to prepare the public and normalise the treatment of wastewater to a drinkable standard in Melbourne due to the logic and financial viability in comparison to the higher cost desalination process. The outcome will leave future generations with a more cost effective, secure and high quality water supply.
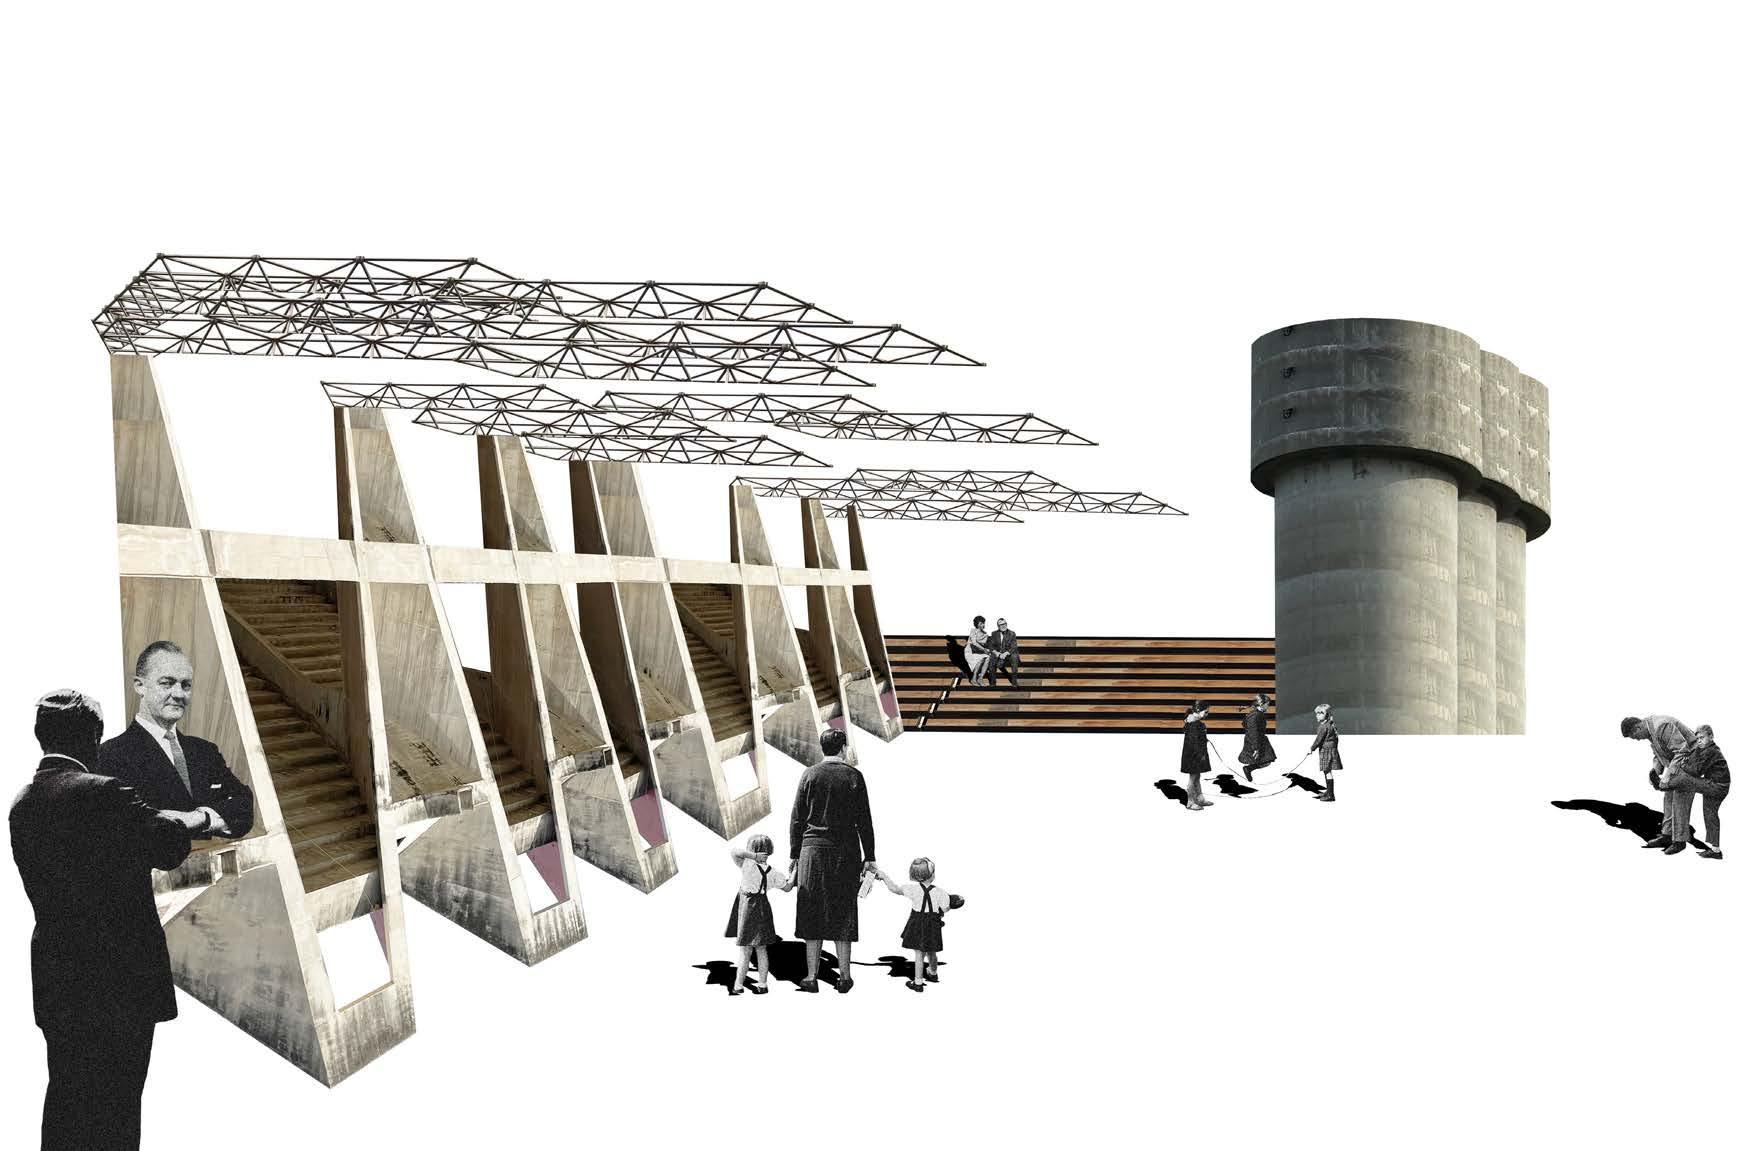
To achieve this we must engage the people of Melbourne with treated water in new ways. This is another example of connecting technology with culture. And in Melbourne what better location to do that than the iconic MCG.
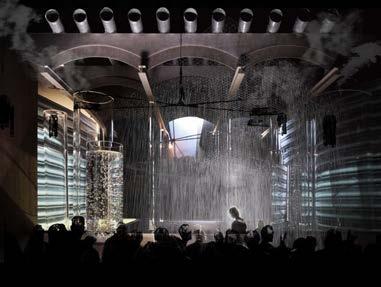
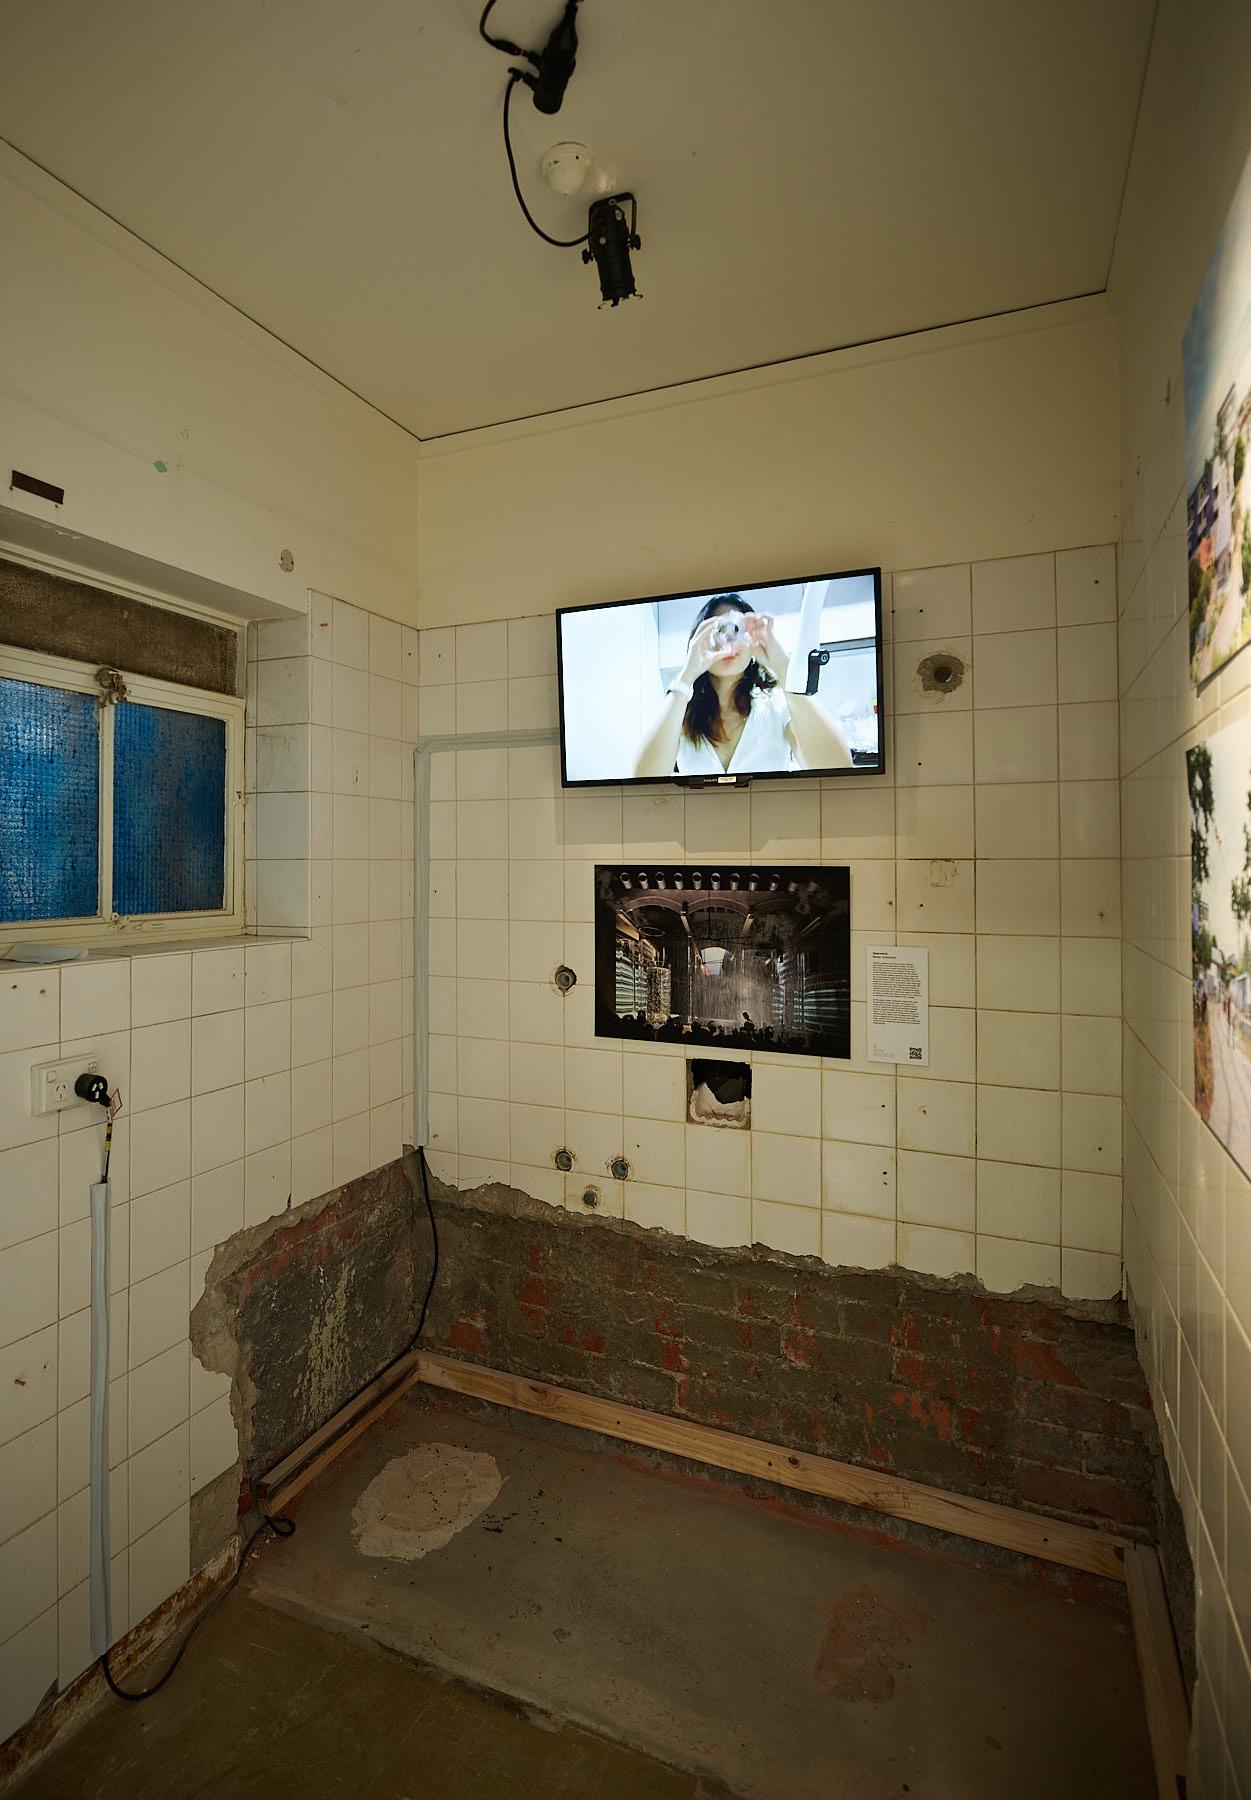
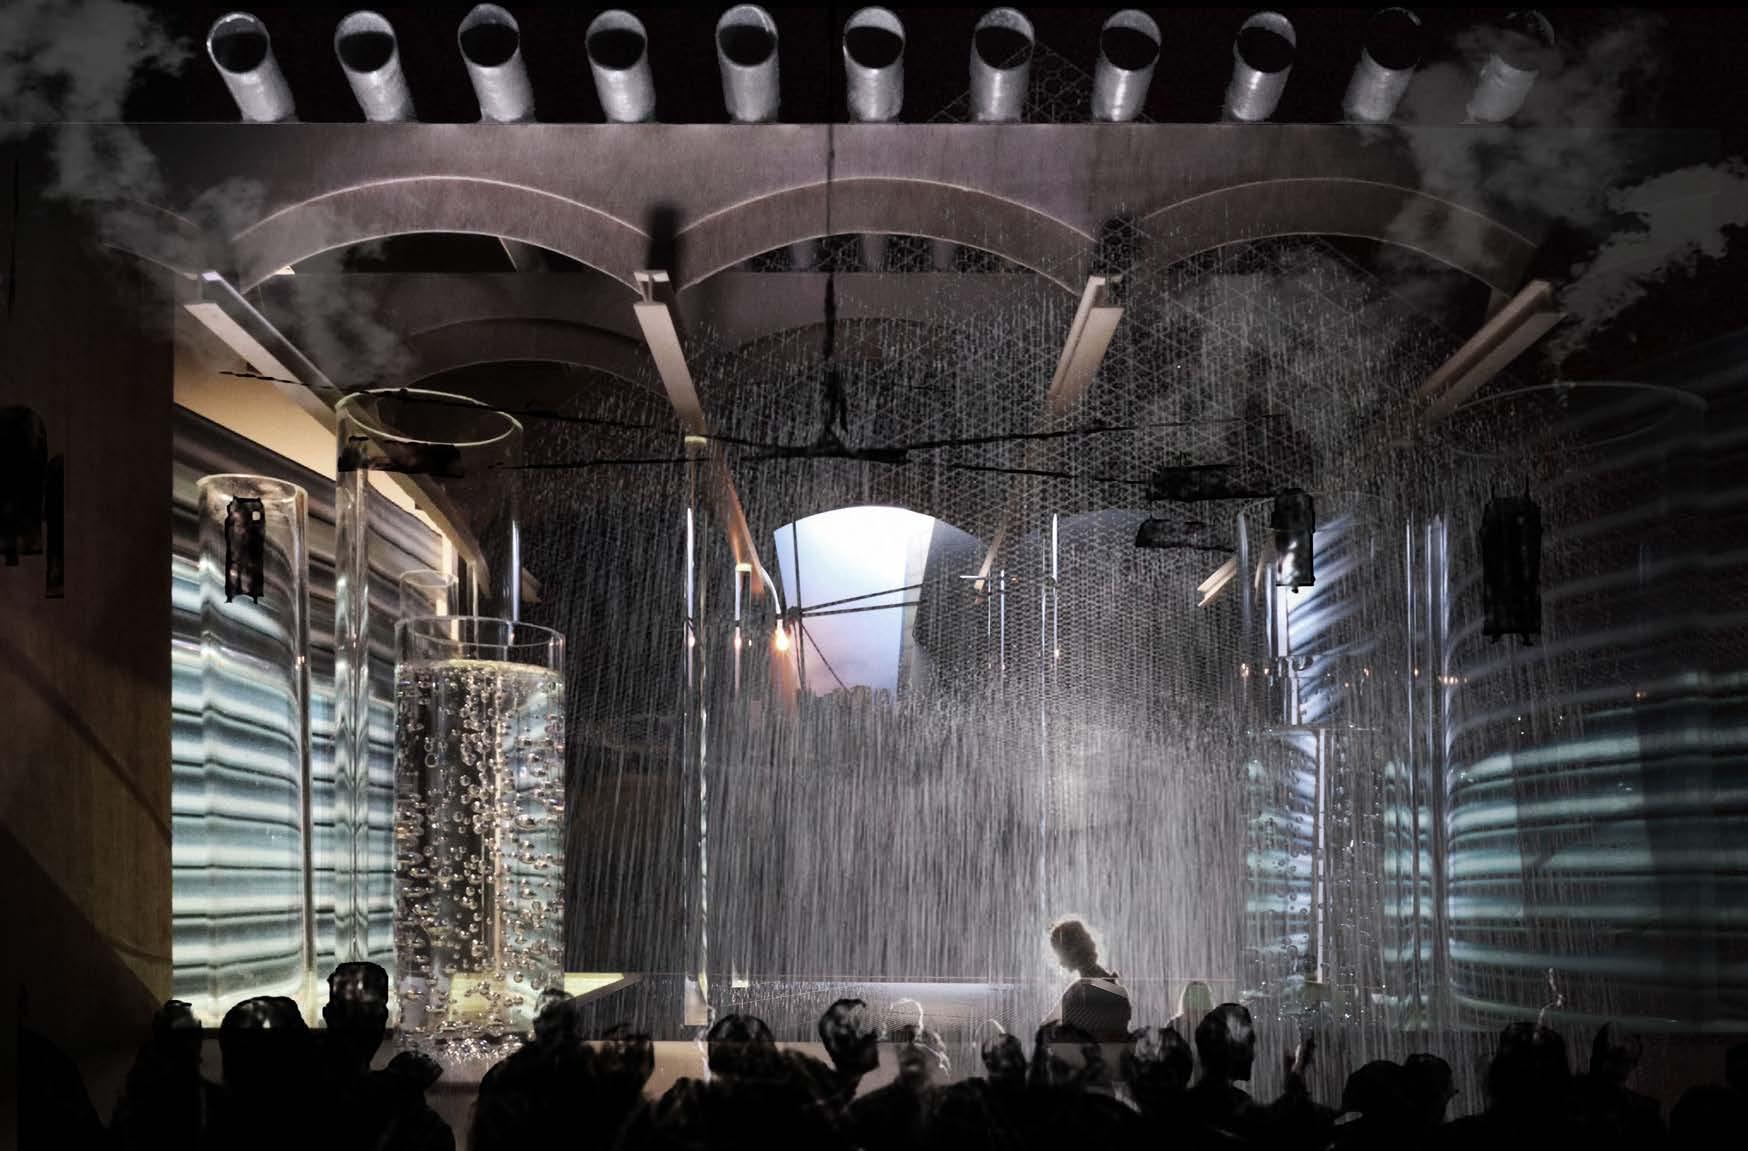
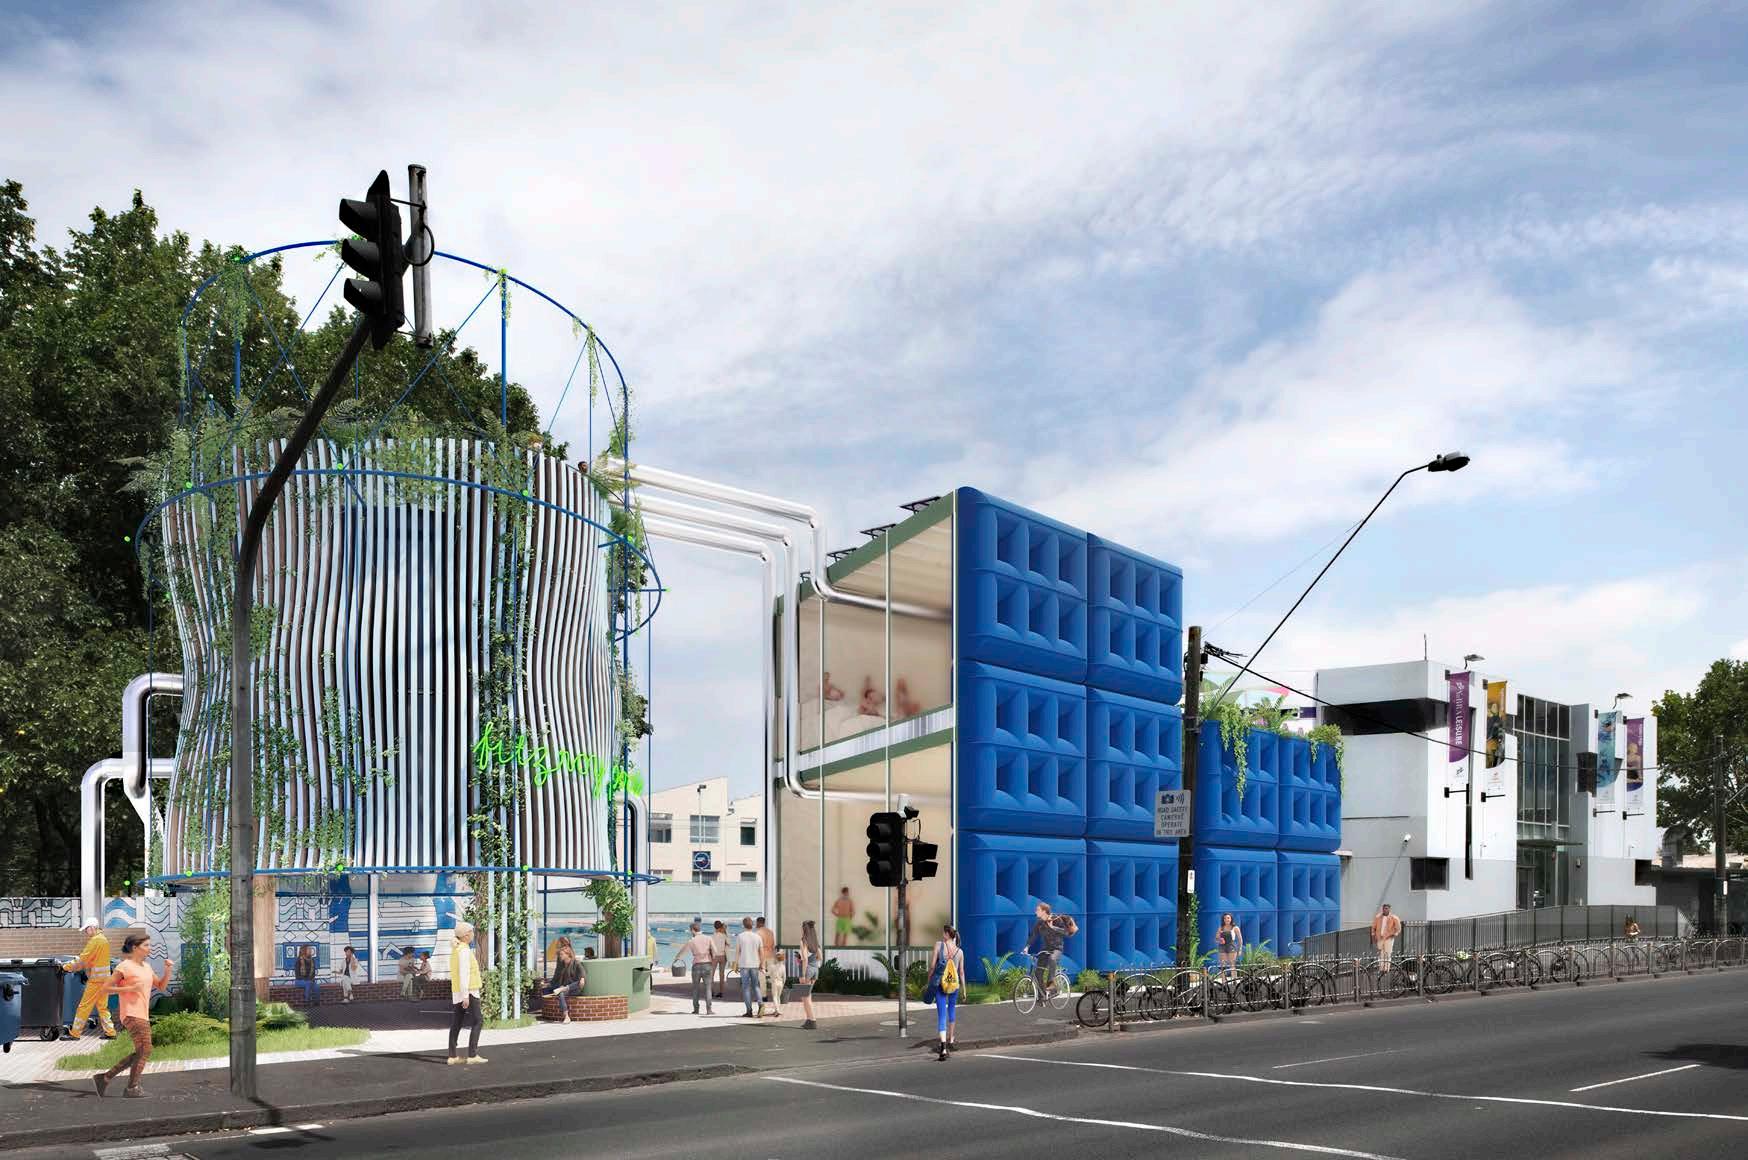
An early adopter of Water Unlimited, The Water Tank Club (or the MCC – Melbourne Cistern Club) has been established as a pilot project under the bleachers at the MCG. Untreated water from the roof and plaza of the precinct is filtered through a series of pipes and tanks forming the walls of the void space under the concrete bleachers of the G. Clean, treated water is stored in tanks that are lit from beneath and used for drinking, swimming and misting - making the air wet and a dripping ceiling – a moist cathedral to celebrate performance, left over space and hydraulic engineering. In a spatial version of ‘beer-goggles’ punters see each other across the room, their normal faces made wonderful and warped through the lens of the clean water tanks. Night’s end is signalled by sun rise, reflected into the space from the Collins Place Towers.
Middle Ring: NMBW
Project Summary
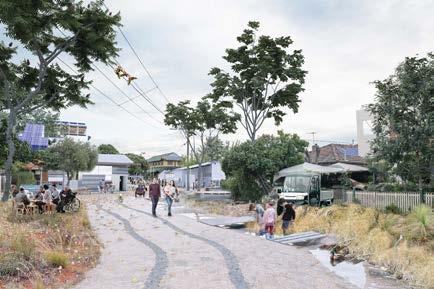
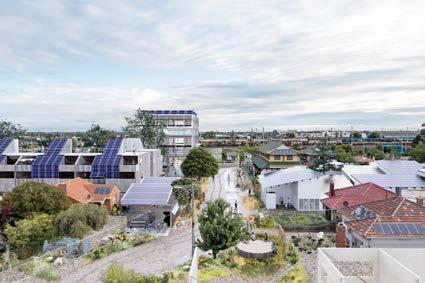
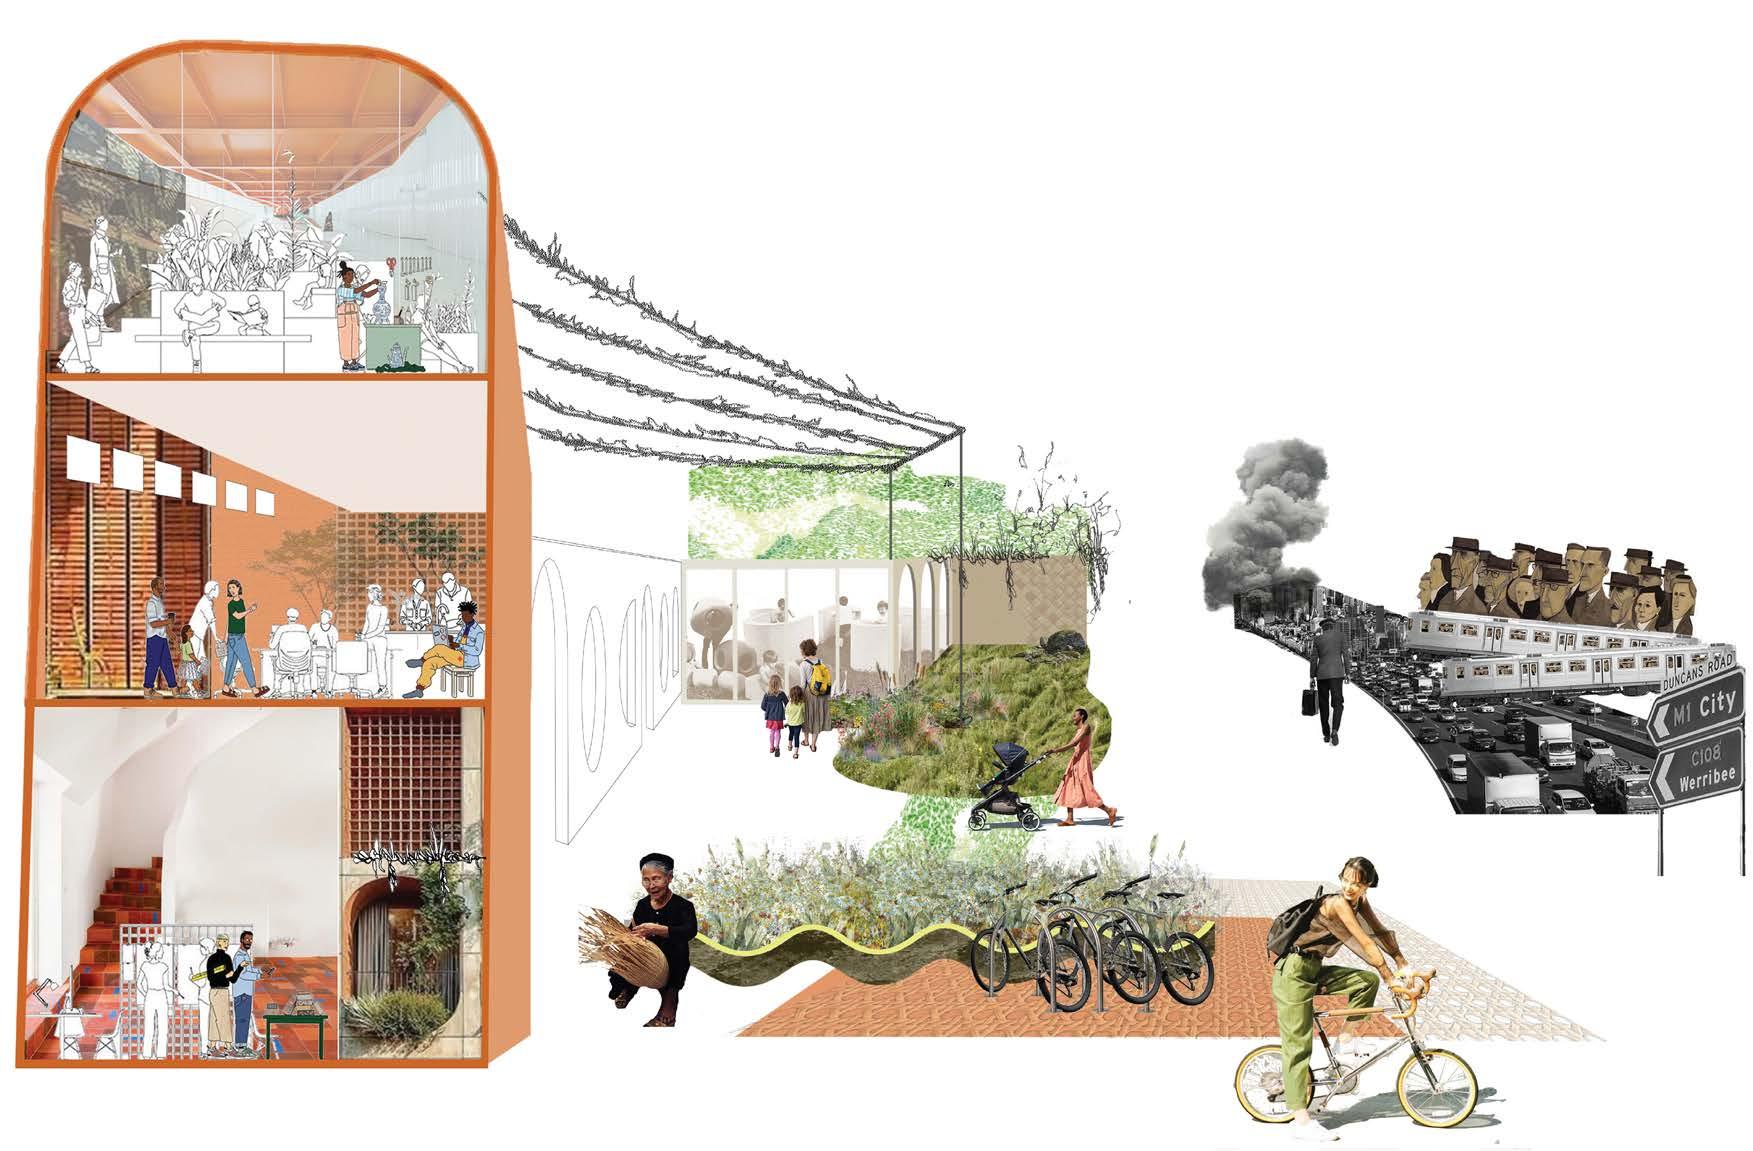
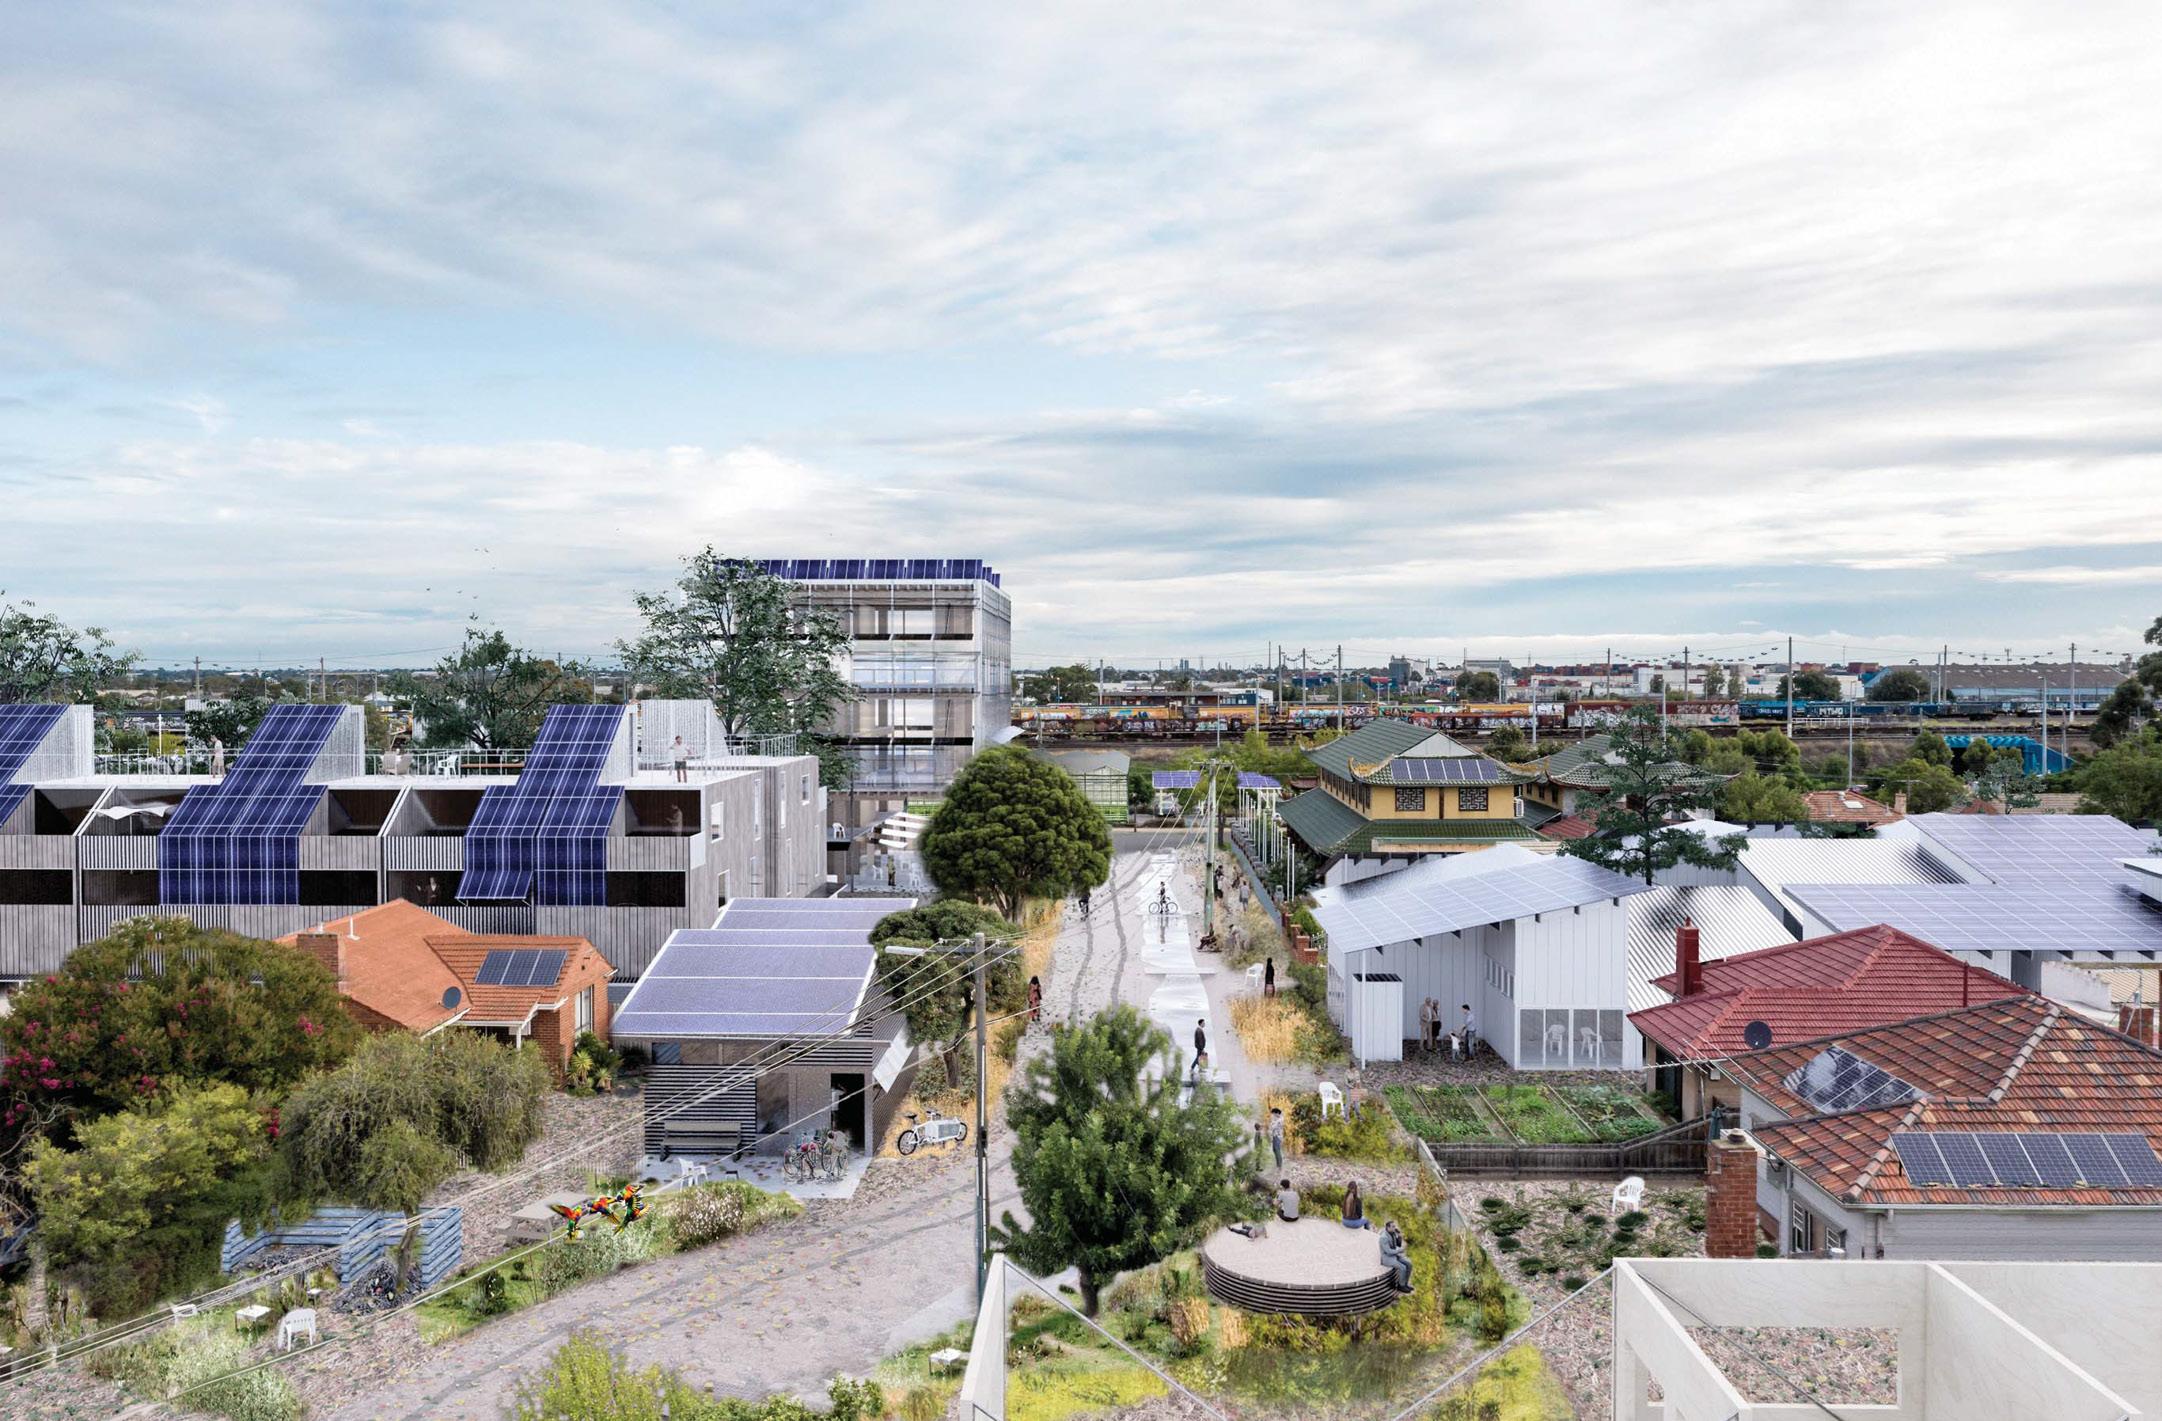
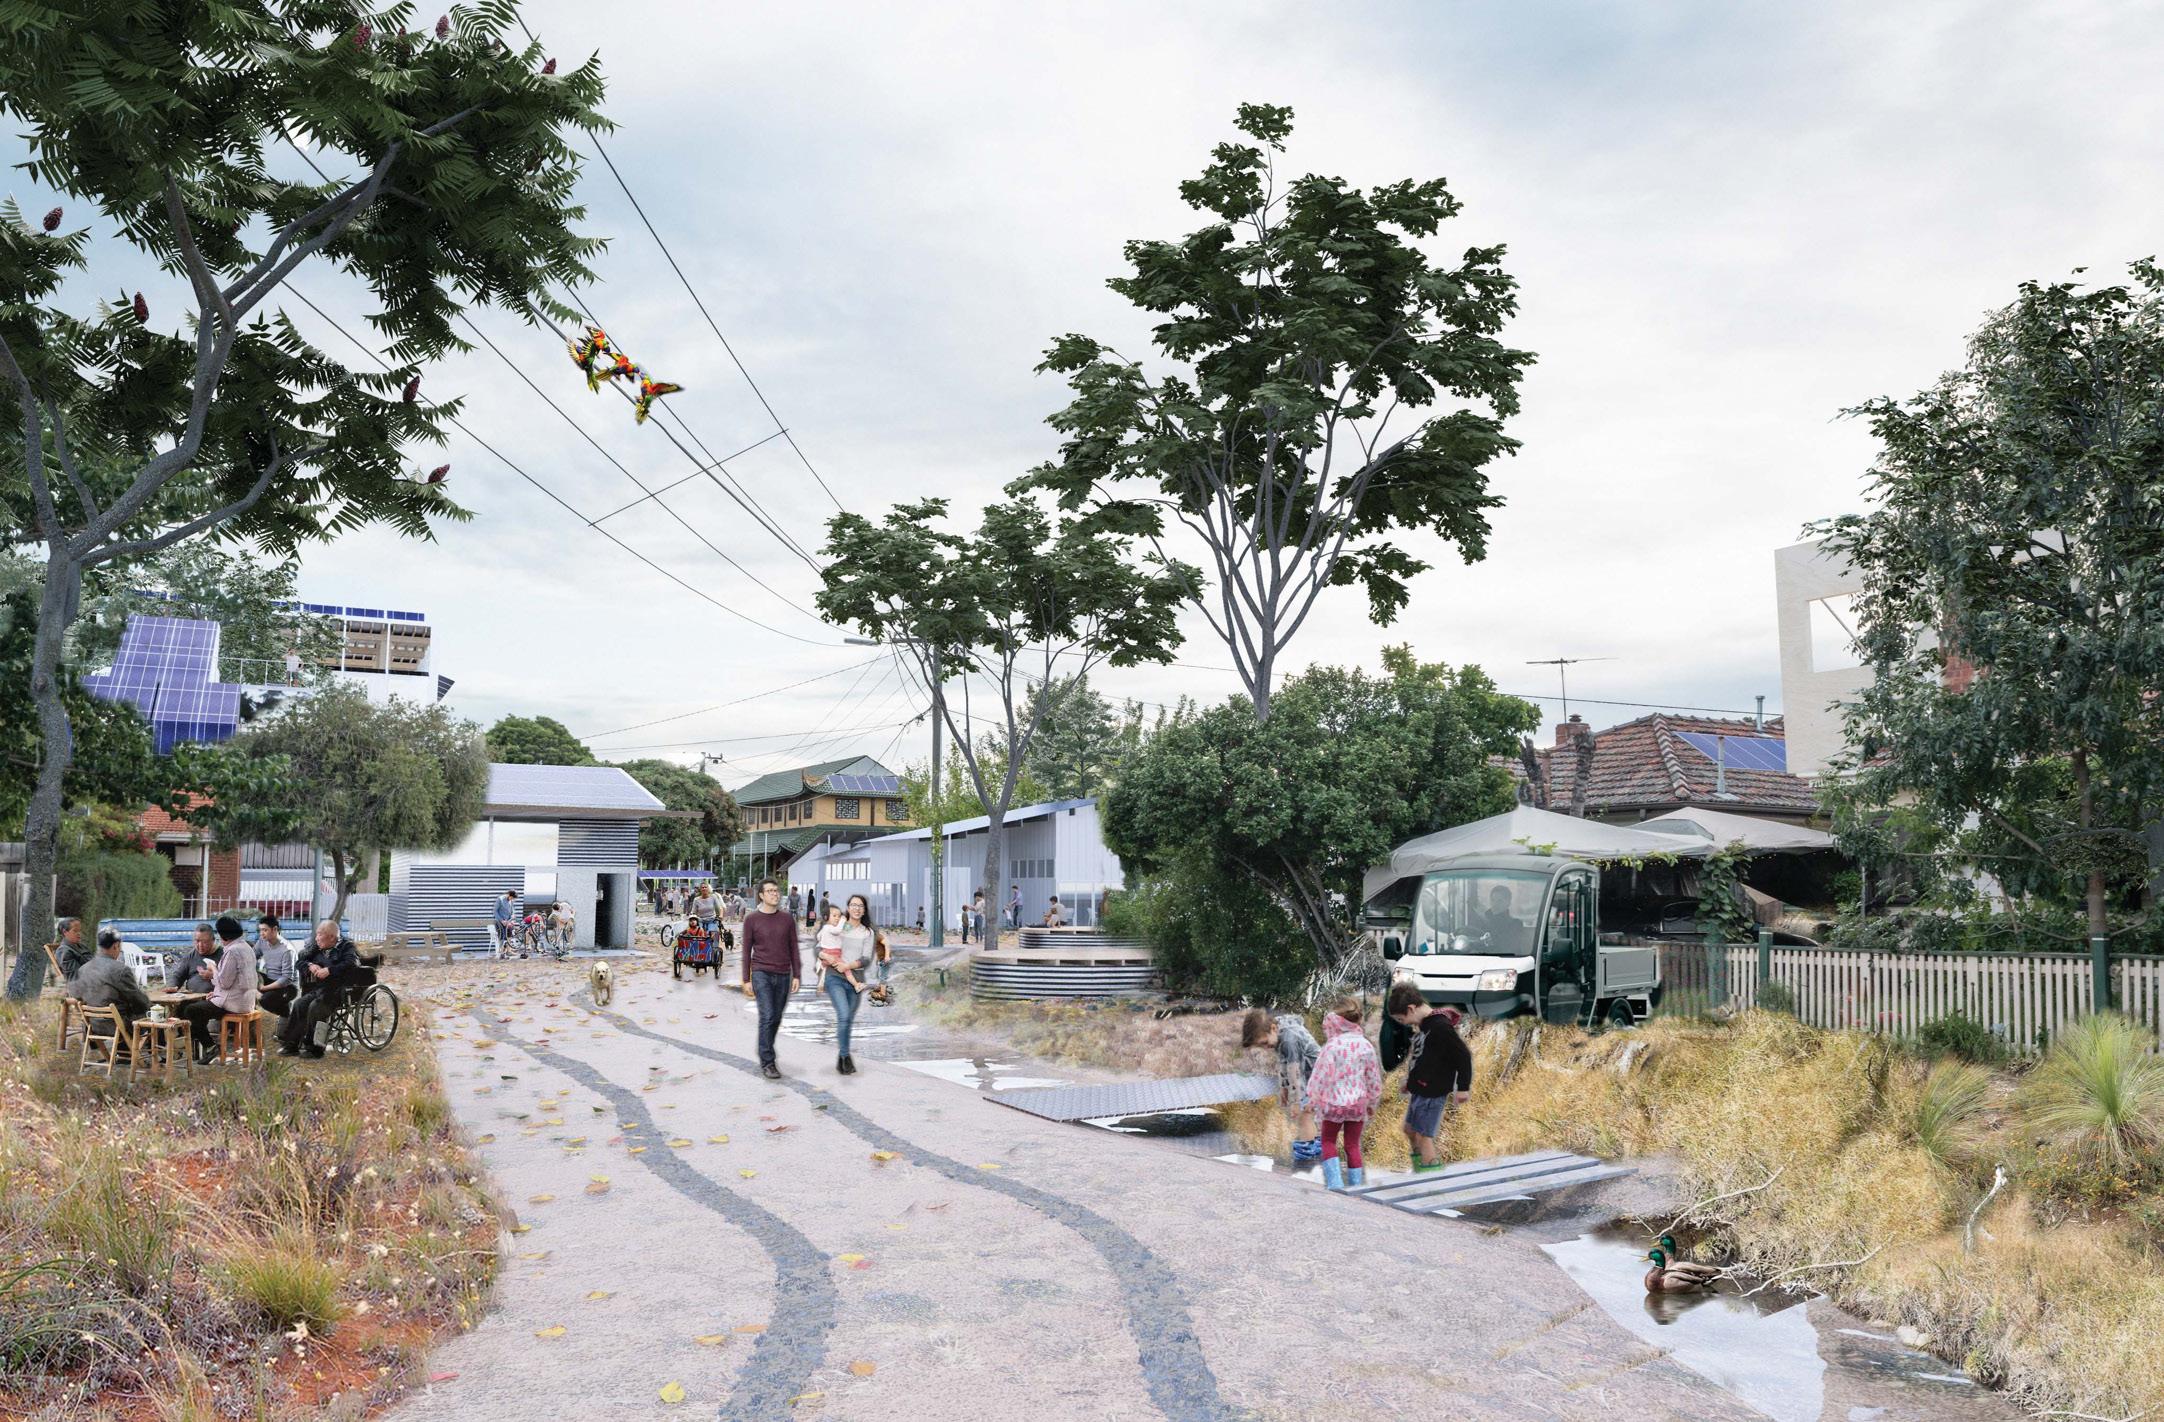
This is a typical suburban cul-de-sac – that has changed its local transport system.
The property owners negotiated to close their no-through road to everyday traffic and install a shared carport at the entrance of the street – a max. 200m from the other-end of the street. This simple act – and small personal behavioural change – frees up enormous real estate for other uses – real estate that can be put-to-use for cultural and environmental production.
Energy, waste and water can be renegotiated at street scale. Reduced traffic allows for more permeable road and driveway surfacing rather than concrete and asphalt – dramatically reducing the burden on the stormwater system – and allowing local water retention. Verges re-wilded with native species further treat the water for reuse.
The things we normally do in garages, including workshops, storage, gardening equipment, water storage and rubbish collection are all able to be rethought collectively. Without the fixed dimensions of the car and its turning circles being the key determining factor in the spatial layout – buildings can be more flexible to respond to our human and environmental needs. More density with better design can be incorporated much more easily if parking is separated from dwellings.
Homes suited for an aging population and people with mobility needs can be accommodated with drop-off zones and small electric transfer vehicles.
Middle Ring: NMBW
Project Summary
Deep root zones for large canopy trees can replace car parks – helping to reduce the heat island affect – also filtering privacy between dwellings, allowing comfortable medium density development. Reduced traffic also makes for a safer street, encouraging people to increase use of the space between buildings – further facilitating neighbourly interaction.
In this location in particular, of West Footscray, there is a train station within 300m of the end of the street. There is ample parking around the station, which can act as a hub for last-mile shared transport. There are mixed use commercial, cultural and industrial buildings that can co-exist with residential uses for a productive livework environment for all ages.
To get started this prototype could be thought of as a timed trial. The street could be closed to cars for one weekend, and a range of trial programs put in place. Removable prototypes of zero-carbon, low energy, lightweight alternative live-work typologies could be built in frontyards, nature strips and in redundant street reserves for people to visit and imagine.
This could be timed to occur simultaneously in multiple middlesuburban locations. It has already been done at a much larger scale in Swanston Street, which was famously covered in rolled turf along its entire entire length in 1985 – enabling people to envisage what the space could be used for without cars.
www.nmbw.com.au
Muir Architecture Water Unlimited
Water Treatment Plant Civic Infrastructure:
Project Summary
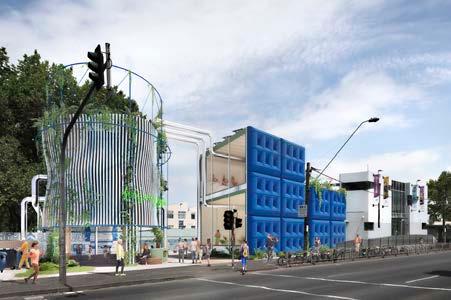
In a world where we unconsciously acknowledge the resources that are required to remove waste from our environments, water treatment becomes one of the largest pieces of infrastructure that is shrouded from our every day. This proposal looks at localising these plants to become part of local communities making visible the infrastructure that is required for the servicing of our cities and communities. The water treatment plants would have a civic presence providing use beyond being utilitarian.
Key Statistics
• By 2030, nearly half the global population will face high water stress. Australia, the world’s driest continent, faces growing water challenges due to population growth and declining rainfall. Melbourne is projected to face annual water shortfalls by 2035.
• The current backup plan—desalination—is costly. It produces water at double the cost of treated wastewater and covers only ~30% of Melbourne’s current needs (150 GL/year), yet costs the state $649M annually while often sitting idle.
• Greater Melbourne generates over 350 billion litres of sewage annually—enough to fill the MCG 200+ times. Two major plants (Western and Eastern) treat 90% of this volume.
• A decentralised treatment model would require 957 small plants (~800 m2 each, treating 1 ML/day) at a total estimated cost of ~$3 billion.
Esther Stewart
Retain the Rain
We have covered 271 km2 of ashphalt and concrete in Greater Melbourne the size of central brussels and central brussels put together 105 . ! Increasing frequency and rate of flood disasters and water ecological destruction
Leverage rainwater harvesting and catching techniques, transforming Melbourne into a ‘sponge city’.
Floods & storms currently cost an estimated $735 million a year this is potential money saved 107 Increase the permeability of our streets Resulting in urban cooling and flood resilience
$735mil/y
Retain the Rain
The Challenge
Approximately 10 times more rain falls on Greater Melbourne each year than the city consumes108, yet most of it is lost as runoff rather than captured for use.
As rain hits Melbourne’s extensive paved surfaces — roads, car parks, rooftops — it picks up pollutants that flow untreated into stormwater drains, creeks, and the bay, harming aquatic ecosystems.
Melbourne’s flood risks are driven
Where Is This Currently Happening?
Rotterdam
“Water Square” in Benthemplein, is a full-scale water square can retain nearly 2 million liters (528,344 gallons) of water.
• Called as “Waterplein” (Water Square) because of the installation of three pools which fill up when it rains.
• Large stainless steel gutters in the pavement direct rainwater to three ponds, designed for both functionality and skateboard use.
• An overflow outlet that collects rain water from a nearby building’s roof and an openair baptistery contribute to the water network. 109
by intense storm events, ageing drainage infrastructure, and rapid suburban expansion. Flash flooding, particularly in low-lying suburbs like Maribyrnong, Elwood, and Werribee, poses growing threats to homes, infrastructure, and public safety.
While the city’s major reservoirs are currently over 70%% full95, rainfall is highly variable. A few dry years, especially combined with population growth, could trigger water shortages.
This offers a chance to capture water where it falls and help secure Melbourne’s future water needs.
Chennai
The project ‘City of 1,000 tanks offers a holistic solution to the problems of water scarcity, floods and pollution.
• Developed a Water Balance Model across the city by collecting rainwater, treating wastewater and runoff pollution with decentralized Nature-Based Solutions(NBS) and by recharging both to the underground aquifer.
• Preventing climate-change-induced droughts by increasing groundwater reserves and prevent saline intrusion from sea-level rise.
• The project intends to fix supply-side issues by creating water retention and supply capabilities of 200-250 MLD in two phases (out of the 1580 MLD urban demand. 111
Harbin
Qunli Stormwater Wetland Park serves as a protected regional wetland amidst dense urban development. This 34.2-hectare dying wetland was transformed into a “green sponge,” functioning as an urban stormwater park while preserving ecological integrity.
• A peripheral ring of ponds and mounds surrounds the wetland, acting as a stormwater filtration buffer and a transition zone between nature and urban areas.
• Stormwater from the newly built urban area is collected into a pipe around the circumference of the wetland, and then released evenly into the wetland after being filtrated and deposited through the ponds.
• Native wetland grasses and meadows are grown in the ponds of various depths and the natural evolution process is initiated.113
Bangkok
Chulalongkorn Centenary Park is an ecological urban oasis tackling water management and the urban heat island effect head-on.
• The park serves as a detention area, absorbing rainwater in a hard paved city facing water-stress.
• Composed of the green roof, the rain water tank, the constructed wetlands, detention lawn and the retention pond. The rain and run-off water runs from the green roof at highest point to the retention pond at the lowest.
• The park’s main lawn acts a detention area to increase water infiltration to the ground, help runoff water drain easily to
the retention areas, and allow for space for flooding and retention pond overflow.
• The precipitation return period takes into account five-, 50-, and 100-year floods, and the lawn is large enough to detain water from these floods.
• Storage tanks throughout the park assure that water can be collected and distributed to the water treatment system for zero water discharge. 110
Melbourne
of water every year.
• • Provided a reliable alternative water source for irrigation of the heritage gardens
• Reduced pollutants the Yarra River and Port Phillip Bay.
• Helped reach our City of Melbourne target to source 30 per cent of all the water we use from alternative sources.112
Fitzroy Gardens Stormwater Harvesting System provides 30 million litres
A New Normal Solution
Melbourne needs to retain the rain, through a combination of increased rainwater capture from non-trafficable surfaces and an increase in permeability of trafficable surfaces that rainwater cannot be collected from to encourage infiltration and aquifer replenishment.
With the removal of fossil fuel transport, pollution of stormwater runoff will be decreased which will increase waterway quality, however the city should still minimise runoff through favouring permeable surfaces, creating raingardens and wetlands and other water sensitive urban design techniques. This will further improve water quality in our waterways and harbour, and replenish groundwater.
Additionally, in order to further improve Melbourne’s water resilience, rainwater should be collected from all rooftops and other non trafficable surfaces and stored for potable uses. In combination with the reuse of treated water, this will reduce the strain on catchments outside Melbourne, improve the resilience of Melbourne’s water supply, and allow the restoration of natural flows, resulting in further improvements to waterway health.
Schools for Architecture:
NMBW Esther Stewart with Glas and Monash Urban Lab Retain the Rain
Project Summary
This proposal looks at the complexity of Strata ownership and develops strategies on how to successfully propose, develop and implement climate resilient upgrades whilst also improving the buildings overall performance for residents. Strategies developed will aim to challenge current policy on strata housing, ensuring that future upgrades and retrofits can be delivered to benefit the entire community.
Key Statistics
• Approximately 1.2 million people live in strata titles in Greater Melbourne.
• It is estimated that there are approximately 750,000 strata units in Greater Melbourne.
• It is estimated that 80% of total strata units, or 600,000 dwellings, consume natural gas.
• Based on the case study of Wilam Ngarrang Apartments, the estimated cost to retrofit all strata-titled units across Greater Melbourne is approximately $18.5 billion. Residents can expect to save approximately $2,250 per household annually. Across all strata properties in Greater Melbourne, this translates to combined savings of $1.7 billion every year.
• Installing solar PV across all strata units in Greater Melbourne could unlock 8.5 million square meters of rooftop potential— delivering 1.7 GW of capacity and generating 2,400 GWh annually. This would power approximately 520,000 Melbourne homes, equivalent to one-fourth of the city’s households.
• It’s estimated that up to 11.3 million square meters of concrete - equivalent to 450 MCG fields - could be removed and replaced with permeable surfaces, reducing stormwater runoff and allowing increased planting and reduced urban heat island impacts.
www.nmbw.com.au
www.glasurban.com
www.estherstewart.com
www.monash.edu/mada/monash-urban-lab
Esther Stewart
Brew Koch
Esther Stewart
Architect Brew Koch
Monash Urban Lab
Landscape, Biodiversity & Urban Cooling
Melbourne’s hard urban surfaces absorb heat causing the urban heat island effect 117
Planting mitigates the impacts of urban heating
Greater Melbourne is on average 7°C hotter due to UHI impacts 118
Heat is responsible for more deaths than any other natural hazards 119
We can cool down Melbourne with plants. Let’s make the city more liveable and comfortable while increasing biodiversity.
Creates more biodiversity Reduces UHI effect least 4°C.121
Planting mitigates the impacts of urban heating 120
Up to 374 can be saved per year by 2030.122
Opportunity for ongoing roles in land care, education and Caring for Country initiatives
Urban Cooling
The Challenge
Because we’ve covered our cities in so many hard surfaces and removed green space, they now trap heat and reradiate it, causing what is referred to as the urban heat island effect.
Temperatures in Melbourne are on average 7º warmer than they would be if the city never existed118. This leads to poor health and wellbeing outcomes for the people of Melbourne.
Heatwave induced deaths are projected to reach around 6214 people across Victoria by 2050,that’s nearly 250 people per year123. Planting, increasing green space and using reflective materials can help reduce the risk, however we are not moving fast enough. We need to start acting now, before Melbourne becomes unliveable124.
Where Is This Currently Happening?
California
Prototyping in Sacramento showing an increase of tree canopy of 25% reveal significant energy savings.
• Sacramento’s residential building sector would see energy savings of up to 40%.
• Neighbouring cities, Phoenix and Lake Charles would see up to a 25% increase in residential energy savings.125
São
Paulo
Formigus-de-embaúba, an NGO that works with indigenous leaders and schools to facilitate the exchange of traditional knowledge of agroforestry and ecosystem management have started planting mini forests in São Paulo to combat the impacts of global warming.
• In 2022, 10,000 trees were planted by 4,000 students. In 2024 the goal is to plant 8 mini-forests that have a footprint of 400 sqare meters throughout São Paulo.126
Seoul
Conversion of the Gyeongui railway line into a forest.
• Seoul’s average Summer temperature has increased by 4.3 °C from 1976 to 2016 causing high energy consumption and poor air quality outcomes.
• By 2030, Seoul’s master plan strategy to reduce the impacts of UHI effects is to create 1000 gardens and 1000 forest areas to lower the city temperature.
• The planting of ‘wind path forests’ channeling clean, cool air generated at night from the mountains into the city centre is projected to cost the government $23m.127
Medellín
Green corridors introduced in 2016 have reversed the impacts of UHI effects by 2°C across the city.
• Planting of 120,000 plants and 12,500 trees in 2016 followed by 2.5 million smaller plants and 880,000 trees between 2017-2021.
• Initial investment by local government of $25.5m and annual maintenance cost of $974k in 2022.
• Native species such as the mango tree has been particularly effective in absorbing pollution.
• Reintroduction of biodiverse fauna including birds, lizards, frogs and bats which had not been seen in the city for years.129
Rotterdam
Since 2008, citizens can apply for a green roof subsidy through the city of Rotterdam to cover costs of installing green roofs. The program aims to achieve a total of 800,000sqm of multifunctional roofs by 2030 including greenery, water retention systems and solar panels.130
Paris
In the Summer of 2019, temperatures hit a record 42.6°C during a heat wave that killed an estimated 1,500 people across France. A $2.48b Green Fund was created to create 800 ‘cool islands’ which reduced temperatures by up to 4°C as compared to surrounding street. Paris plans to plant 170,000 trees by 2026.128
Urban Cooling
A New Normal Solution
Prioritising initiatives that promote planting and green spaces, foster biodiversity and mitigate the impacts of urban heat is paramount for enhancing resilience as the planet warms.
Increasing tree canopy and green coverage leads to reduced temperatures and cleaner air quality which will improves the overall mental health, wellbeing and general health outcomes of Greater Melbourne. Melbourne is targeting an increase in tree canopy cover from 22% to 40% by 2040131.
% OF ESTIMATED IMPERVIOUS SURFACE
Greater than 75%
% OF ESTIMATED IMPERVIOUS SURFACE
51% to 75%
Greater than 75%
26% to 50%
% OF ESTIMATED IMPERVIOUS SURFACE
11% to 25%
51% to 75%
Greater than 75%
Less than 10%
less than 10%
26% to 50%
51% to 75%
% OF ESTIMATED IMPERVIOUS SURFACE
11% to 25%
11% to 25%
26% to 50%
26% to 50%
Greater than 75%
less than 10%
51% to 75%
11% to 25%
51% to 75%
% OF ESTIMATED IMPERVIOUS SURFACE
Greater than 75%
26% to 50%
Greater than 75%
less than 10%
% OF ESTIMATED IMPERVIOUS SURFACE
11% to 25%
51% to 75%
less than 10%
Greater than 75%
26% to 50%
11% to 25%
51% to 75%
less than 10%
26% to 50%
11% to 25%
less than 10%
Project Summary
We often undervalue and overconsume things that are freely accessible, especially when their importance is not well understood. This tendency extends to public spaces and urban habitats. With 80% of Australia’s population and 30% of our threatened species living in cities, this proposal aims to shift the perceptions of communities, governments, and developers to recognize the value of these landscapes for the health of humans and for the ecosystems we are part of.
Key Statistics
• Increasing Melbourne’s tree cover could generate $1.2B in carbon benefits over 30 years.
• Every $1 spent on urban vegetation returns ~$4 in public, private, and government value.
• Tree canopies reduce CBD surface temps by up to 20°C; evapotranspiration lowers air temps by 3.1–5.8°C.
• Trees can cut building energy use by up to 40% with optimal placement (5–20% for less ideal setups).
• A 10% rise in green space is linked to a 7% drop in cardiovascular deaths and 20–30% better mental health.
• Greater tree cover correlates with lower rates of diabetes, hypertension, and heart disease.
• Small urban sites can boost biodiversity— one saw a 7× rise in insect species after planting 12 native plants.
• Native rushes in wetlands removed 42–53% of PFAS in 28 days.
• Indigenous gardens support biodiversity, cultural identity, education, and community connection.
• Melbourne’s canopy cover was 15.3% in 2018; the target is 30%.
Esther Stewart
Urban Farming
Cultivating Country:
Winsor Kerr & SBLA
Project Summary
Cultivating with Country envisions a future where urban landscapes coexist with the tangible and intangible architecture of Country, where water is reclaimed, endemic flora and fauna thrive, and communities actively participate in the stewardship of their environment. This proposal will serve as a model for sustainable urban development, demonstrating resilience against climate change while promoting ecological and social well-being.
Key Statistics
• The Australian Threatened Species Index shows that in the period from 1990 to 2020 for Victoria: the abundance of threatened and near-threatened species declined by approximately ~75%.
• Prior to colonisation, the region supported approximately 1,260 species of flowering plants, including grasses, sedges, orchids, wattles, bush peas, eucalypts, and daisy bushes. There were around 73 species of ferns and club mosses recorded in the area. The region was home to about 95 species of liverworts and hornworts. Approximately 180 species of mosses were found in the native vegetation. At least 560 species of fungi were also present in the region’s ecosystems.
• An estimated 66% of Victoria’s native vegetation has been cleared as a result of the growth and economic development of the State.
• Of the remaining 34% it is estimated that 7.4 million hectares are located on public land and approximately 1.1 million hectares are found on private land.
Urban Farming
Shortening supply chains to increase resilience by bringing fresh produce closer to the consumer. Around 41% of
Urban Farming
The Challenge
Urban sprawl in Melbourne has pushed agriculture further away from urban centres, extending food miles and increasing carbon emissions.
In 2015, local farmers in Greater Melbourne produced 59% of poultry, 2% of dairy and 23% of vegetables and 7% of fruit133
Havana
Havana’s Organopónico Vivero Alamar is a large-scale urban farm covering over 27 hectares, providing fresh produce to locals. Its sustainable practices, including composting, biological pest control, and urban aquaculture, promote self-sufficiency by reducing reliance on imports and chemicals.
• The farm employs over 150 workers and supplies markets, restaurants, and institutions within the city, contributing to Cuba’s goal of food sovereignty amid economic challenges.
• Its success has inspired similar urban farming initiatives nationwide.138
Singapore
Sky Greens is the world’s pioneer in low carbon, hydroponic vertical farming.
• This farming model is 5-10x more productive per area unit compared to traditional agriculture techniques. 139
Where Is This Currently Happening?
Montreal Canada
Lufa Farms in Montreal is leading the way with rooftop greenhouses, also known as “rooftop farms,” to cultivate food near urban areas and minimise food transportation distances.
• A closed loop water system is used to minimise water waste.
• No new land is used for these large scale rooftop greenhouses as they are all located on top of existing industrial and commercial buildings.
• Collectively the rooftop greenhouses make up over 300,000 square feet of fresh and local vegetables.135
New York City
Brooklyn Grange, one of the world’s largest rooftop farms, manages several rooftops in New York City and produces over 22,500 kgs of organically grown produce each year.
• Apart from growing vegetables, Brooklyn Grange offers educational programs, workshops, and events that promote sustainable living and urban farming.136
London
The Edible Bus Stop Project in London, converts overlooked urban areas, like bus stops, into productive community gardens.137
Melbourne
Sky Farm in Melbourne CBD has converted the roof of a multi story carpark into 800m2 of productive garden and education centre, providing food for local charity OzHarvest.140
Dubai, UAE
Located in Dubai, Bustanica is the world’s largest vertical farm, producing more than 1 millions kgs of produce per year.
• Located near the airport, Bustanica provides leafy greens to more than 100 airlines.
• Saves 250 million L of water annually.141
Urban Farming
To shorten the distance from farm to table, Melbourne must reduce the loss of city adjacent agricultural land to urban sprawl, and implement high yield urban farming solutions such as vertical farming, indoor hydroponic farms and rooftop gardens.
To do this successfully and equitably, we need to make sure that people who rent and live in apartments have access to the infrastructure needed to produce food. Reimagining ground floors - most commonly used for small scale retail is one way of maximizing the opportunity for creating productive growing space as well as providing an opportunity to create social cohesion and avoid loneliness.
Traditional farming methods will still be required for larger crops like corn, wheat, and fruit trees, as they are more efficiently grown at this scale.
Focusing on growing small to medium crops which require less soil and are more suited to indoor environments.
This multi-modal approach is an economically viable solution that will increase vegetable production in Melbourne.
CURRENT VICTORIAN PRODUCTION VERSES PRODUCTION POTENTIAL FROM GREATER MELBOURNE’S FOOD BOWL
Projected food bowl production from Greater Melbourne 2050133
Current food bowl production from Greater Melbourne133
Projected food bowl production from Greater Melbourne with intensive agriculture (20% increase fruit and vegetables growing in urban and peri-urban zones)
Organic Energy
Over 2,500 tons of food waste is sent to landfill every day
Direct waste to anaerobic digesters which are distributed across the city 255 x digestors with a capacity to process 10t of waste per day
Food waste produces methane, a gas 25 x more intensive than CO2 for global warming144
* Based on Active Research digester output information provided to Finding Infinity (www.activeresearch. com.au) and household average energy usage
Our organic waste has significant value. It can be profitably converted into energy and fertiliser.
= 1% of Melbourne's fully electricity consumption* = 274,000t of Biosolids for fertiliser*
Organic Energy
The Challenge India
We’ve been hiding from food waste for decades. We put it in a plastic bag and pay someone to remove it.
In landfill, food waste rots — releasing methane, a greenhouse gas 28-36 times more potent than carbon dioxide144. It’s estimated Greater Melbourne sends around 2,500 tonnes of food waste to landfill per day142 143
Anaerobic digesters are essentially large mechanical stomachs – bacteria converts organic matter into methane, which is captured and combusted to create electricity and heat, as well as organic liquid fertiliser145. Globally there are millions of digesters ranging from municipal scale plants to agricultural processing facilities to home made backyard digesters designed to provide cooking gas.
Where Is This Currently Happening?
New York
Curbside Composting Program for organic waste was implemented in 2022.
• Aims to divert the 3,630 tonnes of daily residential organic waste away from landfill.
• Organic waste is sorted by residents and collected from the curb to be sent to anaerobic digesters like in the Newtown Creek Wastewater treatment plant.
• In March, 2023, the processed waste from West Queens generated enough biogas to fuel 2,500 homes.146
Florida
Disney World in Orlando, Florida installed a large anaerobic digester to manage all food waste from the theme park.
• Food waste is mixed with biosolids from the sewage treatment system
• Treats 120,000 tonnes/year
• Gas generated powers a 5.4 MW combined heat and power plant which gives of heat and electricity for the park
• Cost US$30 million to build
• For scale around 5 of these would consume all of Melbourne’s food waste.147
ARTI Compact Biogas Plant - an anaerobic digester designed for the household scale.
• An estimate of 1-2kg of food waste is processed per household each day.
• ARTI has supplied about 1000 biogas plants and has become a norm in South India.
• Indoor air pollution reduced by cooking with biogas rather than wood or kerosene.
• The system saves approximately 0.3 tonnes of CO2 per year.148
Copenhagen
With Copenhagen’s target of carbon neutrality by 2025, the gas grid must become fully decarbonised
• New biogas upgrading facility means 44% of the city’s grid gas supply is now biogas as of June 2019
• Aiming for 60% biogas in the grid by 2020
• Anticipating 100% before 2025, ahead of schedule.149
A New Normal Solution
Ban the disposal of organic waste to landfill — and build anaerobic digesters throughout the city to convert food waste into electricity, heat and organic fertiliser.
Around 250 anaerobic digesters, each processing 10 tonnes of food waste per day, would process all of Greater Melbourne's food waste — and supply around 330 GWh of energy (enough to power up to 88,000 homes), 120,000 tonnes of organic fertiliser and 460ML of recycled water per year in the process. The non-food portion of the city’s organic waste, mainly garden waste, can still be composted.*
The digesters could be co-located with water treatment plants, with energy from the digesters used to power the water treatment.
An additional benefit is to return nutrients lost in food waste to the soil, via the organic fertiliser created.
How much space will it take?
Around 250 digesters throughout Melbourne, taking up around 60 m2 or four parking spaces each. What is the environmental impact?
100% reduction in organic waste to landfill, and enough energy to power 88,000 typical Melbourne homes or around 1% of the city’s current electricity consumption, while also providing recycled water and organic fertiliser to improve soil health.
How much will it cost?
The 250 digesters are estimated to cost around $730 million.*
What is the return on investment?
The digesters would generate net income of around $90 million annually, paying for themselves in around 7.7 years.
Waste to Energy
Swimming
Melbourne: WOWOWA
Project Summary
Pools Across
As a case study, Fitzroy swimming pool would be the first of 150 anaerobic digestors to be rolled out across Melbourne to deal with the city’s expanding food waste problem.
This tower combines two unlikely companions, waste and recreation. Collecting 10 tonnes of food waste a day from the surrounding food and beverage businesses; the tower converts this waste into biogas, used to heat the swimming pool’s sauna, spa and indoor pool. Housed within the tower are two large tanks, stacked to minimise its footprint, while also celebrating this new industrial form on the suburban streetscape.
The tower also produces a nutrient-rich fertiliser to feed an expanding landscape of plants growing in and around the pool and in the adjacent park. Nearby residents are encouraged to drop off their food waste before heading inside to jump into the pool or sauna.
Organic Waste to Energy
Queen Victoria Market: Six Degrees Architects
Project Summary
Queen Victoria Market is one of the Melbourne’s most loved precincts. Opened in 1878 it has provided a continuous destination for generations of Melbournians and visitors for over 140 years.
The market sheds and halls have changed and developed over the decades and the market is currently undergoing a further series of redevelopments to underground the cars and reclaim the existing asphalt carpark as public space and parkland.
As a product of selling fresh fruit, vegetables, meat and fish, the market produces hundreds of tons of organic waste every month.
This proposal looks to take the significant organic waste generated at Victoria Markets and turn it into energy, for use by both the market stall holders and visitors to the precinct. Gas is generated through the use of an anaerobic digester. The methane produced will provide energy, through a gas engine, to power a moonlight cinema for Melbourne City Council’s proposed new park atop the existing market carpark. The methane will also be used by the market’s fleet of forklifts and piped through the market to provide gas for the food outlets. Food trucks can jack in to service points adjacent to the digester to service the moonlight cinema or other market events, and Public BBQ’s will be provided in the park for general use.
Food waste and surplus vegetables, usually destined for landfill, will instead be transparently utilised to help power a treasured Melbourne precinct, while the bi-product, a nutrient rich fertiliser, will be offered to market shoppers to take home to their gardens and used on nearby city parks.
www.sixdegrees.com.au
NH Architecture Organic Waste to Energy
The Oval Economy - Transforming waste materials into community assets:
Project Summary
This proposal transforms waste materials into community assets. By integrating resource recovery infrastructure into existing sports facilities, it will create a new distributed waste network for metropolitan Melbourne. This idea has been explored through a focus on food waste and the possibility of commercial scale anaerobic digesters being used to overcome rising operational costs and deliver critical social infrastructure for clubs and community groups.
Key Statistics
• There are approximately 750 to 1,200 footy ovals in Greater Melbourne
• It is estimated that 2,600 t/day of food waste is generated in Greater Melbourne.
• It is estimated that 49% of organic waste goes to landfill. This results in approximately 460,000t of organic waste going to the landfill every year.
• Approximately 1.17Mt of CO2 are produced every year from organic waste rotting in landfill. This is equivalent to 250,000 cars on the road every year.
• CO2 emissions from transporting this amount of food waste to landfill is estimated at up to 2,700t CO2
• Treating all food waste can generate up to 1200 MWh/day of electricity, powering around 72,000 Victorian households.
• Treating all food waste can generate up to 200 tonnes per day of fertiliser. This output could meet approximately 15% of the state’s total fertiliser demand.
• Treating all food waste can produce up to 2,000 kL/day of greywater —enough to irrigate approximately 10% of footy ovals in Greater Melbourne.
End Landfill
It’s time to end the concept of landfill — by banning the sale of any product destined for the landfill.
End Landfill
The Challenge
Cities import products made from raw materials, use them — and dispose of them in landfill.
Greater Melbourne produces around 40,000 tonnes of waste daily, of which 12,300 tonnes goes to landfil150.
Some cities are investing in waste to energy or incineration plants - combusting plastics and other non-organic, non-recyclable waste. Unfortunately, this is not a viable long-term solution: it promotes linear consumption of finite resources rather than a circular approach, and creates unnecessary emissions154.
Instead, we need to end the sale and consumption of non-organic, nonrecyclable products. Additionally, we need to move away from products where recycling is “cascading” – i.e. the materials lose value each time they go through the recycling process. Many plastics are only recyclable in a cascading manner155.
While the environmental and health costs of non-recyclable products can be hard to quantify, they are often not borne by the producers of the products and are not accounted for in their price. For example, according to the Ellen MacArthur Foundation, the cost of externalities from the production of plastic packaging is greater than the entire profit pool of the plastic packaging industry156.
Amsterdam
Motivations to establish Amsterdamn as 100% circular by 2050 have been ongoing with 3 key primary goals,
• Shortening food chains to provide a robust regional food system where local agriculture meets local food
• Encouraging healthy and sustainable food consumption for the people of Amsterdam
• Improving the processing of organic waste streams
An initiative launched by the city of Amsterdam with Dark Matter Labs, CircuLaw aims to help policy makers and industry actors make better use of legal instruments within existing legislation to accelerate the circular economy transition.
Amsterdam Implementation Agenda 2023-2026
• Outlining the engagement with entrepreneurs, citizens and social initiatives
• Hone in on consumer goods, food and organic waste system and the built environment.
Amsterdam City Doughnut
• This encourages societies and businesses to make strategic choices that boost the economic stability still respecting the boundaries required around the planet to make an economy circular.
Buiksloterham - first neighbourhood founded on circularity
• Committed to 80% circular use of materials
• Digital inventory of materials used along the streets and availability dates for designers for future planning Public space will be the home for more reused materials - behind Central Station a bridge will be gifted a renovation using recycled building materials158
Where Is This Currently Happening?
• Through utilising Google Earth, Superuse Studios identified waste in industrial areas; Steel previously used within Textile machinery and timber from 200 damaged cable reels.
• A new approach to treating timber was discovered and adopted by Superuse Studio by using waste heat from a local powerplant. After three types of heat treatment, materials were prepared and their life time prolonged without chemical treatment.
• No requirement for natural resource extraction boosting biodiversity and reduced construction efforts and impact on climate change. 157
Australia
XFrame
- Circular Construction technology reducing construction waste, assembly time and is 100% reusable.
• During 2021-2023 the XFrame system has delivered 50+ projects worldwide with their revenue boosted 12 times over.
• The actual manufacturing of this system leaves 5% waste from the materials required
• This modular building system works as a jigsaw puzzle with the ability to replace or remanufacture any component that needs fixing significantly minimising landfil159.
Rotterdam
Villa Welpeloo, Superuse Studios
Ban the sale of any products unavoidably destined for landfill. Encourage reuse over recycling.
Some of the products & practices must be eradicated by 2030 include:
• Single or short use plastics including all plastic packaging
• All non-reusable construction products
• Mixed, non-recyclable packaging
• Disposal of glass rather than recycling
• Disposal of paper and cardboard
Regulation banning the use of any material that is not organic or 100% recyclable is required across all industries. Key areas include retail and consumer products, construction, agriculture, manufacturing, and logistics. Unavoidable waste from life-saving sectors, such as cutting edge medicine, will need investment in research into viable alternatives. Adoption of a circular economy has been estimated to add $1.65 trillion annually to global GDP160.
What is the environmental impact?
100% reduction in waste to landfill, or 12,300 tonnes per day avoided150.
Figure 18: Food waste is treated through anaerobic digestion, and all waste destined for landfill is avoided.
End Landfill
Replace Me: Dreamer
Project Summary
We need to end the sale of any product that is destined for landfill. A physical space is required for communication, awareness and education for consumers to make better choices. The popularity of such a space will send a message of support to political leaders to introduce much needed regulation. But let’s not preach to the converted here, it’s an important message for all of Melbourne. This creates an opportunity once again to connect technology or solutions with culture by connecting waste with art.
It’s 2030 and Melbourne is a trash free city. Welcome to Replace Me, a retrospective art gallery making the invisible visible and celebrating the beauty and value of the discarded.
The gallery’s permanent collection will comprise a series of “cores” – tubes of solid landfill waste drilled and extracted from extinct landfill sites across Melbourne. Like layers of ice drilled in Antarctica they depict our changing relationship to waste over time. Once drilled, local and international Artists work with the cores - curating, cleaning, assembling and constructing, creating contemporary works of art.
Visitors would use an augmented reality app as they explore, being guided to discover hidden bottles from the 19th century, durable 1950s appliances, and select moments in the masses of recent fashion, electronic and plastic waste.
Replace Me unpacks the material and cultural value of our discarded items.
It serves as a signpost pointing to the moment we were empowered as a community to take a different direction.
The Cathedral of Circularity: Edition Office
Project Summary
The Circular Economy. A social enterprise that teaches repair and reuse. The facility repairs and sells refurbished products, and hosts workshops where individuals can come along and learn how to repair their own things. This allows people to rethink how they use and dispose of resources. At the same time, workshops with businesses and manufacturers are hosted encouraging the transition into circular products in all industries.
We all know that person who has a natural ability to fix things, to take the seemingly useless and transform it into a re-vamped, well oiled thing of beauty. Or maybe they just help you fix your bike chain. Regardless, this is their church. A Cathedral of repair, where tech and machinery of all types are archived, pulled apart, sorted for parts. Where people can bring anything from a toaster to a state of the art road bike for repairs. Inside, alongside the archive of parts, is a community tool library.
The building, acknowledging its use, re-purposes the existing structure and superimposes a new mass timber structural system, which itself can be unbolted and the materials easily repurposed for future alternate use.
Closed Loop Plastics Recycling Centre:
Project Summary
This proposal will transform and upcycle everyday packaging plastics and Tetra Pak waste into a low-carbon, circular construction material, diverting waste from landfill by giving it a new purpose. By closing the loop, we’re turning a traditionally linear waste stream into a circular and regenerative resource.
Key Statistics
• An estimated 600,000 tonnes of plastic waste are sent to landfill each year in Melbourne.
• One saveBOARD factory with an operational capacity of 4kt per annum has the potential to divert 0.7% of Melbourne’s plastic waste from landfill
• The processing plant has the capacity to produce 200,000 boards every year which is equivalent to 500,000 m2.
• One board can save up to 20kg CO2 in embodied carbon. Hence, a 4 Kt processing plant can result in up to 4000tCO2 a year savings of embodied carbon in the building industry.
Esther Stewart
Architect Brew Koch Monash
Net Zero Building Code
We can now construct profitable buildings with no negative environmental impact. It must become the industry standard.
Net Positive Water: Produces more water than it consumes annually
Net Positive Energy: Produces more renewable energy than it consumes annually
Zero Waste Operations: Produces no waste to landfill through the life of the building
Zero Impact Construction: Construct new buildings without emitting carbon or sending waste to landfill
The Challenge
The previous 10 initiatives will transform Greater Melbourne as it currently is. The final two initiatives will ensure all new building stock does not require additional resources into the future.
As a minimum, new buildings should have no negative environmental impact on the city in their operations. All buildings should be designed to give back energy and water, and treat their own waste.
The Building Code of Australia and local council standards need updating to mandate net-zero energy, minimise embodied carbon, water-neutrality and zero-waste for all construction projects.
Net-Positive buildings typically cost <10% more than buildings targeting minimum council compliance — but the difference pays for itself in under 10 years162.
The initiatives required are often more profitable than investing in Australian shares, which have an average annual return of 9.5% over the past 30 years, and can even be more profitable than the construction projects themselves163.
Germany
in 2021 Germany established that all newly constructed buildings must have zero-energy performance. The strategies include:
1. Energy efficiency requirements defined in regulatory and mandatory building codes and labeling schemes
2. Low-interest loans and a repayment bonus for energy efficient refurbishment and new buildings depending on the energy standard achieved
3. Investment grants (existing buildings) and use obligation (new buildings) for the implementation of RES-H
4. A variety of instruments for information and motivation as well as supply side measures.166
Sweden
The government has set a stringent national zero-net greenhouse gas emissions target for 2050. In 2009, Sweden ’s ‘Integrated Climate and Energy Policy’ (ICEP) introduced the goal of increasing energy efficiency in buildings by 20% in 2020 and 50% in 2050.
• Dwellings in 2020: 55 -75 kWh/ m2a depending on climate zone (non-electric heating) and 30-50 kWh/ m2a depending on climate zone (electric heating)
• Other buildings in 2020: 50 -70 kWh/ m2a depending on climate zone (non-electric heating) and 30 -50 kWh/ m2a depending on climate zone (electric heating)
• Building Code Requirements for Renovations:
U-values:
Roof – 0.40 W/(m2·K)
Wall – 0.40 W/(m2·K)
Window – 0.40 W/(m2·K)
Air Tightness – 0.61 l/(s.m2) at 50 Pa167
Where Is This Currently Happening?
Toronto
Toronto’s new and accelerated net zero strategy aims to reach its goal by 2040 while aiming for 65% reduction in 2030. The new buildings in the Toronto building framework aims to determine the building’s thermal performance in terms of r-values, glazing areas, envelope air tightness and materials.
High performance buildings in the strategy are rewarded for achieving net zero through a tier system.
The strategy also identifies the construction costs associated with each performance tier.164 165
Net Zero Building Code
A New Normal Solution
Mandate net-positive buildings as the construction industry standard.
Building codes need to be adapted to dictate that any new construction must be net-zero in waste, water and energy: must create more energy than it consumes, treat and export more water than it consumes and create no waste. This needs to happen at both building code and council planning control levels.
In the meantime, architects and engineers can accelerate this by pushing the limits on every project, seeking the environmental and financial threshold, helping to demonstrate that this form of construction is “normal” educating consumers and developers and encouraging regulation.
Based on a conservative estimate of 5% increase to costs of new construction, a net-zero building code is estimated to provide around 2,000 jobs annually, both to 2030 and beyond
What is the environmental impact?
New buildings produce no net increase to overall consumption, meaning population growth is accommodated without increasing the city’s consumption.
How much space will it take?
New construction may require larger plant rooms to accommodate heat pumps, water treatment and organic waste to energy, as well as allowances for thicker walls.
How much will it cost?
Self-sufficient buildings generally cost less than 10% more than comparable buildings built to current minimum standards.
What is the return on investment?
The initiatives required for buildings to be self-sufficient typically pay themselves off within 10 years. These initiatives can often be externally financed.
Figure 19: New architecture must create more energy than it consumes, treat and export more water than it consumes and create no waste.
New Architecture
An apartment building at Docklands
Kennedy Nolan
Project Summary
Melbourne is a Design City and now we can use design to solve our most pressing issues. Best of all, we don’t need to invent the solutions – we just need to deploy them!
We know how to take buildings off grid and have a net positive effect on our city - we only need to look to the past. On site infrastructure is efficient and operationally cost-effective - its how we did it in the past.
Solar panels as cladding operate buildings on the power of the sun. Placement of the panels give shadow, texture and depth like verandas.
Visible infrastructure animates space in much the same way as distillery equipment, exciting in scale and materiality, the forms and shapes are intriguing and dramatic and real.
Cross laminated timber construction is relatively new, but timber feels so familiar to us. This eternally renewable resource is well suited to cellular construction and so enjoyable to be near.
Less glass, more wall, articulation, texture – people want these in buildings –glazed sheaths have alienated us and are a thing of the past.
Carbon Neutral Construction Fieldwork
Project Summary
We have all the tried, tested and proven technologies today, to build the office building of the future.
That is a carbon neutral building in construction and operation.
The first step towards achieving this is by building with Mass timber. Products such as Cross Laminated Timber and Glulam - which are already being manufactured in in Australia - are a more sustainable alternative to concrete and steel, due to their renewability, reduced carbon impacts, and carbon sequestration. Combined with a highly efficient envelope, reduced glazing and solar shading the buildings embodied and operational energy can be reduced drastically.
The second step relates to renewables energy supply. Photovoltaics are a technology that Australians are well acquainted with. The office building of the future maximises all opportunity to integrate PV into the facade and rooftop, to power the building from the sun.
Beyond the building itself, construction sites can also reduce their environmental impact and carbon footprint. In many countries, technologies have been developed to power machinery and equipment off-grid—shifting from diesel to electric alternatives.. This, along with timber prefabrication and its reduction in waste, will lead to a quieter, healthier and quicker construction site.
Finally, to spread awareness and secure the legacy of a more sustainable building practice, TAFE students and tradespersons as the practitioners to the future will be engaged and educated - through on-site education and involvement.
In collaboration with
Net Zero Affordable Housing: Architect Brew Koch
Project Summary
Net Zero Affordable Housing explores the relationship between access, availability, affordability and amenity of housing. It looks at the role played by the development industry in the type and cost of houses that are produced and how this affects those that ultimately pay the price. This proposal re-imagines this industry to produce a new type of low impact neighbourhood development where the cost benefits pass to the residents.
Key Statistics
• Between 2025–2029, ~150,000 new homes will be built in Greater Melbourne—60% detached houses, 40% apartments.
• Net Zero apartments could save 1.2 Mt CO₂ (embodied) and 0.57 Mt CO₂ (operational)—equal to removing 380,000 cars.
• Business as usual drives high costs and risks across land, development, and construction—becoming increasingly unsustainable.
• Net Zero Affordable Housing lowers risks and costs, offering shorter timelines, reduced expenses, higher long-term value, and 40% lower household costs.
• Benefits include better amenity, healthier walkable communities, job proximity, and improved workforce participation.
• Proposed dwellings can deliver: 100% energy savings, 30% water savings, 100% landfill diversion, and up to 100% embodied carbon reduction.
• Net Zero upgrade adds $10k–$15k per apartment but saves ~$3,000/year— payback in ~4 years.
• Each Net Zero apartment can save 21 tCO₂ in embodied emissions and 9.5 tCO₂e in operational emissions annually.
Esther Stewart
Architect Brew Koch
Embodied Emissions
The materials and processes we use must transform our new buildings to carbon banks rather than carbon emitters.
Dematerialise: Avoid unnecessary materials Material selection
Approximately 60,000 new homes will be built in Greater Melbourne over the next 5 years168
End high embodied carbon building construction
Nothing New: Specify reused materials from on-site demolition or local sources
Circular Materials: Recycled materials that can be reused
Virgin Materials: Low embodied carbon
Embodied Emissions
The Challenge
Embodied carbon represents 11% of all global carbon emissions169. It is not enough for new buildings to be zero impact in their operation if their construction has a significant negative impact.
There are a number of complications when selecting building materials which reduce the uptake of low carbon construction currently, including cost, spatial impacts, flammability, structural capability and material circularity. Material certification processes can be expensive and time consuming in order to ensure materials are safe for use, but this can further limit the availability of innovative circular and organic materials.
France and Denmark have both implemented embodied carbon limits in construction which step down towards zero over time, which is leading to significant uplift in low carbon material research and availability in Europe170 171.
Netherlands
The Netherlands was one of the first countries to consider whole life net zero policies
• In 2018 it was mandated to report embodied carbon in residential and office buildings as part of the building permit.
• National environmental product declaration database
• Standardised method for whole building life assessment172
Copenhagen
Copenhagen introduced strict carbon regulations into their building policies
• 12kgCO2eq/m2 limit for buildings over 1000m2.
• Mandatory lifecycle assessments for smaller buildings171 .
New Zealand
Building for Climate Change Programme (2020) introduces a scheduled scheme of lowering embodied emissions and operational carbon in steps, becoming fully Net Zero by 2050.
• Reports on embodied carbon in all new buildings mandatory by 2025
• Caps on embodied carbon emissions lowered incrementally from 2026-2030
• Fully carbon-zero by 2050174
New South Wales
From Octover 1, 2023, all new developments in NSW were required to report their embodied emissions to promote sustainable building practices
• The implementation of the Sustainable Buildings SEPP sets out standards for reducing the amount of embodied carbon in new developments in NSW
• Using BASIX and NABERS to assist with reporting, the initiative exists to reduce the carbon emissions created in the building and construction industry178 179.
Where Is This Currently Happening?
New York
Initiatives to lower embodied carbon during the procurement process were implemented, accelerating the development and availability of low carbon materials
• New York targets 40% less embodied carbon by 2030: and net zero embodied carbon by 2050
• Embodied carbon procurement policies in: Washington, Oregon, California, Colorado, Minnesota, Connecticut, New York, and New Jersey172
France
France’s RE2020 regulation
• Mandates analysis of embodied emissions over the whole life cycle from creation to demolition
• Dictates carbon caps for different building typologies
• 52% reduction of embodied carbon emissions in all new buildings made in 2031170
Western Australia
The City of Vincent's Built Form Policy required development applications to submit an ESD report inlcuding a sustainable design assessment
• This stemmed out of a target to reduce 50% of the life-cycle emissions for buildings in the LGA.
• The adoption of the Built Form Policy has resulted in 20,742 tCO2e saved through the adoption of environmental changes from the planning process176 177.
A New Normal Solution
New buildings should be constructed with the lowest possible embodied carbon impact of materials. All buildings should target zero embodied carbon through a combination of organic materials which sequester carbon such as mass timber, cork, hemp products and agricultural waste product, as well as low carbon and circular “technical” materials such as recycled metals and materials made from waste175.
Melbourne needs a step down embodied carbon approach, requiring all new buildings to reduce embodied carbon year on year, reaching zero embodied emissions by 2030. All existing buildings should be retrofit rather than demolished, with infeasibility of retrofit to be demonstrated by developers when demolition is proposed. Low and zero carbon material alternatives should be prioritised in certification schemes such as flammability ratings, with grants offered to material suppliers to accelerate this process where suitable.
Victoria's plantation estate currently spans 386,000 hectares, accounting for 1.7% of the state's total land area. There is potential to expand this by an additional 227,000 to 454,000 hectares by utilising underused land 180 181 182 183. This land could produce between 2.84 and 5.68 million cubic meters of raw logs annually. That output could yield 1.2 to 2.4 million cubic meters of CLT— enough to construct 15,000 to 30,000 fully timber-built homes each year using responsibly sourced material184 185 186 187.
Embodied Emissions
Transforming Quarries for Future Materials
OPENWORK, Kerstin Thompson
Architects & Josh Riesel
Project Summary
The infrastructure left in the wake of the extraction of resources is a resource in itself. This proposal is an entrepreneurial takeover of the scale, geomorphology, microclimate and infrastructure of the quarry as a site for rehabilitation through the production of local species biomaterials.
Key Statistics
• Victoria has ~535 active Quarries. The state also has an estimated 900 quarries in total. With the quarries mostly concentrated reasonably close to Greater Melbourne, the location of greatest demand.
• Repurposing just 10% (110 hectares) of Deer Park Quarry—the largest in Victoria— for mycelium cultivation could yield up to 280,000 tonnes per year. This could produce around 360 million biobricks annually, enough to construct approximately 36,000 single-storey houses each year.
• Repurposing 50% (550 hectares) of Deer Park Quarry for forestry could generate up to 14,000 m3 of raw logs annually. This would produce around 7,000 m3 of processed timber—enough to provide structural framing for approximately 500 single-storey houses each year.
• A typical on-site mass timber manufacturing facility in a repurposed quarry could process between 5,000 to 7,000 m3 of CLT per year.
• Victoria’s extractive resources industry generates around $1 billion annually at the quarry gate, highlighting both its economic significance and the scale of opportunity to transition towards more sustainable, circular product systems.
Esther Stewart
Architect Brew Koch
Esther Stewart
Brew Koch
Funding the Transition
It has been estimated that the 12 initiatives will require around $140 billion in investment. But this is not simply a cost, the investment will pay for itself in less than 10 years, and continue to be profitable in the long term.
To put this in perspective, this is equivalent to:
• Roughly 13% of Victoria’s superannuation pool with an estimated return on investment significantly greater than that of average superannuation funds188 189.
• Per person it is similar to the cost of private health insurance or car insurance over 14 years, but as an investment, not as a cost190
In total, we need to invest an average of $30 billion annually over the next 5 years. To compare to other significant investments:
• Aukus Nuclear Submarine Deal: $368 billion investment over 26 years with no economic return2
• The proposed Stage 3 Tax Cuts: $106 Billion over 4 years, with no economic return8
• Suburban Rail Loop East and North: $216.7 Billion over 65 years 3
• Metro Tunnel: $13.48 Billion over 10 years 4 5
• North East Link: $11.66 Billion over 9 years 6 7
Funding the Transition
Who will invest in the transition?
State Government can drive this transition through subsidies and initiating public private partnerships (PPPs).
Potential roles of the public sector, private sector and individuals in funding this transition for Greater Melbourne are shown in the table.
The most likely outcome is that the private sector will drive this transition both in scale of investment & in profits while providing the people of Melbourne with secure jobs.
In Copenhagen, private green investment initiatives in areas such as public transport, renewable energy, retrofitting buildings and electric vehicles to the value of €40 billion was unlocked with a Public Investment of €360 million, which equates to less than 1% of the overall cost of the transition191.
Investing in the transition over the next 5 years will provide an enormous amount of stimulus to employment, which will be integral in the economic wellbeing of Melbourne while also contending with the ongoing climate crisis. It is estimated to provide an average of 90,600 jobs in construction & installation annually until 2030. After this has completed it will result in an estimated 43,400 ongoing jobs.
Public Engagement
This is a lot to change, in a relatively short period of time. Rapid change on this scale has happened many times before but humans instinctively don’t like change all that much. History has proved that change can benefit us, even if we are reluctant towards it.
So how can we accelerate this transition?
Technology & Culture
We make this change easy on ourselves by connecting each of these solutions with cultural activities. We give the technology that makes our cities work a feeling. Rather than hiding it away, we allow people to be emotionally connected to our infrastructure.
A New Normal
A New Normal is a 5-step process designed to familiarise the public with the transformation while informing politicians with public support and enabling businesses to provide the solutions.
1. Workshop it;
2. Communicate it;
3. Prototype it;
4. Build it; and
5. Replicate it
Dinner
It kicks off with a workshop. ANN Melbourne began in the most influential cultural institution in the city - the National Gallery of Victoria, where a workshop was held in 2020.
Influential minds across a wide range of industries come together to redesign the infrastructure of the city in one day. It’s a thought-provoking workshop that shows a number of already existing solutions from around the globe, and asks the question: why not implement them all here?
Communications
The results of discussions and research form the basis for the report & website.
Instead of being forced to tell our politicians what we don’t want through protest, this creates an opportunity to work together with our politicians and technology to create engaging cultural activities showing what we do want, through virtual prototypes.
Each combination of technology and culture selected by the people will form a report. We will collect data from this process and provide it to our political leaders to give the public a voice. Successful concepts that are well received by the public will move through to the prototyping phase.
Prototypes
As public support from Design Week 2025 gains momentum, we move beyond virtual reality and build 12 small scale physical prototypes across the city. We measure attendance and sentiment to determine the success of each proto-test.
The prototypes enable us all to touch and feel them, discuss them, engage with them, interact with them, and provide our feedback. These examples are aimed at matching essential technology for the future of our cities with cultural activities. These prototypes are only temporary to engage with people and test the cultural connections. Once again, we collect data from that process and provide it to our political leaders to give the public a voice.
Full Scale
If the prototypes are successful we build them at full scale. 20 full scale permanent projects will be built in this phase across the city. These will be economically feasible, and sustain their own operations.
With the vast reduction of cars in the streets, there is an incredible opportunity to use this space for public infrastructure, and the public engagement process integrated into the prototyping phase enables funds to be locally sourced – empowering the people to own their own infrastructure.
Replication
The process of prototyping and building full scale versions of each initiative throughout the city will allow us to identify and overcome all the barriers for their wider implementation. The full-scale models will also act as financial and technical case studies proving the feasibility and helping to secure investment. Once we have built a full-scale version of each, we simply replicate them throughout the city until self-sufficiency is achieved.
To address the full climate impact of our built environment, we propose mandating 100% electric design and operation for all new buildings from 2025, banning the replacement of gas equipment, and incentivise electrification of existing buildings using tools like land tax and council rates. As Schmidt et al. highlight, “operational energy policies alone are insufficient,”192since they miss the significant “embodied GHG emissions associated with materials and construction.” We therefore propose embedding energy and water efficiency standards into planning schemes for retrofits, along with council-led retrofit support and cost-neutral financing. Our net-zero buildings framework aims to make all new buildings net-zero under planning schemes by 2030, recognising the study’s finding that “the GHG emissions of a typical new detached home over its lifetime are grossly underestimated if embodied emissions are excluded.”192
Additionally, we will require rooftop solar on new builds and major renovations, support community solar, and mandate productive rooftops to accelerate
decarbonisation across all building types.
Our broader strategy will work with water authorities to create frameworks for rainwater capture, reuse, and treatment at both the property and neighbourhood scale. We need to develop organic waste-to-energy and circular economy policies that include mandated food and organic waste collection, incentives for reuse, repair, and community-scale recycling, and restrictions on products destined for landfill. These efforts are critical given the interrelated emissions from consumption, construction, and waste. We will also support microclimate infrastructure, healthy urban forests, and coordinated green networks to enhance resilience and liveability. In transport, we propose banning new internal combustion engine vehicles by 2025 and mandating a full transition to zero-carbon transport, including public transit and retrofitted vehicles, by 2030. The urgency of these measures is reinforced by the finding that “each year of delay in decarbonising new builds locks in emissions for decades.”192
Policy Landscape
Australia’s construction policy framework, centred around the National Construction Code (NCC) 2022, is not yet equipped to meet the nation’s emissions reduction targets. While the NCC has strengthened operational performance, such as mandating a 7 star thermal rating for new homes210, it fails to address embodied carbon. As Schmidt, Crawford, and Warren-Myers (2020) warn, “a significant proportion of life cycle GHG emissions, often over 50%, can come from embodied sources” in efficient homes211.
Infrastructure Australia (2023) echoes this concern, stating that “upfront emissions from buildings and infrastructure accounted for 7% of national emissions in 2022–23,” and that this could be reduced by 23% within five years through coordinated action212
While complementary policies promote renewable energy, water efficiency, and waste reduction, such as solar PV requirements, electrification incentives, and landfill diversion targets, these efforts remain fragmented, as shown in the pathways graphic below and policy timeline. Without an integrated policy that includes embodied emissions, Australia risks missing its legislated goal of a 43% emissions cut by 2030213.
A unified framework that mandates lifecycle carbon accounting, spanning materials, waste, water, and energy, is essential to ensure new housing and commerical developments support, rather than undermines, Australia’s climate commitments.
Policy Timeline
2024
2031
2011
2022
2024
2030
Conclusion
The question was asked: if Melbourne implemented every single profitable initiative over the next decade, targeting the environmental and financial threshold, how far could we get?
The answer; we can transform Melbourne to operate on resources that will never run out — and profit from the transition. It is possible.
By 2030 Melbourne can be an electrical city powered entirely by renewables. The LaTrobe Valley can become a renewable energy and agriculture hub. Our air will be cleaner, resulting in improvements in public health and quality of rainwater collected from rooftops. Our buildings will be more comfortable, and healthier, with better indoor environmental quality. Our water system can be an endless loop, with natural flows being returned to groundwater and waterways, which are no longer polluted by stormwater runoff from roads trafficked by fossil fuel burning cars. Our organic waste can give us energy which can be used to treat water and export to the electrical grid, as well as heat public demands such as pools. Additionally, our organic waste can also provide fertiliser to be used to grow food within the city and to stimulate agriculture and soil rehabilitation in the LaTrobe Valley.Our city can avoid send any waste to landfill, instead benefiting from the reuse and recycling of materials in a circular manner.
Greater Melbourne will be more resilient to resource depletion, changing rainfall patterns due to climate change and more extreme temperatures.
But this utopian scenario also has economic benefits – it will be earning $16 billion annually compared to a business as usual scenario and providing much needed jobs – 90,600 during construction and 43,400 in ongoing operations.
Melbourne is uniquely placed to lead this transition, and become an example for other cities in the world to follow. It can then export its knowledge and experience to the rest of the world as other cities transition. Experts from around the world will visit Melbourne to learn about the process, and other cities will invite experts from Melbourne to visit and help implement the solutions there. Universities can participate and apply their expertise, positioning themselves as world leaders attracting a wider range of students from around the world.
This future will benefit us all. Let’s get started. Not tomorrow. Today.
Hansen Landfill
Wollert
Werribee Tip
Ravenhall Landfill Western Treatment Plant Geelong
Frankston
Pakenham
St Kilda City of Melbourne Port of Melbourne
Melbourne Airport
Imported Oil Landfill Dandenong South
Eastern Treatment Plant
La Trobe Valley Coal Gas sourced from Gippsland Basin
Upper Yarra Reservoir
Yarra Glen Reservoir
Mount Dandenong
Mount Macedon Cardinia Reservoir Silvan Reservoir
Yan Yean Reservoir Tarago Reservoir
Yarra Ranges National Park
Executive Summary
Page iv - iiv
1. APRA. “APRA Releases Superannuation Statistics for December 2024 | APRA.” Apra.gov. au, February 27, 2025. https://www.apra.gov.au/news-and-publications/apra-releasessuperannuation-statistics-for-december-2024. Accessed May 10, 2025.
2. Greene, Andrew, and Doran, Matthew. “Australian Nuclear Submarine Program to Cost up to $368b as AUKUS Details Unveiled.” ABC News, 13 Mar. 2023. https://www.abc.net.au/ news/2023-03-14/aukus-nuclear-submarine-deal-announced/102087614. Accessed September 12, 2024.
3. Parliamentary Budget Office. “Suburban Rail Loop Cost to Build and Operate East and North Sections,” 2024. https://static.pbo.vic.gov.au/files/PBO_Suburban-Rail-Loop-East-and-Northbuild-and-operate-costs_PUBLICATION.pdf. Accessed May 12, 2025.
4. Victoria’s Big Build. “Metro Tunnel Project.” Victoria’s Big Build, August 21, 2024. https://bigbuild. vic.gov.au/sandpit/project-landing-pages/drafts/metro-tunnel-project. Accessed May 12, 2025.
5. Victoria’s Big Build. “Metro Tunnel Project Frequently Asked Questions.” Victoria’s Big Build, September 21, 2023. https://bigbuild.vic.gov.au/projects/metro-tunnel/about/faq. Accessed May 12, 2025.
6. Eddie, Rachel. “Cost of Victoria’s Major Projects Jumps $11.6 Billion in a Year.” The Age, February 19, 2025. https://www.theage.com.au/politics/victoria/victoria-s-major-projects-costs-increase11-6-billion-in-a-year-20250218-p5ld2b.html. Accessed May 12, 2025.
7. Victoria’s Big Build. “Design and Planning Community Feedback Construction Complete.” https://bigbuild.vic.gov.au/__data/assets/pdf_file/0005/766688/NELP2040-Timeline-May2023-A5.pdf. Accessed May 12, 2025.
8. Australian Treasury. “Advice on Amending Tax Cuts to Deliver Broader Cost-of-Living Relief.” Australian Government Treasury. pp. 2. https://treasury.gov.au/sites/default/files/2024-01/taxcuts-treasury-advice.pdf. Accessed September 12,2024.
10. Ellis, Alice, and Liv Condous. “Melbourne Has Fallen in the Official Ranking of the World’s Most Liveable Cities for 2024.” Time Out Melbourne, July 1, 2024. https://www.timeout.com/ melbourne/news/melbourne-has-fallen-in-the-official-ranking-of-the-worlds-most-liveablecities-for-2024-070124. Accessed May 12, 2025.
11. Moran, Daniel. “Global Gridded Model of Carbon Footprints.” citycarbonfootprints.info. https:// citycarbonfootprints.info/. Accessed May 12, 2025.
12. City of Melbourne. “Our City | City of Melbourne.” Vic.gov.au, 2018. https://www.melbourne.vic. gov.au/our-city. Accessed May 9, 2025.
13. State Revenue Office of Victoria, and George Diamantopoulos. “Greater Melbourne and Urban Zones | State Revenue Office.” State Revenue Office, April 21, 2015. https://www.sro.vic.gov.au/ greater-melbourne-map-and-urban-zones. Accessed May 13, 2025.
14. Profile ID. “Estimated Resident Population (ERP) | Australia | Community Profile.” profile.id.com. au. https://profile.id.com.au/australia/population-estimate?webid=270. Accessed May 13, 2025.
15. Ferguson, Susan, Greg Nolan, and Peter Walker. “The Royal Exhibition Building.” University of Tasmania. https://www.utas.edu.au/__data/assets/pdf_file/0005/446684/ MelbExhibitionBuilding.pdf. Accessed May 13, 2025.
16. Ball, Allison, Justin Billing, Caitlin McCluskey, Pam Pham, Owen Pittman, Sean Lawson, Shamim Ahmad, Andrew Starr, Jonathon Rousseau, and Nicholas Lambert. 2018. “Australian Energy Update 2018.” Australian Energy Update. Department of the Environment and Energy. https:// www.energy.gov.au/sites/default/files/australian_energy_update_2018.pdf. Accessed May 13, 2025.
Page 3 - 4 continued
17. Dudley, Bob. 2019. “BP Statistical Review of World Energy 2019.” BP Statistical Review of World Energy. 68th ed. https://www.bp.com/content/dam/bp/business-sites/en/global/corporate/pdfs/ energy-economics/statistical-review/bp-stats-review-2019-full-report.pdf. Accessed May 13, 2025.
18. Longbottom, Jessica. 2018. “Australians Will Have to Get Used to Drinking Recycled Water.” ABC News. March 19, 2018. https://www.abc.net.au/news/2018-03-19/drinking-recycledwater/9546900. Accessed May 13, 2025.
19. “Victoria’s Waste Performance and Projection Model Dashboard.” 2025. Vic.Gov.Au. May 2, 2025. https://www.vic.gov.au/victorias-waste-projection-model-dashboard. Accessed May 13, 2025.
20. United Nations Economic Commission for Europe. n.d. “The Challenge | UNECE.” United Nations Economic Commission for Europe. Accessed November 14, 2024. https://unece.org/challenge Accessed November 14, 2024.
21. Walker, Glen R., Russell S. Crosbie, Francis H. S. Chiew, Luk Peeters, and Rick Evans. 2021. “Groundwater Impacts and Management under a Drying Climate in Southern Australia” Water 13, no. 24: 3588. https://doi.org/10.3390/w13243588.
22. “Melbourne’s Water Story.” n.d. https://waterstory.melbournewater.com.au/content/our-liveablecity/water-scarcity-a-worldwide-issue. Accessed May 13, 2025.
23. Puiu, Tibi. “How Long before the World Runs out of Fossil Fuels?” ZME Science, March 27, 2023. https://www.zmescience.com/feature-post/how-long-fossil-fuels-last-43432/. Accessed November 27, 2024.
24. Lumley, Graham. “When Will We Run out of Fossil Fuels?” BKV Energy, September 30, 2024. https://bkvenergy.com/learning-center/running-out-of-fossil-fuels/. Accessed November 27, 2024.
01. Perpetual Motion
Page 13 - 14
25. “Greater Melbourne Number of Cars per Household.” 2021. Profile ID. 2021. https://profile.id.com. au/australia/car-ownership?WebID=270. Accessed May 13, 2025.
26. Ernst & Young. 2020. “Final Report for the Electric Vehicle Council: Uncovering the Hidden Costs and Benefits From Electric Vehicles.” Report. Electric Vehicle Council. https:// electricvehiclecouncil.com.au/wp-content/uploads/2020/09/EV-True-Value.pdf. Accessed May 13, 2025.
27. Electric Vehicle Council and Asthma Australia. 2019. “Cleaner and Safer Roads for NSW.” Electric Vehicle Council and Asthma Australia. https://electricvehiclecouncil.com.au/wp-content/ uploads/2019/06/EVC-Cleaner-and-Safer-Roads-for-NSW_V3-Single.pdf. Accessed May 13, 2025.
Page 15 - 16
28. Our World in Data. “Registered Vehicles per 1,000 People,” May 20, 2024. Our World in Data. https://ourworldindata.org/grapher/registered-vehicles-per-1000-people. Accessed August 16, 2024.
29. Transport Victoria. 2021. “Transport Sector Emissions Reduction Pledge.” https://www. climatechange.vic.gov.au/victorian-government-action-on-climate-change/Transport-sectorpledge-accessible.pdf. Accessed May 13, 2025.
30. José Rojo Martín. “Study: PV, Storage Poised to Become Top Energy Job Creators by MidCentury.” PV Tech, January 22, 2020. https://www.pv-tech.org/study-pv-storage-poised-tobecome-top-energy-job-creators-by-mid-century/. Accessed November 14, 2024.
31. Mann, Jakki. “Bogota Slashed Pollution and Road Deaths with One Simple Tool: A Bus.” Apolitical, September 24, 2018. https://apolitical.co/solution-articles/en/bogota-slashedpollution-and-road-deaths-with-one-simple-tool-a-bus. Accessed August 16, 2024.
Page 15 - 16 Continued
32. Cellina, Francesca, Marco Derboni, Nikolett Kovacs, Andrea Emilio Rizzoli, and Fabio Cartolano. “Integrating Public Transport and Car-Pooling Services: Evidence from a Field Test in Switzerland.” Conference: Transport Research Arena 2020 At: Helsinki, Finland, April 27, 2020, 8. https://www.researchgate.net/publication/340844766_Integrating_public_transport_ and_car-pooling_services_Evidence_from_a_field_test_in_Switzerland. Accessed August 16, 2024.
33. State of Green. “The Zero Emission Public Transport of the Future,” August 10, 2023. https:// stateofgreen.com/en/solutions/the-zero-emission-public-transport-of-the-future/. Accessed August 16, 2024.
34. GIKEN LTD. “ECO CycleTM.” Accessed August 16, 2024. https://www.giken.com/en/products/ ecocycle/. Accessed August 16, 2024.
35. De Clerk, Eve. “Paris Orders 800 Electric Buses to Fight Air Pollution in the City.” Intelligent Transport, July 17, 2019. https://www.globalrailwayreview.com/?utm_medium=referral&utm_ source=intelligenttransport.com. Accessed August 16, 2024.
36. Jauntmotors.com. “Jaunt - Beautiful Electric Vehicle Conversions,” 2024. https://www. jauntmotors.com/. Accessed August 16, 2024.
37. Keegan, Matthew. “Shenzhen’s Silent Revolution: World’s First Fully Electric Bus Fleet Quietens Chinese Megacity.” The Guardian, December 12, 2018. https://www.theguardian.com/cities/2018/ dec/12/silence-shenzhen-world-first-electric-bus-fleet. Accessed August 16, 2024.
38. McAskie, Lauren. “How Oslo Hit Reverse on Its City Street Parking and Revived City Life – and How Your City Can Too.” City Changers – Home Base for Urban Shapers, January 18, 2021. https://citychangers.org/how-oslo-hit-reverse-on-its-city-street-parking/. Accessed August 16, 2024.
Page 17 - 18
39. EV Europe. 2024. “Complete EV HypETM Conversion Kit-High Voltage Max 90 kWatt-180 VDC - EV Europe.” March 6, 2024. https://eveurope.eu/en/product/complete-ev-hype-conversion-kithigh-voltage-max-90-kwatt-180-vdc/. Accessed May 13, 2025.
40. “Automobile Mechanic Hourly Pay in Australia in 2025 | PayScale.” n.d. https://www.payscale. com/research/AU/Job=Automobile_Mechanic/Hourly_Rate. Accessed May 13, 2025.
41. West, Ev. n.d. “CATL 173.88V 173Ah 30kWh LFP Battery Pack.” EV West. https://evwest.com/catl173-88v-173ah-30kwh-lfp-battery-pack. Accessed May 13, 2025.
42. Lovell, Justine. “EVs: Are They Really More Efficient?” Australian Energy Council, January 30, 2020. https://www.energycouncil.com.au/analysis/evs-are-they-really-more-efficient/. Accessed August 16, 2024.
43. Dervisevic, Hanan, and Dannielle Maguire. 2024. “The Most Affordable Cities for Transport and How Much People Are Paying for Fuel.” ABC News. March 5, 2024. https://www.abc.net.au/ news/2024-03-05/cost-of-living-public-transport-fuel-driving-expenses-report/103546164. Accessed May 13, 2025.
44. Rail Futures Institute. 2019. “Melbourne Rail Plan 2020-2050.” https://www.railfutures.org. au/wp-content/uploads/2019/09/15329_MRP2050main_FinalPages.pdf. Accessed May 13, 2025.
45. Williams, Gabrielle and Department of Transport and Planning. 2024. “Victoria’s Zero Emission Bus Transition Plan.” https://www.vic.gov.au/sites/default/files/2024-11/DTP1101-Victorias-ZeroEmission-Bus-Transition-Plan_A4_v5.pdf. Accessed May 13, 2025.
46. Change, Climate. 2025. “Greenhouse Gas Emissions.” Climate Change. March 26, 2025. https:// www.climatechange.vic.gov.au/greenhouse-gas-emissions. Accessed May 13, 2025.
47. U.S. department of energy. “All-Electric Vehicles.” Fuel Economy, 2017. https://www.fueleconomy. gov/feg/evtech.shtml. Accessed November 18, 2024.
48. “Off-street Car Parks With Capacity and Type.” 2021. November 2, 2021. https://data.melbourne. vic.gov.au/explore/dataset/off-street-car-parks-with-capacity-and-type/table/?disjunctive. clue_small_area&disjunctive.parking_type&disjunctive.block_id&disjunctive.parking_ spaces&refine.census_year=2023&refine.clue_small_area=Melbourne+(CBD)&refine.parking_ type=Private&refine.parking_type=Commercial. Accessed May 13, 2025.
02. Electrify Architecture
Page 25 - 26
49. “New Victorian Homes to Go All Electric From 2024.” n.d. Premier. https://www.premier.vic.gov. au/new-victorian-homes-go-all-electric-2024. Accessed May 13, 2025.
50. GAS. 2021. “Gas Vision 2050: An Attainable Zero Carbon Future for Gas Across Australia’s Economy.” https://www.energynetworks.com.au/resources/fact-sheets/reliable-and-clean-gasfor-australian-homes-2/. Accessed May 13, 2025.
51. “Gas Versus Electric in Victorian Homes | Sustainability Victoria.” n.d. Sustainability Victoria. https://www.sustainability.vic.gov.au/research-data-and-insights/research/state-ofsustainability-report/state-of-sustainability-report-2024/gas-versus-electric-in-victorianhomes. Accessed May 13, 2025.
Page 27 - 28
52. Landrigan, Philip J., Howard Frumkin, and Brita E. Lundberg. “The False Promise of Natural Gas.” New England Journal of Medicine 382, no. 2 (January 9, 2020): 104–7. https://www.nejm.org/ doi/10.1056/NEJMp1913663. Accessed August 16, 2024.
53. Gudova, Monika. 2020. “What Is a MJ? | Megajoules & Gas Prices Explained.” Edited by Tara Donnelly. Canstar Blue. September 2, 2020. https://www.canstarblue.com.au/gas/megajoulescosts-explained/. Accessed May 14, 2025.
54. “Residential Energy Consumption Benchmarks.” 2020. Final Report for the Australian Energy Regulator. https://www.aer.gov.au/system/files/Residential%20energy%20consumption%20 benchmarks%20-%209%20December%202020_0.pdf. Accessed May 14, 2025.
55. Statista. 2024. “Average Annual Household Gas Usage Australia 2020, by State.” December 17, 2024. https://www.statista.com/statistics/1377365/australia-average-annual-household-gasusage-by-state/#:~:text=In%202020%2C%20the%20average%20annual,to%20only%20 7.24%20thousand%20megajoules. Accessed May 14, 2025.
56. Rahman, Hasanur. “Heat Pump Hot Water vs Gas Hot Water System - Cyanergy.” Cyanergy, September 20, 2022. https://cyanergy.com.au/blog/heat-pump-vs-gas-hot-water-system/ Accessed November 18, 2024.
57. Grattan Institute. “Grattan Institute Report No. 2023-08, June 2023.” Grattan Institute, June 2023. pp. 11, 16. https://grattan.edu.au/report/getting-off-gas/. Accessed August 16, 2024.
58. Emerson Smith, Josh. “San Diego to Ban Natural Gas in New Homes and Businesses as Part of Climate Fight.” Phys Org, August 4, 2022. https://phys.org/news/2022-08-san-diego-naturalgas-homes.html. Accessed August 16, 2024.
59. Mannheim, Markus. “No New Gas Connections for Canberra Homes and Businesses from next Year.” ABC News, August 4, 2022. https://www.abc.net.au/news/2022-08-04/act-no-new-gasconnections-from-2023-new-homes/101299552. Accessed August 16, 2024.
60. Rapid Transition Alliance. “The Dash Away from Gas: How the Netherlands Kicked a Big Fossil Fuel Habit.” Rapid Transition Alliance, June 2, 2021. https://rapidtransition.org/stories/the-dashaway-from-gas-how-the-netherlands-kicked-a-big-fossil-fuel-habit/. Accessed August 16, 2024.
61. Electrify 2515. “Electrify 2515 – Decarbonising a Suburb | Superior Training Centre.” Superior Training Centre. https://www.stc.nsw.edu.au/electrify-2515/. Accessed August 16, 2024.
62. Henry, Matt, and Olivia Rousset. 2023. “Rewiring Australia Founder Saul Griffith Is a Man on a Mission to Electrify the Nation, One Suburb at a Time.” ABC News. February 27, 2023. https:// www.abc.net.au/news/2023-02-27/saul-griffith-plan-to-rewire-australia/101762960. Accessed May 19, 2025.
Page 29 - 30
63. Planning. 2024. “Victoria’s Gas Substitution Roadmap.” Planning. December 13, 2024. https:// www.planning.vic.gov.au/guides-and-resources/strategies-and-initiatives/victorias-gassubstitution-roadmap. Accessed May 14, 2025.
64. Origin Energy. “Current Residential Electricity & Gas Tariffs.” Origin Energy, August 2023. https:// www.originenergy.com.au/wp-content/uploads/247/multi-site-builders-pricing-booklet-v37.pdf Accessed August 16, 2024.
65. Energy Made Easy. “Energy Made Easy: Residential Gas Plan Origin Energy Origin Basic,” Energy Made Easy Australian Goverment, 2024. https://www.energymadeeasy.gov.au/ plan?id=ORI432838MRG7&postcode=2000. Accessed November 18, 2024.
66. Wright, Matthew, and Patrick Hearps. Zero Carbon Australia Stationary Energy Plan. 2013. Fitzroy, Victoria 3065: Beyond Zero Emissions, 2013. pp. 108-110. https://www.bze.org.au/. Accessed August 16, 2024.
67. Australian National Greenhouse Accounts Factors. 2024. “Australian National Greenhouse Accounts Factors.” Department of Climate Change, Energy, the Environment and Water. https:// www.dcceew.gov.au/sites/default/files/documents/national-greenhouse-account-factors-2024. pdf. Accessed May 14, 2025.
68. Sustainability Victoria. 2024. “State of Sustainability Report 2024.” https://assets.sustainability. vic.gov.au/susvic/State-of-Sustainability-Report-2024.pdf. Accessed May 14, 2025.
69. Li, Jimmy. 2024. “How Much Does It Cost to Switch From Gas to Induction Cooking?” ZapCat. July 7, 2024. https://www.zapcat.com.au/how-much-does-it-cost-to-switch-from-gas-to-inductioncooking/. Accessed May 14, 2025.
70. “Solt 60cm Electric Oven Stainless Steel With 10amp Plug GGSO605MS.” n.d. The Good Guys. https://www.thegoodguys.com.au/solt-60cm-electric-oven-stainless-steel-with-10amp-plugggso605ms. Accessed May 14, 2025.
71. Australian Hot Water. 2024. “8 Steps to Calculating the Price of a Hot Water System.” March 20, 2024. https://australianhotwater.com.au/hot-water-system-articles/8-steps-calculating-pricehot-water-system/. Accessed May 14, 2025.
03. Efficient Architecture
Page 33 - 34
72. “Energy Account, Australia, 2022-23 Financial Year.” 2024a. Australian Bureau of Statistics. November 28, 2024. https://www.abs.gov.au/statistics/industry/energy/energy-accountaustralia/latest-release. Accessed May 14, 2025.
Page 35 - 36
73. World Economic Forum.“For Net-Zero Cities, We Need to Retrofit Our Older Buildings. Here’s What’s Needed.” World Economic Forum. https://www.weforum.org/agenda/2022/11/net-zerocities-retrofit-older-buildings-cop27/. Accessed August 16, 2024.
75. Energiesprong. “Serial Retrofits: Energiesprong Pilot Project Started in Bochum –Energiesprong.” Energiesprong. https://energiesprong.org/serial-retrofits-energiesprong-pilotproject-started-in-bochum/. Accessed August 21, 2024.
76. Oates, Lucy, et al. “Improving Energy Efficiency for All: Lessons on Sustainable Building Retrofits from Shanghai, China.” University of Leeds. pp. 1. https://urbantransitions.global/wp-content/ uploads/2020/03/Improving_Energy_Efficiency_for_all-_Shanghai_China_web_FINAL.pdf. Accessed August 21, 2024.
78. Barrett-Duckett, Hannah, et al. “Retrofit for the Future: A Guide to Making Retrofit Work.” Technology Strategy Board - UK Government. https://assets.publishing.service.gov.uk/ media/5a82135fe5274a2e87dc1041/Retrofit_for_the_future_-_A_guide_to_making_retrofit_ work_-_2014.pdf. Accessed August 21, 2024.
Page 37 - 38
79. Fox-Reynolds, Karla, Katie Vines, NSW Department of Planning, Industry and the Environment, VIC Department of Environment, Land, Water and Planning, Curtin University, Roberto Minunno,
University of Technology Sydney, and Kerryn Wilmot. 2021. “Pathways to Scale: Retrofitting One Million+ Homes.” Final Report.
81. “Victoria’s Renewable Energy Targets 2023/24 Progress Report.” n.d. https://www.parliament. vic.gov.au/496214/globalassets/tabled-paper-documents/tabled-paper-8700/vret-progressreport-2023-24.pdf. Accessed May 14, 2025.
Page 47 - 48
82. Doctors for the Environment Australia. “Fossil Fuels Are a Health Hazard,” 2024. Doctors for the Environment Australia. https://www.dea.org.au/fossil_fuels_are_a_health_hazard. Accessed November 19, 2024.
83. United Nations Environment Programme. n.d. “Why Dirty Air Costs Us Trillions Every Year.” UNEP. https://www.unep.org/news-and-stories/video/why-dirty-air-costs-us-trillions-every-year. Accessed May 20, 2025.
84. Carrington, Damian. “Air Pollution Deaths Are Double Previous Estimates, Finds Research.” The Guardian, 12 Mar. 2019, https://www.theguardian.com/environment/2019/mar/12/air-pollutiondeaths-are-double-previous-estimates-finds-research. Accessed August 23, 2024.
85. Lins, Christian. “De-Risking Wind and Solar.” Oliver Wyman, 2021. https://www.oliverwyman. com/our-expertise/insights/2021/oct/de-risking-wind-and-solar.html. Accessed November 19, 2024.
86. Horngren, Dr Tyra . “How Australia’s Energy System Could Change in a Net Zero Future.” Climateworks Centre, June 18, 2024. https://www.climateworkscentre.org/news/how-australiasenergy-system-could-change-in-a-net-zero-future/. Accessed November 19, 2024.
87. ARENA. “Hydropower and Pumped Hydro Energy Storage - Australian Renewable Energy Agency (ARENA).” Australian Renewable Energy Agency, 2018. https://arena.gov.au/renewable-energy/ pumped-hydro-energy-storage/. Accessed November 19, 2024.
88. International Trade Administration. “Denmark - Renewable Energy Products.” Department of Commerce United States of America International Trade Administration, 20 Jan. 2024, https:// www.trade.gov/country-commercial-guides/denmark-renewable-energy-products. Accessed August 23, 2024.
89. Pforzheimer, Adrian, et al. “Shining Cities 2022 the Top U.S. Cities for Solar Energy.”Environment America, Frontier Group, Apr. 2022. pp. 15-16. https://environmentamerica.org/resources/shiningcities-2022-2/g_Cities-2022-1.pdf. Accessed August 16, 2024.
90. Xu, C., Behrens, P., Gasper, P. et al. Electric vehicle batteries alone could satisfy short-term grid storage demand by as early as 2030. Nature Communications 14, 119 (2023). https://www.nature. com/articles/s41467-022-35393-0. Accessed August 23, 2024.
91. Newton, Bruce. “Bidirectional EV Charging Boost for Australia.” Car Sales, 19 July 2024. https:// www.carsales.com.au/editorial/details/bidirectional-ev-charging-boost-for-australia-146706/ Accessed August 23, 2024.
92. Premier of South Australia. “New Target for Renewables.” Premier of South Australia, 27 Feb. 2024. https://www.premier.sa.gov.au/media-releases/news-archive/new-target-for-renewables. Accessed August 23, 2024.
93. Mining, Energy &. 2024. “Our Electricity Supply and Market.” Energy & Mining. April 18, 2024. https://www.energymining.sa.gov.au/consumers/energy-grid-and-supply/our-electricitysupply-and-market#:~:text=South%20Australia%20generates%20more%20than,net%20 renewable%20energy%20by%202027. Accessed May 15, 2025.
Page 49 - 50
94. Quantistry. “The Largest Batteries in the World | Quantistry,” 2024. https://www.quantistry.com/ blog/the-largest-batteries-in-the-world. Accessed November 19, 2024.
05. Water Unlimited
Page 57 - 58
95. “Water Outlook | Melbourne Water.” n.d. Www.melbournewater.com.au. https://www. melbournewater.com.au/about/what-we-do/publications/water-outlook. Accessed May 14, 2025.
96. Victorian State Government. 2024. Review of Melbourne Water Annual Report. Edited by Melbourne Water. Docklands, Victoria: Melbourne Water.
Page 59 - 60
97. Melbourne Water. 2024. “Desalination | Melbourne Water.” Www.melbournewater.com.au. April 2, 2024. https://www.melbournewater.com.au/water-and-environment/water-management/waterquality/water-treatment/desalination. Accessed May 14, 2025
98. United Nations. “Water Scarcity | International Decade for Action “Water for Life” 2005-2015.” United Nations, 24 November 2014, https://www.un.org/waterforlifedecade/scarcity.shtml Accessed August 23, 2024.
99. Orange County Water District. “GWRS | OCWD.” Orange County Water District, 2020. https:// www.ocwd.com/gwrs/. Accessed August 23, 2024.
100. Veolia. “Resources Regeneration: Inauguration of France’s First Unit for Reusing Treated Wastewater to Produce Drinking Water.” Veolia, 17 November 2023, https://www.veolia.com/en/ our-media/press-releases/reusing-treated-wastewater-resources-regeneration-inaugurationfrances. Accessed August 23, 2024.
101. Network of Asian River Basin Organisations. “Introduction to State-of-The-Art Wastewater Treatment Plants.” Network of Asian River Basin Organisations. pp. 1-4. https://www.narbo.jp/ data/04_materials/ma_sewerage.pdf. Accessed 23 August 2024.
102. Williams, Thea. “The Water Underground: The Future of Water in Perth.” Www.csiro.au, CSIRO, 9 September 2015, https://www.csiro.au/en/news/all/articles/2015/september/the-waterunderground-the-future-of-water-in-perth. Accessed August 23, 2024.
103. Daniel A. “Recycling Sewage into Drinking Water Is No Big Deal. They’ve Been Doing It in Namibia for 50 Years. - the World from PRX.” The World from PRX, 14 Dec. 2016, https://theworld. org/stories/2016/12/15/recycling-sewage-drinking-water-no-big-deal-really-theyve-beendoing-it-namibia. Accessed August 23, 2024.
104. Singapore’s National Water Agency. “Water Quality.” PUB, Singapore’s National Water Agency. https://www.pub.gov.sg/Public/WaterLoop/Water-Quality. Accessed August 23, 2024.
06. Retain the Rain
Page 71 - 72
105. Dr Thami Croeser, and Professor Michele Acuto. 2024. “These Maps Tell Us We Need to Cool Our Sweltering Streets.” Unimelb.edu.au. The University of Melbourne. April 29, 2024. https:// pursuit.unimelb.edu.au/articles/these-maps-tell-us-we-need-to-cool-our-sweltering-streets. Accessed May 15, 2025
106. “DEECA Victorian Water Accounts 2021-22 | Groundwater.” 2021. Vic.gov.au. 2021. https:// accounts.water.vic.gov.au/2022/statewide-summaries/groundwater/?. Accessed May 15, 2025
107.“Prepare for Flooding | Melbourne Water.” n.d. Www.melbournewater.com.au. https://www. melbournewater.com.au/water-and-environment/flooding-advice/prepare-flooding. Accessed May 15, 2025.
Page 73 - 74
108. Greater Western Water, Melbourne Water, South East Water, and yarra Valley Water. 2022. Review of Melbourne’s Water Outlook 2023. 2022. https://www.gww.com.au/sites/default/ files/2022-12/GWW0053_Melbournes_Water_Outlook_Report_V10_Accessible_alt-text.pdf? Accessed May 2025.
Page 73 - 74 continued
109. Water Environment Federation. “First Full-Scale Water Square Opens in Rotterdam.” Stormwater Report, 3 Mar. 2014. https://stormwater.wef.org/2014/03/first-full-scale-watersquare-opens-rotterdam/. Accessed August 23, 2024.
110. Urban Agenda Platform. “Chulalongkorn University Centenary Park | Urban Agenda Platform.” Urban Agenda Platform. https://www.urbanagendaplatform.org/best-practice/chulalongkornuniversity-centenary-park. Accessed August 23, 2024.
111.City of 1000 Tanks. “City of 1000 Tanks.” City of 1000 Tanks, https://www.cityof1000tanks. org/. Accessed August 23, 2024.
112. City of Melbourne. “Fitzroy Gardens Stormwater Harvesting System.” City of Melbourne, https://www.melbourne.vic.gov.au/fitzroy-gardens-stormwater-harvesting-system. Accessed August 23, 2024.
113. Landscape Architecture Built. “Qunli Stormwater Park - Project.” Landscape Architecture Built, 6 November 2022. https://landscapearchitecturebuilt.com/qunli-stormwater-park/. Accessed August 23, 2024.
Page 75 - 76
114. Environment. 2025. “Victoria’s Land Cover Time Series.” Environment. March 20, 2025. https://www.environment.vic.gov.au/biodiversity/Victorias-Land-Cover-Time-Series. Accessed May 16, 2025.
116. Land.Vic. 2024. “Vicmap Vegetation.” Land.Vic. October 3, 2024. https://www.land.vic.gov. au/maps-and-spatial/spatial-data/vicmap-catalogue/vicmap-vegetation. Accessed May 16, 2025.
07. Landscape, Biodiversity & Urban Cooling
Page 79 - 80
117. Purtill, James. “Why Hot Australian Cities Keep Laying Dark Heat-Absorbing Asphalt, Not Pale “Cool Roads.”” ABC News, 23 Jan. 2024, https://www.abc.net.au/news/science/2024-01-24/ why-australia-builds-dark-roads-despite-heatwaves-climate-change/103375122. Accessed August 23, 2024.
118. Rohat, Guillaume, Johannes Flacke, Alessandro Dosio, Simona Pedde, Hy Dao, and Martin Van Maarseveen. 2018. “Influence of Changes in Socioeconomic and Climatic Conditions on Future Heat-related Health Challenges in Europe.” Global and Planetary Change 172 (September): 45–59. https://doi.org/10.1016/j.gloplacha.2018.09.013. Accessed May 15, 2025.
119. Environment Victoria. 2024. “Victoria, Heatwaves & Climate Change - Environment Victoria.” Environment Victoria - Environment Victoria. October 28, 2024. https://environmentvictoria. org.au/our-campaigns/safe-climate/victoria-heatwaves-climate-change/. Accessed May 15, 2025.
120. Adapt NSW. “Green Cover and Open Spaces.” State Government of NSW, 2024. https://www. climatechange.environment.nsw.gov.au/impacts-climate-change/built-environment/greencover-and-open-spaces. Accessed November 20, 2024.
121. “Cooling Our City | City of Melbourne.” n.d. City of Melbourne. https://www.melbourne.vic.gov. au/cooling-our-city. Accessed May 15, 2025.
122. Department of Health. Victoria, Australia. 2024. “Research and Reports - Extreme Heat and Heatwaves.” April 19, 2024. https://www.health.vic.gov.au/environmental-health/research-andreports-extreme-heat-and-heatwaves. Accessed May 15, 2025.
Page 81 - 82
123. Steffen, Will, Lesley Hughes, Sarah Perkins, and Climate Council. 2014. “HEATWAVES: HOTTER, LONGER, MORE OFTEN.” Climate Council of Australia Limited. https://www. climatecouncil.org.au/uploads/9901f6614a2cac7b2b888f55b4dff9cc.pdf. Accessed May 15, 2025.
124. Blashki, Associate Professor Grant. 2024. “Heatwaves and Climate Change Are Australia’s Deadliest ‘Unnatural’ Disaster.” Pursuit by the University of Melbourne, December 18, 2024. https://pursuit.unimelb.edu.au/articles/heatwaves-and-climate-change-are-australiasdeadliest-unnatural-disaster. Accessed May 15, 2025.
125. Lam , Kristin. “Sacramento Has a New Plan to Grow the City’s Tree Canopy and Wants Your Feedback.” Capradio, 19 Apr. 2024. https://www.capradio.org/articles/2024/04/29/sacramentohas-a-new-plan-to-grow-the-citys-tree-canopy-and-wants-your-feedback/. Accessed September 4, 2024.
126. Zanon, Sibélia. “São Paulo Students Plant Mini-Forests on School Grounds as Urban Oases.” Mongabay Environmental News, 18 July 2023. https://news.mongabay.com/2023/07/sao-paulostudents-plant-mini-forests-on-school-grounds-as-urban-oases/. Accessed September 4, 2024.
127.Kim, Kijung, et al. “Impact of Urban Characteristics on Cooling Energy Consumption before and after Construction of an Urban Park: The Case of Gyeongui Line Forest in Seoul.” Energy and Buildings, vol. 191, May 2019, pp. 42–51. https://www.sciencedirect.com/science/article/abs/pii/ S0378778818332134?via%3Dihub. Accessed September 4, 2024.
128. Goodell, Jeff. “Paris When It Sizzles: The City of Light Aims to Get Smart on Heat.” Yale E360, 18 July 2023, https://e360.yale.edu/features/paris-heat-waves-climate-change. Accessed September 4, 2024.
129. Andrade, Matheus Gouvea de. “How Medellin Is Beating the Heat with Green Corridors.” BBC, 22 September 2023. https://www.bbc.com/future/article/20230922-how-medellin-is-beatingthe-heat-with-green-corridors. Accessed September 4, 2024.
130. Brandon, Elissaveta M. “Inside Rotterdam’s Quest to Green 10 Million Square Feet of Rooftops.” Fast Company, 27 May 2022. https://www.fastcompany.com/90755913/insiderotterdams-quest-to-green-10-million-square-feet-of-rooftops. Accessed September 4, 2024.
Page 83 - 84
131. “Urban Forest Strategy | City of Melbourne.” n.d. City of Melbourne. https://www.melbourne. vic.gov.au/urban-forest-strategy. Accessed May 15, 2025.
132. Kolovos, Benita. 2024. “Up To 200,000 New Trees Needed in Melbourne to Avoid Affecting Quality of Life, Research Finds.” The Guardian, July 24, 2024. https://www.theguardian.com/ australia-news/article/2024/jul/24/up-to-200000-new-trees-needed-in-melbourne-to-avoidaffecting-quality-of-life-research-finds. Accessed May 15, 2025.
08. Urban Farming
Page 89 - 90
133. Sheridan,J.,K.Larsen,R.Carey,Victorian Eco-Innovation Lab (VEIL),University of Melbourne, Deakin University, Sustain: The Australian Food Network, et al. 2015. “Melbourne’s Foodbowl: Now and at Seven Million.” Victorian Eco-Innovation Lab. https://science.unimelb.edu.au/__data/ assets/pdf_file/0008/2355155/Melbournes-Foodbowl-Now-and-at-seven-million.pdf. Accessed
May 14, 2025.
134. Carey, Rachel. 2016. “Melbourne Wastes 200 Kg of Food per Person a Year: It’s Time to Get Serious.” Find an Expert : The University of Melbourne, June 2, 2016. https://findanexpert. unimelb.edu.au/news/4916-melbourne-wastes-200-kg-of-food-per-person-a-year--it%27stime-to-get-serious. Accessed May 14, 2025.
Page 91 - 92
135. Brownstein, Bill. “Fifth Greenhouse Will Be Its Most Efficient so Far, Lufa Farms Says.” Montreal Gazette. Montreal Gazette, October 9, 2023. https://montrealgazette.com/business/ brownstein-lufa-farms-plants-greenhouse-atop-walmart-at-marche-central. Accessed November 20, 2024.
136. Atlas of the Future. “Brooklyn Grange Farm.” Atlas of the Future. https://atlasofthefuture.org/ project/brooklyn-grange-rooftop-farm/. Accessed September 4, 2024.
137.The Edible Bus Stop. “Home - the Edible Bus Stop.” The Edible Bus Stop. https:// theediblebusstop.com/. Accessed September 4, 2024.
138. McNamara, Tess. “SAGE – Urban Farm-Fed Cities: Lessons from Cuba’s Organopónicos.” https://sagemagazine.org/urban-farm-fed-cities-lessons-from-cubas-organoponicos/. Accessed September 4, 2024.
141. Meetings International. “The World’s Largest Indoor Vertical Farm Saves 250 Million Litres of Water Every Year” Meetings International. https://meetingsinternational.com/mi-magazine/ features/the-worlds-largest-indoor-vertical-farm-saves-250-million-litres-of-water-every-year/. Accessed September 4, 2024.
09. Organic Energy
Page 96 - 95
142. Lucas, Donna, Isabel Axiö, Tristan Wardley, Anne-Maree Boland, Clinton Muller, Carl Larsen, AgriFutures Australia, RMCG, and Rawtec. (2022) 2022. “Pre-farm Gate Waste Management: Baseline Waste Data for the Agriculture, Fisheries and Forestry Sector.” Report Publication no. 23-006. AgriFutures Australia. https://www.agrifutures.com.au. Accessed May 15, 2025.
143. SHERIDAN, J, R Carey, Candy, S, Australian Research Council, Victorian Eco-Innovation Lab, Deakin University, Australian National University, et al. 2016. “Foodprint Melbourne: What Does It Take to Feed a City?” Victorian Eco Innovation Lab, the University of Melbourne. http://hdl. handle.net/11343/112597. Accessed May 15, 2025.
144. European Comission: Energy, Climate change, Environment. “Methane Emissions - European Commission.” European Comission: Energy, Climate change, Environment. https://energy. ec.europa.eu/topics/carbon-management-and-fossil-fuels/methane-emissions_en. Accessed November 20, 2024.
Page 97 - 98
145. US Environmental Protection Agency. “How Does Anaerobic Digestion Work?” US EPA, March 18, 2019. https://www.epa.gov/agstar/how-does-anaerobic-digestion-work. Accessed November 20, 2024.
146. Pinkerton, Doug. “Is New York City Getting Curbside Organics Done? | BioCycle.” BioCycle, 11 Mar. 2024. https://www.biocycle.net/is-new-york-city-getting-curbside-organics-done/. Accessed September 10, 2024.
147.Gunther, Marc. “Disney World’s Biogas Facility: A Model for Converting Food Waste into Energy.” The Guardian, 17 Oct. 2014. https://www.theguardian.com/sustainable-business/2014/ oct/17/disney-world-biogas-food-waste-energy-clean-tech. Accessed September 10, 2024.
148. Ashden. “The Appropriate Rural Technology Institute (ARTI).” Ashden, 24 September 2022. https://ashden.org/awards/winners/the-appropriate-rural-technology-institute-arti/. Accessed 10 September 2024.
149. State of Green. “Copenhagen on the Way to 100 per Cent Green Gas by 2025.” State of Green, 19 August 2019, https://stateofgreen.com/en/news/copenhagen-on-the-way-to-100-per-centgreen-gas-by-2025/. Accessed September 10, 2024.
10. End Landfill
Page 107 - 108
150. “About Waste to Energy.” 2025. Vic.Gov.Au. February 17, 2025. https://www.vic.gov.au/aboutwaste-energy. Accessed May 15, 2025.
151. Active Sustainability: Sustainability For All. “Landfills: A Serious Problem for the Environment.” Active Sustainability: Sustainability For All, 2019. https://www.activesustainability. com/environment/landfills-serious-problem-environment/. Accessed, November 20, 2024.
152. Australian Bureau of Statistics. “Labour Force, Australia, May 2022.” Australian Bureau of Statistics, June 16, 2022. https://www.abs.gov.au/statistics/labour/employment-andunemployment/labour-force-australia/may-2022. Accessed November 20, 2024.
153. Westpac IQ. “A Burning Issue: Turning Waste into Energy.” Westpac IQ, 2020. https://www. westpaciq.com.au/thought-leadership/2020/12/a-burning-issue-turning-waste-into-energy/. Accessed, November 20, 2024.
Page 109 - 10
154. Zero Waste Australia. “Incineration | Zero Waste OZ.” Zero Waste Australia. https:// zerowasteaustralia.org/incineration/. Accessed September 11,2024.
155. Tickner, Martyn. “Thoughts from the Alliance: The Notion of “Cascade Recycling“ | AEPW.” Alliance to End Plastic Waste, June 3, 2021. https://www.endplasticwaste.org/insights/story/ notion-of-cascade-recycling. Accessed November 20, 2024.
156. Ellen MacArthur Foundation. “Plastics and the Circular Economy.” Ellen MacArthur Foundation, 2024, https://www.ellenmacarthurfoundation.org/plastics-and-the-circulareconomy-deep-dive. Accessed September 11,2024.
157.Strauss, Tslil. “Listen to the Material - Superuse Studios.” Superuse Studios, 17 Oct. 2022. https://www.superuse-studios.com/publication/listen-to-the-material-2/. Accessed September 11,2024.
158. Dark Matter. “CircuLaw — Using Existing Laws and Regulations to Accelerate the Transition to a Circular Economy.” Medium, Dark Matter Laboratories, 5 Apr. 2023. https://provocations. darkmatterlabs.org/circulaw-using-existing-laws-and-regulations-to-accelerate-the-transitionto-a-circular-economy-de4a9ef25bc2. Accessed September 11,2024.
160. Price waterhouse Coopers. “Building a More Circular Economy to Add Trillions to Australian GDP.” PwC, 2021. https://www.pwc.com.au/media/2021/circular-economy-to-grow-australianGDP.html. Accessed September 11,2024.
11. Net-Zero Building Code
Page 121 - 122
161. “Building Activity, Australia, December 2024.” n.d. Australian Bureau of Statistics.https:// www.abs.gov.au/statistics/industry/building-and-construction/building-activity-australia/latestrelease. Accessed May 15,2025.
Page 123 - 124
162. Bottero, Kiva. “Why Build Green? Payback Is a Lot Quicker than Most People Think.” The Mindful Word, 5 September 2012. https://www.themindfulword.org/build-green-payback/. Accessed September 11,2024.
163. Hayden, Marissa. “Australian Shares Performance in the Last 30 Years.” Canstar, 4 Feb. 2021. https://www.canstar.com.au/investor-hub/australian-share-performance-30-years/. Accessed September 11,2024.
Page 123 - 124 continued
164. City of Toronto. “TransformTO.” City of Toronto, City of Toronto, 17 November 2017. https:// www.toronto.ca/services-payments/water-environment/environmentally-friendly-cityinitiatives/transformto/. Accessed September 11,2024.
165. The City of Toronto. “The City of Toronto Zero Emissions Building Framework.” Mar. 2017. pp. 19-45. https://www.toronto.ca/wp-content/uploads/2017/11/9875-Zero-Emissions-BuildingsFramework-Report.pdf. Accessed September 11,2024.
166. Schimschar, Sven, et al. “Germany’s Path towards Nearly Zero-Energy Buildings— Enabling the Greenhouse Gas Mitigation Potential in the Building Stock.” Energy Policy, vol. 39, no. 6, June 2011, pp. 3346–3360. https://www.sciencedirect.com/science/article/abs/pii/ S0301421511002096. Accessed September 11,2024.
167. Global Buildings Performance Network. “Sweden | Global Buildings Performance Network.” Global Buildings Performance Network. https://library.gbpn.org/library/rp-detail-pages/sweden Accessed September 11,2024.
12. Embodied Emissions
Page 131 - 132
168. Vickers, Jeff, Jorge Chapa, Samuel Warmerdam, Sandra Qian, Steve Mitchell, Green Building Council of Australia, and thinkstep-anz. 2021. “Embodied Carbon and Embodied Energy in Australia’s Buildings.” Embodied Carbon & Embodied Energy in Australia’s Buildings. Green Building Council of Australia and thinkstep-anz. https://www.thinkstep-anz.com/assets/ Whitepapers-Reports/Embodied-Carbon-Embodied-Energy-in-Australias-Buildings-2021-07-22FINAL-PUBLIC.pdf. Accessed May 16, 2025.
Page 133 - 134
169. World Green Building Council. “Bringing Embodied Carbon Upfront Coordinated Action for the Building and Construction Sector to Tackle Embodied Carbon.” July 2019. pp. 7. https:// worldgbc.s3.eu-west-2.amazonaws.com/wp-content/uploads/2022/09/22123951/WorldGBC_ Bringing_Embodied_Carbon_Upfront.pdf. Accessed September 11, 2024.
170. Stora Enso. “French Laws Are Decarbonising the Building Sector – Could They Provide a Way Forward Internationally?” Stora Enso. 13 September 2023. https://www.storaenso.com/en/ newsroom/news/2023/9/re2020. Accessed September 11,2024.
171.Laue, Jenny. “How Denmark Leads the Way in Decarbonising the Construction Industry.” Buro Happold, 12 Dec. 2022. https://www.burohappold.com/news/how-denmark-leads-the-wayin-decarbonising-the-construction-industry/. Accessed September 11,2024.
172. Office of the Federal Chief Sustainability Officer Council on Environmental Quality. “Federal Buy Clean Initiative | Office of the Federal Chief Sustainability Officer.”Sustainability. https:// www.sustainability.gov/buyclean/. Accessed September 11,2024.
173. Dutch Green Building Council. “Whole Life Carbon Position Paper.” Dutch Green Building Council, September 2021. pp. 5-10. https://www.dgbc.nl/upload/files/Circulariteit/BuildingLife/ Position%20Paper%20Whole%20Life%20Carbon_EN.pdf. Accessed September 11, 2024.
174. Building for Climate Change. “Background for the Building for Climate Change Programme.” Building Performance, NZ Government, 2023, https://www.building.govt.nz/getting-started/ climate-change-work-programme/background. Accessed September 11,2024.
176. Materials Embodied Carbon Leaders Alliance (MECLA). 2021. “Local Council Partners With Leading Software Provider to Drive Low Carbon Designs of Single and Grouped Dwellings.” MECLA Publication. https://mecla.org.au/wp-content/uploads/2024/07/MECLA-Case-Study-Cityof-Vincent-Final.pdf. Accessed May 15, 2025.
177.“Sustainable Design: Green Building Principles & Free Consultations.” n.d. https:// www.vincent.wa.gov.au/plan-build/plan/design/sustainable-design.aspx. Accessed May 15, 2025.
178. Department of Planning and Environment. “Embodied Emissions Reporting.” Planning NSW. Department of Planning and Environment, State Government of NSW. https://www.planning. nsw.gov.au/sites/default/files/2023-09/embodied-emissions-technical-note.pdf. Accessed November 20, 2024.
179. Duong, Tuan. 2024. “NSW Government Introduces Mandatory Embodied Emissions Reporting | Duo Tax Quantity Surveyors.” Duo Tax Quantity Surveyors, June 27, 2024. https://duotax.com.au/ insights/nsw-government-introduces-mandatory-embodied-emissions-reporting/. Accessed May 15, 2025.
180. Australia, Victorian Resources Online Agriculture Victoria. 2021. “Land Use.” VRO | Agriculture Victoria. February 22, 2021. https://vro.agriculture.vic.gov.au/dpi/vro/vrosite.nsf/ pages/landuse-home. Accessed May 15, 2025.
181. Australia, Victorian Resources Online Agriculture Victoria. 2020. “Land Capability in Victoria.” VRO | Agriculture Victoria. March 23, 2020. https://vro.agriculture.vic.gov.au/dpi/vro/vrosite.nsf/ pages/land_capability. Accessed May 15, 2025.
182. Australia, Victorian Resources Online . 2021b. “Victorian Land Use Information System (VLUIS).” VRO | Agriculture Victoria. July 14, 2021. https://vro.agriculture.vic.gov.au/dpi/vro/ vrosite.nsf/pages/vluis#data. Accessed May 15, 2025.
183. “Australia’s State of the Forests Report Synthesis 2023.” 2024. ABARES. https://www. agriculture.gov.au/sites/default/files/documents/Australias_State_of_the_Forests_Report_ Synthesis_2023.pdf. Accessed May 15, 2025.
184. Australian Government and Department of Climate Change, Energy, the Environment and Water. 2024. “National Inventory Report 2022.” Report. Volume 1.
185. Department of Energy, Environment and Climate Action. 2025. “Farm Forestry Toolkit.” Agriculture Victoria. May 15, 2025. https://agriculture.vic.gov.au/crops-and-horticulture/farmforestry/farm-forestry-toolkit. Accessed May 15, 2025.
186. FPlnnovations, Binational Softwood Lumber Council, Sylvain Gagnon, E.M. (Ted) Bilek, Lisa Podesto, and Pablo Crespell. 2013. The U.S. Edition of the CLT Handbook: Cross-laminated Timber. Handbook. Edited by Erol Karacabeyli and Brad Douglas. U.S. ed. FPlnnovations. Accessed May 15, 2025.
188. “Super Statistics.” 2025. ASFA. May 2, 2025. https://www.superannuation.asn.au/superstatistics/. Accessed May 15, 2025.
189. Australian Bureau of Statistics. 2024. “National, State and Territory Population, June 2024.”
Australian Bureau of Statistics. December 12, 2024. https://www.abs.gov.au/statistics/people/ population/national-state-and-territory-population/jun-2024. Accessed May 15, 2025.
190. HMD Insurance. “How Much Does Private Health Insurance Cost per Month in Australia in 2024?” HMD Insurance, June 14, 2024. https://hmdi.com.au/how-much-does-private-healthinsurance-cost-per-month. Accessed November 20, 2024
Page 141 - 142
191. Ministry of Foreign Affairs of Denmark. “Denmark Is the First Country in the World to Introduce Carbon Tax on Livestock Farming.” Invest in Denmark, 2024, https://investindk.com/ insights/denmark-is-the-first-country-in-the-world-to-introduce-carbon-tax-on-livestockfarming. Accessed September 12,2024.
Policy
Page 149 - 150
192. Schmidt, Monique, Robert H. Crawford, and Georgia Warren-Myers. 2020. “Quantifying Australia’s Life Cycle Greenhouse Gas Emissions for New Homes.” Energy and Buildings 224 (October): 110287. https://doi.org/10.1016/j.enbuild.2020.110287. Accessed May 15, 2025.
Page 151 - 152
193. Victoria, Public Transport. 2025. “Zero Emission Buses - Public Transport Victoria.” Public Transport Victoria. 2025. https://www.ptv.vic.gov.au/footer/about-ptv/improvements-andprojects/bus-and-coach/zero-emission-buses/. Accessed May 20, 2025.
194. “Victorian Cycling Strategy 2018-28 Increasing Cycling for Transport.” n.d. https://www.vic. gov.au/sites/default/files/2023-09/Victorian-Cycling-Strategy-2018-28.pdf. Accessed May 20, 2025.
195. Planning. 2023. “Victoria’s Gas Substitution Roadmap.” Planning. September 14, 2023. https://www.planning.vic.gov.au/guides-and-resources/strategies-and-initiatives/victorias-gassubstitution-roadmap. Accessed May 20, 2025.
196. Energy. 2022. “7 Star Energy Efficiency Building Standards Common Questions.” Energy. September 6, 2022. https://www.energy.vic.gov.au/households/7-star-energy-efficiencybuilding-standards/common-questions. Accessed May 20, 2025
197. Energy. 2024. “Wind Energy.” Energy. May 6, 2024. https://www.energy.vic.gov.au/ renewable-energy/wind-energy. Accessed May 20, 2025.
198. Energy. 2024. “Strong Progress towards Our Renewable Energy Targets.” Energy. December 10, 2024. https://www.energy.vic.gov.au/about-energy/news/news-stories/progress-towardsrenewable-energy-targets. Accessed May 20, 2025.
199. Energy. 2024. “Our Plan for Victoria’s Electricity Future.” Energy. August 21, 2024. https:// www.energy.vic.gov.au/about-energy/news/news-stories/our-plan-for-victorias-electricityfuture?. Accessed May 20, 2025.
200. Victorian Auditor-General’s Office. Supplying and Using Recycled Water. Melbourne: VAGO, November 2022. https://www.audit.vic.gov.au/sites/default/files/2022-11/20211117_Supplyingand-Using-Recycled-Water.pdf. Accessed May 20, 2025.
201. Melbourne Water. 2024. “Permanent Water-Saving Rules and Target 150.” Melbourne Water. Last updated December 18, 2024. https://www.melbournewater.com.au/water-and-environment/ saving-water/permanent-water-saving-rules-and-target-150. Accessed May 20, 2025.
202. Department of Energy, Environment and Climate Action. Groundwater Management 2030. State Government of Victoria, 2024. https://www.water.vic.gov.au/water-sources/groundwater/ groundwater-management-2030. Accessed May 20, 2025.
203. Department of Energy, Eukrtnvironment and Climate Action. Biodiversity 2037 Progress Report. State Government of Victoria, 2024. https://www.environment.vic.gov.au/biodiversity/ biodiversity-progress-report. Accessed May 20, 2025.
204. Department of Transport and Planning. Cooling and Greening Melbourne. State Government of Victoria. https://www.planning.vic.gov.au/guides-and-resources/strategies-and-initiatives/ plan-melbourne/cooling-and-greening-melbourne. Accessed May 20, 2025.
205. Department of Transport and Planning. Cooling and Greening Melbourne. State Government of Victoria. https://www.planning.vic.gov.au/guides-and-resources/strategies-and-initiatives/ plan-melbourne/cooling-and-greening-melbourne. Accessed May 20, 2025.
206. Agriculture Victoria. What Is the Agriculture Strategy? State Government of Victoria. https:// agriculture.vic.gov.au/about/agriculture-strategy/what-is-the-agriculture-strategy. Accessed May 20, 2025.
207. Department of Transport and Planning. Planning for Melbourne’s Green Wedges and Agricultural Land: Action Plan. State Government of Victoria, March 2024. https://www.planning. vic.gov.au/__data/assets/pdf_file/0029/699212/Planning-for-Melbournes-Green-Wedges-andAgricultural-Land-Action-Plan_20240308.pdf. Accessed May 20, 2025.
208. Australian Renewable Energy Agency (ARENA). Bioenergy Roadmap: Delivering Sustainable Bioenergy for Australia’s Future. Canberra: ARENA, November 2021. https://arena.gov.au/ assets/2021/11/australia-bioenergy-roadmap-report.pdf. Accessed May 20, 2025.
209. Victorian Auditor-General’s Office. Recycling Resources from Waste. Melbourne: VAGO, 2023. https://www.audit.vic.gov.au/report/recycling-resources-waste. Accessed May 20, 2025.
210. “Fact Sheet for Building Practitioners.” n.d. https://www.energy.vic.gov.au/__data/assets/ pdf_file/0016/670300/7-star-new-homes-standards-factsheets-building-practitioners. Accessed May 20, 2025.
211. Schmidt, Monique, Robert H. Crawford, and Georgia Warren-Myers. 2020. “Quantifying Australia’s Life Cycle Greenhouse Gas Emissions for New Homes.” Energy and Buildings 224 (October): 110287. https://doi.org/10.1016/j.enbuild.2020.110287. Accessed May 20, 2025
212. Infrastructure Australia. 2021. “Embodied Carbon Projections for Australian Infrastructure and Buildings | Infrastructure Australia.” Infrastructureaustralia.gov.au. 2021. https://www. infrastructureaustralia.gov.au/reports/embodied-carbon-projections-australian-infrastructureand-buildings. Accessed May 20, 2025
213. Australian Office of Financial Management. 2024. “Australian Government Climate Change Commitments, Policies and Programs.” Australian Office of Financial Management. https://www. aofm.gov.au/sites/default/files/2024-02-02/Climate%20change%20slides%20updated%20 February%202024.pdf. Accessed May 20, 2025
It’s not over, this is just the beginning.
This document is not intended to be final.We have compiled the best argument we could for this transition.But this document will be and must be challenged. By technical experts. By financial experts. By political experts. By legal experts. By cultural experts. But most importantly, it can never be perfect without the feedback of the people of Melbourne.We would like as much feedback as possible to be able to improve the approach moving forwards and to be able to demonstrate to State Government the public response.Positive or negative, we would like to receive your feedback. But please do try to be constructive.We’re all in this together. Let us know your thoughts.