10 minute read
Housing affordability
Widening Divides: Trends Exacerbated by the Pandemiccontinued
Housing affordability For many living in Santa Barbara and Ventura Counties, housing affordability was a persistent challenge even before the pandemic. Data on rent-burdened households (those spending 30 percent or more of their income on rent) show that the region ranks as one of the most unaffordable places in the nation. Santa Barbara and Ventura Counties ranked 5th and 11th, respectively, among the largest 150 metro areas for their share of rent-burdened households (Figure 41). According to a 2019 report on housing by the Central Coast Alliance United for a Sustainable Economy (CAUSE) low-income renters are competing in a tight rental housing market while real estate investors are driving up home prices in working-class neighborhoods, resulting in gentrification. In addition, some landlords have found it more profitable to make their housing available to agricultural companies for seasonal housing since federal requirements under the H-2A guestworker program allow for as little as 100 square feet per worker. According to the report, Latinx families have also been moving away from Santa Barbara to more affordable locations such as Ventura, Oxnard, Lompoc, and Santa Maria.64 Other reports on housing in Santa Barbara also point to a shortage of affordable housing for low-income and college student residents in the region.65 The pandemic only exacerbated already existing challenges with finding affordable housing. Even after the pandemic ends, it seems unlikely that home prices will return to their already-high pre-pandemic levels. Data on rent-burdened households (those spending 30 percent or more of their income on rent) show that the region ranks as one of the most unaffordable places in the nation.
Advertisement
Top 150 metro areas ranked by rent burden, 2018Widening Divides: Trends Exacerbated by the Pandemiccontinued
#1: Miami-Fort Lauderdale-Miami Beach, FL Metropolitan Statistical Area (62%) #5: Ventura County, CA (58%) #11: Santa Barbara County, CA (56%)
#150: FayettevilleSpringdale-Rogers, ARMO Metropolitan Statistical Area (39%)
Source: USC Equity Research Institute analysis of 2018 5-year American Community Survey microdata from IPUMS USA. Note: Metro regions refer to the largest 150 metropolitan statistical areas in terms of 2010 population, based on the OMB’s December 2003 definitions. Rent burden is defined as paying more than 30 percent of gross income on rent. Universe includes renter-occupied households paying cash rent. Data represent a 2014 through 2018 average.
A major contributor to the high housing prices in the two-county region is the severe shortage in the supply of affordable housing. Since 1969, California counties and cities have been required by state law to plan for adequate levels of low and middle-income as well as market-rate housing development, as part of the Housing Element and the Regional Housing Needs Allocation (RHNA) process. For the most recent 2015-2023 housing allotment cycle, the City of Santa Barbara is obligated to construct 4,100 units. As of 2020 less than half had been constructed, the vast majority in the “above moderate” or market-rate category, with no clear pathway to meeting affordable unit goals in sight.66 Cities in Ventura County also lag. As of June 2020, no Ventura County cities had completed
Widening Divides: Trends Exacerbated by the Pandemiccontinued
even half of RHNA-required construction.67
These shortfalls are rooted in decades of diminished federal and state support for affordable housing construction, among other factors. Meantime, the reliance by local government on private developers (rather than direct public investment) has proven to be a major stumbling block for new affordable housing construction. While market-rate units generate substantial profit for private developers, lowerincome units do not. The resulting imbalance has been borne out in local construction. While Ventura County cities are far from their overall housing goals, they have actually exceeded the requirements for high-income housing set by the RHNA.68
With housing supply falling well short of estimated population needs, regional home prices have soared to record-high levels since recovering from the financial crisis of 2008. The pandemic has dramatically exacerbated those trends. From 2020-2021, the median home price in Ventura County climbed 12.5 percent to $685,000.69 In the City of Santa Barbara, the median home price increased 30 percent to $1.5 million in the same period.70 These prices push the prospect of homeownership beyond the means of all but the affluent. Many have been squeezed out of local rental markets as well. Average rents hovered around $2300 in the cities of Santa Barbara and Oxnard in August 2021.71 According to one estimate, the Latinx population in the City of Santa Barbara shrunk by 24 percent between 2011-2018 due to skyrocketing rents.72
Despite soaring prices for both homeownership and rental housing, the issue of housing supply has been a major source of political contention, particularly at the local level. Even in politically liberal areas, research has shown that homeowners are significantly motivated by economic self-interest to oppose new construction that they fear would lower the value of their property.73 These homeowners have clashed with community activists who have called for more housing construction to lower housing costs.74 So far however, opponents of new housing (low-income or otherwise) have largely won out in these political battles. In the City of Santa Barbara, homeowners have vigorously opposed the construction of new housing in their neighborhoods and have succeeded in blocking some projects and indefinitely delaying others.75
Though many families in the region are affected by the high cost of housing, Black, Indigenous, and other People of Color are disproportionately impacted by the lack of affordable housing and more likely to be renters. Data from 2018 show that in Santa Barbara County 62 percent of Black, Indigenous, and other People of Color households lived in rental housing. Latinx immigrant and Black households are the most With housing supply falling well short of estimated population needs, regional home prices have soared to record-high levels.
Widening Divides: Trends Exacerbated by the Pandemiccontinued
likely to be renters. In Santa Barbara County, 70 percent of Latinx immigrant households and 69 percent of Black households lived in rental housing. In Ventura County, 55 percent of Latinx immigrant households and 50 percent of Black households lived in rental housing.76 Among those living in rental housing, 56 percent of Santa Barbara and 58 percent of Ventura County renter households were rent burdened, meaning they spend more than 30 percent of their income on housing (Figure 42). Rent burden is high across all races in the region, and highest among Latinx-headed households (Figure 42). The disparate impact of high rent burden is further amplified by the racial disparities in overcrowded housing conditions highlighted earlier in this report (Figure 24), showing overcrowding in 48 percent of Latinx immigrant and 35 percent of U.S.-born Latinx households in Santa Barbara County, and 36 percent and 25 percent among comparable households in Ventura County. The experience of rent burden is exceptionally high among Percent Rent Burdened by Race/Ethnicity, 2018 undocumented residents. About 70 percent of Ventura County’s undocumented renter households and 63 percent of Santa Barbara undocumented renter households were rent burdened (Figure 43). FIGURE 42: RENT BURDEN BY RACE, SANTA BARBARA AND VENTURA COUNTIES, 2018
Santa Barbara County, CA Ventura County, CA
55% 56% 56%
43% 56% 58% 57% 61%
White Asian All Latinx
Source: Integrated Public Use Microdata Series. Universe includes renteroccupied households with cash rent (excludes group quarters). Note: Data represent a 2014 through 2018 average. Source: USC Equity Research Institute analysis of 2018 5-year American Community Survey microdata from IPUMS USA. Universe includes renter-occupied households paying cash rent (excludes group quarters).
Rent burden is defined as paying more than 30 percent of gross income on rent.
Note: Data represent a 2014 through 2018 average. 73 TOWARDS A JUST AND EQUITABLE CENTRAL COAST
Widening Divides: Trends Exacerbated by the Pandemiccontinued
Housing cost burden for renters by immigration status, 2018
Santa Barbara County Ventura County
70%
63%
59% 64% 63%
57% 56% 58%
55% 55% 54% 57%
Undocumented Immigrant Lawful permanent resident All U.S. -born Naturalized U.S. citizen
Source: USC Equity Research Institute analysis of 2018 5-year American Community Survey microdata from IPUMS USA and the 2014 Survey of Income and Program Participation. Universe includes renter-occupied households with cash rent (excludes group quarters). Rent burden is defined as paying more than 30 percent of gross income on rent. Note: Data represent a 2014 through 2018 average. See https://dornsife.usc.edu/assets/ sites/731/docs/Methodology_Final_updated_ETN_2017.pdf for details on estimates of the undocumented and LPR population.
Widening Divides: Trends Exacerbated by the Pandemiccontinued
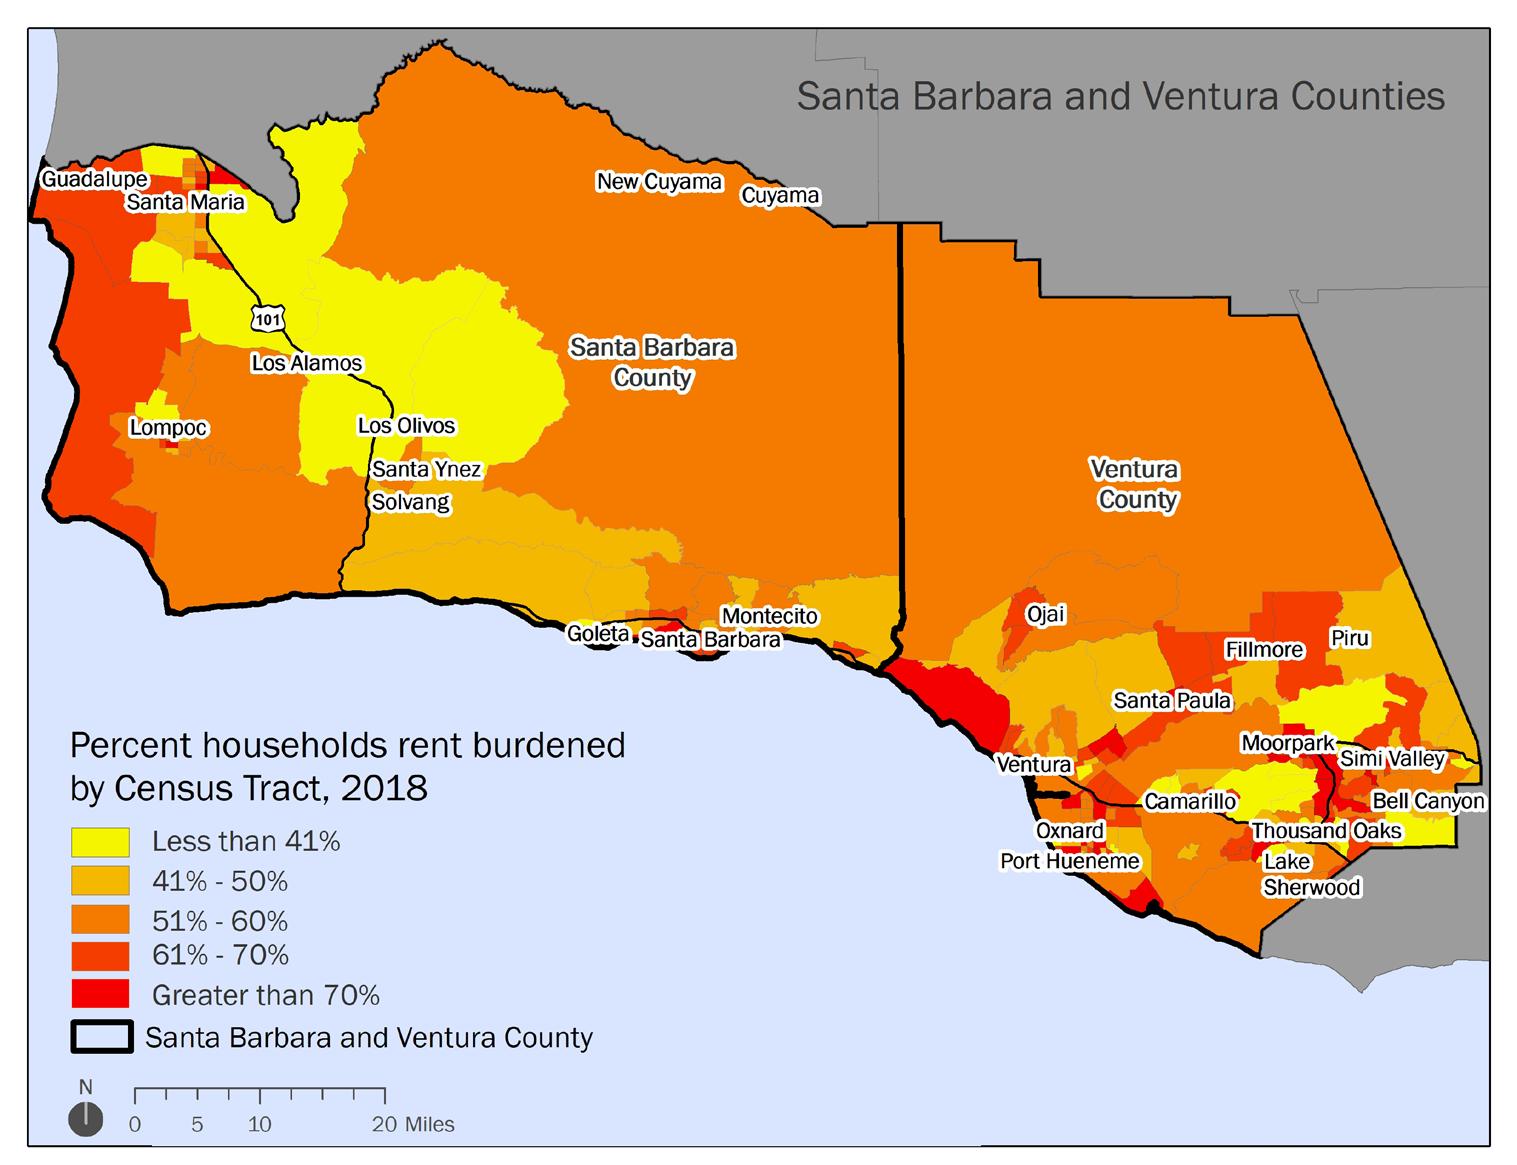
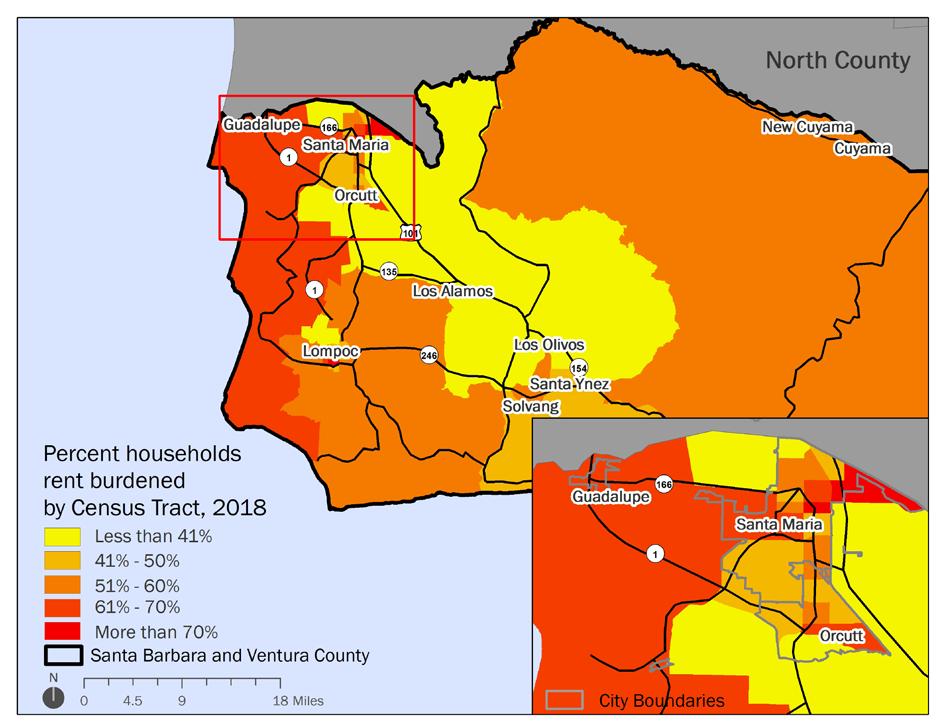
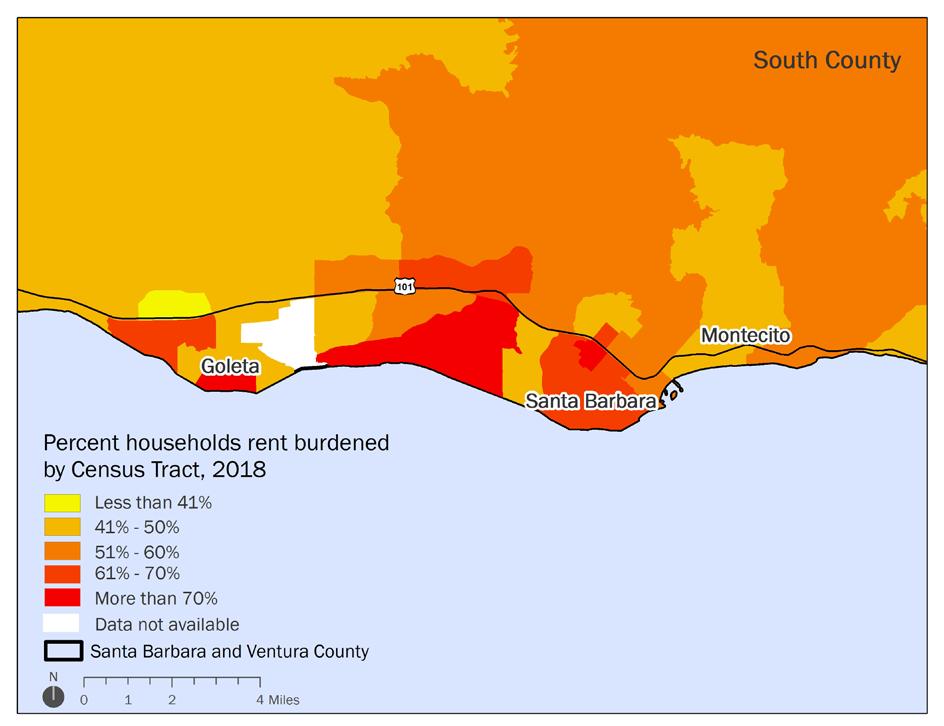
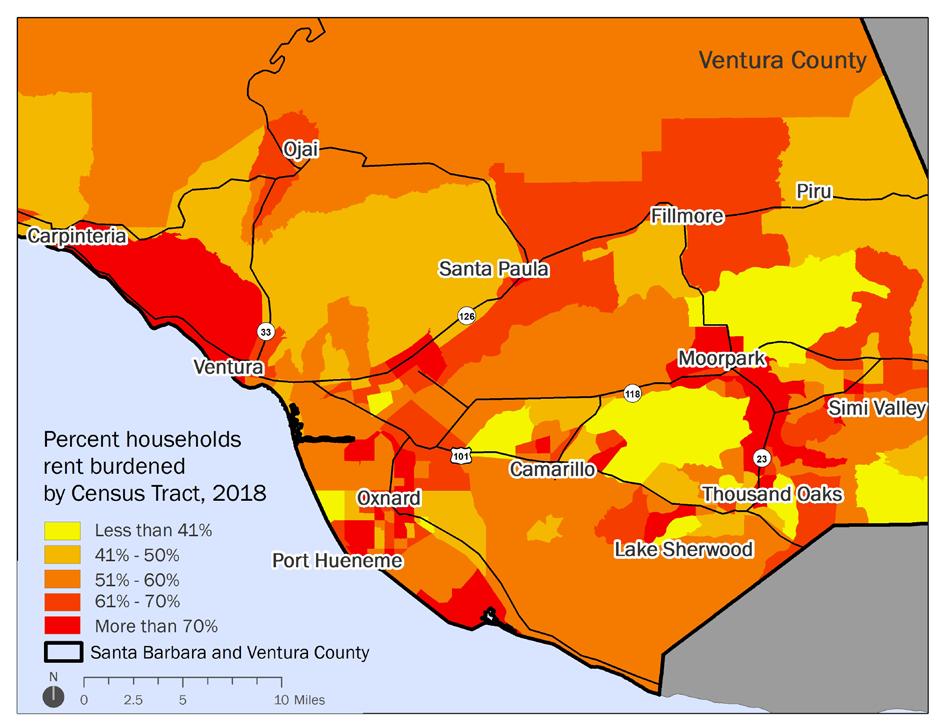
Regionally, many rent burdened neighborhoods also are areas with large proportions of Black, Indigenous, and other People of Color. Housing burden mapped by census tract shows neighborhoods in Guadalupe, Santa Maria, Goleta, Santa Barbara city, Oxnard, Ventura, Santa Paula, and Simi Valley are some of the most rent burdened areas in the region (Figure 44). Latinx individuals comprise a larger share of residents in many north county communities with estimates at 90 percent in Guadalupe and 75 percent in Santa Maria, according to 2018 American Community Survey estimates. In Ventura County, the Latinx population in Santa Paula and Oxnard are 81 and 74 percent, respectively. Oxnard is home to the largest Filipino community in the area at 5.6 percent.77 Unaffordability is especially pronounced in the South Coast communities of Goleta and Carpinteria in Santa Barbara, which is concerning because compared to the rest of the county, this area is “job-rich”.78
Widening Divides: Trends Exacerbated by the Pandemiccontinued
FIGURE 44: PERCENT RENT BURDENED HOUSEHOLDS BY CENSUS TRACT, SANTA BARBARA AND VENTURA COUNTIES, 2018
Source: TIGER/Line Shapefiles and 2018 5-year American Community Survey summary file data from the U.S. Census Bureau. Note: Universe includes renter-occupied households with cash rent (excludes group quarters). Rent burden is defined as paying more than 30 percent of gross income on rent. Data reflect a 2014 through 2018 average.


Widening Divides: Trends Exacerbated by the Pandemiccontinued
According to CAUSE’s housing report, this housing crisis has left lower-income families, renters, and immigrant families especially vulnerable as stagnant wages and increasing rents force families to engage in “survival strategies” to make ends meet.79 Strategies such as leaving their neighborhoods, picking up an additional job, moving into non-traditional housing, and cutting back on healthcare or food are what individuals and families turn to in order to secure housing. Estimates on the potential gain in “disposable income” for rent burdened households in 2017 show that if renters were not spending more than 30 percent of their income on housing costs, there would be substantial economic benefit. Estimates show that Santa Barbara County would have seen $352 million and Ventura County would have seen $490 million in income that could not only be used for other essential expenses but also returned back to the local economy.80
In addition to housing affordability, renters in the region are also susceptible to eviction, rent increases, and dealing with problematic housing conditions. Despite the allocation of rental relief funds at both the national and state level, a September 2021 report from the National Equity Atlas finds that 20 percent of renters in California are behind on rent, and that about half of those households are families with children.81 With the end of California’s COVID-19 eviction moratorium as of September 30, 2021, these households and the communities they live in face a crisis. Among those interviewed for the CAUSE 2019 study of renters in Santa Barbara and Ventura, 35 percent of respondents stated that they were in a monthto-month lease and 19 percent did not have a formal written lease agreement.82 In addition, of those surveyed, 75 percent reported experiencing one or more habitability issues such as a leaky roof, pipes, roof, mold, pests, or no heat or hot water, etc. However, the study found that less than half of those with such issues reported them and had them repaired. The dearth of affordable, safe, and accessible housing is most dramatically manifest in the growing population of unhoused people in Santa Barbara and Ventura Counties. As housing has become less-andless affordable in the region, the number of unhoused individuals has risen. According to the most recent Homeless Counts, between 2016 and 2020 the number of unhoused individuals in Ventura County rose from 1,271 to 1,743, and from 1,729 to 1,897 in Santa Barbara County over a comparable period.83 Notably, the number of unhoused individuals is consistently higher in Santa Barbara than in Ventura County, despite the latter having nearly twice the total population. The vast majority of unhoused individuals in both counties are also unsheltered, with most sleeping outdoors or in a vehicle. Surveys also show that unhoused people are mostly local residents who have been living in their home county for a decade or more. The dearth of affordable, safe, and accessible housing is most dramatically manifest in the growing population of unhoused people in Santa Barbara and Ventura Counties.

