5 minute read
Geography of Diversity

California’s Central Coast: Who We Are and Who We Are Becomingcontinued
Geography of Diversity Santa Barbara and Ventura Counties comprise over 4,500 square miles and are home to nearly 1.3 million residents.6 The region, which includes mountain ranges to the north and east and the Pacific Ocean to the west, is known for its tourism and agriculture industries. A statewide report on travel spending shows that travel to both Santa Barbara and Ventura Counties had been steadily increasing between 2010 and 2019, with visitors in 2019 spending $2.1 and $1.8 billion, respectively.7 In 2019, Ventura and Santa Barbara Counties both grossed over $1.5 billion in agricultural production, ranking them 11th and 13th statewide.8 Although the region features a number of organic farms, agricultural production is weighted toward large-scale industrialized production which, along with the hospitality and service industries, accounts for the bulk of the region’s low-wage employment. Much of the produce from industrialized agriculture is slated for worldwide export, situating the two counties among the largest export markets for agriculture in the nation. The Port of Hueneme is another marker of the way the region has positioned itself in the global marketplace. The only deep-water port between San Francisco and Los Angeles, it specializes in automobiles, commercial vehicles, agricultural products and a range of consumer goods. It also generates a considerable amount of pollutants from truck and rail traffic in Oxnard and surrounding areas, leading environmental justice advocates to call on Port officials to transition to zero-emission vehicles in the coming decade. The military also has a presence in the region; Oxnard has two naval bases, and Lompoc is home to Vandenberg Air Force Base. Naval Base Ventura County at Port Mugu is the largest employer in the county. Despite the visibility of an environmental movement that dates back to the massively destructive Santa Barbara oil spill of 1969, the region continues to account for a substantial proportion of California’s oil production, with drilling and production sites located in close proximity to working-class communities of color.
Advertisement
Another notable feature of the regional economy is the presence of a number of post-secondary education institutions, including the University of California, Santa Barbara, a tier-one research university that is also officially recognized as a Hispanic-serving institution and is the largest employer in the county, as well as California State University Channel Islands, and a number of highly regarded community colleges and private colleges and universities. In recent decades, the region has become home to a now fast-growing high-tech sector, expanding from the longer-established presence of the aerospace industry. The region has also been known for its extensive nonprofit and small business sectors, although both experienced major setbacks during the pandemic, as was the case in the financial crisis and Great Recession of 2008. Santa Barbara and Ventura Counties comprise over 4,500 square miles and are home to nearly 1.3 million residents.
California’s Central Coast: Who We Are and Who We Are Becomingcontinued
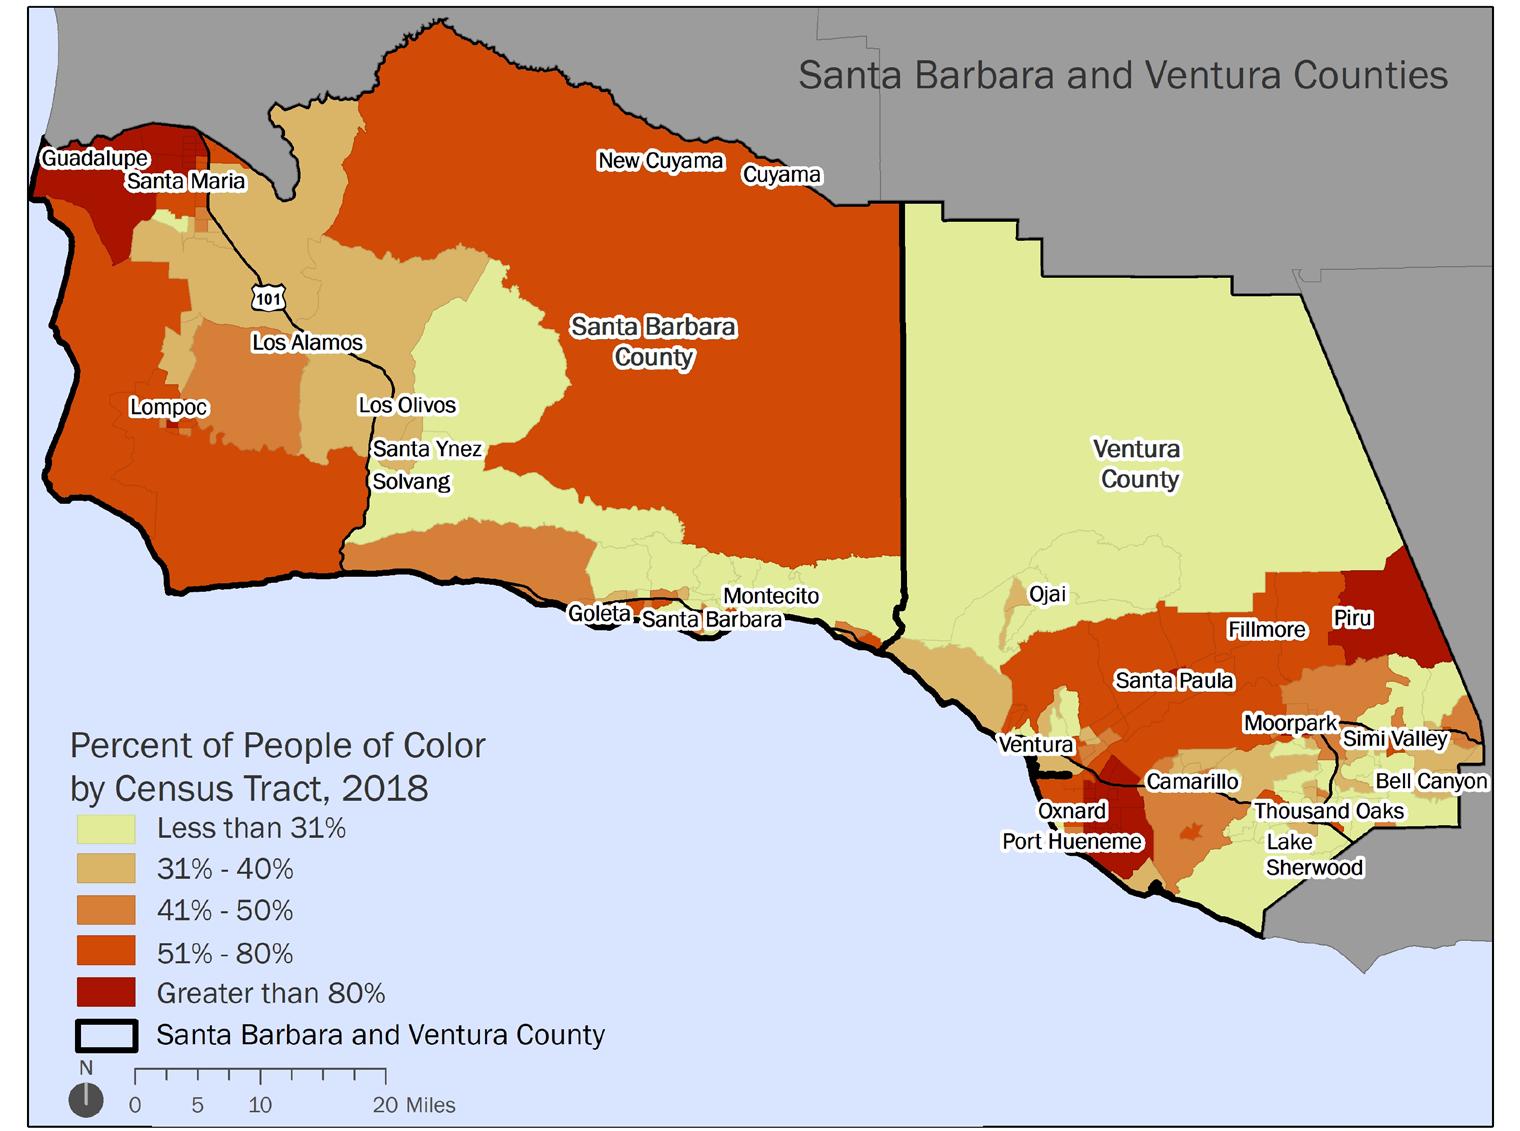
As we will see throughout this study, the diversity of the region’s economy has been accompanied, and to a considerable degree enabled, by its changing racial and ethnic demography. It has also produced a labor market that is increasingly bifurcated along the lines of class, race, and immigration status. These developments are reflected in the region’s diverse but highly stratified residential patterns, which feature a mix of rural, suburban and urban communities ranging from principally Latinx, indigenous migrant, and immigrant farmworker settlements to majority-white affluent enclaves and some of the most highly segregated metropolitan areas in the country (Figure 2). These patterns of racial and class segregation map onto the social geography of the region’s unincorporated areas as well, which span the mostly Latinx, lowincome communities along the Santa Clara River Valley and Cuyama Valley and some of the most affluent, majority-white communities in the state, such as Montecito in Santa Barbara and Bell Canyon and Lake Sherwood in Ventura County. For all the benefits it has brought to the regional economy, including, as we shall see, its officially “essential” workforce, the demographic diversity of the Central Coast has not resulted in an equitable distribution of the region’s prosperity. To the contrary, rising inequality has been part of the region for decades, creating prosperity for some while increasing hardship for many, especially those, disproportionately people of color, at the bottom end of the earnings scale. Since 1979, wage growth among the highest earners has been increasing while wages for those earning the least have decreased. Housing in the region has become ever-more unaffordable. The housing market for renters is one of the most unaffordable in the nation. Among the nation’s largest metropolitan areas, Santa Barbara and Ventura Counties ranked 5th and 11th highest in the percentage of rent burdened households in 2018, respectively, meaning these households pay more than 30 percent of their income on housing. Additional data on inequality from the National Equity Atlas in 2019 show that Santa Barbara County was ranked 13th out of the largest 150 metro areas in income inequality while being ranked one of the lowest in homeownership rates (147th out of 150 largest metro areas). Ventura County is ranked in the top third of the largest metro areas for exposure to pollution (45th out of 150) while also having one of the longest average commute times nationwide (38th out of 150).9 Among the nation’s largest metropolitan areas, Ventura and Santa Barbara Counties ranked 5th and 11th highest in the percentage of rentburdened households in 2018, meaning these households pay more than 30 percent of their income on housing.
California’s Central Coast: Who We Are and Who We Are Becomingcontinued
FIGURE 2.PERCENT PEOPLE OF COLOR, SANTA BARBARA AND VENTURA COUNTIES, 2018
Source: TIGER/Line Shapefiles and 2018 5-year American Community Survey summary file data from the U.S. Census Bureau. Note: Data represent a 2014 through 2018 average.


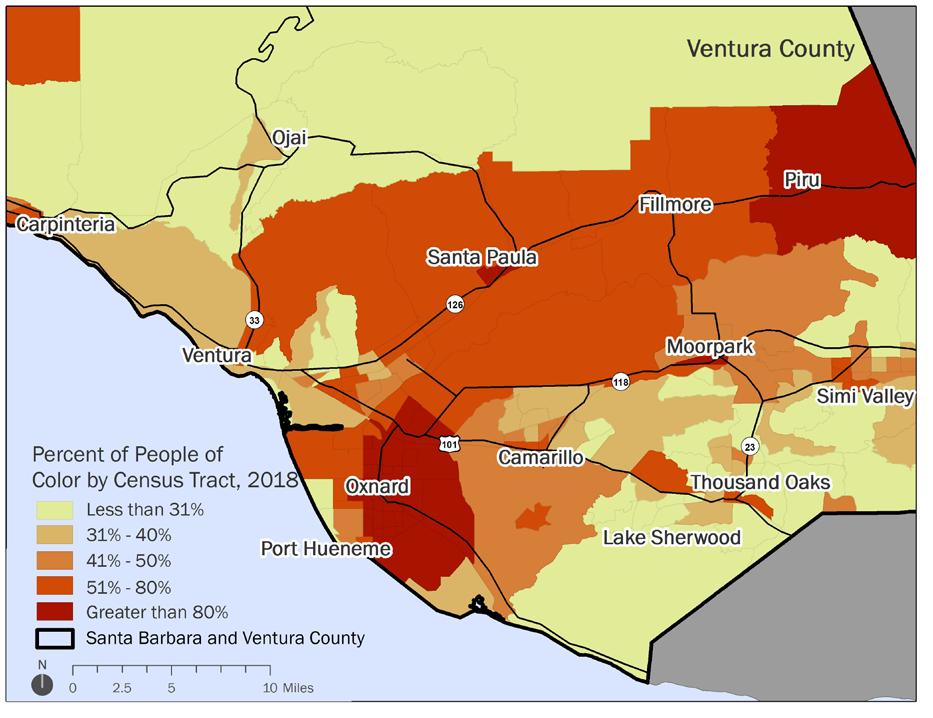
Source: TIGER/Line Shapefiles and 2018 5-year American Community Survey summary file data from the U.S. Census Bureau. Note: Data represent a 2014 through 2018 average.
