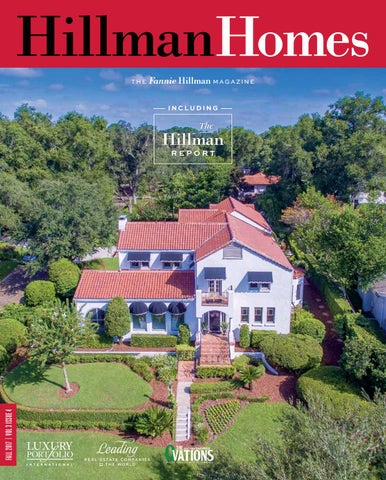
FALL 2017 | VOL 3 ISSUE 4
THE
Fannie Hillman M A G A Z I N E
YO U R
R E A L ESTAT E E X P E RTS
Welcome A warm welcome to
our Hillman Homes readers! It appears that fall has started to arrive in Florida, as we are beginning to feel some cool evening breezes. Despite the cooler temperatures, we are still burning bright here at Fannie Hillman + Associates. Our third quarter proved to be quite active and full of activity. We were up in many areas, contracts, closings and volume, compared to our third quarter last year. Our contracts saw a 6% increase while our closings were up 11%. Additionally, our 2017 third quarter volume showed a 12% increase over the third quarter of 2016. As you delve into the pages of this issue, you will be able to view our exclusive listings, a current market report, upcoming community events and much more. The real estate market continues to be strong in Central Florida. There was no slowing in the third quarter and we are eager to have an equally or even more active fourth quarter. Community involvement is very important to us here at Fannie Hillman + Associates. We are always aiming to better serve our clients, neighbors and community. In our second quarter, we partnered with Harbor House to help raise funds to end domestic violence. Harbor House is Orange County’s only state certified domestic violence organization. In addition to their emergency shelter, they also provide a 24 hour crisis hotline, counseling, legal advocacy, certified child care and a pet kennel. We are pleased to announce that thanks to the donations of our individual agents along with company matching, we were able to present Harbor House with a check for $10,000.00. We continue to strengthen our online presence, and are dedicated to providing our listings with the best exposure possible. We realize the importance of online promotion, including social media. Our online presence proves to be more far reaching than that of traditional print marketing. It allows us to touch prospective buyers outside of the Central Florida area, and gives them a more accurate knowledge of our
current inventory. A better informed buyer benefits all parties involved and many times results in a faster decision. Please look us up, like and follow us on Facebook and Instagram. Read our monthly blog at fanniehillman.com/community/fannie-hillman-blog. We invite you to get to know us better and be a part of our online family. As we change, evolve and adapt to a more technological world, we grow and strengthen as a company. All of us at Fannie Hillman + Associates believe in staying current and value all that change has to offer. We look forward to a strong finish to 2017. Enjoy this issue of Hillman Homes, I know you will find it informative. We invite you to explore our website, follow us on social media, stop by our office to say “hello,” or call us today to speak to any of our knowledgeable and capable agents. We are honored to serve you and our community. Here’s to a fantastic fall!
M. Scott Hillman PRESIDENT
FALL 2 0 17
1
Publisher FANNIE HILLMAN + ASSOCIATES Editor ASHLEY FRAEBEL Art Director JASON FARMAND Photo Editor ALAN FRAEBEL Copy Editor NICOLE DUFF CONTACT US Fannie Hillman + Associates 205 West Fairbanks Avenue Winter Park, FL 32789 407.644.1234 agent@fanniehillman.com www.fanniehillman.com To advertise, please contact marketing@fanniehillman.com.
fanniehillmanassociates @fanniehillman
Hillman Homes is published quarterly by Fannie Hillman + Associates. Printing by Abbott Communications Group. All rights reserved. No part of this publication may be used without written permission by the publisher. Every effort is made to avoid errors, misspellings and omissions. If an error comes to your attention, please accept our apologies and notify us immediately. Thank you.
315 E NEW ENGLAND page 19
Fall 2017 VOL 3 ISSUE 4
F EAT URES
4
BACK TO THE FUTURE
9
FALL DECOR
Maintaining the character and charm of a renovated 1926 home
Easy and fun ways to add a cozy autumn feel to your home
44 LI ST I NGS 17
LUXURY PORTFOLIO
60
GLOBAL SHOWCASE
LI F EST Y LE
Photograph by ALAN FRAEBEL
12
HILLMAN HELPS
14
EVENTS CALENDAR
15
DINING
16
RECIPE
FALL 2 0 17
3
4
FA L L 2017
Back Future TO THE
Restored 1926 beauty in the heart of Winter Park Photographs by ALAN FRAEBEL
FALL 2 0 17
5
THIS MAGNIFICENT Winter Park home is situated on an oversized lot overlooking Lake Chelton. The home has been lovingly restored, adding an additional 1900 sq.ft., while still maintaining its 1926 charm and character. A sunroom boasts stunning floor to ceiling arc windows which opens to the screened lanai overlooking Lake Chelton; while the beautiful family room features a gas fireplace. The ideal gourmet chef’s kitchen is complete with a Wolf gas cooktop, stainless steel appliances, marble countertops, custom Busby cabinets and a quaint breakfast nook. The home’s family room, which is open to the kitchen, features custom built-in cabinets and large fixed windows allowing for an abundance of natural light. The
149 CHELTON CIRCLE 4 bedrooms/4.2 bathrooms 4,953 sq.ft. upstairs master suite provides plenty of space along with its own private balcony. Additionally, two guest suites with private baths are on the 2nd floor; as well as a generous sized bonus room. The home also includes a newly constructed Mother-in-Law suite with full bath above the garage. This charmer boasts hardwood floors throughout along with cathedral ceilings and extensive moldings. There are multiple covered patios and balconies on this estate, including the original Mexican tile in the screened in patio. A brand new brick driveway and spacious brick paver courtyard also grace this home. One must really see this home to truly appreciate the elegance and charm that it possesses.
6
FA L L 2017
FALL 2 0 17
7
Multiple covered patios and balconies grace this renovated estate 8
FA L L 2017
FALL DECOR Easy and fun ways to add a cozy autumn feel to your home
FALL 2 0 17
9
FALL IS A TIME ASSOCIATED with cooler weather, football games, cozy evenings with family and friends and rich warm colors. Even here in Central Florida, we begin to experience a reprieve from the extreme heat and humidity, giving us the desire to entertain outside once again. Additionally, fall often inspires us to make over our décor, change things up a bit and create warm, comfy and fun spaces. There are countless ways to prepare your home with a fall look. A good start is to hang a richly colored fall wreath or a burlap wreath with your monogram; this gives a warm greeting to visitors. Pumpkins and gourds strategically placed in a planter are a nice fall touch to any porch. Paint a pumpkin in chalkboard paint and
10
FA L L 2017
write a fun greeting to guests. Inside your home, fill vases with faux leaves and branches to create an autumn vibe. Small pumpkins with a nice ribbon tied at the stem can be a fun touch to add in a bathroom. In the kitchen, using various sized mason jars, fill them with candy corn, acorns, pinecones, miniature faux pumpkins or even a healthy snack for the family. Add a cozy touch to your living spaces with a plaid or cable knit blanket thrown over a sofa. Don’t forget the pillows. Think of decorative pillows as the frosting and place a few fall inspired designed pillows throughout or even propped up in a book case. Battery operated candles can be automatically programmed to turn on at sunset; creating warmth to your home in the evening.
Don’t limit your fall décor to just the visual variety. Fall is the perfect time to pull out your pumpkin spice, apple pie or cinnamon scented candles. Create a homemade simmer pot by using a small pot, some water and spices and simmer on low to create an inviting autumn aroma. Fall brings up several fun celebrations, such as Halloween and Thanksgiving. Don’t be afraid to add special holiday specific items as the day grows closer. Perhaps your alma mater is playing in a big game, break out those school colors and entertain friends tailgate style; the perfect way to utilize and enjoy your outdoor living spaces. Fall offers up many ways to break away from your everyday look and do something special, fun and unique.
AUTUMN STOVE AROMA Orange slices 2 cinnamon sticks Few dashes of nutmeg Teaspoon of vanilla Water Place all spices and fruit in the pot and add water to fill. Place on simmer.
FALL 2 0 17
11
Hillman Helps
Fannie Hillman + Associates proudly supports members of the Joe R. Lee Club in Eatonville.
Fannie Hillman + Associates Cares FANNIE HILLMAN + ASSOCIATES is greatly invested in the Central Florida community. We believe in serving and giving back to a community that has so well supported our business for over 36 years. In that light, Fannie Hillman + Associates picks a couple of different organizations every year to support. Here are some of our community partners, and the amazing efforts they give to Central Florida:
BOYS & GIRLS CLUBS OF CENTRAL FLORIDA Boys & Girls Clubs of Central Florida
12
FA L L 2017
is a non profit that serves at risk youth who live in Central Florida’s toughest neighborhoods. Fannie Hillman + Associates has taken a specific interest in helping teen youth from the organization Joe R. Lee Club in Eatonville by creating a scholarship program to help teenagers from the Club begin their after high school years with a plan for their future. This scholarship program, which is being funded by Scott Hillman, Holly Keller, and the individual fundraising efforts of all of Fannie Hillman + Associates’ Real Estate Agents, aims to provide
graduating teen Club members who have put their academics, community service, and their goals for the future ahead of all other things to break the cycles of poverty they were born into and create successful lives for themselves. This first year, they have seen three graduating Club members receive scholarship assistance. These Club members have all agreed to come back to volunteer in the Club as college students to help spread the word about the opportunity that B&GCs and the Hillman Keller Scholarship provided them in hopes to reinforce the importance
Hillman Helps Left: Morgan Samuel Price's "Florida Palm" on display at the Albin Polasek Museum & Sculpture Gardens in Winter Park. Below: FH+A raises $10,000 for Harbor House survivors.
of education and determination to the younger generation of children in Eatonville. To support the Boys & Girls Clubs of Central Florida visit bgccf.org.
POLASEK MUSEUM The Albin Polasek Museum & Sculpture Gardens in Winter Park and Fannie Hillman + Associates have had a longtime friendship and partnership over the past 12plus years. Fannie Hillman has sponsored numerous art exhibits at the Polasek Museum including national traveling exhibits “The Art of Zelda Fitzgerald” and “Charles M. Russell: Master of Western Art,” as well as the annual Winter Park Paint Out plein air festival. This fall
Fannie Hillman will make possible another exceptional exhibit, “Captured in Paint: Central Florida in Art,” which shares an exquisite private collection of contemporary plein air landscapes (September 12 to December 3, 2017). It’s community partners like Fannie Hillman + Associates that help Winter Park live up to its motto, “City of Culture and Heritage.”
HARBOR HOUSE Harbor House is Orange County’s only state certified domestic violence organization. In addition to their emergency shelter, they also provide a 24-hour crisis hotline, counseling, legal advocacy, certified child care and a pet kennel. The $10,000 raised
by Fannie Hillman + Associates will directly benefit the survivors. Harbor House states that 87% of raised monies goes directly to the survivors, while the remaining 13% is used for costs to run the business. Summertime proved to be a busy time at the emergency shelter and the funds we raised went to the immediate needs of the shelter residents; from buying school supplies for children to purchasing toiletries and necessities for all the residents. Harbor House Chief Development Officer, Tekoa Pouerie said that our fundraiser most certainly helped them get over the hump of summer. For more information or to support Harbor House, visit harborhousefl.com.
FALL 2 0 17
13
Calendar
Look for Santa and Mrs. Claus at the 65th Annual “Ye Olde Hometown” Christmas Parade, December 2, Winter Park.
NOVEMBER 3 & 4
NOVEMBER 11
DECEMBER 2
Growvember at Mead Botanical Gardens Winter Park www.meadgarden.org
Cows N’ Cabs Winter Park www.cowsncabs.com
65th Annual “Ye Olde Hometown” Christmas Parade Winter Park www.winterpark.org
NOVEMBER 10
NOVEMBER 26
11th Annual Peacock Ball Winter Park www.wphistory.org
Orlando Philharmonic Orchestra “Holiday Pops” Concert Winter Park www.orlandophil.org
NOVEMBER 10-12 Maitland Rotary Art Show “Art Under the Stars” Maitland www.itsmymaitland.com
NOVEMBER 11
14
DECEMBER 7
“Winter on the Avenue” featuring the Annual Holiday Tree Lighting Winter Park www.winterpark.org
39th Annual Christmas in the Park Winter Park www.bachfestivalflorida.org
Tree Lighting Celebration Orlando www.cityoforlando.net
FA L L 2017
Season of Light Maitland www.itsmymaitland.com
DECEMBER 1
DECEMBER 1
Veterans Day Parade Orlando www.cityoforlando.net
DECEMBER 2
To find more events in the Winter Park and Orlando areas, visit www.winterpark.org and www.cityoforlando.net.
Dining
HOT SPOTS BUTTERMILK BAKERY 1198 N. Orange Ave. Winter Park, FL 32789 American & French cafe fare THE BEAR & PEACOCK BREWERY 1288 N. Orange Ave., Suite 1A Winter Park, FL 32789 Brewery NEW GENERAL 155 E. New England Ave. Winter Park, FL 32789 Contemporary American LUKE’S KITCHEN AND BAR 640 S. Orlando Ave. Maitland, FL 32751 Contemporary American BULLA GASTROBAR 110 S. Orlando Ave. #7 Winter Park, FL 32789 Contemporary Spanish & Catalan DOMU East End Market 3201 Corrine Dr., Suite 100 Orlando, FL 32803 Asian HUNGER STREET TACOS 2103 W. Fairbanks Ave. Winter Park, FL 32789 High Quality Mexican Street Food
CANNES ARTIST DoveCote’s Cannes Artist will be available through November, boasting those fall-ish flavors. Made of Buffalo Trace Bourbon, Allspice dram, herbaceous spiced mango, lime, pineapple, and tiki bitters, it’s a warming, Tiki-inspired drink with flavors reminiscent of the Mediterranean —hence the name, “Cannes” Artist.
DOVECOTE BRASSERIE Bank of America 390 N. Orange Ave. #110 Orlando, FL 32801 French-inspired brasserie
MYNT FINE INDIAN CUISINE 535 W. New England Ave. Winter Park, FL 32789 Indian
FALL 2 0 17
15
Pumpkin-Ginger Scones MAKES AB OUT 14
FRESH PUMPKIN PUREE is easy to make—simply cut a small baking pumpkin in half, roast until soft, scoop out flesh, and puree in a food processor. Strain excess liquid from puree if it seems thin.
11⁄2 cups all-purpose flour 1⁄2 cup whole-wheat flour 1⁄3 cup sugar 1 teaspoon salt 4 teaspoons baking powder 4 tablespoons cold unsalted butter, cut into small pieces
Recipe from Field to Feast: Recipes Celebrating Florida’s Farmers, Chefs, and Artisans by Pam Brandon, Katie Farmand and Heather McPherson.
2 tablespoons vegetable shortening 1⁄3 cup fresh or canned pumpkin puree (not pumpkin pie filling) 1⁄2 cup heavy cream
FA L L 2017
3. Add butter and shortening, and rub with fingers until pea-sized bits form. Set aside. 4. Whisk together pumpkin puree, cream, and egg in a small bowl. Pour cream mixture into flour mixture, and stir until just combined. Add ginger, and knead with floured hands until dough just comes together.
1 cup chopped crystallized ginger
5. Turn dough out onto a floured surface, and roll out to 1⁄4-inch thickness. Cut scones with a round cutter, re-rolling scraps only once.
1. Place a pizza stone on the middle rack of the oven and preheat oven to 375°F.
6. Bake, in batches if necessary, until lightly golden, about 15 to 20 minutes.
1 egg
16
2. Combine all-purpose flour, wholewheat flour, sugar, salt, and baking powder in a large bowl.
2040 VENETIAN
page 30
FALL 2 0 17
17
76 EASTWIND A tree-canopied large lot with deeded access to Winter Park Chain of Lakes, oering in town privacy. Spacious home with downstairs master, volume ceilings, flex space and screened in pool.
4 bedrooms/3.1 bathrooms 3,458 sq.ft.
18
FA L L 2017
1 100 MARINER
1
Wonderful open floor plan featuring an updated kitchen and loads of natural light. A custom pool with an oversized lanai completes the backyard; along with neighborhood access to Winter Park Chain of Lakes.
4 bedrooms/2.1 bathrooms 2,676 sq.ft.
2 315 E NEW ENGLAND UNIT 23
2
Known as the Jewel of Winter Park, Villa Siena is located two blocks o Park Avenue. Amenities include assigned garage parking, exercise room, individual storage units, roof top sitting area and much more.
2 bedrooms/2 bathrooms 1,735 sq.ft.
FALL 2 0 17
19
1
1 664 OSCEOLA #301 Spectacular lakefront living in this remodeled ground floor condo in the luxurious Perle Du Lac community. Home boasts sweeping views of Lake Virginia, and a chef’s kitchen opening to a large living/dining room.
3 bedrooms/3.1 bathrooms 2,714 sq.ft.
2 671 VIA LUGANO Unparalleled privacy located in the desirable Via’s of Winter Park. Home features gorgeous entry courtyard, climate controlled wine room, inviting pool, and French doors throughout creating wonderful natural light.
6 bedrooms/6.3 bathrooms, 7,048 sq.ft. 20
FA L L 2017
2
FALL 2 0 17
21
1
22
FA L L 2017
1 1670 SPRUCE Winter Park home situated on a double lot, featuring two master suites and a spacious Florida room with French doors that provides substantial natural light and views of the backyard. A generous kitchen opens to the family room which oers a wood burning fireplace.
5 bedrooms/4 bathrooms 3,638 sq.ft.
2
2 1712 BARCELONA Situated on a half-acre lot in the sought after Sevilla neighborhood, this home features a newly constructed flex space; perfect for an in-law suite. 20 foot sliding glass doors recess into the walls, creating an incredible extended living space from the kitchen to the screened patio and pool.
5 bedrooms/4.2 bathrooms 4,233 sq.ft.
3 2020 FAWSETT Spectacular James Gamble Rogers II Mediterranean waterfront estate. Elegant living and adjoining dining room will accommodate large parties or intimate dinners by the fireplace. Master suite includes a sitting area and private terrace with beautiful lake views.
3
5 bedrooms/4.1 bathrooms 5,967 sq.ft.
870 MAYFIELD Spectacular New England inspired spacious home, in the heart of Winter Park, featuring a downstairs master bedroom, fabulously large mudroom and a gourmet kitchen. Two bonus/ flex rooms and a detached guest suite complete with a kitchenette add perfect additional space.
6 bedrooms/6 bathrooms 5,797 sq.ft.
24
FA L L 2017
1017 TUSCANY PLACE Impressive home with deeded access to Winter Park Chain of Lakes featuring Brazilian hardwood floors, downstairs master bedroom and five fireplaces. Gourmet kitchen complete with Viking appliances opens to expansive family room which overlooks inviting pool.
6 bedrooms/5.3 bathrooms, 5,954 sq.ft.
FALL 2 0 17
25
1111 VIA LUGANO Amazing half-acre corner lot, in the heart of the Via’s, including a spacious downstairs master suite and park like backyard complete with pool oasis. Remarkable gourmet kitchen with extensive breakfast bar overlooking family room with wood beamed ceiling.
5 bedrooms/4 bathrooms 4,398 sq.ft.
26
FA L L 2017
1141 WHITESELL Spacious new construction home in the desirable Via’s of Winter Park. Open floor plan with an abundance of natural light, chef’s dream kitchen, private master suite and backyard haven with outdoor kitchen, pool, and covered patio.
4 bedrooms/4.2 bathrooms 4,010 sq.ft.
FALL 2 0 17
27
1211 VIA ESTRELLA Beautifully finished home with crown moulding, plantation shutters, 10-ft ceilings throughout, and solid wood doors. Master suite with custom walk in closet, tremendous kitchen with expansive cabinetry and cork flooring. A large bonus room oers wonderful flex space.
3 bedrooms/2 bathrooms 2,578 sq.ft.
28
FA L L 2017
1 1180 WOODMERE
1
Updated, open concept home in a prime Winter Park location; spectacular kitchen with 2 islands and 8 burner Wolf stove, beverage center and much more. Family room showcases 2 story ceilings, built-ins and a wall of French doors opening to relaxing pool and lavish backyard.
5 bedrooms/4.2 bathrooms 5,398 sq.ft.
2 1878 TURNBERRY
2
Adjacent to the Country Club of Orlando, this home features two master bedrooms, one downstairs, and a family room with sweeping views of the 8th Hole of Country Club of Orlando Golf Course. Also included is a chef’s dream kitchen, an elevator and sauna.
3 bedrooms/5 bathrooms 4,292 sq.ft.
3 1219 VIA ESTRELLA
3
Situated in the desirable Via’s of Winter Park, this home boasts newly refinished hardwood floors throughout the living areas and a large renovated kitchen complete with custom cabinets. Tranquil backyard includes salt water pool and covered patio.
4 bedrooms/3.2 bathrooms 3,389 sq.ft.
1 2040 VENETIAN Exquisite lakefront estate in notable Via’s of Winter Park, with 227 feet of lakefront and breathtaking views. The gourmet kitchen opens to the cozy family room and breakfast nook. Master bedroom features an expansive balcony overlooking Lake Maitland. Resort style backyard with pool, large covered patio, summer kitchen and gas fire pit.
1
6 bedrooms/7.1 bathrooms 7,677 sq.ft.
2 1450 PLACE PICARDY This Spanish Mediterranean residence oers high ceilings, arched doorways, wood floors and ornamental ironwork. The open kitchen features an island with a prep sink and warming drawer, while the French doors lead out to the lanai and brick paver courtyard with ivory adorned walls and a fountain centerpiece.
4 bedrooms/3.1 bathrooms 3,358 sq.ft.
30
FA L L 2017
2
1235 PRESERVE POINT Superbly designed home with an extraordinary great room detailed with crown moulding and in-wall sliders that extend the living space to the outside lanais; which overlook the gleaming pool with an infinity edge to the spa. Secluded downstairs master retreat featuring custom designed walk-in closet and an amazing kitchen with gas cooktop and double ovens.
5 bedrooms/4.1 bathrooms 4,344 sq.ft. SOLD for $1,700,000
FALL 2 0 17
31
3810 KINSLEY PLACE Lakefront pool home welcomes you with nineteen foot high cathedral tongue and groove ceiling and wall of glass with spectacular lake views. Expansive kitchen boasts views of pool and lake, along with a pass through window oering access to patio bar.
4 bedrooms/3.1 bathrooms 5,024 sq.ft.
32
FA L L 2017
1 1655 BARCELONA Two story brick home features an enormous great room which oers 2 distinct living areas, and a gourmet kitchen with cozy fireplace and granite island. Downstairs master suite includes fireplace and 2 walkin closets; lush backyard with playhouse and dock to creek.
1
5 bedrooms/4.1 bathrooms 5,429 sq.ft.
2 1665 KING ARTHUR Split plan family home is located in the desirable Kings Row neighborhood. The family room oers a soaring ceiling & fireplace, the open bonus room runs the length of the house providing the perfect flex space, and the oversized master suite is complete with an updated bathroom.
4 bedrooms/2 bathrooms 3,019 sq.ft.
2 FALL 2 0 17
33
1
1
1691 OAKHURST Located in the notable Winter Park area, this home boasts a professional grade kitchen with large center island and opens to an immense great room and stone fireplace. Private granite patio includes summer kitchen, heated spa and lushly landscaped yard.
5 bedrooms/4 bathrooms 4,112 sq.ft.
2 1741 PINE Immaculate Winter Park home oers a first floor master suite along with a downstairs flex room, perfect for a nursery, oďŹƒce, or guest room. Spacious kitchen with granite counters opens into generous sized family room with custom builtins and French doors leading to the patio and pool.
4 bedrooms/3 bathrooms 3,297 sq.ft.
34
FA L L 2017
2
1911 STONEHURST Southern charm at its finest, this home is wrapped in glass windows and doors, bursting with natural light throughout the home. Gourmet kitchen was redesigned with high quality detail. The backyard oasis features a summer kitchen, fire pit and saltwater pool and heated spa.
4 bedrooms/4.2 bathrooms 5,097 sq.ft.
FALL 2 0 17
35
1 2325 CHANTILLY Fabulous Winter Park pool home is situated on a quiet street offering hardwood floors throughout the entire downstairs. Generous kitchen with granite counters and wine fridge opens up to comfy family room with French doors overlooking the pool and patio.
1
4 bedrooms/3.2 bathrooms 3,782 sq.ft.
2 1941 LEGION Lake Maitland estate offers 175’ on the water and has sweeping views of the lake from almost every room. A fabulous entertaining kitchen includes a large granite island and triple sinks. This estate boasts a separate bonus studio in the main home and a detached guest cottage with full kitchen. Luxurious backyard with saltwater pool, summer kitchen and double slip boat dock.
6 bedrooms/7.2 bathrooms 10,493 sq.ft.
36
FA L L 2017
2
431 BALMORAL New home custom built by Zoltan Homes in prime Winter Park location. Home will feature an open stair concept, engineered White Oak wood flooring, and Thermador appliances including a full size 18� wine tower. Outside living is to include a full service summer kitchen, salt water pool and motorized patio screens.
5 bedrooms/5.1 bathrooms 4,381 sq.ft.
PHOTOREALISTIC ARCHITECTURAL RENDERINGS
FALL 2 0 17
37
2803 WILLOW BAY Appealing home on oversized lot in gated community includes an open floor plan and water views from almost every room. This home oers a master bedroom with a large sitting area, built-in shelves, and a second floor bonus room.
4 bedrooms/3 bathrooms 2,786 sq.ft.
38
FA L L 2017
8041 LAKE WAUNATTA Pleasing lakefront pool home boasts vaulted ceilings, wood floors, amazing lake views from all rooms, and a family room enhanced by a double sided fireplace. Sunroom oers floor to ceiling windows, showcasing pool and lake views and built-in summer kitchen.
4 bedrooms/4.1 bathrooms 5,329 sq.ft. FALL 2 0 17
39
1
1 2234 VIA LUNA Pristine traditional home in the heart of the Via’s oers a downstairs master suite and a separate guest room. Delightful backyard oasis boasts a saltwater screened pool, covered patio and high-end fencing.
4 bedrooms/3.1 bathrooms 3,222 sq.ft.
2 4516 BURKE Lovely Mediterranean home situated in desirable Baldwin Park features a gourmet kitchen with huge breakfast bar, wine storage and prep island. A spacious family room with gas fireplace and French doors open to a sparkling pool and spa.
40
FA L L 2017
5 bedrooms/4.2 bathrooms, 5,079 sq.ft.
2
FALL 2 0 17
41
2900 WESTCHESTER Lovely canal front home with lake views from the screened in patio, oers oak floors, brick fireplace and crown moulding. The open floor plan boasts an abundance of natural light and kitchen which opens up to the family room.
3 bedrooms/2 bathrooms 2,270 sq.ft.
42
FA L L 2017
5156 VISTAMERE Fabulous custom built home in the notable Dr. Phillips area includes spacious kitchen which opens to a generous great room with custom cabinets and gas fireplace. Large master bedroom opens up to enormous pool and lanai with extra high pool enclosure.
6 bedrooms/ 5 bathrooms 4,482 sq.ft.
FALL 2 0 17
43
44
FA L L 2017
Dear Neighbors, Welcome to the fall edition of The Hillman Report. 2017 continues to prove to be a very active year in the Central Florida real estate market. Overall, single family home prices have continued to increase at a steady rate in Central Florida, while inventory (active listings) has been on the decline. The inventory for Orange County’s single family homes has continued to decline, which has begun to lead to a decrease in total closings. These factors, coupled with homes selling faster, contribute to a market which is very appealing to those selling. Condos & townhomes have seen an inventory decline at an even more rapid pace; dropping 19.7% from this time last year. Closed unit sales of condos and townhomes rose slightly, which, when coupled with the decrease in new listings, will put more pressure on already low inventory numbers, potentially creating an even more favorable sellers’ market down the road. Similarly, Seminole County’s single family home prices continue to rise, increasing 7.6% from last year, while closed sales fell. Homes are staying on the market for an average of a mere 42 days. All these factors combined are quite agreeable for sellers.
In Winter Park’s zip code of 32789, home prices were up 7.3% with inventory and closed sales declining at a similar pace compared to this time last year. Additionally, time on the market decreased slightly, while overall supply numbers remain healthy, indicating a fairly balanced market. Condos and townhomes actually saw an uptick in both new inventory and closed sales. Units are continuing to sell relatively quickly, while overall inventory remains consistent. If these trends continue, we could see market conditions begin to tip in favor of the buyers in the condo and townhome space. Please review the following report to see more detailed information and trends. Overall, the Central Florida real estate market is solid, prices are up, new inventory is on the decline, and homes are closing quickly. Central Florida continues to be a desirable location, and was named, earlier this year, by U.S. News and World Report as one of the top 25 most desirable places to live in the country. You can place your confidence in Fannie Hillman + Associates; we are here to assist you with any questions you have concerning the real estate market. Please stop by our office or give us a call to further discuss market statistics, or the advantages of buying or selling your home.
FALL 2 0 17
45
Orange County Single Family Homes Lakefront Market Matrix
QUICK HITS 3 r d Q u a r ter 2 0 1 7 *Integrates Lakefront and NonLakefront Market Statistics SALES PRICE Median Sales Price
CLOSED SALES Total Units Sold
INVENTORY Active Listings
SUPPLY Months of Inventory
9.1%
6.8%
7.3%
Δ Y/Y
Δ Y/Y
Δ Y/Y
Months
Days on Market
D.O.M. Average Days on Market
13.9%
52
Δ Y/Y
Days
% Δ (YR)
2Q-2017
% Δ (QTR)
$ 560,000 $ 483,250
15.9% $ 600,000
-6.7%
Average Sales Price
$ 833,044 $ 793,917
4.9% $ 885,160
-5.9%
Average Price per Sq Ft
$
6.2% $
231.90
-5.4%
219.45 $
206.69
Number of Sales (Closed)
158
146
8.2%
183
-13.7%
Days on Market (From List Date)
103
109
-5.5%
132
-22.0%
Non-Lakefront Market Matrix
3Q-2017
3Q-2016
% Δ (YR)
2Q-2017
% Δ (QTR)
Median Sales Price
$ 265,900 $ 245,000
8.5% $ 260,500
2.1%
Average Sales Price
$ 308,723 $ 281,376
9.7% $ 307,197
0.5%
Average Price per Sq Ft
$
142.98 $
Number of Sales (Closed)
128.99
10.8% $
141.25
1.2%
3,839
4,159
-7.7%
4,431
-13.4%
50
58
-15.0%
51
-3.1%
Days on Market (From List Date) 2.7
3Q-2016
Median Sales Price
*Graphs Below Include All Lakefront and Non-Lakefront Single Family Homes Closed Sales
MARKET TIME
3Q-2017
New Listings
Active Listings
Months of Inventory
12,000
24
10,500
21
9,000
18
7,500
15
6,000
12
4,500
9
3,000
6
1,500
3
0
0 3Q08
3Q09
3Q10
3Q11
3Q12
3Q13
Median Sold Price
3Q14
3Q15
3Q16
3Q17
Average Price per Square Foot
$320,000
$160
$280,000
$140
$240,000
$120
$200,000
$100
$160,000
$80
$120,000
$60
$80,000
$40
$40,000
$20
$0
$0 3Q08
46
FA L L 2017
3Q09
3Q10
3Q11
3Q12
3Q13
3Q14
3Q15
3Q16
3Q17
Orange County Condominiums and Townhomes Market Matrix
3Q-2017
3Q-2016
% Δ (YR)
2Q-2017
% Δ (QTR)
Median Sales Price
$ 150,000 $ 130,500
14.9% $ 147,000
2.0%
Average Sales Price
$ 175,831 $ 160,090
9.8% $ 173,743
1.2%
Average Price per Sq Ft
$
126.54 $
Number of Sales (Closed)
New Listings
11.0% $
124.81
1.4%
1,403
1,356
3.5%
1,359
3.2%
52
70
-26.0%
60
-14.4%
Days on Market (From List Date)
Closed Sales
114.00
Active Listings
QUICK HITS 3 r d Q u a r te r 2 0 1 7 SALES PRICE Median Sales Price
Months of Inventory
CLOSED SALES Total Units Sold
6,000
40
5,250
35
4,500
30
3,750
25
3,000
20
2,250
15
1,500
10
MARKET TIME
5
Days on Market
750 0
INVENTORY Active Listings
SUPPLY Months of Inventory
0 3Q08
3Q09
3Q10
3Q11
3Q12
3Q13
Median Sold Price
3Q14
3Q15
3Q16
D.O.M.
3Q17
Average Days on Market
14.9%
Δ Y/Y
3.5%
Δ Y/Y
19.7%
Δ Y/Y
2.2
Months
26.0%
Δ Y/Y
52
Days
Average Price per Square Foot
$320,000
$160
$280,000
$140
$240,000
$120
$200,000
$100
$160,000
$80
$120,000
$60
$80,000
$40
$40,000
$20
$0
$0 3Q08
3Q09
3Q10
3Q11
3Q12
3Q13
3Q14
3Q15
3Q16
3Q17
FALL 2 0 17
47
Seminole County Single Family Homes Lakefront Market Matrix
QUICK HITS 3 r d Q u a r ter 2 0 1 7 *Integrates Lakefront and NonLakefront Market Statistics SALES PRICE Median Sales Price
CLOSED SALES Total Units Sold
INVENTORY Active Listings
SUPPLY Months of Inventory
7.6%
11.8%
4.6%
Δ Y/Y
Δ Y/Y
Δ Y/Y
Months
Days on Market
D.O.M. Average Days on Market
21.4%
42
Δ Y/Y
Days
% Δ (YR)
2Q-2017
% Δ (QTR)
$ 373,125 $ 342,000
9.1% $ 399,900
-6.7%
Average Sales Price
$ 479,405 $ 395,414
21.2% $ 464,957
3.1%
Average Price per Sq Ft
$
171.31 $
157.10
9.0% $
160.37
6.8%
Number of Sales (Closed)
45
61
-26.2%
57
-21.1%
Days on Market (From List Date)
77
83
-6.5%
98
-21.1%
Non-Lakefront Market Matrix
3Q-2017
3Q-2016
% Δ (YR)
2Q-2017
% Δ (QTR)
Median Sales Price
$ 265,000 $ 249,900
6.0% $ 263,750
0.5%
Average Sales Price
$ 294,718 $ 281,464
4.7% $ 298,562
-1.3%
Average Price per Sq Ft
$
8.7% $
139.54 $
Number of Sales (Closed)
128.36
137.77
1.3%
1,510
1,698
-11.1%
1,728
-12.6%
41
52
-21.8%
45
-9.5%
Days on Market (From List Date) 2.2
3Q-2016
Median Sales Price
*Graphs Below Include All Lakefront and Non-Lakefront Single Family Homes Closed Sales
MARKET TIME
3Q-2017
New Listings
Active Listings
Months of Inventory
4,000
16
3,500
14
3,000
12
2,500
10
2,000
8
1,500
6
1,000
4
500
2
0
0 3Q08
3Q09
3Q10
3Q11
3Q12
3Q13
Median Sold Price
3Q14
3Q15
3Q16
3Q17
Average Price per Square Foot
$320,000
$160
$280,000
$140
$240,000
$120
$200,000
$100
$160,000
$80
$120,000
$60
$80,000
$40
$40,000
$20
$0
$0 3Q08
48
FA L L 2017
3Q09
3Q10
3Q11
3Q12
3Q13
3Q14
3Q15
3Q16
3Q17
Seminole County Condominiums and Townhomes Market Matrix
3Q-2017
3Q-2016
% Δ (YR)
2Q-2017
% Δ (QTR)
Median Sales Price
$ 155,000 $ 133,450
16.1% $ 150,000
3.3%
Average Sales Price
$ 161,448 $ 140,941
14.6% $ 157,848
2.3%
Average Price per Sq Ft
$
13.6% $
110.88
3.0%
114.24 $
Number of Sales (Closed) Days on Market (From List Date)
Closed Sales
New Listings
100.54
550
602
-8.6%
635
-13.4%
26
46
-43.4%
34
-22.2%
Active Listings
QUICK HITS 3 r d Q u a r te r 2 0 1 7 SALES PRICE Median Sales Price
Months of Inventory
CLOSED SALES Total Units Sold
1,600
32
1,400
28
1,200
24
1,000
20
800
16
600
12
400
8
MARKET TIME
200
4
Days on Market
0
INVENTORY Active Listings
SUPPLY Months of Inventory
0 3Q08
3Q09
3Q10
3Q11
3Q12
3Q13
Median Sold Price
3Q14
3Q15
3Q16
D.O.M.
3Q17
Average Days on Market
16.1%
Δ Y/Y
8.6%
Δ Y/Y
10.5%
Δ Y/Y
1.3
Months
43.4%
Δ Y/Y
26
Days
Average Price per Square Foot
$320,000
$160
$280,000
$140
$240,000
$120
$200,000
$100
$160,000
$80
$120,000
$60
$80,000
$40
$40,000
$20
$0
$0 3Q08
3Q09
3Q10
3Q11
3Q12
3Q13
3Q14
3Q15
3Q16
3Q17
FALL 2 0 17
49
Winter Park (32789) Single Family Homes Lakefront Market Matrix
QUICK HITS 3 r d Q u a r ter 2 0 1 7
3Q-2017
SALES PRICE Median Sales Price
CLOSED SALES Total Units Sold
INVENTORY Active Listings
SUPPLY Months of Inventory
7.3%
10.2%
10.8%
Δ Y/Y
Δ Y/Y
Δ Y/Y
Months
203.0% $2,000,000
43.9%
Average Sales Price
$2,878,125 $1,968,571
46.2% $2,280,333
26.2%
Average Price per Sq Ft
$
77.4% $
441.83
58.5%
700.28 $
Days on Market (From List Date)
Non-Lakefront Market Matrix
Days on Market
D.O.M. Average Days on Market
1.8%
99
Δ Y/Y
Days
394.82
2
7
-71.4%
15
-86.7%
156
148
5.1%
108
43.9%
3Q-2017
3Q-2016
% Δ (YR)
2Q-2017
% Δ (QTR)
Median Sales Price
$ 580,000 $ 542,750
6.9% $ 536,000
8.2%
Average Sales Price
$ 692,139 $ 723,531
-4.3% $ 636,625
8.7%
Average Price per Sq Ft
$
255.71 $
Number of Sales (Closed)
240.42
6.4% $
240.94
6.1%
113
120
-5.8%
147
-23.1%
98
98
0.0%
95
3.9%
*Graphs Below Include All Lakefront and Non-Lakefront Single Family Homes Closed Sales
MARKET TIME
% Δ (QTR)
$2,878,125 $ 950,000
Days on Market (From List Date) 4.7
2Q-2017
Median Sales Price
Number of Sales (Closed) *Integrates Lakefront and NonLakefront Market Statistics
% Δ (YR)
3Q-2016
New Listings
Active Listings
Months of Inventory
480
24
420
21
360
18
300
15
240
12
180
9
120
6
60
3
0
0 3Q08
3Q09
3Q10
3Q11
3Q12
3Q13
Median Sold Price
3Q14
3Q15
3Q16
3Q17
Average Price per Square Foot
$640,000
$320
$560,000
$280
$480,000
$240
$400,000
$200
$320,000
$160
$240,000
$120
$160,000
$80
$80,000
$40
$0
$0 3Q08
50
FA L L 2017
3Q09
3Q10
3Q11
3Q12
3Q13
3Q14
3Q15
3Q16
3Q17
Winter Park (32789) Condominiums and Townhomes Market Matrix
3Q-2017
3Q-2016
% Δ (YR)
2Q-2017
% Δ (QTR)
Median Sales Price
$ 265,000 $ 276,000
-4.0% $ 335,000
-20.9%
Average Sales Price
$ 452,239 $ 379,100
19.3% $ 461,149
-1.9%
Average Price per Sq Ft
$
229.47 $
223.40
2.7% $
256.69
-10.6%
Number of Sales (Closed)
23
22
4.5%
34
-32.4%
Days on Market (From List Date)
51
149
-65.9%
90
-43.6%
Closed Sales
New Listings
Active Listings
QUICK HITS 3 r d Q u a r te r 2 0 1 7 SALES PRICE Median Sales Price
Months of Inventory
CLOSED SALES Total Units Sold
160
64
140
56
120
48
100
40
80
32
60
24
40
16
MARKET TIME
20
8
Days on Market
0
INVENTORY Active Listings
SUPPLY Months of Inventory
0 3Q08
3Q09
3Q10
3Q11
3Q12
3Q13
Median Sold Price
3Q14
3Q15
3Q16
D.O.M.
3Q17
Average Days on Market
4.0%
Δ Y/Y
4.5%
Δ Y/Y
3.4%
Δ Y/Y
7.8
Months
65.9%
Δ Y/Y
51
Days
Average Price per Square Foot
$400,000
$320
$350,000
$280
$300,000
$240
$250,000
$200
$200,000
$160
$150,000
$120
$100,000
$80
$50,000
$40
$0
$0 3Q08
3Q09
3Q10
3Q11
3Q12
3Q13
3Q14
3Q15
3Q16
3Q17
FALL 2 0 17
51
Maitland (32751) Single Family Homes Lakefront Market Matrix
QUICK HITS 3 r d Q u a r ter 2 0 1 7
3Q-2017
SALES PRICE Median Sales Price
CLOSED SALES Total Units Sold
INVENTORY Active Listings
SUPPLY Months of Inventory
28.0%
2.3%
14.7%
2.9
Δ Y/Y
Δ Y/Y
Δ Y/Y
Months
Days on Market
D.O.M. Average Days on Market
14.9%
63
Δ Y/Y
Days
2Q-2017
% Δ (QTR)
$ 597,000 $ 812,500
-26.5% $ 747,500
-20.1%
Average Sales Price
$1,124,917 $1,116,150
0.8% $1,229,169
-8.5%
Average Price per Sq Ft
$
243.15 $
Days on Market (From List Date)
Non-Lakefront Market Matrix
250.01
-2.7% $
315.82
-23.0%
9
10
-10.0%
12
-25.0%
173
159
8.9%
53
225.2%
3Q-2017
3Q-2016
% Δ (YR)
2Q-2017
% Δ (QTR)
Median Sales Price
$ 362,500 $ 285,000
27.2% $ 310,000
16.9%
Average Sales Price
$ 406,496 $ 326,700
24.4% $ 383,037
6.1%
Average Price per Sq Ft
$
11.1% $
164.94 $
148.45
165.68
-0.4%
Number of Sales (Closed)
76
77
-1.3%
94
-19.1%
Days on Market (From List Date)
50
64
-20.7%
59
-14.5%
*Graphs Below Include All Lakefront and Non-Lakefront Single Family Homes Closed Sales
MARKET TIME
% Δ (YR)
Median Sales Price
Number of Sales (Closed) *Integrates Lakefront and NonLakefront Market Statistics
3Q-2016
New Listings
Active Listings
Months of Inventory
200
16
175
14
150
12
125
10
100
8
75
6
50
4
25
2
0
0 3Q08
3Q09
3Q10
3Q11
3Q12
3Q13
Median Sold Price
3Q14
3Q15
3Q16
3Q17
Average Price per Square Foot
$400,000
$200
$350,000
$175
$300,000
$150
$250,000
$125
$200,000
$100
$150,000
$75
$100,000
$50
$50,000
$25
$0
$0 3Q08
52
FA L L 2017
3Q09
3Q10
3Q11
3Q12
3Q13
3Q14
3Q15
3Q16
3Q17
Winter Park (32792) Single Family Homes Market Matrix
3Q-2017
3Q-2016
% Δ (YR)
2Q-2017
% Δ (QTR)
Median Sales Price
$ 261,750 $ 240,000
9.1% $ 249,000
5.1%
Average Sales Price
$ 286,140 $ 273,444
4.6% $ 275,586
3.8%
Average Price per Sq Ft
$
162.79 $
Number of Sales (Closed) Days on Market (From List Date)
Closed Sales
New Listings
145.22
12.1% $
154.33
5.5%
130
139
-6.5%
153
-15.0%
33
40
-18.9%
47
-30.3%
Active Listings
QUICK HITS 3 r d Q u a r te r 2 0 1 7 SALES PRICE Median Sales Price
Months of Inventory
CLOSED SALES Total Units Sold
240
16
210
14
180
12
150
10
120
8
90
6
60
4
MARKET TIME
30
2
Days on Market
0
INVENTORY Active Listings
SUPPLY Months of Inventory
0 3Q08
3Q09
3Q10
3Q11
3Q12
3Q13
Median Sold Price
3Q14
3Q15
3Q16
D.O.M.
3Q17
Average Days on Market
9.1%
Δ Y/Y
6.5%
Δ Y/Y
12.2%
Δ Y/Y
2.1
Months
18.9%
Δ Y/Y
33
Days
Average Price per Square Foot
$320,000
$240
$280,000
$210
$240,000
$180
$200,000
$150
$160,000
$120
$120,000
$90
$80,000
$60
$40,000
$30
$0
$0 3Q08
3Q09
3Q10
3Q11
3Q12
3Q13
3Q14
3Q15
3Q16
3Q17
FALL 2 0 17
53
College Park (32804) Single Family Homes Lakefront Market Matrix
QUICK HITS 3 r d Q u a r ter 2 0 1 7
3Q-2017
SALES PRICE Median Sales Price
CLOSED SALES Total Units Sold
INVENTORY Active Listings
SUPPLY Months of Inventory
15.2%
2.2%
6.1%
3.4
Δ Y/Y
Δ Y/Y
Δ Y/Y
Months
$ 645,000 $ 347,900
85.4% $ 880,400
-26.7%
Average Sales Price
$ 765,857 $ 347,900
120.1% $ 881,467
-13.1%
Average Price per Sq Ft
$
253.87 $
Days on Market (From List Date)
Non-Lakefront Market Matrix
Days on Market
D.O.M. Average Days on Market
18.5%
67
Δ Y/Y
Days
147.92
71.6% $
263.02
-3.5%
7
1
600.0%
6
16.7%
88
184
-52.0%
140
-37.1%
3Q-2017
3Q-2016
% Δ (YR)
2Q-2017
% Δ (QTR)
Median Sales Price
$ 292,000 $ 267,498
9.2% $ 303,000
-3.6%
Average Sales Price
$ 375,862 $ 329,756
14.0% $ 352,397
6.7%
Average Price per Sq Ft
$
209.32 $
191.41
9.4% $
203.03
3.1%
Number of Sales (Closed)
88
92
-4.3%
126
-30.2%
Days on Market (From List Date)
66
81
-19.4%
48
36.2%
*Graphs Below Include All Lakefront and Non-Lakefront Single Family Homes Closed Sales
MARKET TIME
% Δ (QTR)
2Q-2017
Median Sales Price
Number of Sales (Closed) *Integrates Lakefront and NonLakefront Market Statistics
% Δ (YR)
3Q-2016
New Listings
Active Listings
Months of Inventory
240
16
210
14
180
12
150
10
120
8
90
6
60
4
30
2
0
0 3Q08
3Q09
3Q10
3Q11
3Q12
3Q13
Median Sold Price
3Q14
3Q15
3Q16
3Q17
Average Price per Square Foot
$320,000
$240
$280,000
$210
$240,000
$180
$200,000
$150
$160,000
$120
$120,000
$90
$80,000
$60
$40,000
$30
$0
$0 3Q08
54
FA L L 2017
3Q09
3Q10
3Q11
3Q12
3Q13
3Q14
3Q15
3Q16
3Q17
Rose Isle, Beverly Shores, Audubon Park, Colonial Town (32803) Single Family Homes Lakefront Market Matrix
3Q-2017
% Δ (YR)
3Q-2016
% Δ (QTR)
2Q-2017
Median Sales Price
$ 957,500 $ 372,500
157.0% $ 425,000
125.3%
Average Sales Price
$ 847,917 $ 483,750
75.3% $ 673,333
25.9%
Average Price per Sq Ft
$
19.9% $
207.03
40.6%
291.09 $ 3
4
-25.0%
3
0.0%
88
184
-52.0%
140
-37.1%
Number of Sales (Closed) Days on Market (From List Date)
242.81
QUICK HITS 3 r d Q u a r te r 2 0 1 7 *Integrates Lakefront and NonLakefront Market Statistics SALES PRICE
Non-Lakefront Market Matrix
3Q-2017
3Q-2016
% Δ (YR)
2Q-2017
Median Sales Price
$ 290,000 $ 278,275
4.2% $ 304,500
-4.8%
Average Sales Price
$ 332,891 $ 316,815
5.1% $ 350,855
-5.1%
Average Price per Sq Ft
$
8.4% $
212.73 $
196.25
Median Sales Price
% Δ (QTR)
211.03
0.8%
CLOSED SALES Total Units Sold
Number of Sales (Closed)
94
114
-17.5%
114
-17.5%
INVENTORY
Days on Market (From List Date)
28
57
-50.8%
38
-25.2%
Active Listings
SUPPLY Months of Inventory
*Graphs Below Include All Lakefront and Non-Lakefront Single Family Homes Closed Sales
New Listings
Active Listings
3.6%
Δ Y/Y
17.8%
Δ Y/Y
9.1%
Δ Y/Y
2.8
Months
47.0%
Δ Y/Y
31
Days
Months of Inventory
240
16
210
14
180
12
150
10
120
8
90
6
60
4
30
2
0
MARKET TIME Days on Market
D.O.M. Average Days on Market
0 3Q08
3Q09
3Q10
3Q11
3Q12
3Q13
Median Sold Price
3Q14
3Q15
3Q16
3Q17
Average Price per Square Foot
$320,000
$240
$280,000
$210
$240,000
$180
$200,000
$150
$160,000
$120
$120,000
$90
$80,000
$60
$40,000
$30
$0
$0 3Q08
3Q09
3Q10
3Q11
3Q12
3Q13
3Q14
3Q15
3Q16
3Q17 FALL 2 0 17
55
Baldwin Park (32814) Single Family Homes Market Matrix
QUICK HITS 3 r d Q u a r ter 2 0 1 7 SALES PRICE Median Sales Price
CLOSED SALES Total Units Sold
INVENTORY Active Listings
SUPPLY Months of Inventory
MARKET TIME Days on Market
D.O.M. Average Days on Market
6.1%
Δ Y/Y
30.8%
Δ Y/Y
42.1%
1.9
Δ Y/Y
Months
2.8%
Δ Y/Y
59
Days
3Q-2017
3Q-2016
% Δ (YR)
2Q-2017
% Δ (QTR)
Median Sales Price
$ 592,500 $ 558,500
6.1% $ 593,750
-0.2%
Average Sales Price
$ 646,974 $ 636,804
1.6% $ 675,128
-4.2%
Average Price per Sq Ft
$
8.1% $
231.61
-2.5%
225.85 $
208.92
Number of Sales (Closed)
34
26
30.8%
40
-15.0%
Days on Market (From List Date)
59
61
-2.8%
43
37.4%
Closed Sales
New Listings
Active Listings
Months of Inventory
120
16
105
14
90
12
75
10
60
8
45
6
30
4
15
2
0
0 3Q08
3Q09
3Q10
3Q11
3Q12
3Q13
Median Sold Price
3Q14
3Q15
3Q16
3Q17
Average Price per Square Foot
$640,000
$240
$560,000
$210
$480,000
$180
$400,000
$150
$320,000
$120
$240,000
$90
$160,000
$60
$80,000
$30
$0
$0 3Q08
56
FA L L 2017
3Q09
3Q10
3Q11
3Q12
3Q13
3Q14
3Q15
3Q16
3Q17
Baldwin Park (32814) Condominiums and Townhomes Market Matrix
3Q-2017
3Q-2016
% Δ (YR)
2Q-2017
% Δ (QTR)
Median Sales Price
$ 372,500 $ 375,000
-0.7% $ 375,000
-0.7%
Average Sales Price
$ 379,806 $ 362,161
4.9% $ 375,057
1.3%
Average Price per Sq Ft
$
9.0% $
203.02
0.4%
203.92 $
187.10
Number of Sales (Closed)
34
23
47.8%
23
47.8%
Days on Market (From List Date)
34
32
4.8%
46
-26.8%
Closed Sales
New Listings
Active Listings
QUICK HITS 3 r d Q u a r te r 2 0 1 7 SALES PRICE Median Sales Price
Months of Inventory
CLOSED SALES Total Units Sold
80
16
70
14
60
12
50
10
40
8
30
6
20
4
MARKET TIME
10
2
Days on Market
0
INVENTORY Active Listings
SUPPLY Months of Inventory
0 3Q08
3Q09
3Q10
3Q11
3Q12
3Q13
Median Sold Price
3Q14
3Q15
3Q16
D.O.M.
3Q17
Average Days on Market
0.7%
Δ Y/Y
47.8%
Δ Y/Y
10.0%
Δ Y/Y
1.0
Months
4.8%
Δ Y/Y
34
Days
Average Price per Square Foot
$400,000
$240
$350,000
$210
$300,000
$180
$250,000
$150
$200,000
$120
$150,000
$90
$100,000
$60
$50,000
$30
$0
$0 3Q08
3Q09
3Q10
3Q11
3Q12
3Q13
3Q14
3Q15
3Q16
3Q17
FALL 2 0 17
57
Downtown Orlando (32801) Single Family Homes Market Matrix
QUICK HITS 3 r d Q u a r ter 2 0 1 7 SALES PRICE Median Sales Price
CLOSED SALES Total Units Sold
INVENTORY Active Listings
SUPPLY Months of Inventory
MARKET TIME Days on Market
D.O.M. Average Days on Market
19.1%
Δ Y/Y
7.7%
Δ Y/Y
55.6%
7.0
Δ Y/Y
Months
66.8%
Δ Y/Y
32
Days
3Q-2017
3Q-2016
% Δ (YR)
% Δ (QTR)
2Q-2017
Median Sales Price
$ 405,000 $ 340,000
19.1% $ 372,500
8.7%
Average Sales Price
$ 390,417 $ 469,915
-16.9% $ 484,200
-19.4%
Average Price per Sq Ft
$
245.17 $
234.07
4.7% $
205.26
19.4%
Number of Sales (Closed)
12
13
-7.7%
9
33.3%
Days on Market (From List Date)
32
95
-66.8%
152
-79.2%
Closed Sales
New Listings
Active Listings
Months of Inventory
64
48
56
42
48
36
40
30
32
24
24
18
16
12
8
6
0
0 3Q08
3Q09
3Q10
3Q11
3Q12
3Q13
Median Sold Price
3Q14
3Q15
3Q16
3Q17
Average Price per Square Foot
$480,000
$320
$420,000
$280
$360,000
$240
$300,000
$200
$240,000
$160
$180,000
$120
$120,000
$80
$60,000
$40
$0
$0 3Q08
58
FA L L 2017
3Q09
3Q10
3Q11
3Q12
3Q13
3Q14
3Q15
3Q16
3Q17
Delaney Park, Lancaster Park, Crystal Lake, Southern Oaks (32806) Single Family Homes Market Matrix
3Q-2017
3Q-2016
% Δ (YR)
2Q-2017
% Δ (QTR)
Median Sales Price
$ 277,150 $ 248,750
11.4% $ 262,500
5.6%
Average Sales Price
$ 330,231 $ 291,019
13.5% $ 322,998
2.2%
Average Price per Sq Ft
$
12.1% $
176.06 $
Number of Sales (Closed) Days on Market (From List Date)
Closed Sales
New Listings
157.09
178.95
-1.6%
120
120
0.0%
141
-14.9%
57
42
33.9%
64
-11.8%
Active Listings
QUICK HITS 3 r d Q u a r ter 2 0 1 7 SALES PRICE Median Sales Price
Months of Inventory
CLOSED SALES Total Units Sold
320
24
280
21
240
18
200
15
160
12
120
9
80
6
MARKET TIME
40
3
Days on Market
0
INVENTORY Active Listings
SUPPLY Months of Inventory
0 3Q08
3Q09
3Q10
3Q11
3Q12
3Q13
Median Sold Price
3Q14
3Q15
3Q16
D.O.M.
3Q17
Average Days on Market
11.4%
Δ Y/Y
0.0%
Δ Y/Y
19.5%
Δ Y/Y
2.4
Months
33.9%
Δ Y/Y
57
Days
Average Price per Square Foot
$320,000
$200
$280,000
$175
$240,000
$150
$200,000
$125
$160,000
$100
$120,000
$75
$80,000
$50
$40,000
$25
$0
$0 3Q08
3Q09
3Q10
3Q11
3Q12
3Q13
3Q14
3Q15
3Q16
3Q17
FALL 2 0 17
59
Global Showcase
FIND THESE PROPERTIES AT LUXURYPORTFOLIO.COM
SANTA PONSA, SPAIN VON POLL IMMOBILIEN WEB ID: ESMB Price Available Upon Request
60
FA L L 2017
CRYSTAL BAY, NV, USA Chase International WEB ID: LQHD $75,000,000 Shari Chase
FALL 2 0 17
61
LAHAINA, HI, USA Hawaii Life Real Estate Brokers WEB ID: ZWXD $9,875,000 Anna M Severson & Jeff Onderko
SAN MIGUEL DE ALLENDE, MEXICO CDR Bienes Raices San Miguel WEB ID: LJUT $9,950,000 Ann Dolan Left
TUCSON, AZ, USA Long Realty Company WEB ID: YSLT $4,900,000 Janell Jellison and Paula Williams Right
62
FA L L 2017
D.O. NAVARRA Inmobiliaria Rimontgo MLS: RMGV2575 $17,000,000
VANCOUVER, BC, CANADA Macdonald Realty Ltd. WEB ID: AVHD $4,316,270 Will McKitka
64
FA L L 2017
THE MAYFLOWER RETIREMENT COMMUNITY
Because there’s nothing “old” about
HAVING FUN WITH YOUR BFFs
Gracious hospitality. Fine dining. Elegant amenities. And a community of friendly, fascinating people to share good times with. This is The Mayflower. And living here is like being on a permanent vacation at a luxury retirement resort – with one very big perk: the guarantee of onsite quality long-term care. Call today to learn more. And bring a friend!
1620 MAYFLOWER COURT | WINTER PARK, FL 32792 | 407.672.1620 | THEMAYFLOWER.COM
88141 PRAD HH 10/2017
fanniehillman.com