11 minute read
Chapter 2 Process Strategy and Analysis

from Operations Management Processes and Supply Chains Global 11th Edition Krajewski Solutions Manual
by evelyndu61
Discussion Questions
1. Many processes at manufacturing facilities involve customer contact. Internal customers would include those employees whose operation(s) are subsequent. Quality Control could be considered an internal customer as could design engineering or sales. Quality Control, design engineering, marketing, sales and other organizations represent the customer at various stages of any process. Customer contact can be very high, especially between production and engineering and production and quality control.
Advertisement
2. In hospitality business, like hotels, hybrid solutions are often considered the best and most appropriate, since many complaints that are not related to standard issues arise, and a specific set of competencies or training is required to address and resolve them. However, there are cases when the general situation mentioned above might not represent the optimal solution; for instance, when a hotel deals with business hospitality, and not just tourism, other solutions might prove to be more appropriate
3. eBay has considerable arrival and request variability, because its customers do not want service at the same time or at times necessarily convenient to the company. They have request variability, seeking to buy and sell an endless number of items. Their process strategy allows significant customer involvement. Their customers perform virtually all of the selling and buying processes. McDonald’s instead offers a considerable variety of foods, but from a standard menu. Staffing varies, depending on the time of day. Customization is not encouraged, and the hours during which a store is open can be controlled. Its processes have virtually no customer involvement, other than placing the order, picking up condiments or napkins, and possibly disposing of plates and containers when exiting. eBay accomodates customer-introduced variability, whereas McDonald’s reduces it.
4. Student answers will vary. One idea that they may come up with is the use of electronic files. The printing industry is undergoing a shift to pdf files. Medical imaging and electronic file sharing is on the immediate horizon. The trick would be to convince physicians that want to keep their pads and pencils, that their "blackberries" are their pads and pencils.
5. Selling financial services would involve considerable customer contact, and thus be a front office. Likely activities would be to work with the customer to undertand customer needs, make customized presentation to the customer, and maintain a continuing relationship with the customer to react to changing customer needs. Producing monthly client fund balance reports involves little customer contact, and thus be a back office. Likely activities would be to obtain data electronically, run the report using a standardized process, forward the hard copies and electtonic files to analysts, and repeat the process monthly with little variation.
6. The process of call center services is rated in the table below. The combined score is 5.6 if each is given a weight of 0.20. Arguments could be made to give more weight to a dimension such as contact intensity, although more would need to be known about the exact process. The process’s alignment on the customer-contact matrix seems to fit a front office, with more jumbled work flows and process divergence. To be properly aligned, there should be considerable resource flexibility in terms of both the employees and their equipment.
7. The answer can be debated. On one hand, relentless pressure to improve can create considerable benefits over time, and could well put a company at the top of the industry. On the other hand, small improvements do not lead to break-through solutions that might be what is needed to remain competitive, particularly in an industry marked by rapid change. However, radical change and process reengineering is strong medicine and not always needed or successful.
8. This question was inspired by a similar situation faced by Ontario Hydro-Electric. Today electricity is a commodity that competes on the basis of low-cost operations and reliability. If the environmental protection equipment is installed, HEC must either absorb the costs as a loss (immediate bankruptcy) or attempt to pass on the costs to customers and see further erosion of their market (eventual bankruptcy).
Copyright © 2016 Pearson Education Limited
HEC would probably decide to delay investment in environmental protection equipment for as long as possible. Some discussion may focus on the issue of whether customers, as users of both electricity and the environment, are better served by competition (lower cost of electricity) or by regulated monopolies (better environment).
9. For an example of a real-world application of a benchmarking exercise in a big organization, consider this case-study, with the application of benchmarking to the NHS, the UK National Health System, which can be retrieved at: http://www7.open.ac.uk/oubs/research/pdf/WP99_3.pdf a. The best practices of benchmarking; in the UK case provided in the Web site above, as in many others, include large-scale questionnaire surveys and longitudinal case studies both in other units of the same organization or in similar organizations b. Many studies show that complex approaches to benchmarking, as generally all performance improvement methods, no matter how technically powerful, are only as effective as the people who apply them and their compatibility with structure of the organization in which they are used. c. The reason why benchmarking is often more attractive than other comparable methods of performance improvement lies in the fact that it’s relatively simple to understand, focuses on setting quantitative (i.e., measureable) goals for improvement, relies on easy-to-make comparisons, generally does not involve huge investments or specialist skills, and, last but not the least, can be tailored to meet an organization’s specific needs, like in the NHS case study here presented. d. The answer is: Both. “In theory, best practice benchmarking helps organizations to improve strategically important processes. In practice the efforts are often directed towards operational easy-to-change processes; or even simply towards measuring outputs with no attempt to understand the processes which led to them.” (Holloway et al. 2000:7) e. According to this benchmarking classification developed by Camp (1995:16), this is what the categories are for:
Internal - a comparison among similar operations within one’s own organization.
Competitive - a comparison to the best of the direct competitors.
Functional - a comparison of methods to organizations with similar processes in the same function outside one’s ‘industry’.
Generic - a comparison of work processes to others who have innovative, exemplar work processes.
PROBLEMS Process Strategy Decisions
Copyright © 2016 Pearson Education Limited b. Choose the second process, because 800 exceeds the break-even volume.
3. Sebago Manufacturing a. The volume at which the second process becomes more attractive is 695 units. b. Since the production volume at which the second manufacturing process becomes more attractive is lower than the expected annual sales for the product, you should choose the second manufacturing process.
Documenting and Evaluating the Process
Copyright © 2016 Pearson Education Limited
Copyright © 2016 Pearson Education Limited
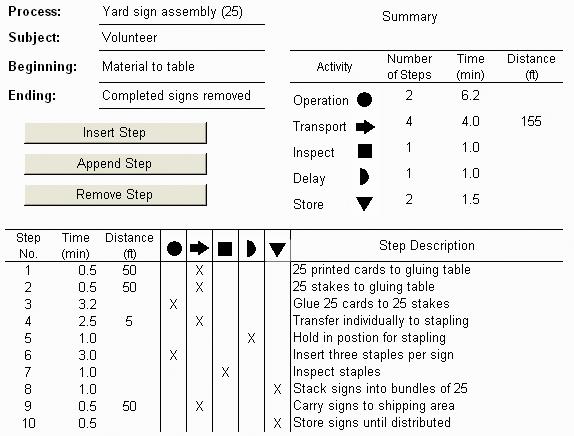
Flowchart for yard sign assembly:
Human resource requirements:
One of many possible arrangements is to create several cells with four workers in each cell.
Worker 1 is a materials handler, bringing printed cards and stakes (say in stacks or bundles of 25) to the gluing table and taking completed signs (again in bundles of 25) to the shipping area.
Worker 2 glues printed cards to the stakes. Worker 2 is also responsible for keeping the area supplied with glue, staples, pizza, and soft drinks.
Worker 3 is also a materials handler, transferring glued signs in small quantities (a transfer batch) to the stapling table.
While worker 3 holds the material in place, Worker 4 staples the card to the stake to hold it while the glue dries. Worker 4 also inspects the staples, drives loose ones home with a hammer, and stacks completed signs in bundles of 25 for Worker 1 to take away.
Accounting for interruptions, material shortages, and chaos, each cell will complete about eight signs per minute, or about two signs per worker-minute. 10,000 signs would require about 5,000 worker-minutes, or 83.33 worker-hours. In order to accomplish this work within three hours (maximum attention span of college students) 83.33/3 = 27.78 or about 28 student volunteers are required to staff 7 cells.
Material requirements (for 7 cells of 4 workers each):
10,000 printed cards
10,000 stakes
32,000 staples (16 boxes of 2,000 each)
28
12-ounce bottles of wood glue
4 cases
10 pizzas
Equipment requirements:
14 tables
7 staple guns
7 hammers (to set staples)
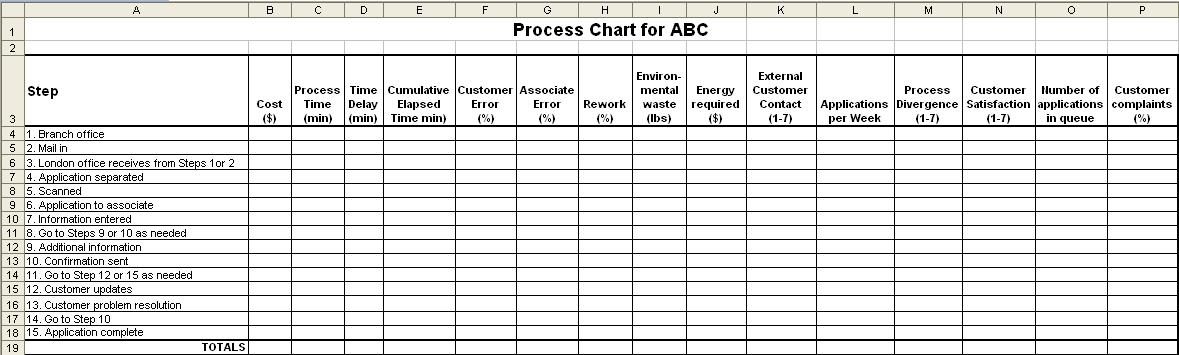
Process chart (using Process Chart Solver of OM Explorer):
Copyright © 2016 Pearson Education Limited
Copyright © 2016 Pearson Education Limited
11. Mailing to the alumni of your college a. A sample process chart for 2000 letters follows. b. Total time for 2000 letters = [(0.57 min) / 60 min per hour] x 2000 letters = 19 hours. The cost to process 2000 letters = ($8/hr)(19 hr) = $152. c. Changes that would reduce the time and cost of the process: d. Using the letter with “Dear Alumnus” may reduce the effectiveness of the project because it would be less personal. This concern goes also for the use of mailing labels. e. Although including a preaddressed envelope will increase time and cost of the process, alumni may be more likely to contribute if they have an envelope available to them.
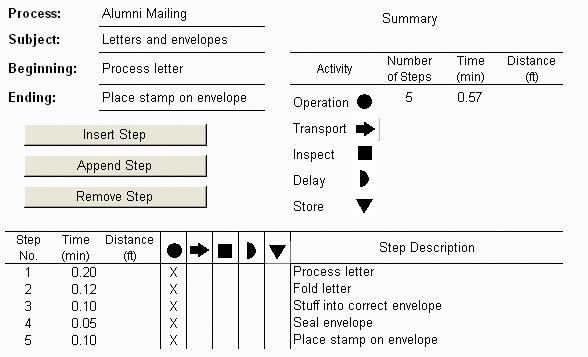
A letterhead with “Dear Alumnus” will make step 1 (process letter) not necessary, saving 400 minutes and $53.33 [$8(400/60)].
With mailing labels, step 1 involves matching the letters with labels rather than with addressed envelopes, but now we must stick the label to the envelope. We do everything we did before plus the extra step. The time would increase by 200 minutes and cost $26.66 [$8(200/60)] more.
Prestamped envelopes will eliminate step 5 and save 200 minutes and $26.67 [$8(200/60)].
If envelopes are to be stamped by a postage meter, it will take, 10 minutes [2000/200]. This results in a savings of 190 minutes and $25.33 [$8(190/60)].
Window envelopes eliminate the need to match envelopes to letters, resulting in a savings of $53.33.
12. Gasoline Stations
a. The gas station in part (b) has a more efficient flow from the perspective of the customer because traffic moves in only one direction through the system.
b. The gas station in part (a) creates the possibility for a random direction of flow, thereby causing occasional conflicts at the gas pumps.
c. At the gas station in part (b) a customer could pay from the car. However, this practice could be a source of congestion at peak periods.
13. Just Like Home Restaurant
a. The summary of the process chart should appear as follows: b. Each cycle of making a single-scoop ice cream cone takes 1.70 + 0.80 + 0.25 + 0.50 = 3.25 minutes. The total labor cost is ($10/hr)[(3.25 min/cone)/60 min](10 cones/hr)(10 hr/day)(363 day/yr) = $19,662.50. c. To make this operation more efficient, we can eliminate delay and reduce traveling by having precleaned scoops available. The improved process chart follows

Copyright © 2016 Pearson Education Limited
The cycle time is reduced to 1.65 + 0.45 + 0.25, or 2.35 minutes. The total labor cost is ($ 10/hr)[(2.35 min/cone)/60 min](10 cones/hr)(10 hr/day)(363 day/yr) = $14,217.50.
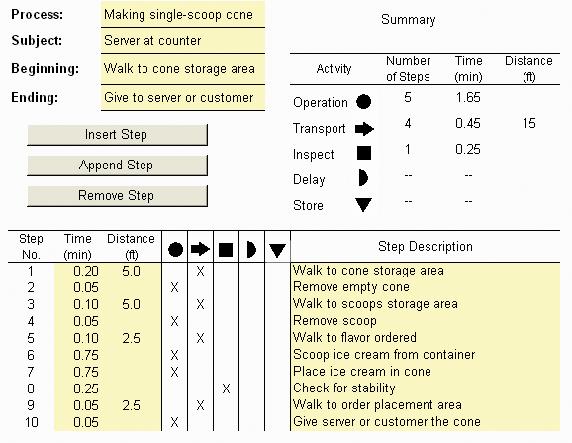
Therefore, the annual labor saving is $19,662.50 – $14,217.50 = $5,445.00.
14. Grading Homework Steps:
1. Check each paper to identify the author of the homework, then mark each paper with section number and graduate status.
2. Sort by section and graduate status.
3. Correct and grade papers.
4. Alphabetize by section.
5. Record grades.
6. Return homework to appropriate instructor.
Copyright © 2016 Pearson Education Limited
15. DMV
The process chart is as follows.
The tax assessment clerks’ time is being wasted by an inefficient waiting line process. Whenever the customer arrival rate approaches the service rate, a waiting line will form. While the clerk is waiting for phantom customers, service rate declines, and waiting lines become even longer. More disgusted customers leave the waiting area (renege).
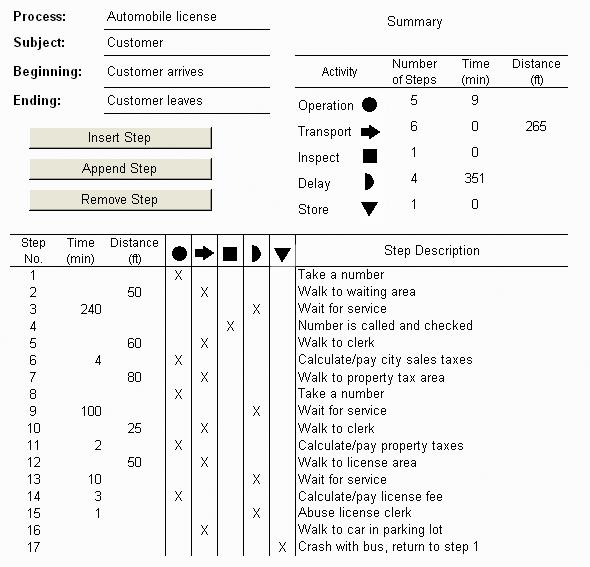
This process can be improved by arranging the waiting area to work like the “batter’s circle and batter’s box” in baseball. Customers who have reneged would be replaced before the clerks’ time is wasted. Service rates would increase and waiting lines would decrease.
Typical of many service situations, the customer’s anger is misguided. It is directed at the last person in the process (the license clerk), who has done nothing wrong. The customer pays for this misguided anger. While taking the one minute to abuse the license clerk, a bus approaches. Blinded by rage, the taxpayer drives his new car into the path of the oncoming bus, and the car is totaled. Now the customer will have to start the process again!
Copyright © 2016 Pearson Education Limited
Epilogue.
It is almost sad how little exaggeration was used in creating this problem. When this location of the DMV closed, the local news announcer referred to it as “the city’s most popular place to wait in line.” This DMV process has since been replaced by an automated one-stop, one-transaction process. Just today I visited the new DMV and completed the entire process in five minutes.
16. Oil Change a. Each oil changing cycle takes 16.5 + 5.5 + 5.0 + 0.7 + 0.3 = 28 minutes. The total labor cost is ($40/hr)[(28 min/service)/(60 min/hr)](2 services/hr 10 hrs/day 300 days/yr) = $112,000 b. ($40/hr) (2.7 minutes saved per service/60 min/hr) (2 services/hr 10 hrs/day 300 days/yr) = $10,800 saved per year
17. Time Study of Assembling Peanut Valves
The standard time is 23.35 seconds. (Response rounded to two decimal places.)
18. Time Study of Process
Total = 19.34
Standard Time = 19.34 1.20 = 23.21 minutes
19. Work Sampling on Idle Time a. Idle Time = (17+18+14+16) / (44+56+48+60) 100 = 31.25 percent b. Different root causes can be explored in an expanded work sampling study, with new categories replacing idle, such as: waiting for materials, waiting for instructions, equipment failures, breaks, or conversations with co-workers.
Working Time = 100 – 31.25 = 68.75 percent.
Copyright © 2016 Pearson Education Limited a. 13.50 hours (enter your response rounded to two decimal places.) b. 6.75 hours (enter your response rounded to two decimal places.) a. Production time on the manual line
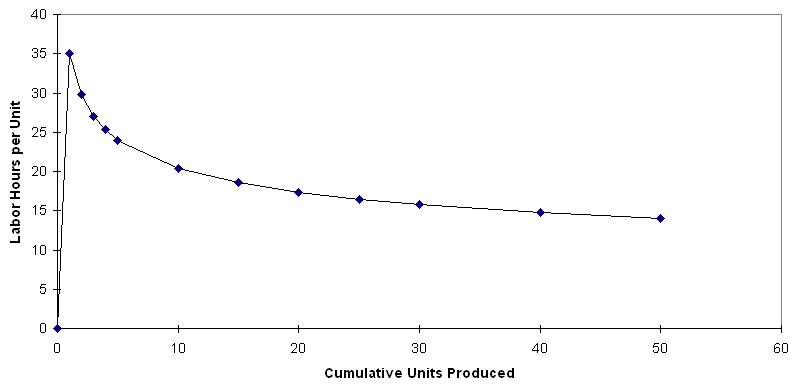
The 5th pool should take just over 24 hours, with the cumulative average time for all five pools being 28.2 hours. Total Time = (28.2)(5) = 141 hours. The learning curve follows.
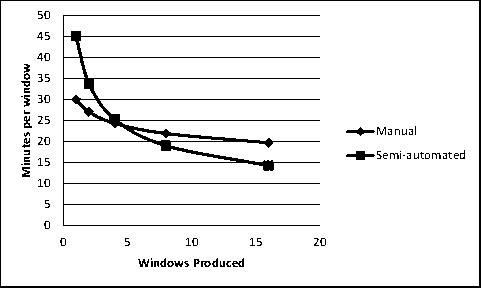
1st window = 30 minutes
2nd window = 30 x .90 = 27.00 minutes
4th window = 27 x .90 = 24.30 minutes
8th window = 24.3 x .90 = 21.87 minutes
16th window = 21.87 x .90 = 19.68 minutes b. Production time on the semi-automated line
1st window = 45 minutes
2nd window = 45 x .75 = 33.75 minutes
4th window = 33.75 x .75 = 25.31 minutes
Copyright © 2016 Pearson Education Limited
8th window = 25.31 x .75 = 18.98 minutes
16th window = 18.98 x .75 = 14.24 minutes
As displayed in the graph below, after 4 windows produced, the employee on the semi-automated line will be able to build a window more quickly than an employee on the manual line.
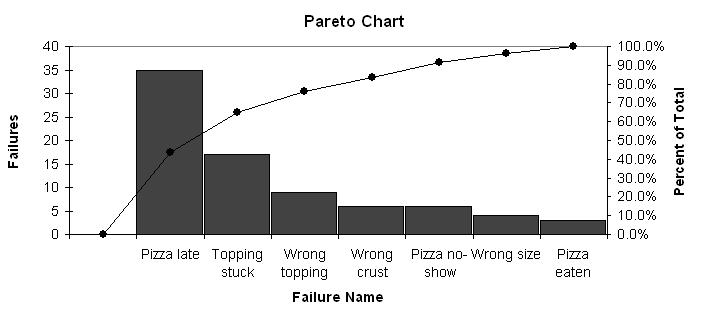
23. Perrotti’s Pizza Pareto chart a. Although the frequency of partly eaten pizza is low, it is a serious quality problem because it is deliberate rather than accidental. It is likely to cause extreme loss of goodwill. A common root cause of many of these problems could be miscommunication between the customer and the order taker, between the order taker and production and between production and distribution. This chart was created using the Bar, Pareto, and Line Charts Solver of OM Explorer.
Copyright © 2016 Pearson Education Limited b. Cause-and-effect diagram
Not familiar with service area Misunderstood address
Scheduling too many
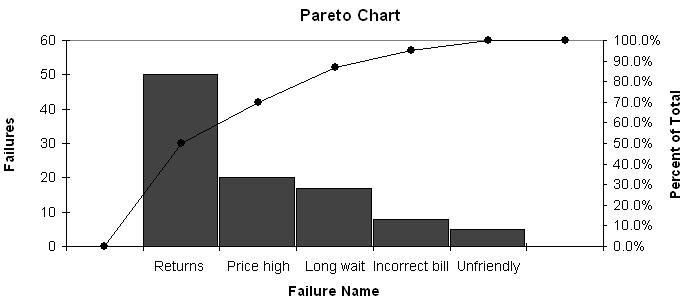
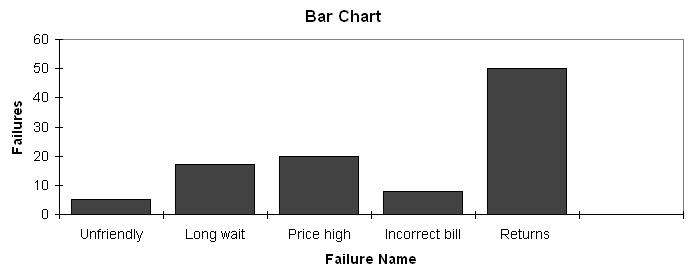
24. Smith, Schroeder, and Torn (short moves) a. The tally sheet given in the problem is essentially a horizontal bar chart. To create a Pareto diagram, the categories are arranged in order of decreasing frequency. This diagram was created using the Bar, Pareto, and Line Charts Solver of OM Explorer. b. Cause-and-effect diagram a. b. While Golden Valley’s approximate average time is only slightly more than two working days, a significant number of customers waited longer than 18 hours (39 of 99). Also, too many customers waited about three working days or more (13 of 99), which should be investigated. a. Bar chart, from the Bar, Pareto, and Line Charts Solver of OM Explorer
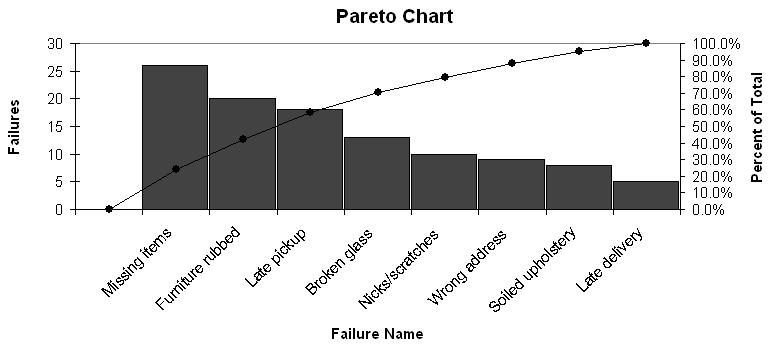

Pareto chart, from the Bar, Pareto, and Line Charts Solver of OM Explorer..
Copyright © 2016 Pearson Education Limited b. Cause-and-effect diagram drawn using PowerPoint Complaints
27. Oregon Fiber Board a. Scatter diagram (see following) b. As the production run size increases, the percent of failures decreases. Should schedule large runs when possible and determine what causes smaller runs to be problematic, e.g., changeover issues.
Copyright © 2016 Pearson Education Limited