CommitClimate carbon footprint calculator
Calculating our carbon footprint It can be difficult for individuals to understand the impact of their own choices on carbon emissions and energy efficiency. We spoke to Aiga Barisa, Kertu Lepiksaar and Alina Safronova about their work in developing tools to both help individuals and municipalities calculate their own carbon footprint, and identify ways in which it could be reduced. Around 75 percent of global energy is consumed in cities, so urban centres have a major role to play in improving energy efficiency and reducing greenhouse gas (GHG) emissions. As Manager of the EU-backed CommitClimate project, Aiga Barisa is part of a team of researchers developing online tools for both individuals and local municipalities, which will be trialled in five pilot areas across four different countries around the Baltic Sea. “We aim to develop tools so that individuals can understand how their own actions affect climate change. At the same time we are also working on tools designed to assist municipalities in reducing carbon emissions,” she outlines.
CommitClimate Simulator for Municipalities The first part of this work centres on developing the CommitClimate Simulator tailored for local authorities. “The simulator is designed to calculate an emissions baseline in a municipality, across all of the major sectors which generate GHG emissions,” continues Barisa. “This includes energy use in both public and
22
private buildings, as well as municipal infrastructure, like waste and water management. Then there is transportation and the energy sector.” A number of other sectors may contribute to overall GHG emissions in a municipality, depending on the local industry. Some municipalities may also have forested areas that can act as a carbon sink, absorbing
Barisa. “We make certain assumptions, and give users the opportunity to change different variables. We are working with municipalities around the Baltic, as well as other stakeholders. We are gathering feedback and looking to identify what they want to be included in this model.” An important consideration is the likely future population size, while some
In addition to the municipality-focused CommitClimate Simulator , the project team is developing the CommitClimate Carbon footprint calculator, designed to help individuals understand the impact of their own behaviour and personal choices. “We look at how people move around a city for example, what forms of transport do they use? How much meat do they consume and how often? Is it locallyproduced or imported? How much energy do they use at home?” says Barisa. The idea is that an individual can put in their own personal data about their habits and lifestyle, then the model will calculate their carbon footprint for a full year, which can be compared to the national average. The calculator is intended for the general public, so Barisa says it was important to ensure that it is easy to use and doesn’t require vast amounts of detailed information. “Only minimal input information is required for the carbon footprint calculator. The data from the calculator can then inform discussions on the city and regional level around climate topics,” she explains. This will ultimately help municipalities encourage citizens to shift towards more environmentally-friendly habits. While climate change and the energy transition are highly prominent topics in public debate, not everyone is aware of how they can make a difference. “Sometimes you have to remind people about some of the
seemingly minor actions they can take and the impact they can have,” outlines Kertu Lepiksaar, a researcher at Tallinn University of Technology, one of the partners in the CommitClimate project. The carbon footprint calculator allows individuals to see the impact of such changes in their daily lives, which may then lead to a sustained shift in habits. “For instance, you can see how switching to a different mode of transport or eating less meat each week could reduce your emissions. If you take the tram instead of a car, you’ll see a certain reduction in carbon emissions,” says Alina Safronova, a researcher at Riga Technical University, part of the project team. “You can also compare your footprint to the national average and explore actions you can take to reduce it.”
Sustainable energy system The goal is to eventually apply these models more widely, part of the goal of shifting towards a more sustainable energy system and reducing our dependence on finite, fossil-based resources. A deeper understanding of their own carbon footprint may encourage people to try and reduce it, yet often there are barriers that prevent them from changing their behaviour. “For example, someone in a rural area may want to take public transport but not have the option, and so are forced to rely on a car,” points out Safronova. Many factors may influence individual behaviour, such as personal values and beliefs, family circumstances and income levels, and it can be difficult to change ingrained habits, particularly when it comes
“We aim to develop tools designed to assist municipalities in reducing carbon emissions. At the same time, we are also working on tools so that individuals can understand how their own actions affect climate change.” emissions, which Barisa says is reflected in simulations. “We are also interested in the potential of some municipalities to absorb CO2 emissions,” she continues. Once a baseline has been calculated, municipalities can then apply different measures in the relevant sectors, and use the simulator to assess their likely impact on GHG emissions in future. “We use a system dynamics modelling approach, a so-called white box modelling approach, which essentially starts from a blank sheet of paper,” explains
municipalities may also want to explore the impact of new public or private buildings, or the effects of emerging transport technologies. The main priority for municipalities is typically to build a fuller picture of how changes in the transportation and energy sectors will affect emissions. “These are the two largest sectors in terms of emissions. Many municipalities want to understand what measures can be taken in these sectors and their expected effects,” says Barisa.
EU Research
Part of the CommitClimate team at the partner meeting in Tallinn.
www.euresearcher.com
23
COMMITCLIMATE
Towards energy transition and climate neutrality in the BSR municipalities
Project Objectives
CommitClimate is an Interreg Baltic Sea Region project aimed at empowering municipalities to achieve climate neutrality. It provides a user-friendly simulation tool - the CommitClimate Simulator - that enables local authorities to calculate current CO2 emissions and model future scenarios across key sectors. Additionally, a simplified version of the tool is being developed for citizens, allowing them to understand how their actions impact the municipality’s climate footprint.
Project Funding
This project is co-funded by the European Union under the Interreg Baltic Sea Region Programme.
Project Partners
There are a total of 10 project partners. Please see full information on website below.
Contact Details
Project Coordinator, Alina Safronova Riga Technical University, Institute of Energy Systems and Environment, Latvia E: alina.safronova@rtu.lv W: https://interreg-baltic.eu/project/ commitclimate/ W: www.videszinatne.rtu.lv/en W: https://br-commitclimate.rtu.lv/
Aiga Barisa, Kertu Lepiksaar and Alina Safronova (Left to Right)
Aiga Barisa is a Senior Researcher and Associate Professor at the Institute of Energy Systems and Environment, Riga Technical University. Her research focuses on sustainable transport systems, energy efficiency, and industrial symbiosis. She has contributed to projects like 4muLATe, exploring system dynamics modeling for climate-neutral transport solutions. Kertu Lepiksaar is a researcher at Tallinn University of Technology, and she graduated with her PhD studies in 2024. Her topics are mostly related to cogeneration, district heating, sector coupling, and energy efficiency. She has participated in numerous scientific projects that study the possibilities of achieving the sustainability goals in the energy sector. Alina Safronova is a PhD candidate and researcher at Riga Technical University, focusing on the transport sector and system dynamic modelling. Her work explores sustainable solutions and policy impacts within the transport sector, aiming to enhance environmental and economic efficiencies.
24
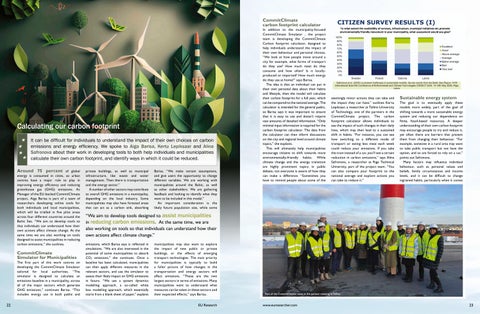
The most supported policy measures by respondents. Safronova et al. (2025) Local-level challenges in sustainable mobility: Survey results from the Baltic Sea Region. XVIII International Scientific Comference of Enfironmental and Climate Technologies CONECT 2025, 14-16th May 2025, Riga, Latvia
to transport. “The transport sector is particularly complex because decisions are often driven not only by economic factors— such as fuel costs—but also by accessibility issues and ingrained social habits, which make switching to more sustainable options difficult,” says Safronova. “To better understand these challenges, we conducted a survey to gather insights into how people view the existing infrastructure and practices related to transportation, energy use, and waste management in their municipality. We also asked participants to evaluate their municipality’s current performance and to identify which policies they would be willing to support. This feedback is crucial as it helps shape the tools we are developing, ensuring they are aligned with the needs and priorities of both individuals and municipalities.”
there is still room for improvement,” she says. “We are working to improve these modelling tools, to translate them, and to test them with our major target groups. We will summarise the feedback from the target groups, based on which we can then look to improve the tools further.” The tools could also hold relevance for private companies and other organisations keen to reduce their carbon emissions in line with legislative requirements and adapt to a new energy landscape. The tools would first need to be updated to calculate scope 3 emissions, which many companies need to consider. “Scope 3 emissions are the lifetime emissions associated with a company’s activities, not just the initial, direct emissions,” explains Barisa. This is a topic Barisa plans to explore further in future,
“A user-friendly, accessible interface is also important in terms of encouraging people and municipalities to use these tools, which is a major priority in the project.” A user-friendly, accessible interface is also important in terms of encouraging people and municipalities to use these tools, which is a major priority in the project. As a scientist, Barisa is interested in the underlying mechanisms behind the tools, but she says it’s also important to consider their appearance and aesthetic appeal. “When a municipality goes to their citizens or their stakeholders with new tools, they need something that is both visually appealing and also works effectively,” she stresses. The tools are continuously being modified on the basis of feedback from the pilot areas, and Barisa says a lot of progress has been made. “We are creating the tools, and we have reached a point where we have a pretty user-friendly interface, although
which could open up new possibilities. “We are looking into forming a new project proposal, to include scope 3 emissions, which we believe would be interesting for companies looking at how they can reduce their carbon footprint,” she outlines. Both of the tools will be made available via an interactive online platform, together with extensive training materials, aiming to help people and municipalities use them effectively. “In our training materials we explain what sectors are covered by these tools, describe the underlying assumptions and what results can be expected,” continues Barisa. “We are translating these tools into several different languages, which is often a barrier to their wider use.”
EU Research