

Vu Pro Primary Experiments

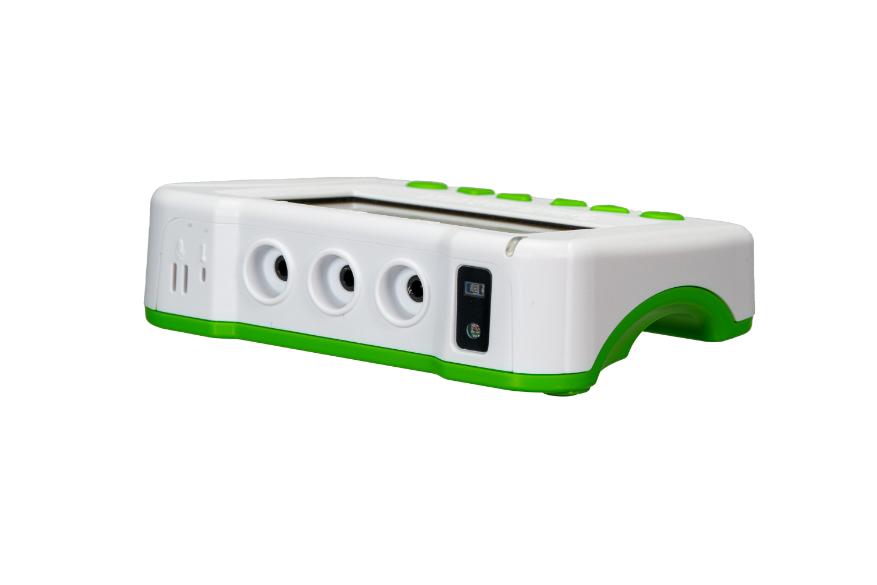
Vu Pro Overview
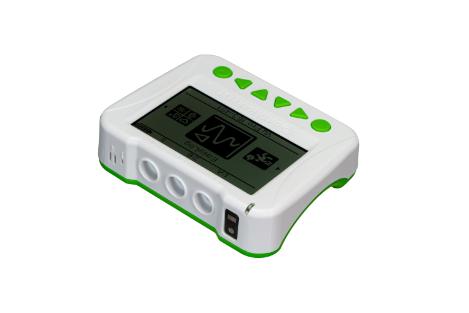
This guide is designed help enhance the teaching and learning of primary science by integrating hands-on investigations, supported by technology. Through the use of a Vu Pro data logger and a collection station, children can measure, record, and monitor changes in real time. This immediate feedback brings science to life in the classroom, encouraging exploration and inquiry.
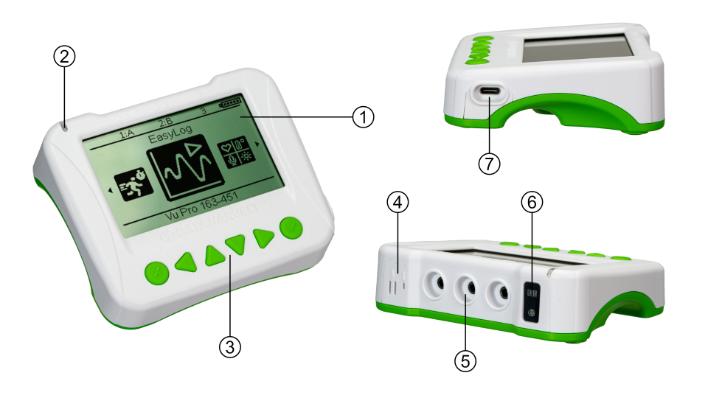
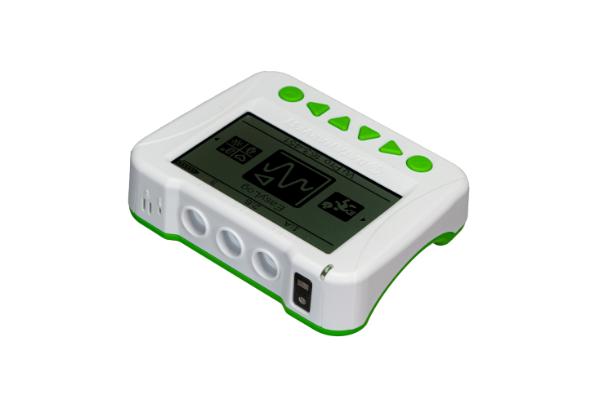
Vu Pro Layout
1. Status Indicator (see User Manual)
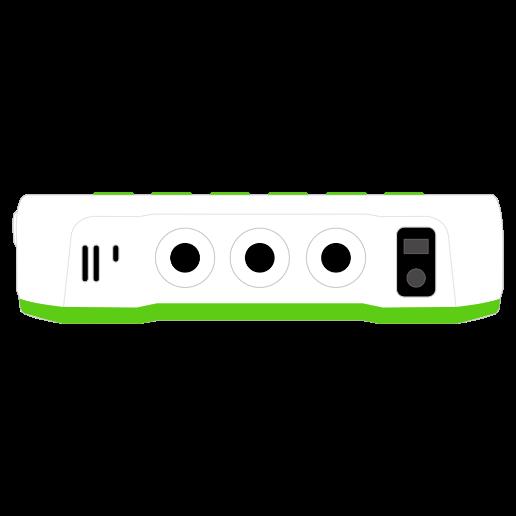
2. Sound and temperature port
3. Navigation and control buttons
4. Temperature and sound
5. External input ports
6. Heart and light monitors
7. USB “C” Port
Vu Pro Modes Of Operation
Standalone
Instructions to use Vu Pro as a “standalone instrument” to collect data is supported with symbols. The navigation, using the keypad, is indicated by a button sequence.
Vu Pro features a built-in LCD screen displaying a menu of available options.
◀ (Left) or ► (Right) scroll buttons to move the selection within a menu
Use the ▲ (Up) or ▼ (Down) scroll buttons to move the selection within a menu
Press the ✓ Enter button to select the highlighted option
Press the X or ✓ to exit a menu
Changing A Sensor’s Range
◀ (Left) or ► (Right) Select Meter from the main menu
Press the ✓ Enter button twice
Use the ▲ (Up) or ▼ (Down) scroll buttons to select the sensor
► (Right) button to select the ellipses
✓ Enter button
Use the ▲ (Up) or ▼ (Down) scroll buttons
✓ Enter button to select; Press the X to exit the menus
Vu Pro With EasySense
Instructions to use Vu Pro, as an instrument directly connected to a collection station with Easysense are also given. The EasySense steps are shown. The logger can be connected Bluetooth or USB, there is no need to activate the Bluetooth.
The activities listed can be captured using the Vu Pro and then later exported to EasySense. File > Import From Device is the option used to import and then examine data. This manual is includes the usage of EasySense (linked to Vu Pro), but some guidance is given for “standalone” work using the logger.
Running An Experiment With EasySense
1. Start EasySense on you collection station. Input the experiment type from the Home Screen.
2. Connect Vu Pro to EasySense (Devices); set up the sensors.
3. Use Setup for any adjustments you may need for the experiment (below).
3. Use the Run and Stop Buttons at the bottom of the software.
Setup Options
Continuous: Select Home (or Setup) and select Continuous. Go to Setup if you need to make later adjustments.
Timing: Select Home (or Setup) and select Timing. Go the Setup, use the timing parameters detailed in this workbook.
Snapshot: Snapshot lets you take readings when you wish to: for example at a location, or after you have made a change. To use Snapshot, select it from the Home Screen (or Setup) or then Snapshot from Setup.
Changing A Sensor’s Range In EasySense
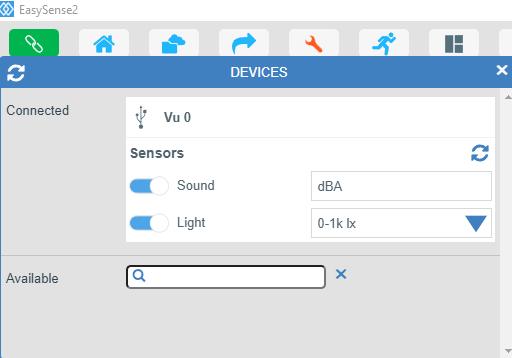
Some sensors have more than one range. The range can be altered either with the Vu Pro data logger, or in Devices, at the top left of Easysense.
Once Devices has been selected a list of connected sensors will appear. A blue bar will indicate an “active sensor”, if you wish to disable a sensor click that bar.
If a sensor has a range, a small blue downward pointing arrow will show at the for right of that sensor’s information. Select the arrow to show alternative ranges.
In the example shown, we have a Vu Pro connected by USB. Sound and Light are active, and the Light has alternative ranges to the 0-1 klx range currently in use.
EasySense’s Display
EasySense offers several different ways of capturing and displaying data.
Use the Settings and select “Basic” to access the features used in this document.
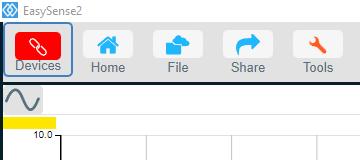
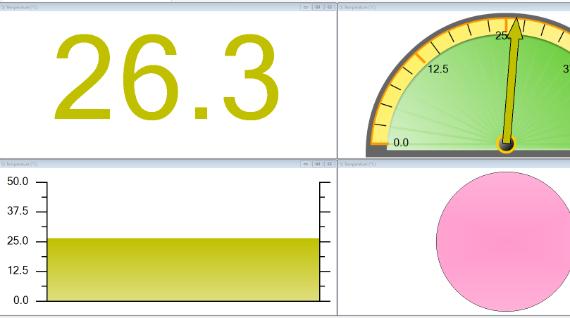
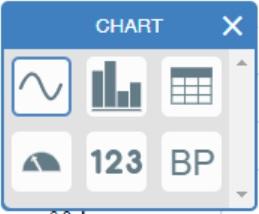
Data can be shown in many formats. To change the display format, click on the icon at the top left of the graphing area. By default the icon will show a “sine wave”. Click on the icon to show the following options:
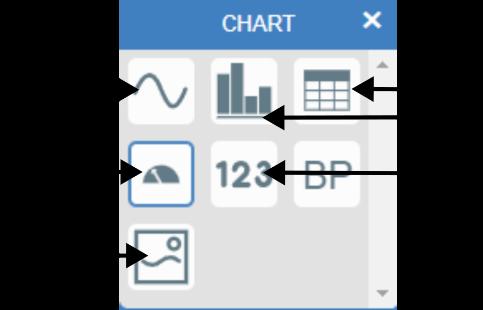
1. Line: Records continuously from when the Start button is clicked, until the Stop button is pressed. The software defaults to 20 samples every second (50 ms). This is the simplest graph to use. You can modify the data collection via Setup in the lower left of the Easysense screen.
2. Meters/Gauge: Shows the values from the sensor as a gauge with a pointer indicating the value.
3. Pictogram: Data from the sensor is presented as images (pictograms) or blocks on a simple scale. This feature is ideal for early years using loggers and to introduce number, quantity and representing numbers. It is available as a selection specifically using the Vu Pro logger.
4. Table: Shows the values from the sensor(s) as a table of results.
5. Barchart: Values from the sensor are shown as bars, the height of the bar indicates the size of the value.
6. Numeric: Shows the values from the sensor(s) as a digital numeric display. If you select Layout, you create more than one chart (up to 4).
Layout
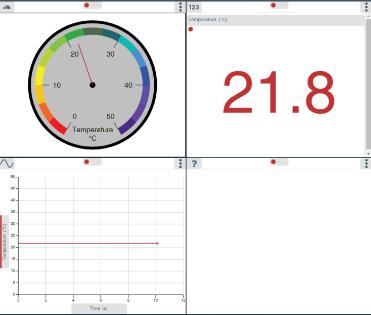
Each chart can be set to show data in a different format (e.g. A barchart next to a line graph, or a gauge next to a line graph).
SOUND
How Noisy?
Introduction
How Quiet? (Teacher’s page)
This activity explores how a Sound Sensor responds to noise, and introduces the screen displays (Meters) and by using EasySense. Each display has a part to play in showing whether there is more or less noise. You cannot go wrong!
Learning Objectives
That the sensor responds quickly to changes in sound.
That the sensor can detect sound coming from different directions and distances.
That the sensor responds to a level of sound and gives a reading.
That there is a measurable difference between loud and quiet sounds.
Resources
Vu Pro data logger
EasySense software
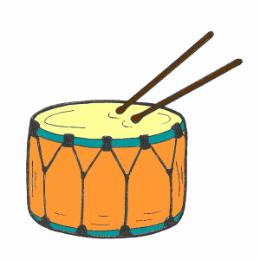
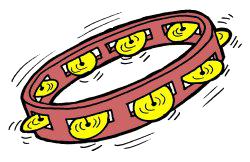
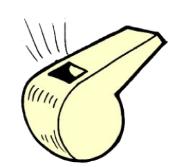
A variety of noise making equipment e.g. clapping hands, voices, shouts, whistle, clicking fingers or percussion instruments
Muffles e.g. fabric to deaden or muffle the sound
Classroom Organisation
A whole class activity, including a teacher demonstration and discussion followed by the work.
Links to Other Subjects
Design and make a range of percussion instruments to enliven a story or poem.
Sound Sensor
How Noisy? How Quiet?
Getting Started
With Vu Pro
Use ◀ (Left) or ► (Right), select Meter
Press the ✓ Enter button
The display will show “live values” from the Sound Sensor or with Vu Pro and EasySense
Open EasySense, Select Meters from the Home Screen
Connect the Vu Pro (Devices) and make sure Sound is selected
Press the Start button (at the bottom)
Activity
1. Make a noise!
2. Try the different sound making objects.
3. Watch the changes in the different display screens.
Questions
What happens when there is a loud noise?
What happens to the values when you make different sounds?
What happens to the dial when you make different sounds?
Does the collection station “remember” which the loudest sound was, or which the quietest sound was?
Which display shows the changes the best?
What difference does distance make to the sound level?
Does the Sound Sensor display a reading if you make a noise behind it?
If you cover the sensor in fabric, does it make any difference, and if so by how much?
How Near? How Far? (Teacher’s page)
Introduction
This activity uses Snapshot with the Vu Pro, or EasySense’s Snapshot mode to record individual measurements in a table so that comparisons can be made. Use the Vu Pro data logger with only the Sound Sensor on.
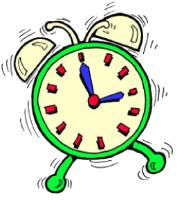
Special note: Thesuccessofthisactivitydependsonalowlevelofbackgroundnoise. Thesoundsensorwillnotdifferentiatebetweennoisemadebytrafficorbyanalarm clock.
Learning Objectives
That when sound travels away from a source, it gets fainter as the distance increases.
That patterns or trends can be observed in collected data.
The importance of checking data for inaccuracies.
That sounds travel through solids, air (and water)*.
That sounds are made when objects vibrate.
Resources
Vu Pro’s built-in Sound Sensor
EasySense software
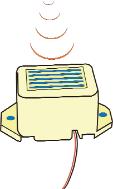
Alarm clock or electric buzzer (a constant noise)
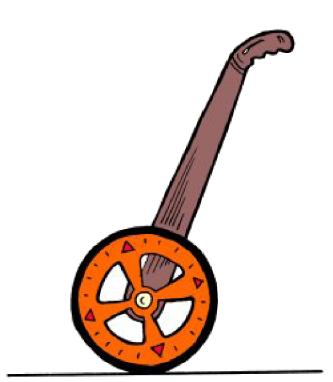
Trundle wheel
Classroom Organisation
A whole class introduction and discussion, followed by group activity.
The distance between each reading depends on how much space there is, Try: 1, 2, 3, 4, 5, 6, 7, 8 metres, Or: 2, 4, 6, 8, 10, 12 metres etc.
This activity could be done in a quiet playground (no traffic or aircraft noise), remote from the collection station using the Snapshot feature on the Vu Pro data logger or EasySense software.
Links With Other Subjects
As an extension activity, pupils could evaluate a range of noisemakers and use the results of their experiments to produce something that would make an effective alarm. The Sound Sensor could then be used to test which noisemakers were the most effective over a given distance.
*Note: PleasedonotputtheVuProdataloggerinwatertocheckifsoundtravels throughwater!VuProisnotwaterproof.Itisnotintendedthatsoundtravellingthrough waterbeinvestigatedinthisactivity.
Sound sensor
How Near? How Far?
Getting Started
From the Vu Pro data logger:
On Vu Pro ◀ (Left) or ► (Right), select Meter
Press the ✓ Enter button to gather data when you are ready
When finished, use EasySense to File > Import From Device
Or with Vu Pro and EasySense
Start EasySense
Select Snapshot from the Home Screen (or Setup)
From Devices, make sure that sound is selected
Press Start when ready and follow the prompt
Activity
1. Set up your distance markers.
2. Place Vu Pro in a fixed position and select a noisemaker.
3. Move the noise maker to the first distance marker.
4. Click on Start to begin (if using EasySense), or record the first value (✓ above with just the Vu Pro).
5. Move the noise maker to the second distance marker, and record a value.
6. Repeat until you have a Snapshot measurement for the noise maker at each distance marker.
7. When you have finished press Stop with EasySense (or X if just using the Vu Pro).
Questions
Does distance make a difference to the sound levels?
Is there a trend in your results - is the noise less and less as the distance increases?
Was there any background noise e.g. traffic?
Did background noise affect your measurements? How can you tell?
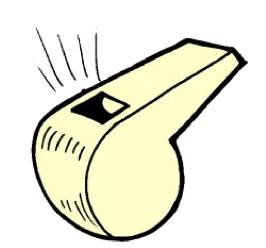
Do some sounds carry better than others do? Try a whistle or a radio!
Try putting a card cone around Vu Pro to create a big ‘ear’ and repeat the investigation. Are the results different, if so can you explain why?
Be Quiet! (Teacher’s page)
Introduction
This activity uses Vu Pro or EasySense’s Snapshot to record individual measurements into a table so that comparisons can be made. Use the Vu Pro data logger with only the Sound Sensor on.
Learning objectives
That sound travels through some materials better than others. That some materials are effective in preventing vibrations from sound sources reaching the ear/sensor.
That some materials are better sound insulators than others. That comparisons can be made between measurements.
Resources
Vu Pro logger’s built-in Sound Sensor
EasySense software
Sound makers e.g. alarm clock, electric bell or buzzer
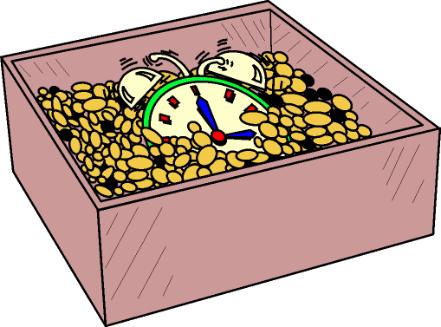
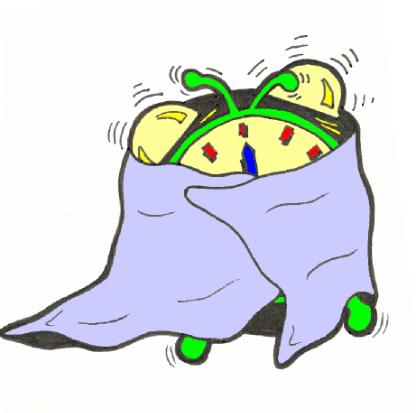
A box and a selection of materials for testing sound insulation e.g. cotton wool, fabric, polystyrene chips, pebbles, shredded paper
Classroom Organisation
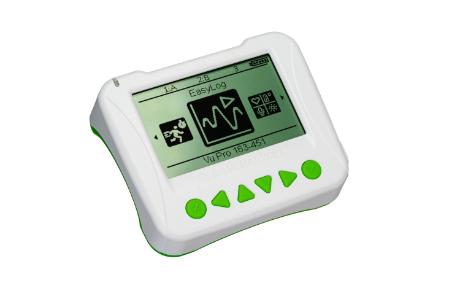
Sound Sensor pointing toward the sound source
Whole class discussion, with pupils offering ideas for a “fair test”.
Links To Other Subjects
Pupils could use the results of their investigation to produce effective ear muffs.
Be Quiet! Getting Started
Using the Vu Pro data logger:
On Vu Pro ◀ (Left) or ► (Right), Select SnapShot
Press the ✓ Enter button)
Press the ✓ Enter button to gather data when ready.
When finished, use EasySense to File > Import From Device
Or With Vu Pro and EasySense
Start EasySense
Select Snapshot from the Home Screen or from Setup
From Devices, make sure that sound is selected
Press Start when ready and use the prompt (as below)
Predict which material will be best at muffling the sound, and which will be the worst!
Activity
1. Set up a fair test: Click on the Start icon to begin with Easysense (or ✓ with Vu Pro) and take a reading of the sound without any insulation as the “control” measurement.
2. Place one of the insulating materials around the ‘noise’ and record the sound level.
3. Record the type of material used (there is a comments table in EasySense if you chose the Table from the Graph options).
6. Repeat using all the types of insulation material provided.
7. When you have finished testing click on Stop in EasySense or X with the Vu Pro Logger if it is used alone.
Questions
Was your prediction correct for the best material?
And worst insulators, how did they score?
Which material was best at muffling sound?
Which material was worst at muffling sound? Why do you think it did not work very well as a sound insulator?
Silence Is Golden! (Teacher’s page)
Introduction
The following are a series of suggested investigations in the classroom, that use the EasyLog remote function of the Vu Pro data logger. The data is retrieved using EasySense. Use the Vu Pro data logger with only the internal Sound Sensor on.
Resources
The Vu Pro data logger’s built-in Sound Sensor EasySense software
1. To retrieve the data, connect Vu Pro to the collection station. Open the EasySense program, and Select File > Import from Device.
2. Select your data set and click on Remote, Retrieve. Make sure a tick is only present next to the sound sensor, click OK.
Investigate
Is our classroom ever silent?
When are we noisiest in the classroom?
When are we quietest in the classroom?
Are we noisy and quiet at the same times every day?
Classroom Organisation
Whole class introduction followed by group work and feedback session.
Extension Activities
Which class sings the loudest?
An activity for the Hall.

Assuming there is more than one sitting at lunchtime, who makes the most noise in the dining hall?
If you have recorded data during the day, ask the pupils to predict what the graph will look like for the night.
Suggestion
This is a good exercise to do if your classroom is to be used for a parent’s meeting, or other out of lesson time activity, but the pupils do not know. They can then guess what happened from the graph.
Silence Is Golden!
Getting Started
Set up the Vu Pro data logger in a position where it will not be disturbed.
Vu Pro EasyLog ◀ (Left) or ► (Right), select EasyLog
Press the ✓ Enter button
Press the ✓ Enter button to gather data
Press the X and ✓ to exit
When finished, use EasySense to File > Import From Device
Activity
Start and Stop the recording as shown above.

Hint -Inordertocompareoneday’sresultswithanother, remembertostartasecondrecordingatthesametimeasthefirstone.
Questions

From your graph have you found out what you wanted to know?
Is the school ever silent?
When are we noisiest?
Are we noisy at the same time every day? If we are, what are we doing at that time?
When are we quietest?
What were we doing when we were quiet?
What have you found out from the graph?
How Bright? How Dark? (Teacher’s
page)
Introduction
This activity explores how a Light Sensor responds to changes and introduces the different screen displays available in Meter. Each display shows, in a different way, whether there is more or less light.
Learning Objectives
That light levels can be measured.
That the sensor responds quickly to changes in light.
The sensor can detect light coming from different directions.
That the sensor responds to changes in light and gives a reading.
Resources
Vu Pro data loggers’ built in Light Sensor – range indoor 0 – 1000 lux.
EasySense software.
Any of the following: A bright light source e.g. window, torch, or electric light.
Items to cover the sensor e.g. hands, a variety of fabric, colour paddles.
Classroom Organisation
Whole class activity including teacher demonstration and discussion.
Light Sensor
How Bright? How Dark?
Getting Started
With the Vu Pro data logger
Vu Pro ◀ (Left) or ► (Right), Select Meter
Press the ✓ Enter button
Press the X to exit when you have finished.
Or With Vu Pro and EasySense
Start EasySense
Select Continuous from the Home Screen or Setup
From Devices, make sure that Sound is selected
Select the Meter Icon from the Chart Options
Press Start to begin recording
Activity
1. Place Vu Pro so that the Light Sensor points towards the brightest light.
2. Place the sensor so that it points towards the dark.
3. Try covering the sensor with your hands while it is pointing towards the light.
4. Try covering the sensor with different materials.
5. Watch the changes in the different display screens.
Questions
What happens to the when the sensor is pointed towards bright light?
What happens to the gauge when you move the sensor from light to dark or from dark to light?
What happens to the Dial when you cover the sensor with your hands, and then uncover them?
Does the collection station “remember” when the sensor was in the brightest place, and in the darkest place?
Which display shows the results best?
Where is it brightest?
Where is it darkest?
Does covering the sensor make a difference, and how much?
Curtains! (Teacher’s page)
Introduction
This activity uses EasySense’s Snapshot mode to record individual measurements into a table.
The table is used to store results so that comparisons can be made when investigating the properties of materials. Make sure only the Light Sensor is on!
Learning Objectives
That light can pass through some materials, but is blocked by others.
Measurements can be stored in a table.
That results can be displayed as a bar graph for easy comparison.
That fair testing is important in order to get accurate results.
Resources
Use the Vu Pro data logger’s built-in Light Sensor set to the 0 – 1000 lux indoor range
EasySense software
A variety of fabrics for curtains
A variety of materials which could be used to make window blinds
Light source e.g. torch
Classroom Organisation
Group activity including teacher demonstration of the Snapshot facility.
Links With Other Subjects
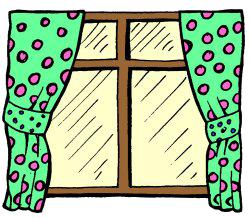
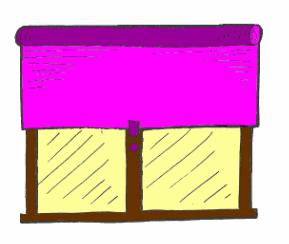
This activity could be set in the context of an activity to evaluate the range of materials used for curtains and blinds.
Curtains!
Getting Started
With the Vu Pro data logger
Vu Pro ◀ (Left) or ► (Right), Select Snapshot
Press the ✓ Enter button
Press the ✓ Enter button to collect data
Press the X and the ✓ to exit
When finished, use EasySense to File > Import From Device
Or With Vu Pro and EasySense
Start EasySense
Select Snapshot from the Home Screen or Setup
From Devices, make sure that Light Sensor is selected
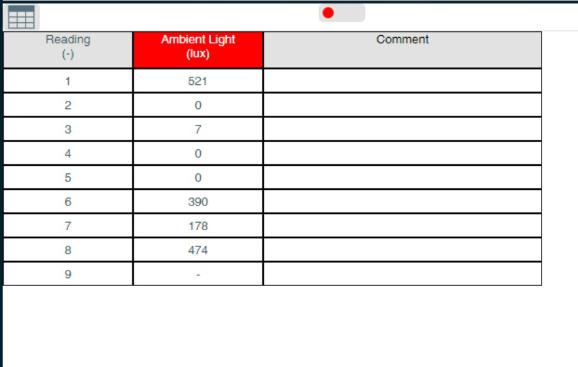
Select a Table from the Chart Options
Press Start to begin recording
Activity
1. Set up a fair test for the fabrics and the other materials.
2. Click Start in EasySense (or ✓ for just the logger) to begin.
3. Collect the Snapshot measurement.
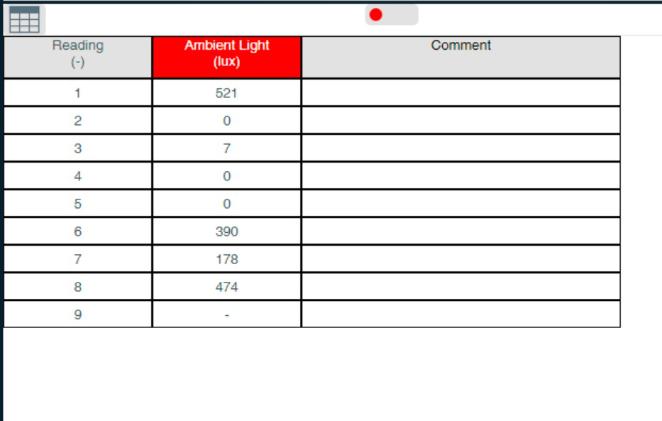
4. Click in the comment column in the table and type in a description of the fabric being tested.
5. Take a Snapshot measurement of each sample.
6. When you have finished testing click on Stop or exit from the logger.
7. Use Values to find the difference between one sample and another.
Questions
Which is the best material for blocking out light?
Which fabric blocks out most light?
Which combination of fabric blocks out the most light?
Sunglasses (Teacher’s page)
Introduction
This activity uses EasySense’s Snapshot feature to record individual measurements (data) into a table. The table is used to store results, so that comparisons can be made when investigating the properties of materials with light. Make sure that only the Light Sensor is on.
Learning Objectives
That sunglasses block some light.
Translucent materials block some light, but let some light through.
Opaque materials do not let light through.
Transparent materials let a lot of light through.
Different coloured cellophane allows different amounts of light through.
A combination of coloured materials affects the amount of light passing through.
IT equipment can be used to check the accuracy of predictions.
Resources
Use the Vu Pro data logger’s built-in Light sensor – set to the 0 – 1000 lux indoor range.
EasySense software.
A collection of sunglasses including photo-chromatic lenses.
Colour paddles or coloured cellophane.
A light source e.g. torch.
Classroom Organisation
Group activity following whole class discussion.
Links With Other Subjects
Using the results of the investigation, pupils can design and make a pair of cosmetic sunglasses.
Sunglasses
Getting Started
With the Vu Pro data logger
Vu Pro ◀ (Left) or ► (Right), Select Snapshot
Press the ✓ Enter button)
Press the ✓ Enter button to collect data
Press the X and the ✓ to exit
When finished, use EasySense to File > Import From Device
Or With Vu Pro and EasySense
Start EasySense
Select Snapshot from the Home Screen or Setup
From Devices, make sure that Light is selected
Select a Table from the Chart Options
Press Start to begin recording
Activity
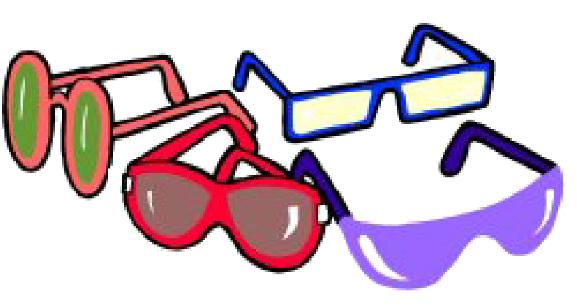
1. Before you start, make a prediction as to which of the sunglasses you think will block out the most light.
2. Set up a “fair test” for the sunglasses.
3. Click Start to begin (or ✓ using Vu Pro) .
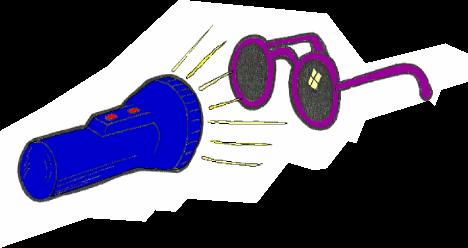
4. Click in the comment column of the table and type in a name for the sunglasses you have tested (using EasySense).
6. Take a Snapshot measurement for each sample.
7. When you have finished testing click on Stop (or do this on the logger as above).
8. Use Values to find out the difference between one sample and another.
Questions
Was your prediction correct? Which sunglasses let the most light through?
Are different sunglasses better for different activities e.g. sunbathing, walking, and driving? Which colour lets most light in?
Which colour blocks most light out?
Reflections (Teacher’s page)
Introduction
This activity uses EasySense’s Snapshot mode to record individual measurements to a table.
The table is used to store results so that comparisons can be made when investigating the properties of materials. Use the Vu Pro data logger with only the Light Sensor is turned on.
Learning Objectives
That light can be reflected from the surface of different materials
Shiny surfaces reflect light better than dull surfaces
Data can be displayed as a table and presented as a bar graph
Resources
The Vu Pro’s built-in Light sensor set to the 0 – 1000 lux “indoor range”.
EasySense software.
Collection of materials including both matt and shiny surfaces e.g. foil (both sides), mirror, coloured fabric and fluorescent material.
Make sure you have a matt and shiny version of one colour e.g. red foil and red paper.
Classroom Organisation
Whole class discussion followed by group activity.
Links With Other Subjects
Pupils could use the results of their investigation as part of an activity to produce something reflective that would enable them to be seen at night.
Getting Started
With the Vu Pro data logger
Vu Pro ◀ (Left) or ► (Right), Select Snapshot
Press the ✓ Enter button
Press the ✓ Enter button to collect data
Press the X and the ✓ to exit
When finished, use EasySense to File > Import From Device
Or with Vu Pro and EasySense
Start EasySense
Select Snapshot from the Home Screen or Setup
From Devices, make sure that Light Sensor is selected
Select a Table from the Chart Options
Press Start to begin recording
Activity
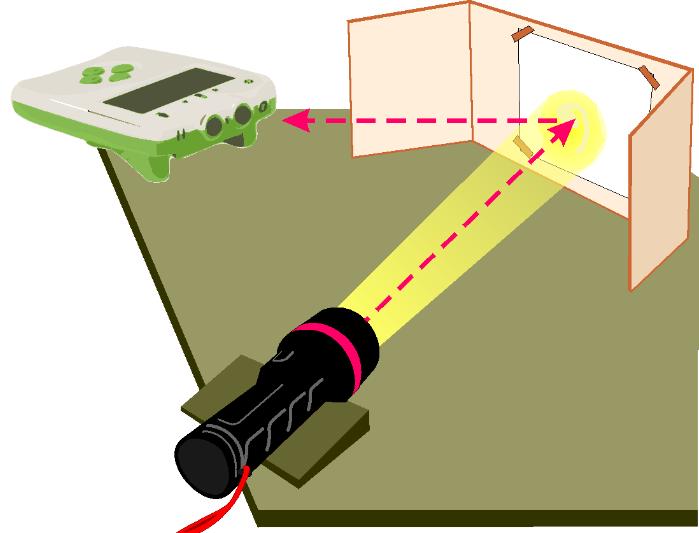
1. Set up a “fair test” - to measure the light reflected from each sample.
2. Before you begin, make a prediction. Which of the materials to be tested do you think will reflect the most light?
3. Click Start to begin with EasySense (or ✓ if using the Vu pro logger alone).
4. Click in the comment column (EasySense) of the table and type in a name for the material you are testing e.g. white fabric, foil, yellow paper.
6. Take a Snapshot measurement of each sample.
7. When you have finished testing click on Stop.
8. Find out the difference between one sample and another.
Questions
Was your prediction correct?
Which surface reflected most light?
Which colour reflected most light?
Which red surface reflected most light, the paper or the foil?
Is a material that reflects light well, good to wear in the dark? Why?
What Happens Next? (Teacher’s
page)
Introduction
This activity uses EasySense’s Graph functionality. Have the Vu Pro data logger’s Light Sensor only turned on for this activity.
Learning Objectives
That a line graph is a series of measurements taken (over a period of time).
Predictions can be drawn from that graph.
Those predictions can be annotated and compared with subsequent or previous recordings.
How to ‘tell the story’ of events is displayed in the form of a line graph.
Different materials can block different amounts of light.
Resources
The Vu Pro data loggers’ built-in Light sensor – set to the 0 – 1 klux “indoor range”.
EasySense software.
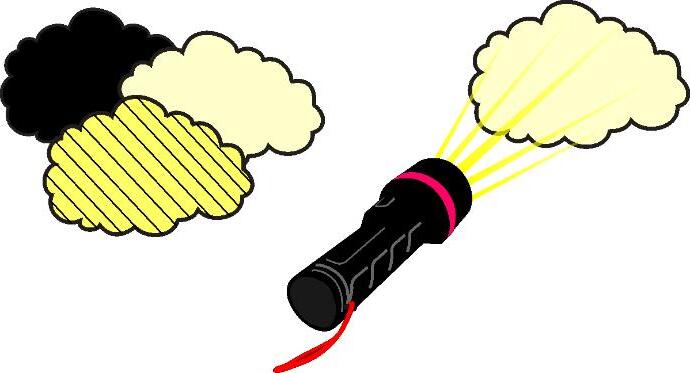
Several types of material, all the same shape and size, e.g. cloud shapes, one in lightcoloured tissue or transparent material, one in dark-coloured tissue or one in lightcoloured paper and one in dark-coloured paper, etc.
Light source - e.g. a torch.
Classroom Organisation
Whole class activity with pupil participation.
This activity works well with a data projector or interactive whiteboard.
What Happens Next?
Getting Started
With Vu Pro and EasySense
Start EasySense
Select Graph from the Home Screen or Setup (Continuous)
From Devices, make sure that Light is selected
Select a Graph from the Chart Options (to left of graphing area
Press Start to begin recording
Activity 1
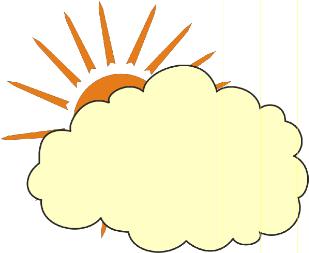
1. Set up so that a light source, e.g. torch, shines on the built-in Light Sensor.
2. Click on the Start to begin logging.
3. Pass the light coloured cloud shape slowly in front of the light source.
4. Use Values (EasySense) to find the light level while the cloud was in front of the sensor.
Questions
How much light was blocked by the light coloured cloud?
Activity 2
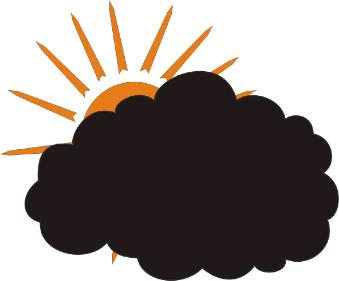
1. Select the predict feature by clicking with your right hand mouse button in the graph area. Draw what you think the graph will look like when the dark cloud shape is passed in front of the sensor.
2. Click the Start icon to begin logging.
3. Pass the dark cloud shape in front of the light source.
4. Press Stop when you have finished.
Questions
How close was your prediction to the real reading?
How much light was blocked by the dark cloud?
How Long Will The Light Last? (Teacher’s page)
Introduction
This activity uses the EasyLog function of the Vu Pro data logger or Graph (Continuous) in EasySense. Data is collected by Vu Pro whilst detached from the collection station (remote data logging). When the activity is completed, the data is retrieved using EasySense File > Import From Device. Use the Vu Pro with only the internal Light sensor on.
Learning Objectives
Different types of batteries have different lifetimes
That the energy from a battery is reduced when it is in use
You don’t have to be there to know what happens!
Resources
The Vu Pro data logger’s built-in Light Sensor – set to the 0–1k lux indoor range
EasySense software
Different makes and types of battery, all of one size e.g.
1.5 V Ever ReadyTM blue AA, 1.5 V DuracellTM AA
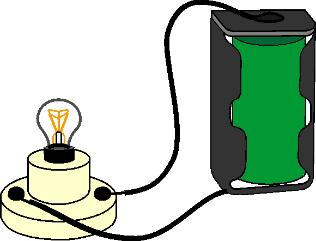
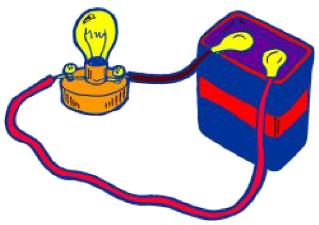
1.5 V bulb and bulb holder, battery holder and connectors or torch
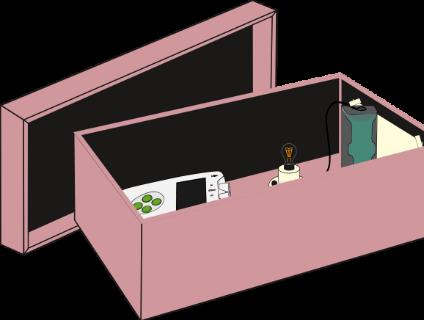
Shoe box lined with black paper (see diagram)
To Retrieve The Remote Data
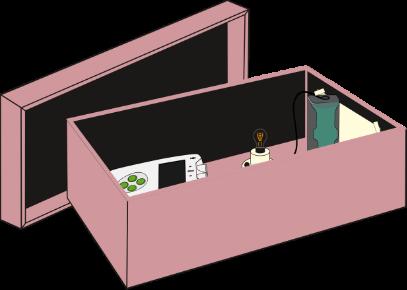
VuProloggerwith lightsensorfacing thelightbulb
1. Connect the Vu Pro data logger to the collection station.
2. Open the EasySense program, Use File > Import From Device.
Suggestion
Check the torch daily as some batteries may last nearly a week!
Classroom Organisation
Whole class activity followed by group work and feedback session.
Links To Other Subjects
This could form part of an activity to evaluate
Products and calculate value for money.
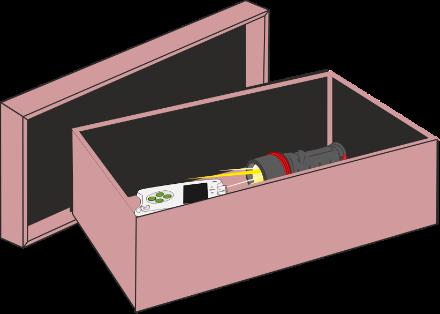
VuProwithlightsensor facingthetorch
How Long Will The Light Last?
Activity
1. Place the torch or light bulb circuit in the box. Ensure that the light is switched on.
2. Position the Vu Pro so its Light Sensor points towards the light source.
3. Select EasyLog from the Vu Pro logger’s screen:
◀ (Left) or ► (Right) to EasyLog, Press the ✓ Enter button
Press the ✓ Enter button to collect data
4. Put a tight cover or lid on the box.
5. Make a note of how long you think the light will last.
6. Check at the end of each day to see if the light bulb or torch is still alight. When it is no longer lit
Press the X and the ✓ to exit.
7. Change the batteries and set up the investigation again.
8. When both sets of data have been collected connect the Vu Pro to the collection station and start the EasySense program.
9. Open the EasySense app, and use File > Import From Device
10. Repeat for the second set of data.
Questions
Which set of batteries lasted longer?
How long did the standard batteries last?
How long did the alkaline batteries last?
Did anyone lift the lid to check the light during the recording? If so, how can you tell?
Light And Distance (Teacher’s page)
Introduction
This activity uses the Vu Pro’s and EasySense’s SnapShot functionality. Have the Vu Pro data logger’s Light Sensor only turned on for this activity.
Learning Objectives
What we are going to do is teach a little about how data can vary with a variable, and how those changes can be represented. It is also a very early start to the idea of the inverse square law (without the maths!).
So a very simple question would be: if all stars start at the same intensity, then are the dimmer ones further away?
Additionally, we can use this practical to show:
That data is a series of measurements taken (over a distance).
Predictions can be drawn from a trend.
Those predictions can be annotated and compared with subsequent or previous recordings.
How to ‘tell the story’ of events is displayed in the form of a graph.
Resources
The Vu Pro data loggers’ built-in Light Sensor – set to the 0 -1 klx “indoor range”.
EasySense software.
Light source - e.g. torch. Make sure the beam is divergent!
A method of controlling the light to get it into range for the Vu Pro (possibly mounted on the front of the torch).

Light And Distance
Activity
1. Place the Vu Pro a known distance away from the light source. Ensure the light is switched on, and measure the distance.
2. Use ◀ (Left) or ► (Right) select EasyLog, then press the ✓ Enter button
Press the ✓ Enter button to collect data.
4. Move the Vu Pro further away from the light source.
Press the ✓ Enter button to collect data.
5. Keep repeating the measurements.
6. Check at the end of each day to see if the light bulb or torch is still alight. When it is no longer lit
Press the X and the ✓ to exit.

7. When the data has been collected, connect the Vu Pro to the collection station and start EasySense. Use File > Import From Device.
Nb: You can also do it this way:
A. Start EasySense.
B. At the Home Screen, select SnapShot.
C. Connect the Vu Pro using Devices.
D. Press Run and collect the data.
Questions
What happened when to the light as the distance increases?
Can you explain the first question?
If you have a data trend, can that be used to predict what the light value is at any distance?
How Warm? How Cold? (Teacher’s page)
Introduction
This activity explores how the Temperature Sensor responds to changes and also introduces the screen displays in Meters. Each display has a part to play in showing changes in temperature.
Learning Objectives
That the sensor responds to changes in temperature and gives a reading. The response to changes in temperature is less immediate than changes in light or sound.
Temperature levels can be measured.
Temperature measurements are calibrated in degrees Celsius.
The Temperature Sensor can be dipped into liquid.
The tip of the Temperature Sensor is the most sensitive part.
That temperature is a measure of how hot or how cold a material is.
Resources
Vu Pro data logger and one plug-in Temperature Sensor
EasySense software
Mugs or paint pots (must be stable, or suitably supported)
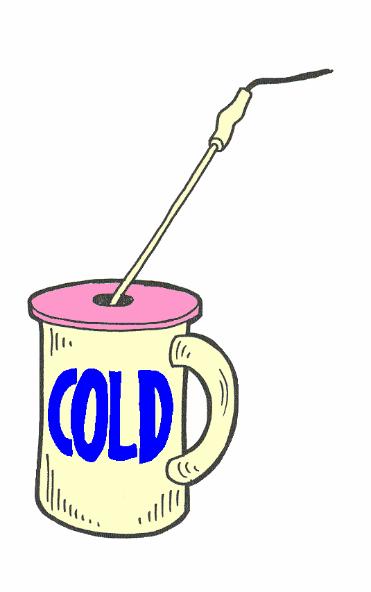
Hot water (be safe, not too hot!)
Cold water
Suggestions

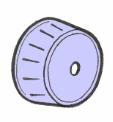
Use a circle of card or a card wheel to support the Temperature Sensor when in a mug or jar of water to avoid tipping.
Classroom Organisation
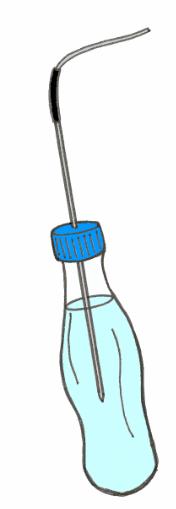

Use a soft drinks plastic bottle with a hole drilled in the plastic top and hot (60°C), NOT boiling water.
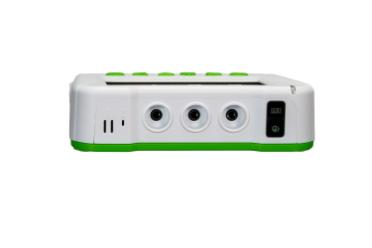
Connect the Temperature Sensor to input A.
Whole class activity including teacher demonstration followed by group work and discussion.
How Warm? How Cold?
Getting Started
Connect the Temperature Sensor to input A on the Vu Pro logger
Press ◀ (Left) or ► (Right), select Meter
Press the ✓ Enter button
Or with Vu Pro and EasySense
Start EasySense software
Select Graph at the Home Screen
Connect Vu Pro in Devices.
Press Start when you are ready!
Activity
1. Place the Temperature Sensor into the hot water.
2. Watch the changes on each display.
3. Place the Temperature Sensor into the cold water.
Questions
Which display shows the changes best?
How warm is the hot water?
How cold is the cold water?

Are Your Hands Warmer Than Mine? (Teacher’s page)
This activity introduces the concept of comparing readings.
Learning Objectives
That more than one sensor can be used at a time.
That using two Temperature Sensors allows measurements to be compared.
That rubbing the Temperature Sensor has an effect.
Resources
Vu Pro data logger and 2 plug-in Temperature Sensors
EasySense software
2 willing volunteers
Suggestion
The temperature range for Meters can be changed in the Meter menu item. Or EasySense can be used in Continuous (Graph) mode.
Classroom Organisation
Whole class demonstration and discussion followed by group activity.
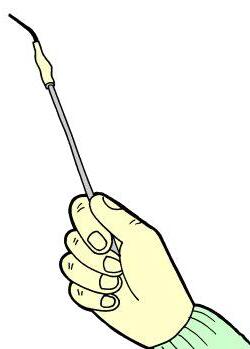


Connect a Temperature Sensor to A and B on the Vu Pro data logger.
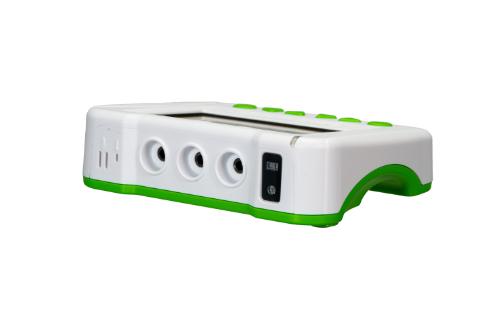
Suggestion
Before starting, you may wish to turn off the internal sensors on the data logger. Select Meter and then press the ✓ Enter button twice, scroll and use the ✓ to select.
Are Your Hands Warmer Than Mine?
Getting Started
Connect the Temperature Sensors to inputs A and B on the Vu Pro data logger.
Start EasySense and select Meters from the Home Menu.
Connect the Vu Pro to the collection station running EasySense (Devices).
Activate the two temperatures probes in Devices.
Press Start.
Activity
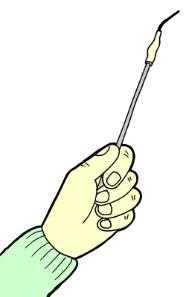
1. Two pupils should each hold a Temperature Sensor tightly in their hand.
2. Watch the changes in each display.
3. See what happens if one pupil rubs the tip of the sensor between their fingers.
Questions
Whose hand is the warmer?
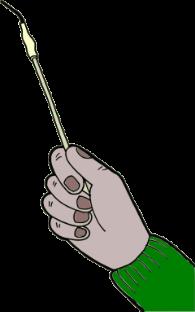
What happens if you rub the tip of the sensor between two fingers?
How Warm Is Our Classroom? (Teacher’s page)
Introduction
This activity does not need the collection station. The sensor values can be observed on the Vu Pro data logger’s LCD screen using the Meter mode.
Learning Objectives
That temperature can be measured accurately
Resources
Vu Pro logger and one plug-in Temperature Sensor
Selecting Meter mode
Whilst in this mode, Vu Pro will continuously display fully calibrated measurements from the sensors on the LCD screen.
Connect the plug-in Temperature Sensor. This will appear as sensor A. If the display is turned off, press any button to wake up Vu Pro.
Note: TheTemperatureSensor,justlikeathermometer,needstimetoadjustand measureachangeintemperature,waituntilthedisplayedvaluestopsgoingupor downbeforetakingthetemperaturereading.
Extension Activities
The built-in Light Sensor could be used to find out the lightest part of the room.
The built-in Sound Sensor could be used to find out how quiet, or how noisy the class could be, or which classroom in the school is the quietest/loudest.
How Warm Is Our Classroom?
Getting Started
Connect a Temperature Sensor to input A of Vu Pro. Select Meter on the Vu Pro’s screen menu.
Vu Pro ◀ (Left) or ► (Right), select Meter
Press the ✓ Enter button
Activity
1. What temperature is it near the window?
2. Is it the same temperature near the door?
3. What temperature is it as high as you can reach?
4. What temperature is it on the floor?
5. How hot is the radiator?
6. What is the temperature outside?
Place Temperature By teachers desk By Rupert’s desk Window
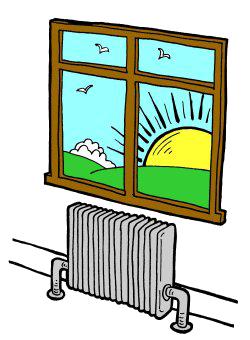
Make a simple results table to record your results!
Try making a bar graph to show what you found.
Make a number line and place the numbers on it along with a picture of the place.
The Temperature Game (Teacher’s page)
Introduction
This activity uses EasySense’s Continuous (or EasyLog on the Vu Pro if used alone), and can be used to assess whether pupils are able to interpret a line graph correctly. Use the the Vu Pro data logger with all internal sensors off (from the Meter menu on the Vu Pro, or the Devices if you are connected to EasySense).
Learning Objectives
That data can be continuously recorded
Data can be displayed as a line graph
How to interpret data displayed as a line graph
Resources
Vu Pro and 1 plug-in Temperature Sensor
EasySense software
Mug or container of hot water (max 80oC).
Mug or container of cold water. (min 10oC).
Suggestion
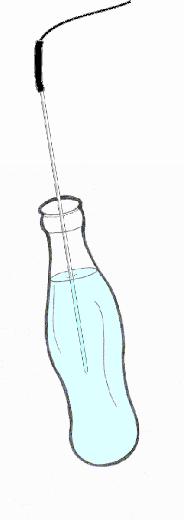
Instead of using mugs, use two identical plastic bottles with a hole drilled in the plastic top. Pour hot water in one bottle (not more than 60oC), cold water in the other. If these tip over there will be less water spilled.
Classroom Organisation
Whole class activity including discussion.
This activity works well with a data projector or interactive whiteboard.

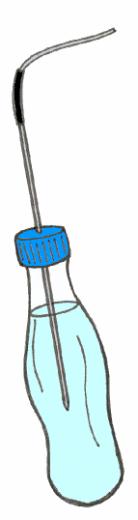
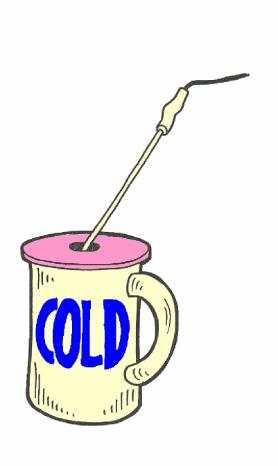
The Temperature Game
Getting Started
Connect a Temperature Sensor to input A. Select or EasyLog from the Home Screen.
Vu Pro ◀ (Left) or ► (Right), select EasyLog
Press the ✓ Enter button)
Press the ✓ Enter button to capture data
Or Connect the Vu Pro to the collection station with EasySense, and select Graph from the Home Screen.
If you are using Graph, use Setup to create 5 minute recording (Setup).
Set up a container of hot water and a container of cold water safely.
To start with leave the Temperature Sensor on the desk. When ready, Start recording with Easysense (or ✓ Enter button to capture data with the Vu Pro alone)
If you have used EasyLog, then you can load your data into EasySense using the File > Import from Device
Activity
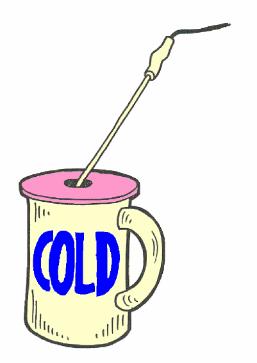
1. Pupil 1 (or group 1) should look at the screen display on the collection station.
2. Pupil 2 (sitting out of sight of Pupil 1) should first dip the Temperature Sensor into the hot water and leave it there for a while.
3. Next move the sensor into the cold water and leave for a while.
4. Pupil 1 should guess where the sensor is from watching the collection station’s display.
5. Repeat dipping the sensor until the graph has stopped recording.
Questions

From the graph, can you describe what happened when the Temperature Sensor was put in the hot water?
Can you find out how hot the water is?
How many times was the Temperature Sensor put into the cold water?
Hot Drinks (Teacher’s page)
Introduction
This activity uses EasySense Graph or EasyLog with the Vu Pro. Have all of the the Vu Pro data logger’s internal sensors turned off.
Learning Objectives
That hot drinks cool down to the surrounding temperature when left to stand.
Data can be continuously recorded.
Data can be displayed as a line graph.
How to interpret data displayed as a line graph.
Resources
Vu Pro data logger and two plug-in Temperature Sensors.
EasySense software.
Mug or container of hot water.
Suggestion
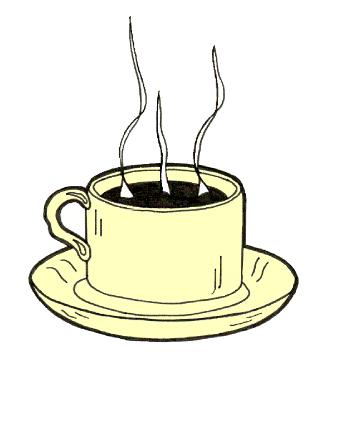
As a hot drink takes a long time to cool down to room temperature, you could use the EasyLog remote data logging feature on the Vu Pro for this activity.
Classroom Organisation
Group work following whole class introduction, plus feedback session. This is a long activity, at least an hour for a cup of hot water to cool down to room temperature.
Extension Activity
Put some ice cubes and cold water into a cup and find out how long it takes for the cold water to reach room temperature. Hint – use remote logging.
Links
This activity is an introduction to cooling. See the other activities: Too hot! and Keeping warm.
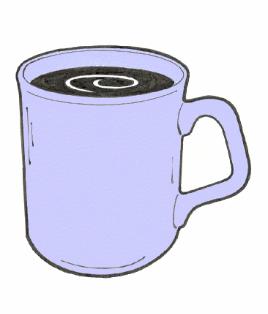
Hot Drinks
Getting Started
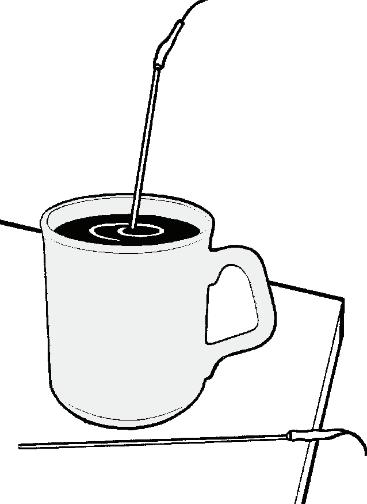
Connect one Temperature Sensor to input A and the other to input B.
Connect a Temperature Sensor to input A.
Vu Pro ◀ (Left) or ► (Right), select EasyLog
Press the ✓ Enter button)
Press the ✓ Enter button to capture data
If you have used EasyLog, then you can load your data into EasySense using the File > Import from Device.
Or using EasySense and Vu Pro logger
With EasySense and select Graph from the Home Screen (or Continuous from Setup).
If you are using Graph, use Setup to create 1 hour recording.
Set up a container of hot water and a container of cold water safely.
To start with leave the Temperature Sensor on the desk. When ready, start recording.
Activity
1. Place one Temperature sensor in the hot water.
2. Place the second Temperature Sensor on the desk to measure the room temperature.
3. When ready, click on the Start icon to begin logging.
Questions
From the graph, can you find out how hot the water was at the start?
What is the temperature of the classroom today?
How long did it take for the hot water to cool down to the same temperature as the classroom?
Too Hot! (Teacher’s page)
Introduction
This activity uses EasySense Graph (Continuous in Setup). Click to Start recording and Stop when using EasySense.
Have all internal sensors of the Vu Pro data logger off in either mode of use.
Learning Objectives
That hot drinks cool down when left to stand. Some actions can speed up the cooling down time.
Different containers can also affect cooling time.
How to interpret data displayed as a line graph.
Resources
Vu Pro data logger and two plug-in Temperature Sensors. EasySense software.
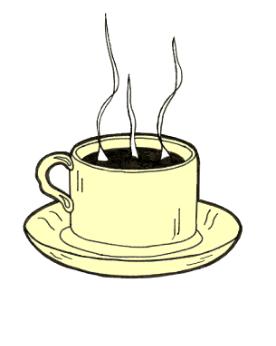
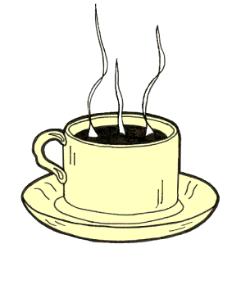
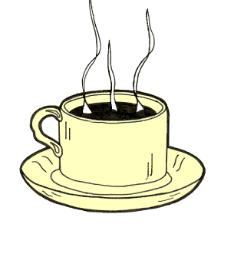
Two matching cups or mugs of hot water.
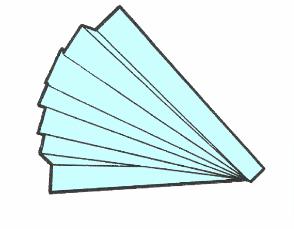
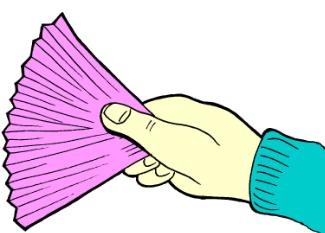
Paper fan.
Suggestions
The larger the surface area of the cup or mug is, the greater the cooling effect of the paper fan will have. Once the effect has been recognised, the recording can be stopped. It takes a long time to cool a mug of hot water to room temperature – see Hot drinks.
Classroom Organisation
Group work following whole class introduction, plus feedback session.
Extension Activities
Try using pairs of containers in different materials e.g. pair of china mugs, pair of plastic beakers.
Which keeps the hot drink hot for longer?
Links
This activity is a follow on activity from Hot drinks.
Too Hot!
Getting Started
Connect two Temperature sensors to input 1 and input 2 of the Vu Pro data logger
Start the EasySense software and select Graph from the Home Screen
Connect the Vu Pro to the collection station (Devices)
Go to Devices and make sure that the Temperature Sensors are connected
Activity
1. Pour an equal amount of hot water into two cups.
2. Place one Temperature Sensor in each cup.
3. Click on the Start icon to begin logging.
4. Fan one of the cups with the paper fan.
5. Click on stop when finished.
Questions
From the graph, can you find out how hot the water was at the start?
Did fanning one of the cups make any difference to the temperature?
Can you think of other ways of cooling a hot drink down?
Keeping Warm! (Teacher’s page)
Introduction
This activity uses EasySense (Graph) or Easylog with the Vu Pro. This is a one click to start recording in Easysense and one click to Stop.
Learning Objectives
That some materials are good thermal insulators. Some materials are better insulators than others.
Materials that are good at keeping things warm are also good at keeping things cold.
Resources
Vu Pro data logger and two plug-in Temperature Sensors
EasySense software
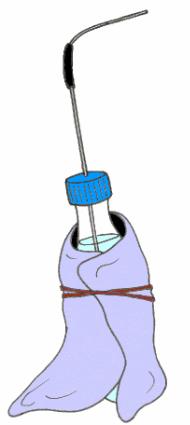
Two containers – mugs, beakers or plastic water bottles
Hot water (Be safe! Not too hot – below 70�C, or 60�C if using plastic bottles).
Insulation materials e.g. fabrics, newspaper, wadding and rubber bands to hold material in place.
Classroom Organisation
Whole class activity followed by group work and feedback session. The aim is for children to think about the sort of materials they use to keep them warm in winter and to design the experiment to test their ideas.
Extension Activities
Investigate keeping something cold e.g. ice cube or “ice lolly”.
Links With Other Subjects
Children could use the results of their investigation into insulation properties of different materials to make a cover for a teapot or coffee pot.
Keeping Warm!
Getting Started
Connect two Temperature Sensors to inputs A and B.
Vu Pro ◀ (Left) or ► (Right), select EasyLog
Press the ✓ Enter button), X to finish)
Use EasySense File > Import from Device to get the data
Or With EasySense and Vu Pro
Start EasySense and select Graph at the Home Screen
In EasySense, connect the logger (Devices).
Click Start when ready, Stop when complete
Activity
1. Fill the containers with an equal amount of hot water.
2. Place a Temperature Sensor into each container.
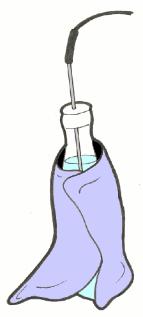
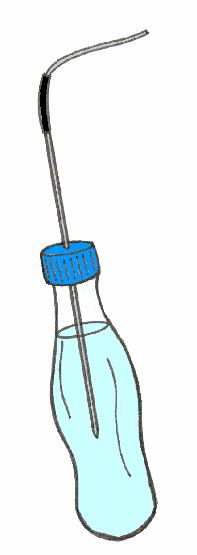
3. Wrap the material you are testing around one of the containers.
4. Predict what will happen to the temperature of each container.
5. Click on the Start icon for EasySense to begin logging, or the ✓ Enter button if using the logger alone. See if your prediction is correct!
6. When you have finished your tests, click Stop in EasySense (or X on the logger if that is used alone - see above).
Questions
Which container stayed hot longer?
Does a cover make a difference?
If you investigated more than one material, which one was best? Why?
What Shall I Wear Today? (Teacher’s
page)
Introduction
This activity uses EasySense’s Graph or EasyLog on the Vu Pro. All you need to do is connect the sensors to the logger and record. Have all of the Vu Pro data logger’s internal sensors turned off for this activity (see Meter).
Learning Objectives
That the Sun is a source of heat as well as light.
That colours absorb heat (radiation) at different rates.
Resources
Vu Pro data logger and two plug-in Temperature Sensors
EasySense software
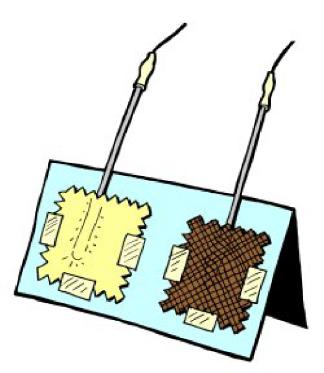
Different coloured fabrics of the same type, one pale and one dark e.g. cotton squares in yellow and dark blue
Classroom Organisation
Group work following whole class activity, plus feedback session.
Predictions could be used for a whole class activity to display a variety of pupil’s guesses.
Links With Other Subjects
Pupils could use the results of their investigation to make an appropriate outfit for a story character.
Extension Activities
Try the investigation again using other colours e.g. white and black, or pink and green.
Try other materials e.g. coloured paper or plastic such as *Correx/Corriflute.
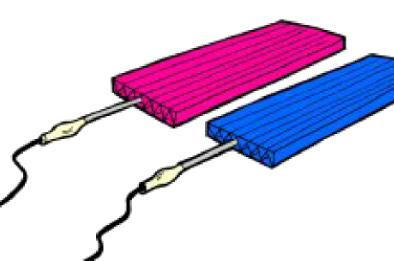
* The Temperature Sensors fit neatly into the channels
What Shall I Wear Today?
Getting Started
Connect two Temperature sensors to inputs A and B.
Connect a Temperature Sensor to input A.
Vu Pro ◀ (Left) or ► (Right), select EasyLog
Press the ✓ Enter button)
Press the ✓ Enter button to capture data
Load your data into EasySense using the File > Import from Device when finished
Or Using EasySense and Vu Pro
With EasySense and select Graph from the Home Screen
Connect to Vu Pro using Devices
Use Setup to create 5 minute recording
Set up a container of hot water and a container of cold water safely.
Leave the Temperature Sensor on the desk. When ready, Press Start recording.
Activity
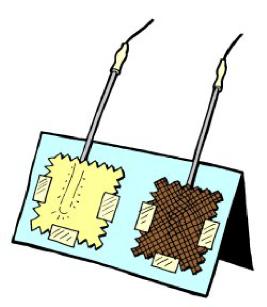
1. Set up the Temperature Sensors with one under each fabric sample as in the diagram.
2. Fasten down three edges of the sample with sticky tape to hold everything in position.
3. Stand the card and samples against a sunny window.
4. Click on the Start button to begin logging (✓ if using the logger alone).
Questions
Did the samples warm up at the same rate?
Which of the fabric samples got warmer?
Which one was the cooler?
Which colour clothes would you wear to stay cool on a hot sunny day?
Which colour clothes would you wear to stay warm on a bright winter’s day?
The Ideal Temperature? (Teacher’s page)
Introduction
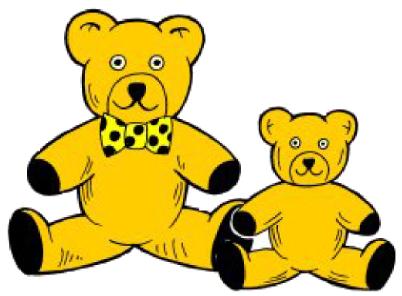
This is an activity about creating a idea and the testing it. It is also about modelling (simulating a real event). The activity is loosely built around the idea of Goldilocks testing the porridge to find the one that is ideal to eat.
The activity has two parts:
Part One is finding the ideal temperature of the porridge.
Part Two is using the Temperature Sensor to tell you when the porridge is at your ideal temperature.
Learning Objectives
Predicting the future from “known knowledge”.
That data can be recorded at intervals over a given period of time.
Resources
Vu Pro and and two plug-in Temperature Sensors
EasySense software
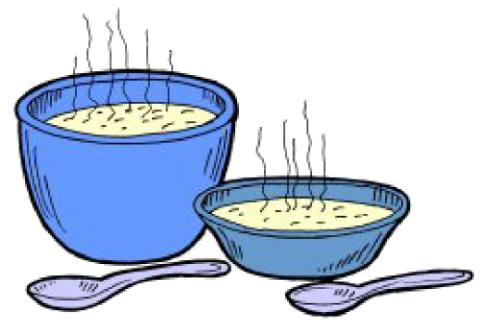
One small mixing bowl
One cereal bowl
Hot porridge (or hot water pretending to be porridge!)
Spoons.
Classroom Organisation
Whole class activity including discussion and pupil participation.
Activity one uses the Vu Pro data logger Meters screen.
Note: HealthandSafety
Each‘tester’needstohavetheirownspoon,orwashthoroughlybetweentests!
The Ideal Temperature?
Getting Started
Connect two Temperature Sensors to inputs A and B. Select the Vu Pro data logger’s Meter screen.
Vu Pro ◀ (Left) or ► (Right), select Meter
Press the ✓ Enter button, use the X when complete.
Activity 1
1. Pour a small amount of porridge into a bowl.
2. Put a Temperature Sensor into the bowl.
3. The temperature value will be shown on the Vu Pro’s screen.
4. Let one person test the porridge with a small spoonful.
5. Make a note of the temperature value when the tester says ‘It’s just right’.
Activity 2: Using EasySense and Vu Pro
1. Connect the Vu Pro data logger to the collection station.
2. Start the EasySense software and select Graph from the Home Screen. Connect using Devices.
3. Fill the large and the small bowls with hot porridge, and place a Temperature Sensor into each bowl.
4. Click on Start to begin logging.
5. Predict what will happen to the temperature of the two bowls of porridge.
6. Press Stop when “Baby Bear’s” porridge reaches the tester’s chosen temperature.
Questions
How much hotter is Big Bear’s porridge than Little Bear’s porridge at the end of the recording?
Can you tell how long the bears have been out of the house?
Why do you think Little Bear’s porridge cooled down faster than Big Bear’s porridge?
Temperature
Water and Eggs! (Teacher’s page)
Introduction
This is an activity about helping students to understand that some changes are reversible, and others are not. So, by taking water and freezing it, then allowing it to thaw - that is a reversible process. Alternatively, when an egg is boiled and allowed to cool, the results are not reversible.
Part One is finding the that water can change state and back again.
Part Two is using the Temperature Sensor to tell you when an egg has been boiled and allowed to cool, things do not reverse!
Some care has to be taken of course with boiling water.
Learning Objectives
Not all changes are reversible and so some do not need to be permanent.
That date can be used to help us show what causes the effects described.
Resources
Vu Pro and and one plug-in Temperature Sensor
Some water (close to freezing in a container that can then be immersed in ice)
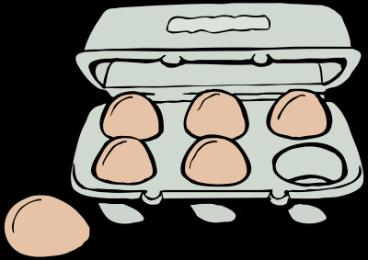
Two eggs (or as many as you need for the class)
A boiling pan that can be used for one of the eggs, for as long as it takes to boil it (5 mins)

Water and Eggs!
Getting Started
Connect a Temperature Sensors to input A.
Vu Pro: ◀ (Left) or ► (Right), select Meter
Press the ✓ Enter button
Part 1
1. Pour a small amount of cold water into a container.
2. Put a Temperature Sensor into the container.
3. Immerse the container into an ice bucket.
4. Make a note of the temperature value when the tester says as it falls.
5. Allow the water in the container to turn to ice, make a note!
6. Remove the outer ice bucket.
7. Note when the ice is melting.
8. Note when the ice is water again!
Part 2
1. Take one egg, break it open and make a note about what it looks like.

2. Let your instructor take the other egg and put it into boiling water. Make a note of the temperature.
3. When the egg is removed, let it cool for 10 minutes.
4. Make a note of the egg temperature by gently resting the Temperature Sensor against the surface.
5. When it is cool enough, peel the egg. Describe what it looks like now.
Questions
What is happening to the water as the temperature changes?
What happens to the water if it is heated at the boiling temperature?
What will happen to the water after it has boiled and cooled again?
Were the two eggs different, and can the second egg be made to go back to how it was to begin with?
MULTI-SENSORS
Our Room (Teacher’s page)
Introduction
The following are a series of suggested classroom investigations that make use of the EasyLog “remote logging” function of the Vu Pro data logger. Groups of pupils can work independently, drawing on their experiences of monitoring activities, to answer the following questions (or some of their own!).
Resources
Vu Pro data logger, with built-in Temperature and Light Sensors
EasySense software
Suggested Investigations
When does it warm up in our classroom?
How hot does the radiator get?
Does our classroom get cooler when we go out to play?
Is it warmer on one side of the room than the other?
How cold does our classroom get at night?
How can we tell if the hamster is active at night?
Is the lightest part of the classroom also the warmest?
Does the temperature change when it gets light?
Summer - How early does it get light? How late does it get dark?
Winter - When does it get light? When does it get dark?
Is the temperature in our classroom different from the other classrooms? Which is the warmest classroom in the school? Which is the coldest?
Suggestions
If you want to know if the classroom gets colder when you go out to play, think about when you need to start recording and for how long!
Do you need to know what the temperature of the classroom is just before you go out?
How long are you out to play?
If you are going to compare one day’s results with another, remember to start the second recording at the same time as the first one.
*If you are using the Light Sensor to record daylight at a window, select the 0–80 klx range.
Classroom Organisation
Whole class introduction followed by group work and feedback session.
Our Room
Getting Started
Set up the Vu Pro data logger in a position where it will not be disturbed.
Select EasyLog
Vu Pro ◀ (Left) or ► (Right), select EasyLog
Press the ✓ Enter button to start capture
Press the X Enter button to stop the capture
Connect the Vu Pro to the collection station and start EasySense. Use the File > Import From Device to get your data.
Information To Report To The Class
What questions were you trying to answer?
How did you decide to set up your experiment?
What did you use?
How did you do it?
How did you record your results?
Did you have any problems, and
How did you solve them?
What did you find out from the graph?
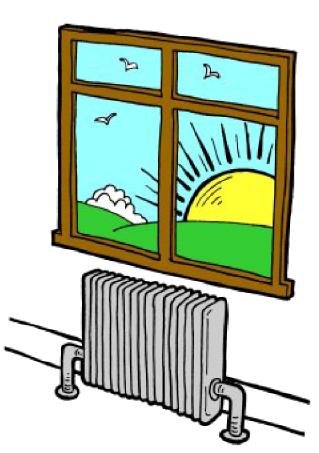
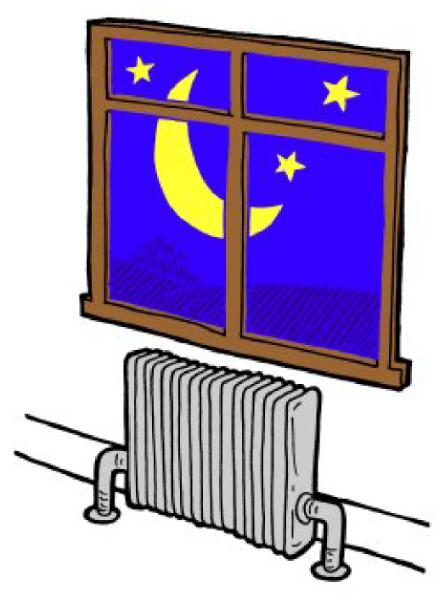
Seasons (Teacher’s page)
Introduction
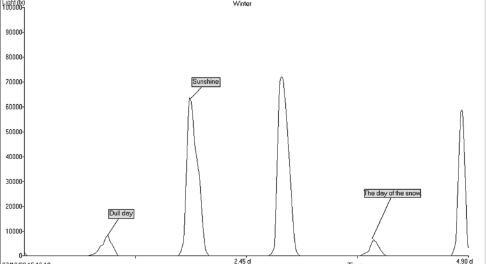
These two activities use the analysis Tools in the EasySense software. The first activity looks at the Winter data file, the second examines the Summer data file. The files can be loaded from the open file open in File. The files will need to be downloaded from Data Harvest’s web site. Or, measurements can be made with the logger for your own data.
Learning objectives
That daylight can be measured.
The length of a day can be calculated by recording light measurements for 24 hours or longer.
That the length of a day alters through the year and that there is an annual pattern.
That it is daytime in the part of the Earth that is facing the Sun, and night time in the part of the Earth away from the Sun.
Resources
EasySense software.
Classroom Organisation
Whole class activity.
Winter / Summer Activity
For the winter and summer activity the students will need to show only the temperature or light graph to answer the questions.
Suggestion
*When using the Light Sensor to record daylight at a window, select the 0 – 80 klx range.
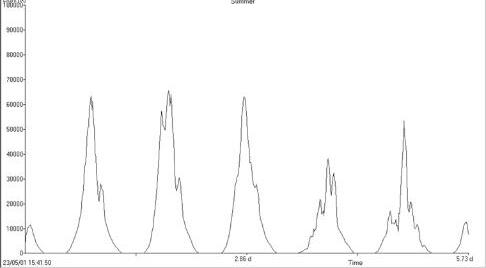
Seasons
Summer
Getting Started
Open the Summer data file from EasySense and answer the questions below.
Questions
Activity 1 - Summer
1. How long was it daylight? 2. How long was it dark?
Activity - Comparing Winter With Summer
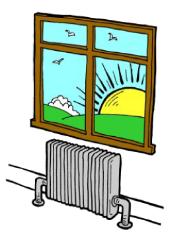
What was the difference between the length of day in the summer, and the length of day in the winter?
What was the difference between the length of night in the summer and the length of night in the winter?
What was the difference between the hottest day in the summer and the warmest day and in the winter?
What was the difference between the coldest temperature in the summer and in the winter?
Winter
Open the Winter data file and answer the questions below.
Questions
Activity 2 –
Winter
1. How long was it daylight? 2. How long was it dark?
Activity - Comparing winter with summer
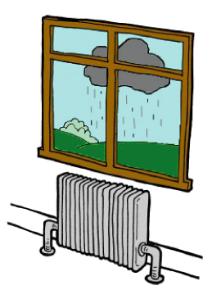
What was the difference between the length of day the summer, and the length of day in the winter?
What was the difference between the length of night in the summer and the length of night in the winter?
What was the difference between the hottest day in the summer and the warmest day and in the winter?
What was the difference between the temperature in the summer and in the winter?
My Beating Heart (Teacher’s page)
Introduction
This activity uses EasySense’s Graph option. The Vu Pro Heart Rate and Waveform Sensor is available also to use directly on the instrument.
Learning Objectives
That a person’s pulse rate can be measured.
The heart pumps the blood around the body.
A person’s heart rate alters continuously in response to activity.
Resources
A Vu Pro data logger with all internal sensors but the Heart Rate
EasySense software
Classroom Organisation
Whole class activity.
Each recording will take 10 seconds. To find the number of beats per minute, multiply the number of complete cycles (or peaks) by six. e.g. if a graph shows 17 peaks, multiply by 6 gives 102 beats per minute.
Suggestions
The sensor’s response is dependent on blood flow. If a child has cold hands, try warming them first before using the sensor.
For the recording period you can try Graph and stop before 30 seconds using EasySense.
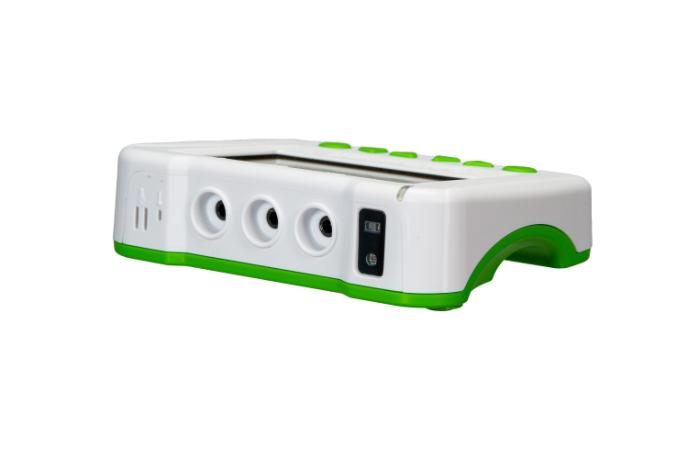
Heart Rate Sensor
My Beating Heart
Getting Started
Connect the Vu Pro data logger to the EasySense.
Start the EasySense software and select Graph from the Home Screen.
Make sure the Vu Pro is connected in Devices.

Select a time of 10 to 30 seconds (maximum) with a time between samples of 20ms (50Hz) in Setup (Continuous).
Press Start in EasySense.
Gently rent your finger on the sensor whilst holding the Vu Pro in both hands. The graph should show Heart wave (mV). If it shows Heart rate (bpm) the range should be changed. See your instructor!
Activity
1. Stay still and click on the Start icon.
2. When the recording has finished, count the number of peaks in the 10 second period.
3. Multiply that number by 6 to find out how many times your heart beats per minute.
Questions
Does your heart always beat at the same rate?
Repeat the activity after running around in the playground!
How many peaks are there after running around?
How many times does your heart beat per minute after exercise?
Heart Beats! (Teacher’s page)
Introduction
This activity uses EasySense Graph facility. The Vu Pro Heart rate and pulse waveform sensor is now built in, but you can use an older heart rate monitor if you wish to take multiple simultaneous readings.
Learning Objectives
That a person’s pulse rate can be measured.
The heart pumps the blood around the body.
That a person’s heart rate alters continuously in response to activity.
Resources
A Vu Pro data logger with all internal sensors turned off but the Heart Sensor
Vu Pro Heart rate sensor set to the beats per minute range for this activity
EasySense software
Classroom Organisation
Whole class introduction. Group activity.
Suggestions
The sensor’s response is dependent on blood flow. If a child has cold hands, try warming them first before using the sensor.
Heart Rate sensor
Heart Beats! Getting Started
Connect the Heart Rate Sensor to input A
Start the EasySense software and select Graph from the Home Screen
Make sure the Heart Rate is selected in Devices
Set the recording for 20 seconds (Setup)
The graph should show Heart rate (bpm). If it shows Heart wave (mV) the range should be changed. See your teacher
Activity
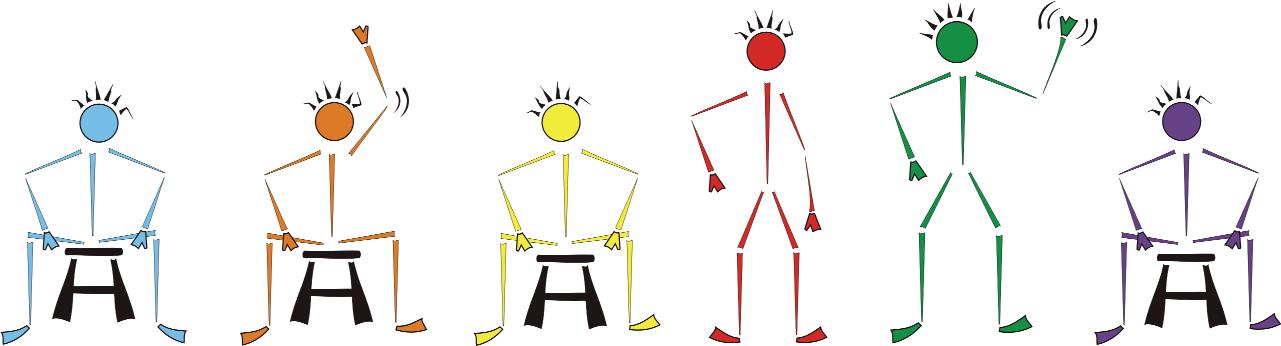
1. Sit comfortably. Click on the Start icon.
2. Count to slowly to 10, and then raise your right hand high.
3. Count to 10, and then lower your right hand.
4. Count to 10, then, without moving your left hand, stand up.
5. Count to 10, then raise your right hand and wave it around.
6. Count to 10, then lower your right hand, and sit down.
7. When the recording has finished, use the Text tool to place labels on your graph.
Questions
Does your heart always beat at the same rate?
How fast was your heart beating when you were sitting down at the start?
How fast was your heart beating when you were standing up?
How fast was your heart beating when you were waving your hand?

Was your heart beating at the same rate at the end of the graph as at the beginning?
Slopes And Speed! (Teacher’s page)
Introduction
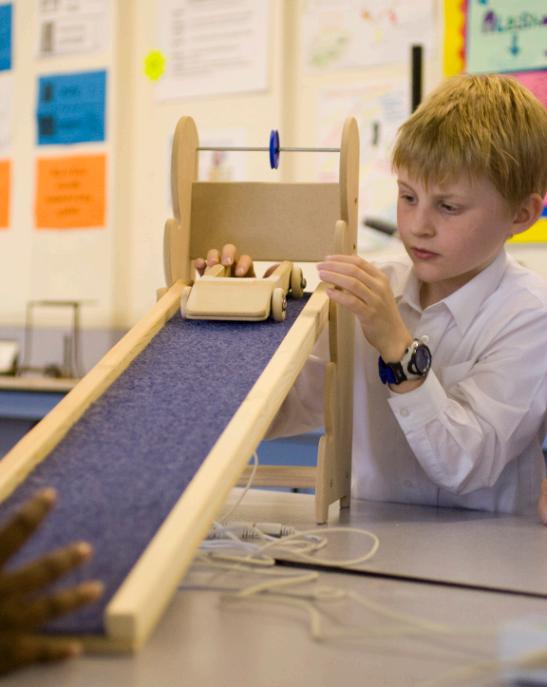
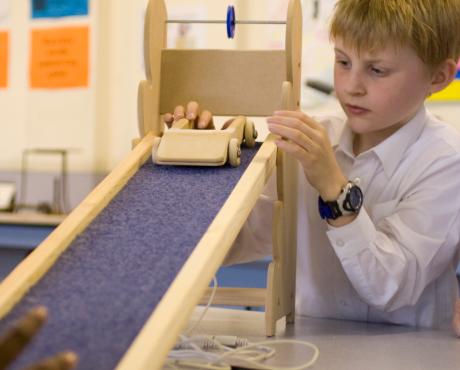
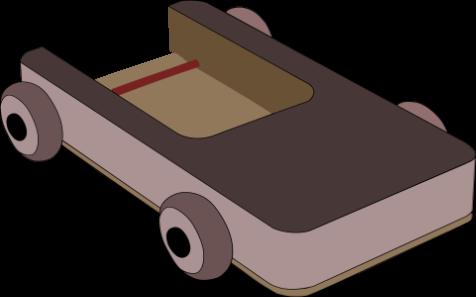
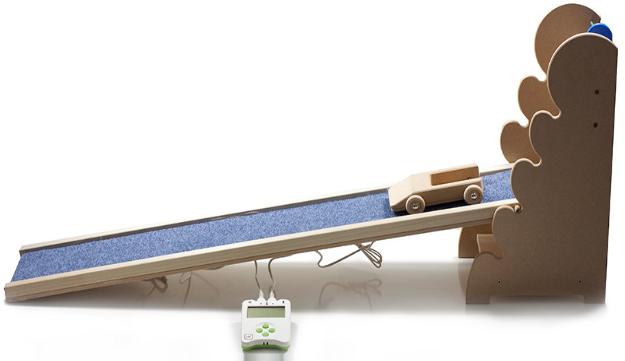
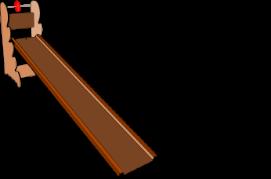
This activity uses EasySense’s Timing and the Data Harvest Primary Timing Ramp. The ramp comes with two magnetic switches and a cart equipped with a strong magnet. The cart will trigger the switches as it runs over them, letting you find time or speed from A to B.
The Timing ramp and cart are available as separate items.
Learning Objectives
That Vu Pro can be used as an accurate timer.
The “top” switch A starts the timer and the “bottom” switch B stops the timer. If the distance between A and B is known, then the average speed can be calculated.
Speed = distance from B to A / time at B minus time at A
Resources
Vu Pro logger
Primary timing ramp and cart (with magnet fitted)
EasySense software
Classroom organisation
Whole class introduction. Group activity.
Suggestions
Connect the switch at the top of the ramp to A on the logger and the switch at the bottom of the ramp to B.
Test beforehand to find which slope height is best for the cart to run.
Use the peg at the top of the ramp as a start point.
Remind the children of the idea of the “fair test”.
Slopes And Speed!
Getting Started
Connect the “top switch” on the ramp to input A and the “bottom switch” to input B on the Vu Pro data logger
Connect the Vu Pro logger to EasySense (Devices). Start the EasySense software and select Timing from the Home Screen. Set to record Time, From A to B (Setup).
Do a test run to check the cart runs down the slope.
Use the small peg at the top of the ramp as a start point.
If you will also be finding the speed of the cart: measure the distance between the two magnetic switches (see Extension Activity).
Activity
1. Click on the Start icon to begin logging.
2. Roll the cart down the ramp.
3. Repeat with the slope at different heights.
4. Click on Stop when finished.
Questions
Which slope had the shortest time?
Which slope has the longest time?
Why was it important to mark a start line?
How did you make each test a fair test?
Extension
1. Roll the cart down the ramp three times: Find the average of all three results.
2. Repeat with the other slopes and surfaces.
Why is it important to repeat the activity more than once?
To find the speed that the cars were travelling at, make a note of all of the times related to all of the slopes. The shortest time is the highest speed, can you work out the speed?
Speed = distance from B to A / time at B minus time at A
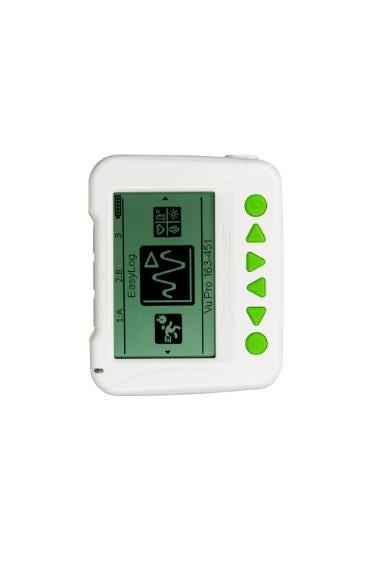
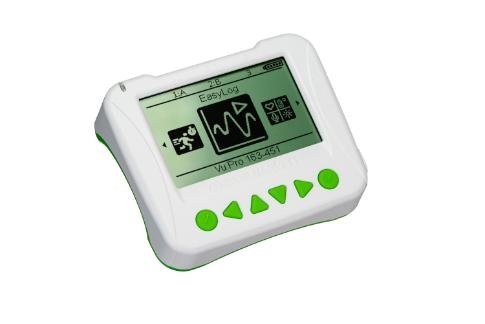
Data Logger (Vu+ shown)
Slowing Speedy Cars (Teacher’s page)
Introduction
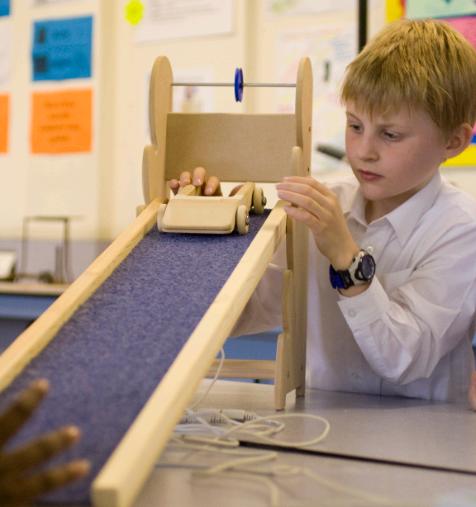
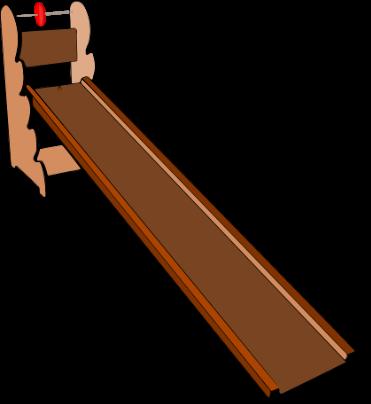
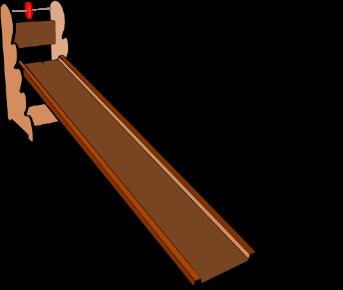
This activity uses EasySense’s Timing with the Data Harvest Primary Timing Ramp. The ramp has magnetic switches built into its base and use a wooden cart with a magnet attached to trigger and stop timing.
The Primary Timing Ramp has different surfaces that can be tested - by adding a strip of carpet or board. Each side gives a different surface and adds resistance.
Learning Objectives
That a Vu Pro data logger can be used as an accurate timer.
That the switch at A starts the timer and the switch at B stops it.
If the distance between A and B is known, then the average speed is:
Speed = distance from B to A/ time at B minus time at A
Resources
A Vu Pro data logger
Primary Timing Ramp with changeable surfaces
EasySense software
Classroom Organisation
Whole class introduction and a group activity.
Suggestions
Connect the magnetic switch at the top of the ramp to A on the logger and the lower magnet switch to B.
Use the peg at the top of the ramp to hold the cart in place until you are ready for the launch.
Use the most sticky surface (carpet surface) to find the lowest ramp position for the cart to move on its own down the ramp.
Point out the need to start the cart from the same point every time to create a “fair test”. If time is available, show how a different release place can change the times, but make sure you don’t start below the top magnet switch.
Slowing Speedy Cars
Getting started
Connect the top switch on the ramp to A and the lower switch to B on the logger.
Connect the Vu Pro data logger to Easysense (Devices)
Start EasySense and select Timing from the Home Screen. Set to record Time, From A to B from the Setup option
Do a test run to check that the car runs from top to bottom without a push
Use the small peg at top of the ramp as a start point
If you will be finding the speed of the cars, measure the distance between the magnet switches
Activity
1. Click on the Start icon to begin logging.
2. Roll the first car down the ramp.
3. Repeat with the other cars.
4. Click on Stop when you have finished.
Questions
Which car has the shortest time?
Which car has the longest time?
Why was it important to mark a start line?
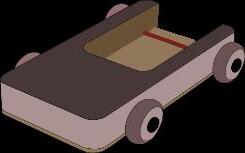
Are all the cars the same? If not, why was there a difference between them?
Extension
1. Roll the first car down the ramp three timesfind out the average of all three results.
2. Repeat with the other cars.
Why is it important to repeat the activity more than once?
To find the speed that the cart was travelling.
Speed = distance from B to A/ time at B minus time at A
Higher Slope More Energy? (Teacher’s page)
Introduction
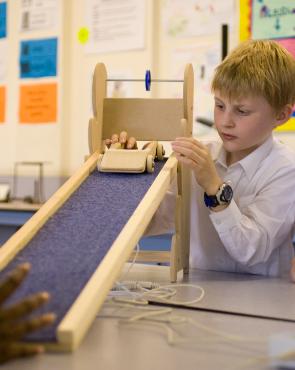
This activity uses EasySense’s Timing with the Data Harvest Primary Timing Ramp. The ramp has magnetic switches built into its base and use a wooden cart with a magnet attached to trigger and stop timing.
The Primary Timing Ramp has different surfaces that can be tested by adding a strip of carpet or board. Each side gives a different surface and adds resistance. What we are going to do is use one “surface type” and change the elevation.
Learning Objectives
That a Vu Pro data logger can be used as an accurate timer.
Switch at A starts the timer and the switch at B stops it.
That if the distance between A and B is known, then the average speed can be calculated: Speed = distance divided by time.
Movement involves energy and the total distance travelled reflects that energy.
Resources
A Vu Pro data logger
Primary timing ramp
EasySense software
A measuring tape
Classroom Organisation
Whole class introduction. Group activity.
Suggestions
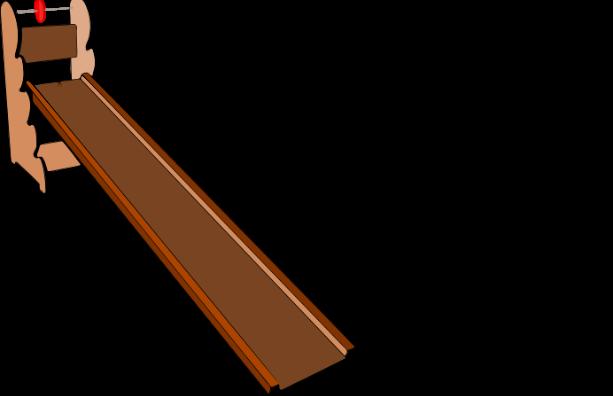
Connect the magnetic switch at the “top” of the ramp to A on the logger and the lower magnet switch to B.
Use the peg at the top of the ramp to hold the cart in place until you are ready for the launch.
Use the low adhesion surface to find the lowest ramp position for the cart to move on its own down the ramp.
Point out the need to start the cart from the same point every time to create a “fair test”. If time is available show how a different release place can change the times and distance travelled, but make sure you don’t start below the top magnet switch.
Higher Slope More Energy?
Getting Started
Connect the top switch on the ramp to A and the lower switch to B on the logger.
Start EasySense and select Timing from the Home Screen. Connect the Vu Pro data logger to Easysense (Devices). Set to record Time, From A to B from the Setup.
Do a test run to check that the car runs from top to bottom without a push.
Use the small peg at top of the ramp as a start point.
If you will also be finding the speed of the cars, measure the distance between the magnet switches.
Activity
1. Click on the Start icon to begin logging.
2. Roll the first car down the ramp.
3. Measure how far the car rolls and then comes to a stop.
3. Repeat with the different slope heights.
4. Click on Stop.
Questions
Which car has the shortest time? Which car has the longest time?
Why was it important to mark a start line?
Are all the cars the same? If not, why was there a difference between them?
Did the car(s) with the shortest times roll the furthest?
Are the car(s) with the shortest times the ones with the steepest slopes? Do they roll the furthest?
What is giving the cars the energy?
To find the speed that the cart was travelling.
Speed = distance from B to A / time at B minus time at A
Extension
1. Roll the first car down the ramp three times: 2. Find out the average of all results.
2. Repeat with the other cars. Why is it important to repeat the activity more than once?
TIMING MATS
Hops And Jumps (Teacher’s page)
Introduction
This activity uses the Timing mode on the Vu Pro data logger to collect data. The data can then be downloaded to the collection station (and EasySense).
The Vu Pro Timing mats are available as a separate item.
Learning Objectives
That a Vu Pro data logger can be used as an accurate stopwatch.
That Timing Mat A can be used to start the timer, and Timing mat B to stop it.
Resources
A Vu Pro data logger
1 pack of Timing Mats (pair)
EasySense software
Classroom Organisation
Whole class introduction and a group activity.
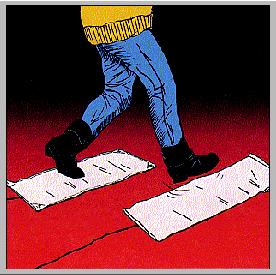
The Vu Pro data logger is used as a remote timer for this activity. The timing mats can be used indoors or outdoors, and can be stepped on, jumped on, or cycled over.
Make sure the mats do not move when “hopped” onto, you may need to use a piece of duct tape to hold the mat in place!
Suggestion
Make sure that the Timing Mat connected to Input (A) is stepped on first, and the one connected to (B) is stepped on second.
You could also use a pair of Push Button Switches connected to A and B, give A to the starter and B to the finisher.
Children could then move past them, the starter presses to start the clock and the finisher presses to stop the watch, This opens the activity to all sorts of “time events” and “how longs to” activities.
Hops And Jumps
Getting Started
Connect the Timing Mats to input A and input B on the Vu Pro data logger
Position the mats on the floor, so that Mat A is the first mat to be stepped on, and Mat B the second.
Scroll to Timing on the Vu Pro’s main menu,
Select Timing from the main menu
Vu Pro ◀ (Left) or ► (Right), select Timing
Press the ✓ Enter button twice,
Use the ▲ (Up) or ▼ (Down) scroll buttons for Time,
✓ Enter button
Use the ▲ (Up) or ▼ (Down) scroll buttons for Time A to B
Press the X or ✓ to exit the menus
Activity 1
1. The 1st person hops onto Mat A then Mat B.
2. Look at the time taken on the Vu Pro logger screen.
3. Repeat for the 2nd, 3rd, 4th, etc.
Activity 2
1. The 1st person walks forward, steps on Mat A then onto Mat B.
2. Look at the time taken on the Vu Pro logger screen.
3. Repeat for the 2nd, 3rd, 4th, etc.
Connect The Vu Pro data logger to the collection station and EasySense.
Start EasySense, then File > Import From Device
Select the most recent data set.
Questions
How fast do you walk?
Who had the fastest time, when walking on the mats?
Is there a difference between the fastest walking time and the slowest walking time? What is it?
How fast do you hop?
TIMING SWITCHES
Timing Switches
How Fast Is Fast? (Teacher’s page)
Introduction
This activity uses EasySense’s Timing and Push Button Switches. It does not require software or a collection station to make it easiest to interpret.
You will need a “long space”, so mark out a known distance (two metres maximum with leads supplied); the children can walk, run, hop etc between the A and B marks and be timed.
The activity can easily be modified to show how timing works in sports events to show speeds (for example measure out 10 m and say you need to cover this in one second).
Learning Objectives
That Vu Pro can be used as an accurate timer.
Speed is measured in metres travelled per second.
That if the distance between A and B is known, then the average speed can be calculated:
Resources
Vu Pro logger
Two Vu Pro Primary Push Button Switches (this gives two metres between switches)
Classroom Organisation
Whole class introduction and group activity (very active!!).
Suggestions
Use something like masking tape that can be easily removed may be used to mark the A and B positions.
Prepare the distance, but get the children to measure it.!
If you are lucky enough to have mobile notice boards, use them to shield the starter’s and end’s view to stop early starts and stops.
You could take this activity outside and find out how fast cars go past the school!
How Fast Is Fast?
Getting Started
Connect the Push Button Switches to A and B ports on the Vu Pro data logger
Move to the “race track” and find out which of the two marks is A and which is B: A is the start, B is the finish
Position the Push Button Switch connected to A at the start mark, then position the finish switch B at the end mark. The logger will be “half way between”
With the EasySense Home Screen, select Timing. Make sure the switches are connected through Devices. Setup: Time and finally Time from A to B
Decide what activity the “runner” is going to do, and then time them!
Press Start. As the runner (for example) passes A press the switch, as they then pass B press the switch
Copy the time from the logger and enter this into a table - like the one below
Type of run Name Time on logger Time in seconds
Draw bar charts to show the speeds more clearly.
Group the activity (run, walk, run, hop, crawl, etc.) into groups to show which way of moving was quickest.
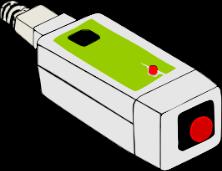
COUNTING
Counting! (Teacher’s page) Counting
Introduction
This activity uses Vu Pro’s Counting facility.
This practical is used to give an idea of how to count things in a scientific way, and to start to get students to ask questions about their assumptions - before they conduct experiments.
We are going to use very simple pendulum, to highlight that it things don’t always do what you might expect. Namely, that the period of the swing has nothing to do with mass of the bob, and that shorter pendulums swing “faster” - but that doesn’t mean that the velocity of the bob is different.
This is a very simple introduction to the ideas of motion, but more importantly, it is about how to count - and how important that is in science.
Learning Objectives
That a Vu Pro data logger can be used as an accurate recorder.
Sometimes taking data might rely on human senses.
Taking more data should be a positive thing to do!
Resources
A Vu Pro data logger
A stopwatch
A pendulum (use a retort stand, a length of robust cotton, variable masses, typically 30 g and 60 g
A meter rule
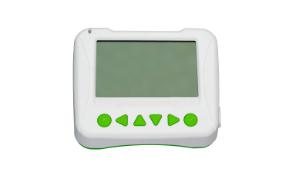
Counting!
Getting Started
With the Vu Pro, go to counting by:
Select Counting from the main menu
Vu Pro ◀ (Left) or ► (Right), select Counting
Press the ✓ Enter button once,
Use the ▲ (Up) or ▼ (Down) to count either A or B
✓ Enter button
Press the X or ✓ to exit the menus
Activity
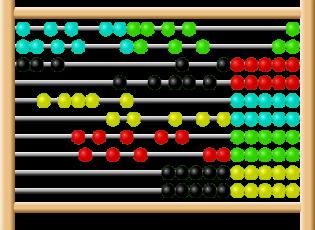
1. Make sure the pendulum is set up and has a length of about 0.5 m.
2. Practice a swing - and make sure the swing isn’t too big - about 10 cm from the centre.
3. Using the larger mass for the bob, start the stopwatch and count every time the bob gets to one side of the swing. This is done by pressing the button.
2. Count for 30 s and then stop.
3. Repeat with the the smaller mass for the bob.
4. Look at the two sets of data.
Questions
Was there a different count for each of the bobs? What was difficult to do in the experiment?
Can you make the experiment easier to measure. Count here
VOLTAGE
Circuits (Teacher’s page)
Introduction
This experiment shows how to make careful observations, and question assumptions, using a simple lamp circuit. A simple circuit is the gateway to electronics, and here we can use the Vu Pro as a voltmeter and as a device to show the data on a computer.
We mainly use the Vu Pro in Meter Mode, but by all means, connect Vu Pro to EasySense ans use the Graphing or Snapshot modes for data recording.
Learning Objectives
Simple circuits help us understand cause and effect.
Observing carefully and questioning assumptions is key to scientific thinking.
Even basic setups can show how energy, current, and resistance interact.
Resources
Battery or power supply
Lamp (bulb)
Switch
Connecting wires (Vu Voltage, sold separately)
Vu Pro
EasySense (optional)
Suggestions
Use a low powered voltage supply (less than 5 V). You may want to alter the voltage by another voltage source.
Use the right rating bulb so that the switching effect can easily be seen.
Please look at the suggestions for the activity (below).
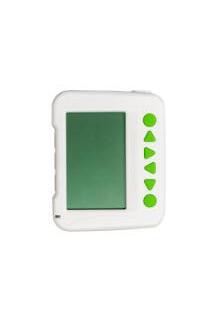
1.5 % V
Switch
Lamp
Vu Pro
Circuits
Getting started
With the Vu Pro, go to Meter on Vu Pro by:
Select Measure from the main menu
Vu Pro ◀ (Left) or ► (Right), select Meter
Press the ✓ Enter button once and look at the Voltage
Press the X to exit the menus when finished
Activity
Build the circuit with the lamp, switch, and battery.
Go to the Vu Pro, Meter and make sure that you can see the Voltage.
Close the switch and observe what happens.
Try changing one thing at a time — for example:
Use a different battery voltage
Add another lamp in series or parallel
Partly disconnect a wire or loosen a connection.
Questions
Record what you see and discuss why the things you see happen.
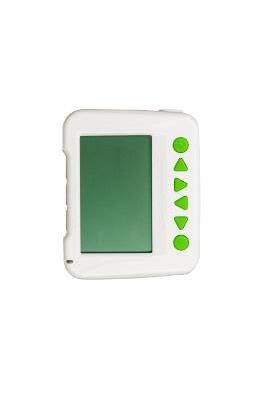
1.5 % V battery
Switch Lamp
Vu Pro
Renewables (Teacher’s page)
Introduction
This practical is designed to learn how to make careful observations, and look into electrical generation using new sources of energy. A simple circuit the one shown, is a gateway to “renewables”, and here we can use the Vu Pro as a voltmeter and a device to show the data on a computer.
We mainly use the Vu Pro in Meter Mode, but by all means, connect Vu Pro to EasySense ans use the Graphing or Snapshot modes for data recording.
Learning Objectives
Natural sources of energy can be used to generate electricity.
Observing carefully and questioning assumptions is key to scientific thinking.
Even basic setups can show how energy, current, and resistance interact.
Resources
Vu Pro
Solar panel or dynamo generator
Connecting wires (Vu Voltage, sold separately)
EasySense (optional)
Suggestions
Use a low powered voltage generator (less than 5 V). Please look at the suggestions for the activity (below).
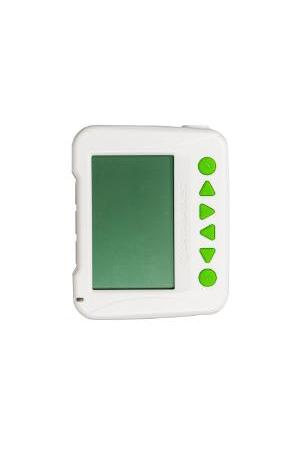
Vu Pro
Vu Voltage Cable
Renewables Voltage
Getting Started
With the Vu Pro, go to Meter on Vu Pro by:
Select Measure from the main menu
Vu Pro ◀ (Left) or ► (Right), select Meter
Press the ✓ Enter button once and Voltage will be available
Press the X to exit the menus when finished
Activity

Build the circuit with the solar panel or windmill. The voltage needs to be connected to the Vu Pro (Input A).
Go to the Meter on Vu Pro and make sure that you can see the Voltage.
Start generating some power and see if you can measure it!
Try changing one thing at a time — for example:
Use a different light source, or partially cover the solar panel up
Use two panels in parallel or in series
Questions
Record what you see and discuss why it happens. What types of renewable sources could be used to create voltage?
Vu Pro
Vu Voltage Cable
Primary Science Activities-Teacher Planning
This planning pack summarises all main activities from this resource. It is designed to support teachers in delivering practical, technology-supported science lessons using the Vu Pro data logger and EasySense software.
Sound
Learning Objectives:
- Understand how sound changes with distance and materials.
- Measure and compare loudness using sensors.
- Observe how materials muffle or reflect sound.
Resources:
- Vu Pro logger (Sound Sensor active)
- EasySense software
- Noise makers (claps, instruments, buzzers)
- Materials (fabric, cotton wool, polystyrene)
- Trundle wheel or distance markers
Setup Steps:
1. Connect Vu Pro via USB or Bluetooth.
2. Activate Sound Sensor in Devices.
3. Choose 'Meters' or 'Snapshot' mode depending on experiment.
4. Collect live or snapshot readings.
Activities Summary:
- How Noisy? How Quiet?: Measure sound level from various sources.
- How Near? How Far?: Record sound intensity with distance.
- Be Quiet!: Test how well materials block sound.
- Silence Is Golden!: Monitor classroom noise levels over time.
Key Questions:
- How does distance affect loudness?
- Which materials block sound best?
- When is our classroom the quietest?
Differentiation:
- Younger pupils: Use pictogram / gauge mode.
- Older pupils: Graph trends or calculate % reduction in sound.
Cross-Curricular Links:
- Design & Technology (building muffling boxes)
- Music (sound sources and vibrations)
- Maths (data handling, graphs).
Light
Learning Objectives:
- Measure and compare brightness in different conditions.
- Investigate transparency, reflection, and distance effects.
- Record and interpret data trends.
Resources:
- Vu Pro with Light Sensor active
- EasySense software
- Light sources (torches, windows)
- Fabrics, coloured cellophane, mirrors, blinds
Setup Steps:
1. Connect Vu Pro and activate Light Sensor.
2. Select 'Snapshot' for comparison or 'Continuous' for trends.
3. Adjust light range (0 – 1 klx indoor or 0 – 80 klx outdoor).
Activities Summary:
- How Bright? How Dark?: Compare brightness across areas.
- Curtains!: Test fabrics for light blocking.
- Sunglasses: Compare lens transparency.
- Reflections: Measure light reflection.
- What Happens Next?: Predict and test light-blocking patterns.
- Light & Distance: Record brightness as distance chnges.
Key Questions:
- Which surfaces reflect most light?
- How does distance affect brightness?
- What materials block or pass light?
Differentiation:
- Early years: Use gauge or pictogram display.
- Advanced: Discuss inverse square relationship or energy use.
Cross-Curricular Links:
- Art & Design (transparency, colour filters)
- Design (curtains, sunglasses)
- Geography (sunlight and seasons).
Temperature
Learning Objectives:
- Measure, record, and compare temperature changes.
- Understand heat transfer, insulation, and cooling.
- Explore reversible and irreversible changes.
Resources:
- Vu Pro + Temperature Sensors (A/B ports)
- EasySense software
- Water containers, fabrics, thermally insulating materials, safe heat sources
Setup Steps:
1. Plug sensors into A/B ports.
2. Activate in Devices (turn off others).
3. Choose 'Graph' for continuous data or 'Snapshot' for comparisons.
Activities Summary:
- How Warm? How Cold?: Compare hot and cold objects.
- The Temperature Game: Interpret live data graphs.
- Hot Drinks / Too Hot!: Observe cooling and fanning effects.
- Keeping Warm!: Compare insulating materials.
- What Shall I Wear Today?: Test how colours absorb heat.
- Water & Eggs!: Explore reversible vs irreversible changes.
Key Questions:
- Which materials keep heat best?
- How does colour affect temperature?
- How do liquids cool over time?
Differentiation:
- Lower KS2: Record temperatures and order results.
- Upper KS2: Graph data and calculate rates of change.
Cross-Curricular Links:
- Maths (graphing temperature/time)
- Design & Technology (testing insulation)
- Health & Safety (handling hot water safely).
Multi-Sensors
Learning Objectives:
- Use multiple sensors (light + temperature) for simultaneous data collection.
- Observe patterns over time and environment.
Resources:
- Vu Pro logger (internal Light & Temperature)
- EasySense software
- Classroom or outdoor environment for monitoring
Setup Steps:
1. Select EasyLog for long-term recording.
2. Position Vu Pro securely in room or near window.
3. Retrieve data using File > Import From Device.
Activities Summary:
- Our Room: Track classroom light/temperature over time.
- Seasons: Compare daylight duration and temperature between winter and summer data sets.
Key Questions:
- When is our classroom warmest?
- How does light change through the day?
- What patterns can we find between light and temperature?
Differentiation:
- Younger pupils: Observe and describe patterns.
- Older pupils: Analyse graphs quantitatively and discuss seasonal effects.
Cross-Curricular Links:
- Geography (seasons, day length)
- ICT (data logging)
- Environmental science (energy use).
Heart
Learning Objectives:
- Measure and interpret heart rate and waveform data.
- Understand how heart rate changes with activity.
Resources:
- Vu Pro with Heart Rate Sensor
- EasySense software
- Stopwatch or timer for pulse comparison
Setup Steps:
1. Connect heart sensor and ensure good contact.
2. Set recording duration (10–30 seconds, 50 Hz sampling).
3. Select Graph (Continuous) for waveform display.
Activities Summary:
- My Beating Heart: Measure resting pulse and calculate bpm.
- Heart Beats!: Record heart rate while changing body positions or moving.
Key Questions:
- Does your heart always beat at the same rate?
- How does movement affect pulse?
- How can we display changes over time?
Differentiation:
- Younger pupils: Count beats manually.
- Older pupils: Analyse waveform data and calculate averages.
Cross-Curricular Links:
- PE (exercise and heart rate)
- Health (fitness and circulation)
- Maths (averages, graph interpretation).
Motion
Learning Objectives:
- Investigate motion, timing, and speed.
- Use data loggers to measure time, distance, and calculate speed.
Resources:
- Vu Pro + Primary Timing Ramp & Cart
- EasySense software
- Different ramp surfaces and slope heights
Setup Steps:
1. Connect timing switches (A = start, B = stop).
2. Select 'Timing' in EasySense.
3. Calibrate distance between A and B for accurate speed calculation.
Activities Summary:
- Slopes and Speed: Measure cart time down different slopes.
- Slowing Speedy Cars: Test friction and surface effects.
Key Questions:
- How does slope affect speed?
- How do surfaces change motion?
- Why is a fair test important?
Differentiation:
- Younger pupils: Compare which slope is fastest.
- Older pupils: Calculate speed using time/distance formula.
Cross-Curricular Links:
- Maths (speed calculations)
- D&T (surface materials)
- Physics (forces and friction).
Switches, Timing Mats and Voltage
Learning Objectives:
- Investigate motion, timing, and speed.
- Use data loggers to measure time, distance, and calculate speed.
Resources:
- Vu Pro + Timing Mats, Switches or Voltage
- EasySense software
- Different setups for each experiment
Setup Steps:
1. Connect timing switches, mats (A = start, B = stop) or voltage.
2. Select 'Timing' in EasySense, or Snapshot.
Activities Summary:
- Timing experiments that involve human interactions
- Slowing Speedy Cars: Test friction and surface effects.
Key Questions:
- How do humans react to events?
- or How to start understanding basic circuits for the voltage
Differentiation:
- Older pupils: start to work on their own ideas about some of the more advanced topics.
Cross-Curricular Links:
- Maths (speed calculations)
Counting
Learning Objectives:
- Investigate how counting is a vital part of science
Resources:
- Vu Pro + pendulum
- EasySense software
Setup Steps:
1. Connect timing switches (A = start, B = stop).
2. Select 'Counting' in Vu Pro.
Activities Summary:
- Counting: Measure the pendulum frequency.
Key Questions:
- How do we count?
- How do we improve an experiment?
Differentiation:
- Older pupils: Start to investigate how to count with the very basics of SHM.