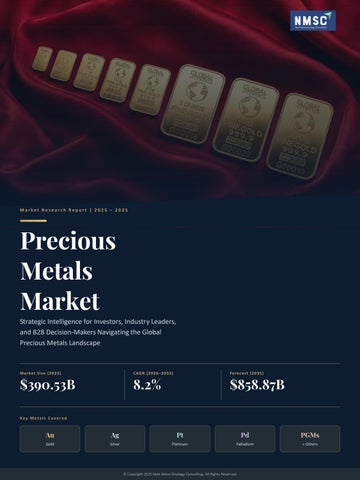
Market Research Report | 2025 – 2035
Precious Metals Market Strategic Intelligence for Investors, Industry Leaders, and B2B Decision-Makers Navigating the Global Precious Metals Landscape
M ar ke t Size (2025)
CAG R (2026 –2 0 3 5)
$390.53B
Fo r e cast (2035)
8.2%
$858.87B
Key Metals Covered
Au
Ag
Pt
Pd
PGMs
Gold
Silver
Platinum
Palladium
+ Others
Industry Overview
Market Landscape & Executive Summary The global precious metals market, valued at USD 390.53 billion in 2025, is forecast to reach USD 858.87 billion by 2035 at an 8.2% CAGR at an 8.2% CAGR driven by green energy transition, technology electrification, institutional investment, and circular supply innovation supply innovation across gold, silver, and platinum -group metals.
Market Size Trajectory (USD Billion) 2025
Metal Type Share (2024)
$390.53B
2026
Gold 46% Silver 28%
$422.56B
PGMs 18% 2028
~$545B
2030
Others 8% ~$635B
Source: NMSC Analysis, 2024
2035
$858.87B Source: Next Move Strategy Consulting (NMSC)
Key Market Insights Market Size & Growth
Gold Dominance
Market valued at $390.53B in 2025, forecast to reach $858.87B by 2035 — a
Gold holds the dominant share with 4,974 tonnes demand in 2024. Acts as
near-doubling driven by structural industrial and investment demand.
central bank reserve, safe-haven, and investment vehicle globally.
Silver Industrial Surge
Circular Economy
Recycled gold supply rose 11% YoY to ~1,370 tonnes in 2024. Secondary supply
Silver industrial demand hit a record 680.5M oz in 2024 (+4% YoY),
from e-waste, catalysts & scrap is becoming mission-critical.
propelled by photovoltaic, AI data centres, and grid infrastructure buildout.
Application Breakdown
48%
22%
18% 8%
Jewelry
Investment
Industrial & Tech
4%
Recycling
Fabrication
Source: NMSC Analysis; Proportional estimates based on primary report data
Analysis Period
Countries
Companies Profiled
Report CAGR
Market Share Data
2025 – 2035
33+
15
8.2%
10 firms
Market Segmentation
Metal Type & Regional Outlook By M e tal Type
R e gio nal O utlo o k (2025 Shar e )
Gold (Au)
Dominant APAC — 47%
Dominant segment — 4,974 tonnes demand in 2024. Central bank reserves, jewelry,
N. America — 25%
& investment-grade safe-haven. Recycled supply +11% YoY (~1,370 tonnes).
Europe — 19%
LATAM — 5% MEA — 4%
Silver (Ag)
High-Growth
Industrial demand hit record 680.5M oz in 2024 (+4% YoY) — driven by photovoltaic, AI data centres, & grid infrastructure. Total demand: 1,164.1M oz.
Platinum Group (PGMs)
APAC
Largest market. China & India lead jewelry + industrial demand.
N. Am.
US ETF inflows, Canadian mining, Mexican silver supply.
EU
UK trading hub, German auto catalysts, Italian luxury.
RoW
MENA gold jewelry, African PGM supply, LATAM primary.
Deficit
Structural deficits forecast through 2025. Critical for hydrogen, fuel cells, & & automotive catalysts. Concentrated supply exposes pricing risk. By Source of Supply
Other Precious Metals
~8% share
Primary Mined Supply
~72%
Secondary Recycled Supply
~28%
Rhodium, iridium, ruthenium — niche but high-value applications in advanced advanced technologies & specialty industrial uses.
Country Leaders
Top Markets
China
India
USA
PV + Electronics
Jewelry & Coins
ETF Liquidity
Germany Auto PGMs
Australia Primary Mining
Pr o duct Fo r m & Str ate gic I m plic atio ns Investment Form
Luxury Form
Industrial Form
Bullion Bars & Coins
Finished Jewelry
Fabricated & Alloys
Largest share by volume. Bullion bars and minted products
Cultural & gifting demand anchors volumes in Asia & Middle
High-purity alloys & fabricated components feed
dominate retail & institutional allocation globally.
East. Italy & India dominate global craftsmanship.
semiconductor, sensor, and catalyst applications across global supply chains.
Strategic Outlook
Growth Drivers & Investment Opportunities The next decade of growth is powered by four structural forces — energy transition electrification, institutional investment flows, supply-chain circularity, and financial innovation through tokenized metals. Cate go r y A
01
Structural Demand Drivers Energy Transition
Mobility & Hydrogen
Electrification & Solar
PGMs in Clean Tech
Silver industrial use hit 680.5M oz in 2024. PV deployment & grid buildout drive
Structural platinum deficit forecast through 2025. Critical for fuel cells, emission
consistent demand growth.
controls & hydrogen economy.
Institutional Capital
Tech & Electronics
ETF & Central Bank Demand
Semiconductor & AI Buildout
Renewed ETF inflows & persistent central bank buying supported record annual gold
Advanced packaging & data center expansion drive demand for high-purity gold &
demand in 2024.
silver in chip production.
Cate go r y B
02
Emerging Investment Opportunities To p O p p o r tu ni t y
Investment Pockets
Recycling & Traceable Supply
E-waste recovery tech
Recycled gold supply grew 11% YoY to ~1,370 tonnes. ESG-driven buyers pay premiums for
ESG provenance platforms
Catalyst recycling hubs
traceable, low-carbon inputs — creating profitable niches in e-waste recovery, catalyst recycling, & provenance certification platforms.
Silver Demand Growth
Tokenized metal funds Specialty high-purity alloys
PV-Driven Silver Demand
Gold Demand Tonnage
+11%
680.5M
4,974t
YoY recycled gold supply uplift in 2024
Ounces consumed by industry in 2024 (+4% YoY)
Global gold demand reached record levels in 2024
K e y In h i b i t o r
Supply Concentration
Geographic concentration of platinum, palladium & silver mining exposes the supply chain to single-jurisdiction disruptions. Long lead times on new mine development & ESG regulatory shifts constrain rapid scaling. Risk mitigation requires long-dated offtake contracts, recycled feedstock, & multi-regional custody diversification.
In v e s t o r Take away
Prioritize jurisdictions with regulatory stability & strong mining infrastructure (NA, Australia, selected Africa) and companies with Tier-One reserves, low operating costs, & integration of recycling capacity. Blend gold, silver & PGM exposure for portfolio resilience.
Competitive Landscape
Leading Companies & Strategic Positioning The competitive arena splits between Tier-One global giants leveraging scale & capital discipline, and specialist producers capturing regional or metal-specific regional or metal-specific niches. M&A, Tier-One reserves, and operational excellence define the leaders.
★
Tie r 1 — G lo bal G iants
Three Industry Leaders
Newmont
Barrick
AngloGold Ashanti
6.8 Moz
+23%
$403M
Record attributable gold ounces in 2024 via Newcrest integration
Proven & probable reserves via Reko Diq resource conversion
Free cash flow in Q1 2025 (+607% YoY); +22% gold output
Str ate gy
Three Winning Plays Strategy 01
Strategy 02
Strategy 03
Tier-One Asset Focus
Aggressive M&A
Cost & ESG Discipline
Majors concentrate capital on long-life, low-cost mines.
Northern Star's $3.28B De Grey takeover unlocks the
Capital allocation discipline, technological innovation,
Divest non-core assets. Protect reserve replacement.
Hemi project — targeting 2.5 Moz/year by 2028–29.
traceability integration, and ESG transparency win mandates.
O the r No table I ndustr y Playe r s Kinross Gold
Agnico Eagle
Gold Fields
PJSC Polyus
Mid-tier global
Top-3 global
South Africa
Russia · Largest reserves
Freeport-McMoRan
Fresnillo plc
Northern Star
First Majestic
Cu-Au diversified
Silver specialist
Australia · M&A active
Silver pure-play
Eldorado Gold
Hecla Mining
Pan American Silver
Harmony Gold
Mid-tier operator
Silver producer
LATAM silver
South Africa
Late st I ndustr y De ve lo pm e nts
SEP 2025
Barrick's Fourmine PEA — Long-life production outlook of 600–750 koz/yr at very low costs (~$650–750/oz), reinforcing Tier-One pipeline.
APR 2025
Northern Star–De Grey $3.28B deal completed — unlocks the high-grade Hemi project, with production target of 2.5 Moz/year by 2028–29.
FEB 2025
Barrick reserves +23% after Reko Diq resource conversion — establishes a major Tier-One copper-gold flagship project.
Your Strategic Partner in Precious Metals Intelligence
Thank You. Connect with us for in-depth market intelligence, strategic guidance, and tailored research support.
Get the Full Report
Contact Information
In-Depth Precious Metals Market Report
Official Website
www.nextmsc.com Contact Number
+1 857 758 5017 Email
info@nextmsc.com Headquarters
Next Move Strategy Consulting Global Market Intelligence & Strategic Advisory
Full Report Online nextmsc.com /report /precious-metals-market-mc3913
nextmsc.com /report /precious-metalsmarket-mc3913
Follow Us — Stay Updated on Market Intelligence LinkedIn
YouTube
X (Twitter)
Ready for Deeper Insights?
Request a customized research consultation today