MONTHLY STAT PACK
STAT
Data through August 31, 2026
PACK
The data found within the ERA Shields Real Estate Stat Pack is based on information from eLevate MLS. This content is deemed reliable; however ERA Shields Real Estate does not guarantee its accuracy. Data maintained by eLevate MLS does not reflect all real estate activity in the market. Additional sources include the El Paso County Assessor and Pikes Peak Regional Building.
The intent for providing information to you is to educate you on the current local real estate market so you can better make decisions for you and your family. Real estate markets vary from city to city as well as neighborhood to neighborhood. You will find factual data within this document from which you may draw your own conclusions.
QUICK FACTS ➢
Mortgage rates were elevated but steady at around 6.7% for the month
➢
Average active listings for the month were 3,234, compared to 2,979 (up 8%)
➢
Total new listings for the month were 1,130, compared to 1,151 (down 2%)
➢
Sales for the month were 726 units, compared to 824 (down 12%)
➢
Average sales price for the month was $567,160 down from $567,864 (flat)
➢
Average median sales price for the month was $478,450 down from $483,050 (down 1%)
➢
Average days on market for sold homes was 55 for the month, up from 46 days
➢
Single family permits YTD were 2,084 compared to 1,989 (up 4%)
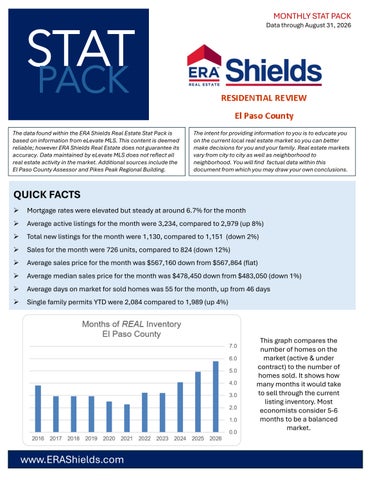
This graph compares the number of homes on the market (active & under contract) to the number of homes sold. It shows how many months it would take to sell through the current listing inventory. Most economists consider 5-6 months to be a balanced market.
www.ERAShields.com
Price Range Comparisons Single Family & Patio Homes This chart is ideal for helping you determine how competitive certain price ranges are. If you are considering selling your home, this information is just one tool you can reference to assist you with strategic pricing. As a buyer this data is helpful in creating a strategy for an offer. If you have questions on how to properly use this data, feel free to contact me.
PRICING TOOLS
SINGLE FAMILY/PATIO - EL PASO COUNTY ONLY List Price
Actives
Under Contract
Solds
Days on Market
Avg SP/LP
REAL Inventory
$0 to $299,999
102
56
38
56
99.0%
4.2
$300,000 to $399,999
511
230
136
46
99.6%
5.4
$400,000 to $499,999
882
275
223
50
99.5%
5.2
$500,000 to $599,999
565
143
125
53
99.1%
5.7
$600,000 to $699,999
363
84
74
60
99.1%
6.0
$700,000 to $799,999
247
49
45
72
98.7%
6.6
$800,000 to $899,999
170
49
26
86
98.8%
8.4
$900,000 to $999,999
101
19
23
65
98.9%
5.2
$1 mil to $1.25 mil
118
25
18
69
98.1%
7.9
$1.25 mil to $1.5 mil
65
18
11
45
96.6%
7.5
$1.5 mil to $1.75 mil
35
7
4
79
92.5%
10.5
$1.75 mil to $2 mil
24
4
4
24
97.3%
7.0
$2 mil and above
72
5
6
83
94.5%
12.8
This graph shows the total number of Solds for the month. Comparing this data over the past 10 years helps determine the current trends in the market.
www.ERAShields.com
MONTHLY DATA
This graph shows the total number of listings on the market and new listings coming on the market during the same month.
This graph shows the total number of Solds for the month. Comparing this data over the past 10 years helps determine the current trends in the market.
www.ERAShields.com
MONTHLY DATA
The Average & Median Sales Prices for the same period over the past 10 years. This graph illustrates the current health of the local real estate market.
The price range a home is within dictates the odds of selling in the next 30 days. Generally the lower the price, the more likely it will sell.
www.ERAShields.com
SUMMARY Colorado Springs Real Estate Market Update - August 2026
The Colorado Springs housing market showed some real signs of slowing in August as mortgage rates remained stubbornly high, although relatively flat. Active listings increased 8.5% from last year, while sales for the month fell nearly 12%. Inventory jumped 23%, reaching almost six months—the highest level we've seen in quite some time and a clear indication that buyers are gaining more leverage in the market. Despite the decline in last month’s sales, year-to-date sales remain slightly ahead of last year. Home prices continue to be resilient, with the average sales price essentially flat at $567,000, while the median price declined less than1% to $478,450. Another indicator worth watching is pending sales. Under contracts fell 11% in August, marking the second consecutive month of double-digit declines. This suggests the slower sales activity we saw in August could continue into the fall, particularly if mortgage rates remain elevated. Overall, the market is shifting toward a buyer’s market. Buyers have more choices and negotiating power, while sellers are facing increased competition and longer marketing times. The direction of mortgage rates will remain the key factor heading into the fall market.
The historical average rate of a 30-year fixed rate mortgage is 7.71%
www.ERAShields.com