MONTHLY STAT PACK Data through November 2025
RESIDENTIAL REVIEW
El Paso County The data found within the Stat Pack is based on information from the Pikes Peak REALTOR® Services Corporation (RSC) or it’s PPMLS. This content is deemed reliable; however, RSC, PPMLS and ERA Shields Real Estate do not guarantee its accuracy. Data maintained by RSC does not reflect all real estate activity in the market. Additional sources include the Colorado Springs Business Alliance, El Paso County Assessor, and El Paso County.
Welcome to the ERA Shields Stat Pack. The intent for providing information to you is to educate you on the current local real estate market so you can better make decisions for you and your family. Real estate markets vary from city to city as well as neighborhood to neighborhood. When the national media reports how the real estate market is doing, it is reporting on national numbers and it is likely very different from how your neighborhood is performing. You will find factual data within this document from which you may draw your own conclusions. We include a brief summary on the last page.
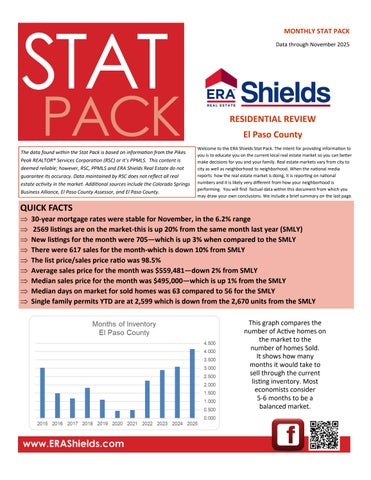
QUICK FACTS 30-year mortgage rates were stable for November, in the 6.2% range 2569 listings are on the market-this is up 20% from the same month last year (SMLY) New listings for the month were 705—which is up 3% when compared to the SMLY There were 617 sales for the month-which is down 10% from SMLY The list price/sales price ratio was 98.5% Average sales price for the month was $559,481—down 2% from SMLY Median sales price for the month was $495,000—which is up 1% from the SMLY Median days on market for sold homes was 63 compared to 56 for the SMLY Single family permits YTD are at 2,599 which is down from the 2,670 units from the SMLY This graph compares the number of Active homes on the market to the number of homes Sold. It shows how many months it would take to sell through the current listing inventory. Most economists consider 5-6 months to be a balanced market.
Price Range Comparisons Single Family & Patio Homes
PRICING TOOLS
This chart is ideal for helping you determine how competitive certain price ranges are. If you are considering selling your home, this information is just one tool you can reference to assist you with strategic pricing. As a buyer this data is helpful in creating a strategy for an offer. If you have questions on how to properly use this data, feel free to contact us.
Determine how your price range is performing
List Price $0 to $299,999
SINGLE FAMILY/PATIO - EL PASO COUNTY ONLY Actives Under Contract Solds Days on Market Avg SP/LP 57 46 31 51 93.6%
Inventory 1.8
$300,000 to $399,999
435
219
115
54
99.0%
3.8
$400,000 to $499,999
680
232
177
52
99.3%
3.8
$500,000 to $599,999
465
151
114
65
98.7%
4.1
$600,000 to $699,999
294
72
72
93
98.8%
4.1
$700,000 to $799,999
207
48
37
81
98.1%
5.6
$800,000 to $899,999
126
32
24
65
98.5%
5.3
$900,000 to $999,999
72
19
10
52
98.9%
7.2
$1 mil to $1.25 mil
76
18
19
64
97.3%
4.0
$1.25 mil to $1.5 mil
59
11
9
64
98.2%
6.6
$1.5 mil to $1.75 mil
28
5
4
89
96.8%
7.0
$1.75 mil to $2 mil $2 mil and above
27 45
3 7
2 3
256 61
85.0% 98.0%
13.5 15.0
This graph shows the total number of Solds for the month. Comparing this data over the past 10 years helps determine the current trends in the market. www.ERAShields.com
QUARTERLY DATA MONTHLY DATA Comparing data for the past 10 years Comparing data for the past 10 years
This graph shows the total number of active listings on the market and new listings coming on the market for the same period.
The correlation between new listings and solds helps assess the health of the market. A small gap indicates a Buyer’s Market whereas a large gap indicates a Seller’s Market. www.ERAShields.com www.ERAShields.com/pages/MarketConditions
QUARTERLY DATA Comparing data for the past 10 years
This graph shows the Average & Median Sales Prices for the same period over the past 10 years. Sales prices are the true “score” of the market.
The price range a home is within dictates the odds of selling in the next 30 days. Generally the lower the price, the more likely it will sell. www.ERAShields.com
SUMMARY Colorado Springs Real Estate Market Update – November 2025 November continued the cooling trend we’ve been seeing in the Colorado Springs housing market, with slower sales and growing inventory setting the tone.
•
Active Listings: Up 20% year-over-year, keeping buyer options plentiful.
•
Sales: Just 617 homes sold compared to 692 last November, reflecting a clear slowdown.
•
Inventory: Up a significant 34%, now sitting at over 4 months of supply.
•
Average Sales Price: Down 2% to $559,000.
Mortgage Rates: Down about ½ point compared to last November, offering some payment relief for buyers. Even with lower mortgage rates, economic uncertainty and the government shutdown weighed heavily on the market in November, slowing buyer confidence and overall activity. For Buyers: This is arguably the best buying window we’ve seen in the past year — lower rates, softer prices, and plenty of inventory to choose from. For Sellers: The bar is higher. If you want a real shot at getting under contract within 30 days, your home must be priced right and in excellent condition. Overpricing right now is a fast track to sitting on the market.
The average rate of a 30-year mortgage since 1971 is 7.71%
www.ERAShields.com