
2 minute read
Installed Power Capacity from Different Sources


QUARTERLY ROOFTOP SOLAR INSTALLATIONS IN INDIA 2017-2021
in MWs
Advertisement

Source: MNRE, CEA EQ iSearch
INSTALLED POWER CAPACITY FROM DIFFERENT SOURCES
Renewable capacity additions continue to increase at a rapid pace in India, accounting for approximately 25 percent of India’s power capacity mix at the end of June 2021. India’s total installed power capacity stood at over 384 GW at the end of June 2021, with renewables accounting for 96.96 GW making up 25 percent, compared to cumulative renewable energy installations of 92.5 GW at the end of Jan 2021, which represented a 4.8 percent increase.
INDIA INSTALLED POWER MIX AS OF JUNE-2021
Source: CEA EQ iSearch
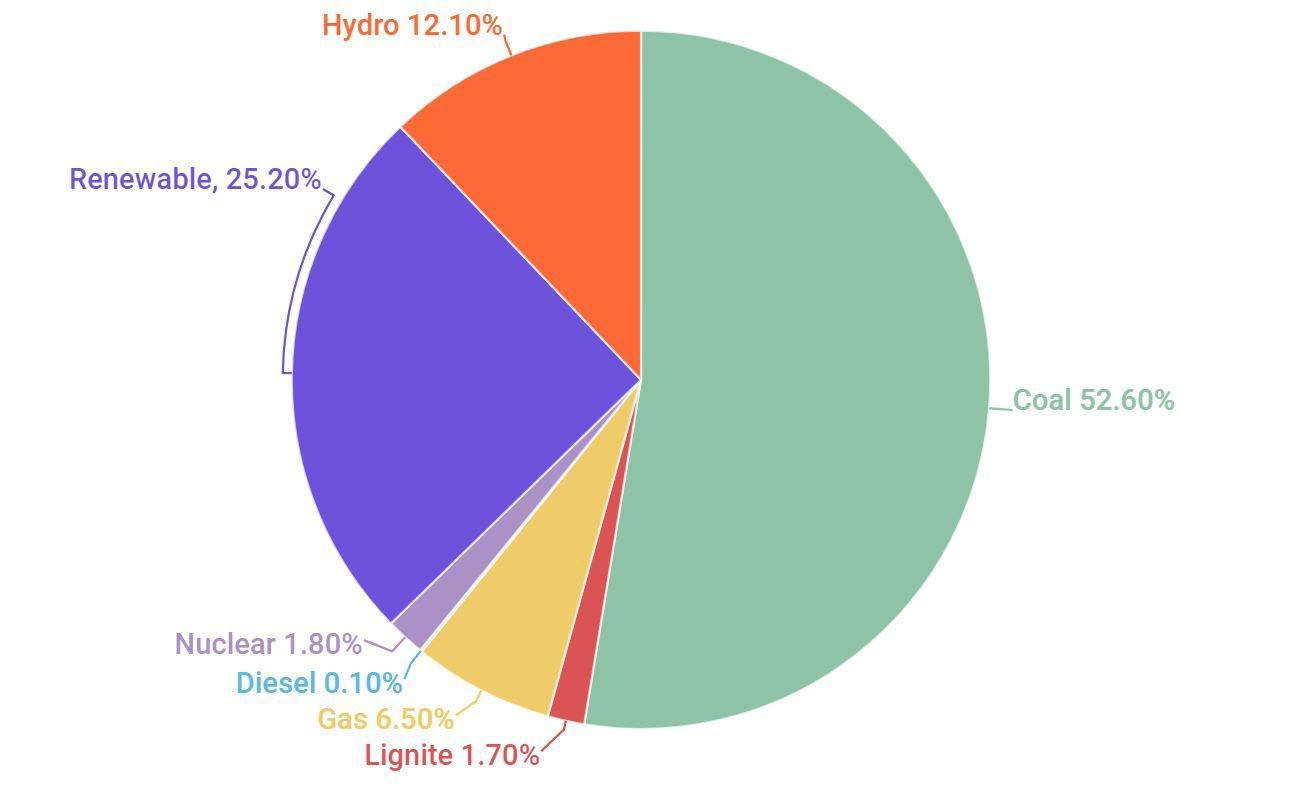

Solar power accounted for approximately 42.3 GW of installations, which is 11 percent of the total installed power capacity. The share of solar in the installation mix grew from 10.28 percent in Jan 2021 to 11 percent in June 2021. Among the renewables, solar accounted for approximately 44% percent of the installed capacity. Wind accounted for 39.5 GW of the total installed power capacity and nearly 10.3 percent of the overall power capacity mix as of June 2021. Due to a lockdown in Q1 2021, this implies a slight rise from the 39.5 GW of installed capacity overall power capacity mix by June 2021. Hydro power’s cumulative installations stood at 46.3 GW, making up 12.1 percent of India’s total installed capacity, a decline compared to its share in 2020.
INDIA INSTALLED POWER MIX BY REGION
Source: CEA (June2021) EQ iSearch

Small hydro had installed over 4.79 GW, and representing 1.2% of the overall power mix capacity at the end of June 2021. The share of nuclear was remaining stable during the first quarter of 2021 which represents 1.8% of the total power mix installed capacity by June 2021, with no capacity added during first six months of 2021. Thermal power (which includes coal, lignite, gas, and diesel) is still the significant source of energy in the country - with its cumulative installations reaching 234 GW, representing 60.9 percent of the total installed power capacity. Coal accounted for a dominant share of the mix, with 52.6 percent of the total installed power capacity, followed by natural gas at 6.5 percent, lignite at 1.7 percent, and diesel with a 0.13 percent share. However, thermal power’s share in the overall power mix is gradually declining as the government is shutting down old thermal plants especially coal, and moving towards the non-conventional source of energy.


