
SUMMER/FALL 2025


With so much information, data and advice coming at you from all directions, reliable analysis and guidance is more important than ever.
That’s why Entegra publishes the Cost Outlook report.
The market data analysis across key commodities, macroeconomic conditions, packaging and transportation gives you a full picture of the main areas impacting your cost of goods and services.
As a business performance improvement company, Entegra leverages our relationships with suppliers and manufacturers, as well as our deep subject matter expertise, to help you plan strategically and grow — even in a challenging economic environment.

Paul McArdle Chief Executive Officer, North America Entegra
Please review the report and reach out to an Entegra representative to talk through how current supply chain developments may impact your business. Helping hospitality-driven businesses make decisions about their purchasing and their day-to-day operations is at the heart of what we do.
Take advantage of all the ways Entegra can add value.
• Entegra PurchasingIQ: Gives you a 360-degree view of your procurement spend.
• Entegra Shopping Assistant: This integrated AI shopping tool – exclusive to Entegra – helps you find the best pricing while shopping on your distributors’ e-store.
• Entegra Culinary Consulting: This robust culinary service can partner with you to reengineer your menus, use ingredients more creatively, efficiently, and affordably, and improve your culinary operations overall.
Thank you for placing your trust in Entegra to deliver cost-saving programs, expert advisory services, and timely market guidance. We value your partnership and are always here to provide personalized solutions tailored to your unique needs. Please don’t hesitate to reach out to an Entegra representative for support. And if you’re not an Entegra client – we’d love to speak with you!
Welcome to the fifth edition of the Entegra Cost Outlook.
There is a lot to talk about since our Spring/Summer 2025 issue. We’ve been actively monitoring unprecedented proposed and implemented changes to federal policies. The primary concern when it comes to our supply chain is the new tariffs affecting much of the world. My team closely monitors these actions and is well-positioned to respond given our wide network of established alternative suppliers that we can leverage. Work is already underway to quickly adjust ingredients, recipes and menus – if needed – to mitigate disruption to the business and offset some of the increased cost.
The data provided within the Entegra Cost Outlook is a valuable resource we encourage you to reference regularly to proactively boost your bottom line.
We closely research and implement all data sources available to us for forecasting, planning, etc. Please keep in mind that while the content provided within this resource is thoroughly analyzed, we cannot make guarantees as market fluctuations are unpredictable.
Thank you for your partnership and continued trust in the Supply Management team.

David Kourie Chief Purchasing Officer and Senior Vice President Supply Management
There are multiple indices used to measure and report on inflation.
Urban Consumers
The Consumer Price Index for All Urban Consumers (CPI-U) measures changes in U.S. consumer prices based on a representative basket of goods and services.
• CPI-U covers 93% of the U.S. population based on location and population size. This index only measures inflation as experienced by consumers, not producers.
• This basket of goods and services is compiled by the Bureau of Labor Statistics, which tracks 94,000 prices monthly to assess inflation for more than 200 categories of products and services.
• Broad consumer spending categories like food, energy, apparel and services include subcategories tracking inflation for everything from apples and premium unleaded gasoline to men’s underwear and funerals.
The Consumer Price Index (CPI) can be further broken down into Food at Home (FAH) and Food Away from Home (FAFH).
• The CPI for Food at Home (FAH) includes categories such as cereals and bakery products, meats, poultry, fish, eggs, dairy, fruits and vegetables, and beverages that are designed for home consumption. It also includes products that are obtained through traditional food shopping outlets such as grocery stores, convenience stores and supercenters.
• This index covers the “sale of food meant for home or off-site consumption” — food at home.
• The CPI Food Away from Home (FAFH) includes full-service restaurants, limitedservice restaurants, drinking places, hotels, motels, retail stores, vending machines, recreational places, schools and colleges.
• This index covers the “sale of food meant for immediate consumption” — generally onsite and away from home.
This index resembles a CPI and reflects changes over time. However, instead of retail prices, the PPI provides a measure of the average prices paid to domestic producers for their output.
• Think... “industry,” “farm” and “wholesale” instead of individual consumer.
• PPIs are reported for nearly every industry in the goods-producing sector of the economy.
• PPI is typically more volatile than CPI, as price volatility decreases as products move from farm to wholesale to retail.
• CPI typically lags movements in the PPI.
When reporting on inflation, Entegra uses a blended approach from all indices designed to cover all various Entegra contract types and segment-specific requirements.
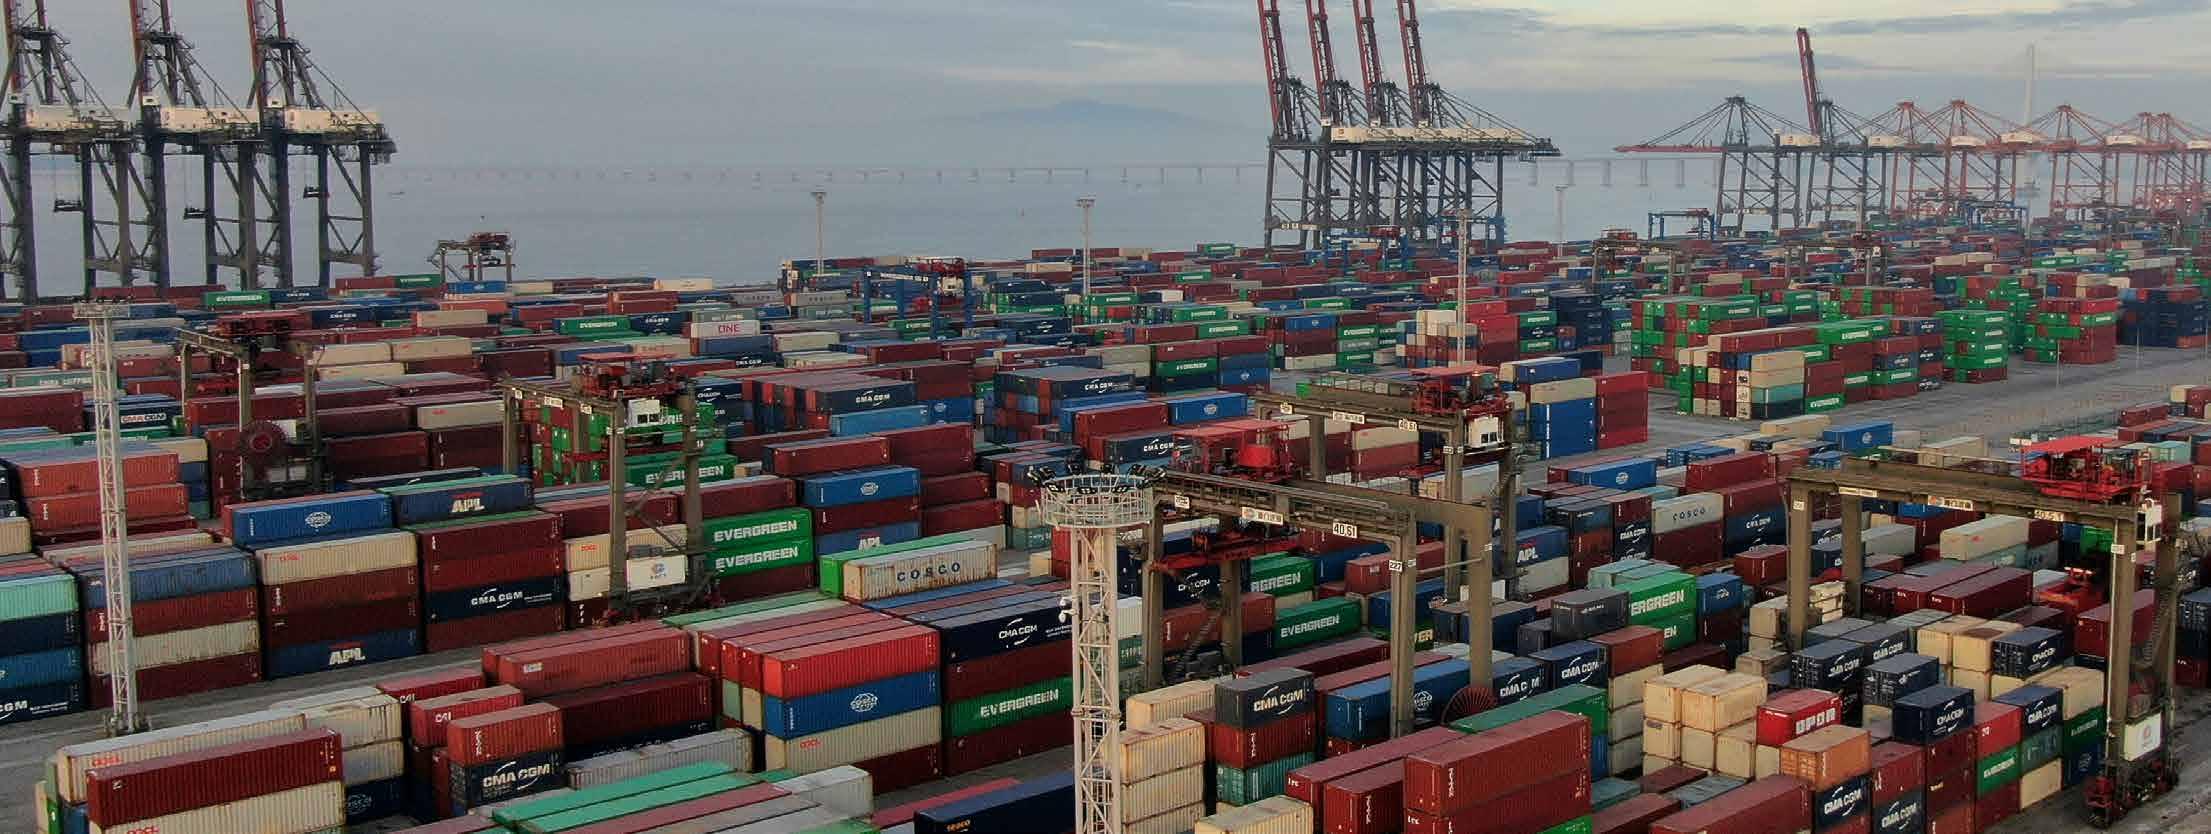
The current administration has announced tariffs on a broad range of goods, applying to most of the countries that the U.S. trades with. Per the White House, the intent of the tariffs is to “level the playing field” on trade, revitalize U.S. manufacturing, use as a negotiating lever in lieu of sanctions, and to help pay for the expected tax cuts the current administration has promised. At this point, there is no timetable for how long they will be in effect.
Most countries will face a minimum 10% tariff on products exported to the U.S. A key exception to the new tariffs is imports from Canada and Mexico for most food-related goods they export. Consequently, a larger disruption of the supply chain for fruits, vegetables, and other important goods has been averted for now. One exception to this is tomatoes from Mexico, which will face a 21% anti-dumping duty beginning July 14.
The most dramatic impact could be on trade with China. While tariffs jumped to a cumulative 245% in April, a 90-day pause was agreed upon in May with the U.S. reducing tariffs from 145% to 20% and China reducing their retaliation tariff from 125% to 10%. Negotiations are ongoing with the expectation that an agreement will be reached by August 12th, the end of the current 90-day pause.
The potential impact from the Chinese-U.S. tariffs is that products the U.S. would ordinarily export to China will decline in price. Meanwhile products that the U.S. relies on China for will rise in price or potentially become unavailable. The U.S. exported $25 B in agricultural products during 2025, including $12 B in soybeans and $3 B worth of meat while agricultural imports from China totaled $6 B, scattered across a wide range of items.
The immediate consequence of U.S. tariffs will be to increase the price for a wide array of consumer food products for which the U.S. depends upon imports – these include coffee, cocoa, olive oil, and lean beef. The broader economic effects could include job losses and reduced GDP growth. While the tariffs aim to boost domestic manufacturing, experts suggest that building up industries to meet demand could take 3-5 years.
• The U.S. economy is decelerating due to the forthcoming imposition of tariffs on goods imported into the U.S.
• Consumer spending remains steady, but a decline in consumer confidence sets the stage for slower spending in the coming months.
• The rate of consumer inflation may be bottoming out as the impact of impending tariffs is expected to outweigh the deflationary impact of slower U.S. and world economic growth.
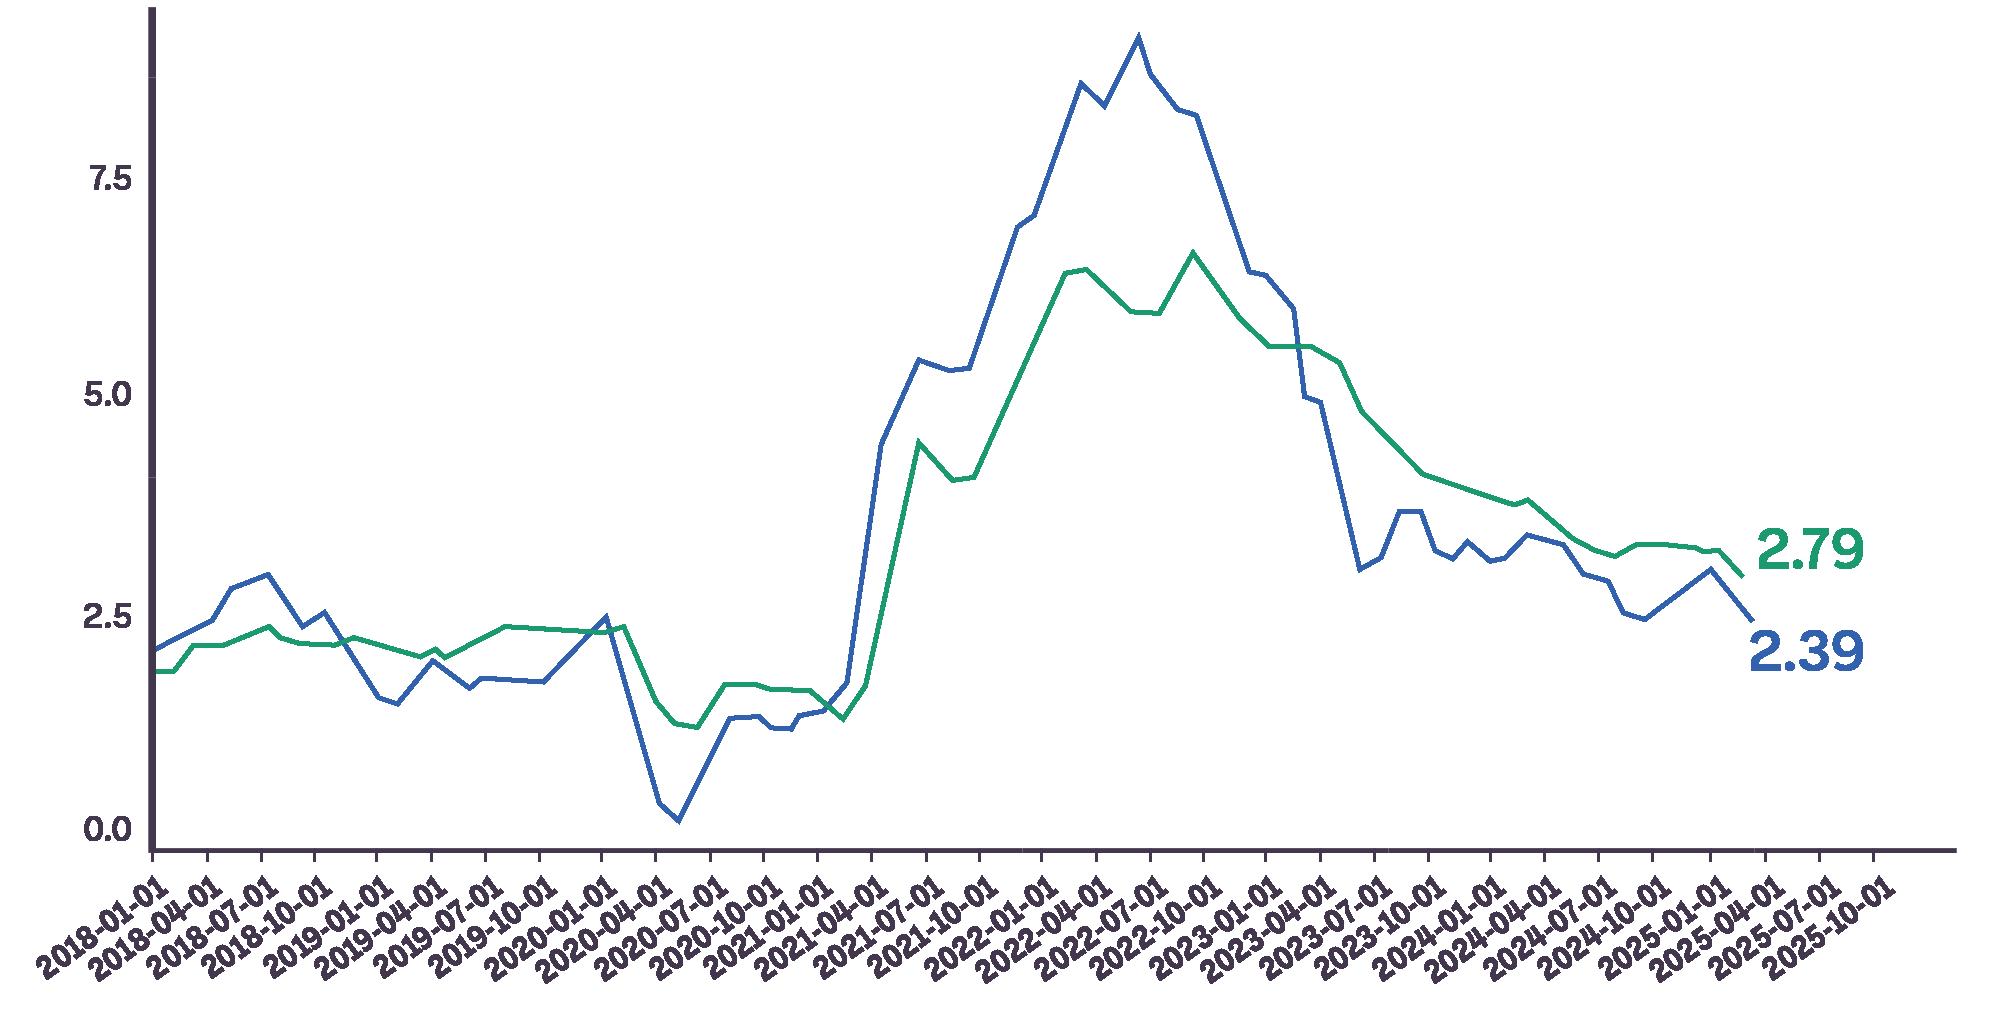
• In March 2022, the CPI rose by 2.4% vs. a year ago, led by a 10% decline in gasoline prices.
• Consumer food prices are also edging higher, rising by 3.0% during 2025.
• Wholesale food prices (PPI-Food) are also rising, up 3.6% in March 2025.
• Both the CPI and PPI for food are rising primarily due to higher prices for eggs, beef and chicken breast.
• Overall inflation rates are expected to rise to a 3-5% range if current tariff policy remains in place.
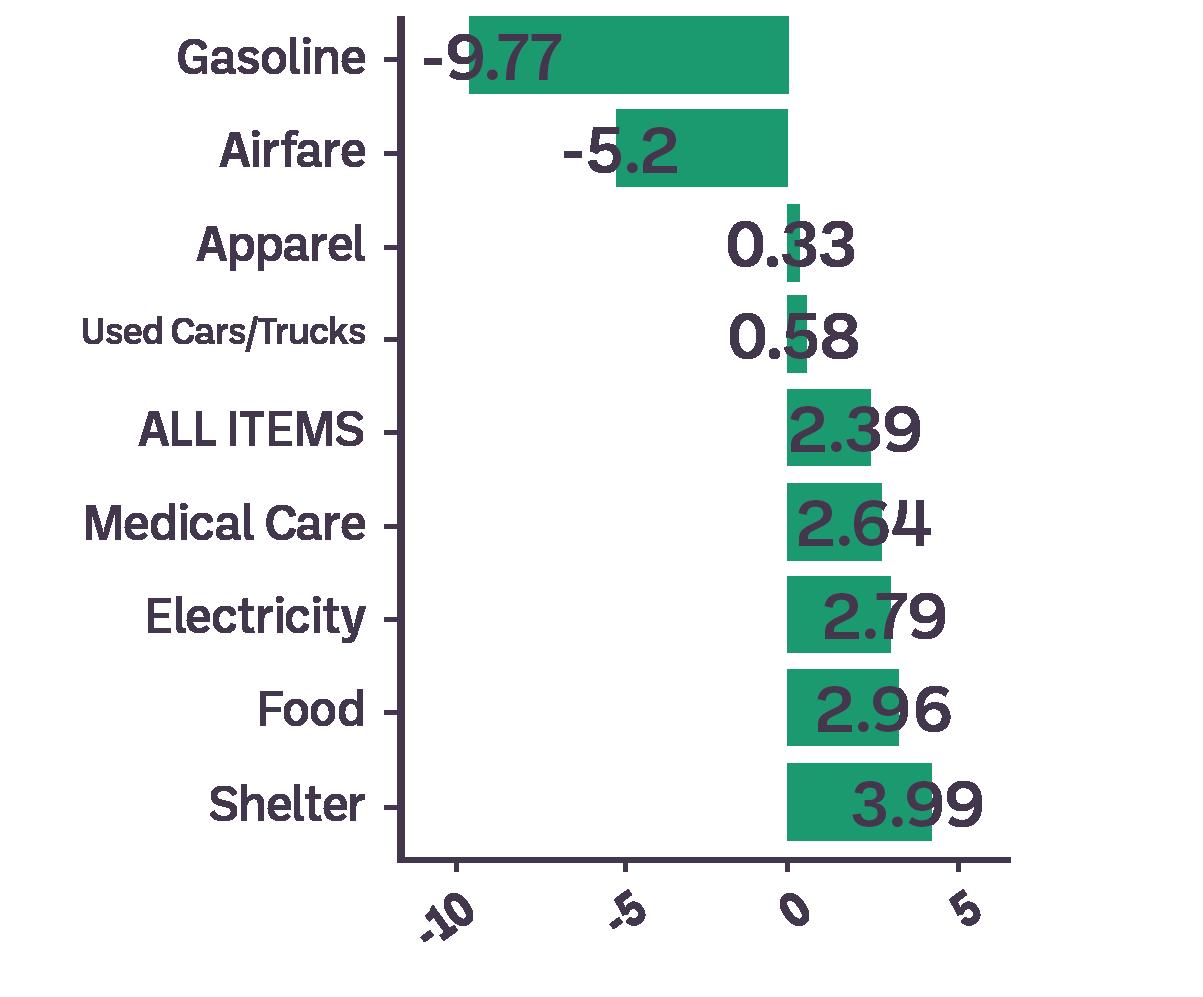
Changes in tariff policy will change the prospects for global economic growth, and thus the outlook for prices. Additionally, OPEC production policy will also be a key driver.
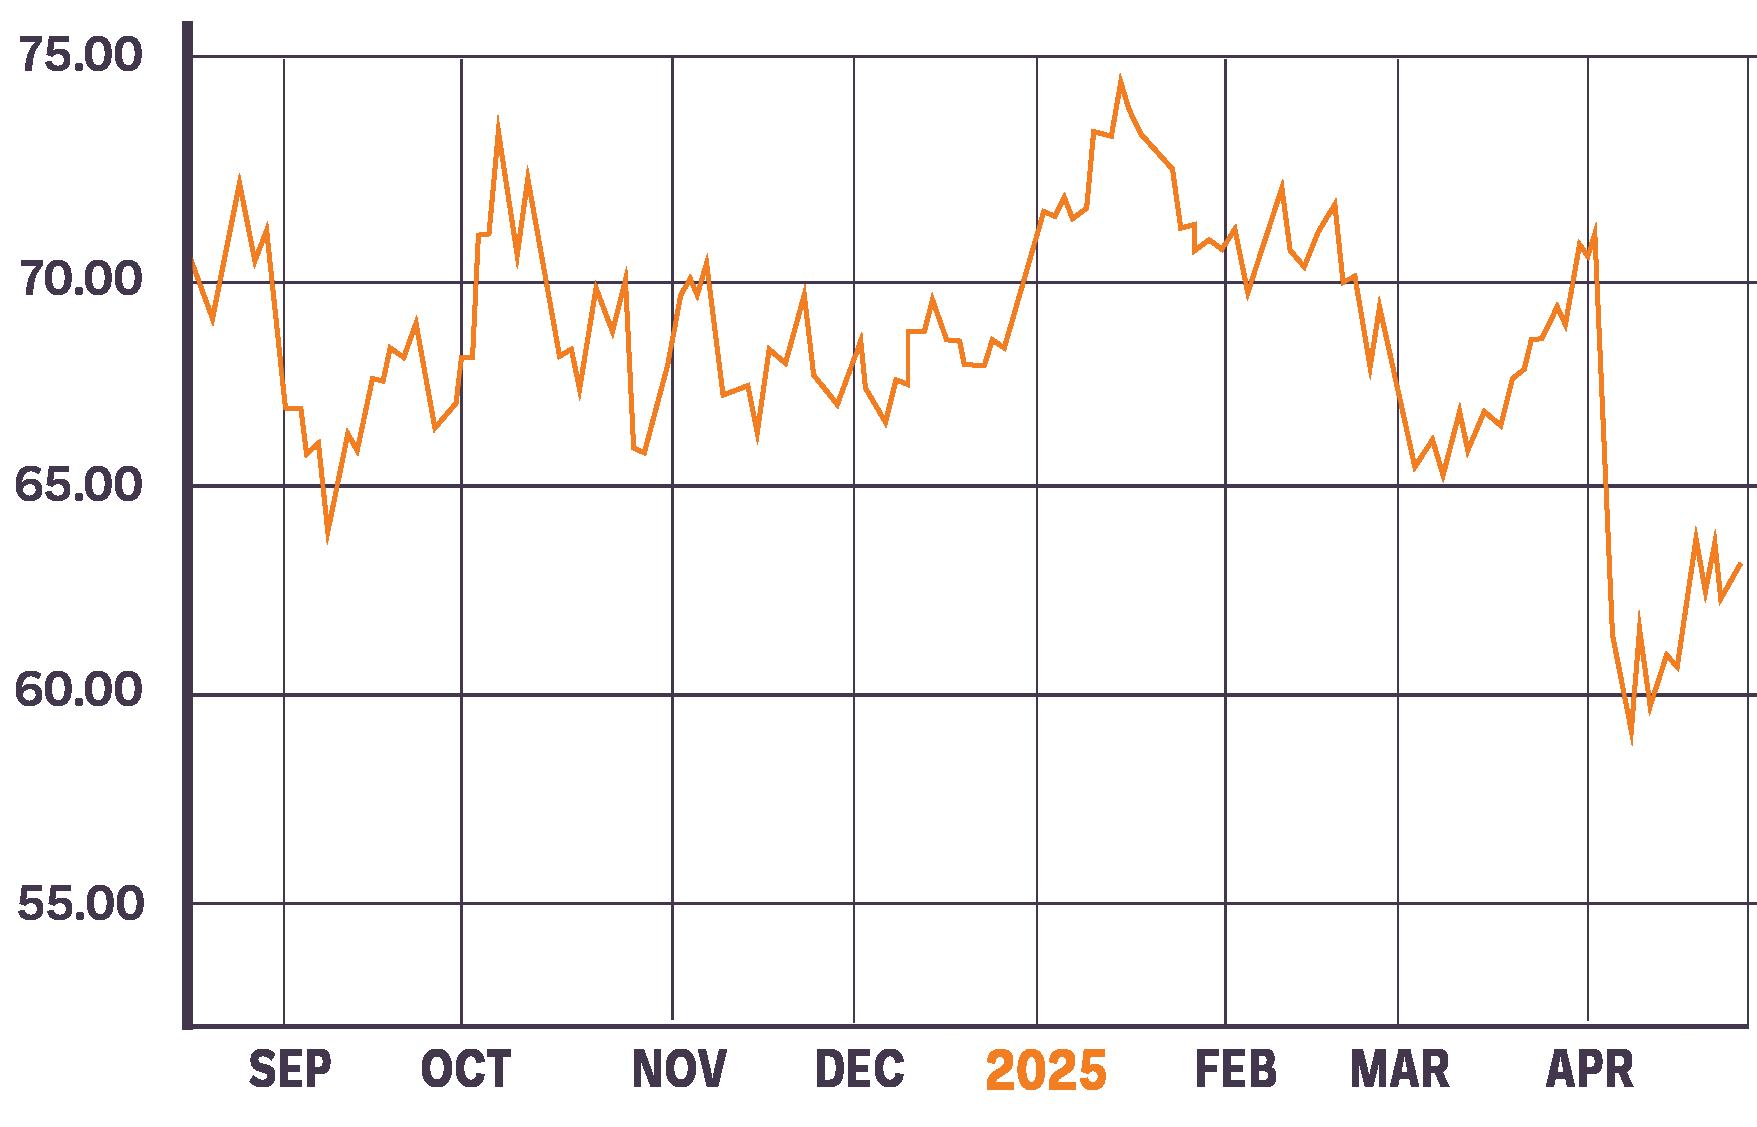
The world crude market is extremely volatile – the price of crude varies by more than $25/barrel in any given year. Changes in energy costs have a dramatic impact upon commodity markets as well as the health of the U.S. economy. The U.S. consumer spends nearly $500 million annually on gasoline, and thus changes in the price of gasoline can have a dramatic impact upon consumer spending.
The combination of the dramatic shift in the U.S. tariff policy, as well as expanded production from OPEC countries, has led to a supply/demand imbalance in global energy markets. April 2025 crude oil prices dropped by more than $10/BB, falling from the mid $70s into the low $60s.
• Crude oil prices are expected to remain mostly in a $58-68 range over the next year.
• Retail gasoline prices have declined from $3.80/ gallon in April 2024, down to $3.20/gallon in recent months.
• On-road diesel fuel prices have declined to a 3-year low of $3.60.
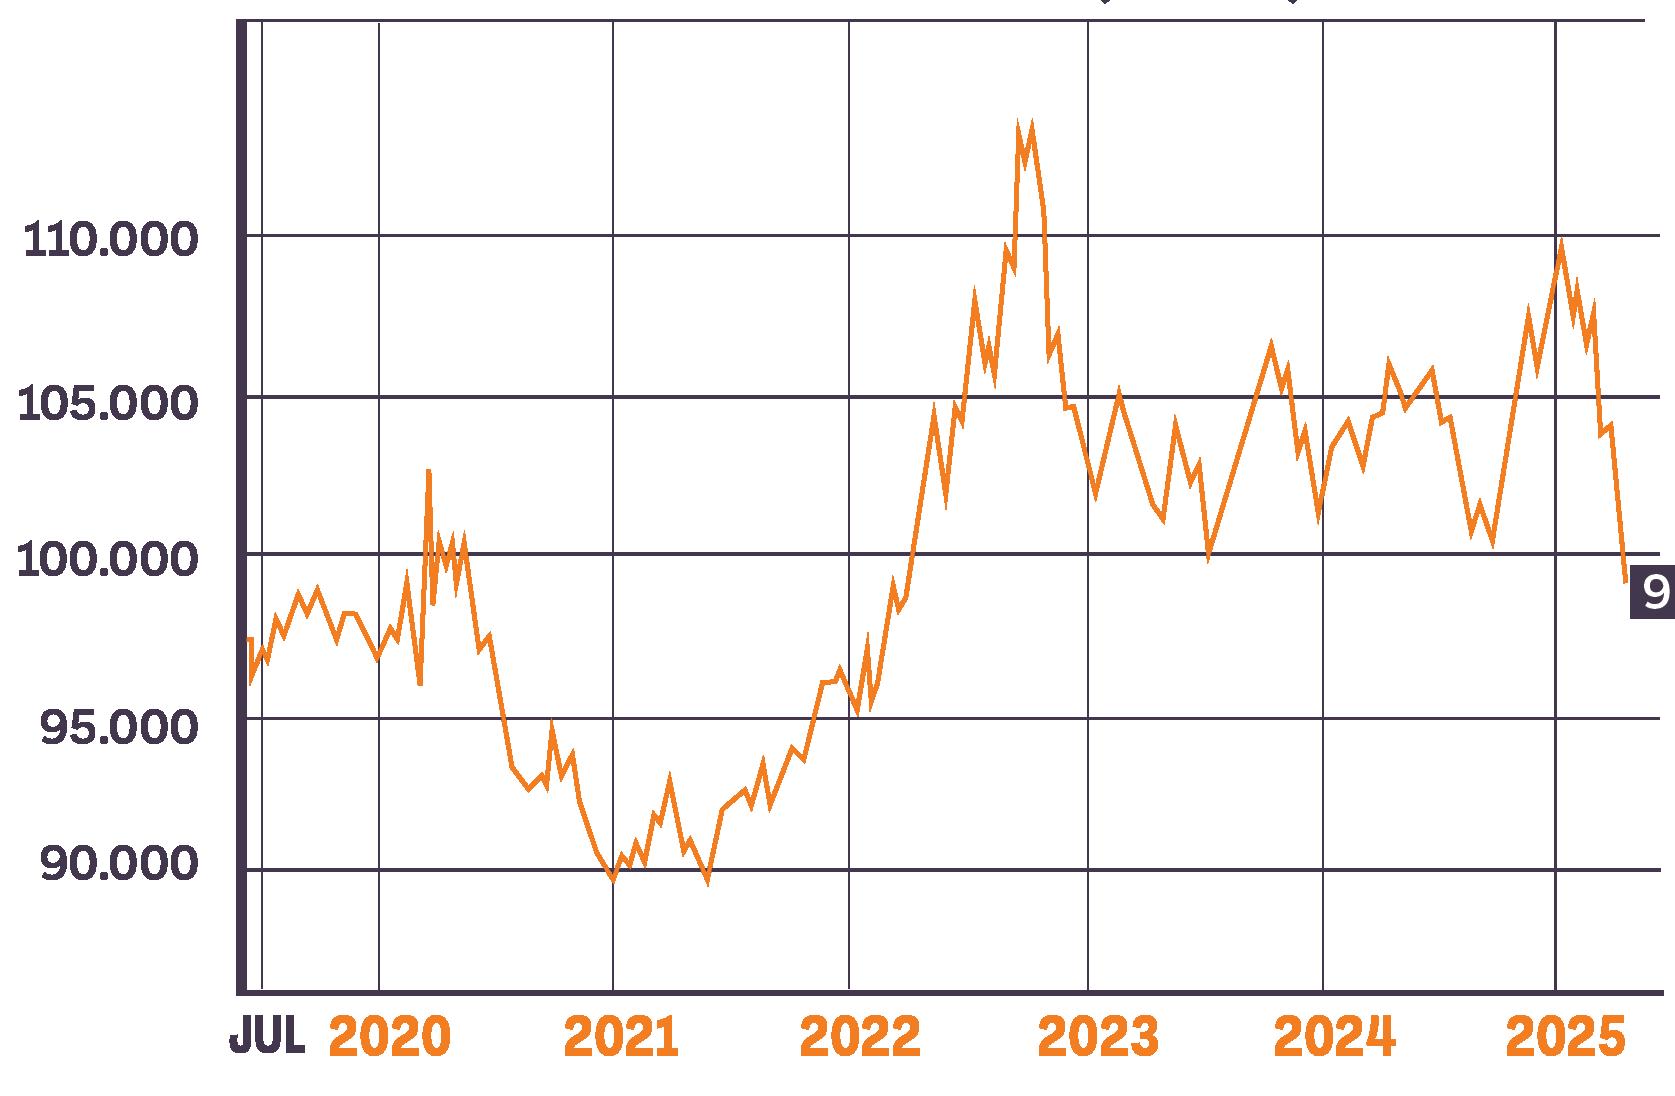
The U.S. dollar index rose sharply after the 2024 Presidential election but has now fallen by more than 10%. The weakness over the past 90 days is in part due to gyrations in federal policy on tariffs and concerns over leadership at the Federal Reserve.
Traditionally, changes in the value of the U.S. dollar will (over time) impact inflation rates – a “strong” U.S. dollar tends to be deflationary, while a “weak” U.S. dollar tends be inflationary.
There are several reasons why the value of the U.S. dollar can affect commodity prices:
• When the value of the U.S. dollar strengthens, it can make commodities (in U.S.$) more expensive for buyers using other currencies; this can reduce demand for commodities and put downward pressure on prices.
• Conversely, when the value of the U.S. dollar weakens, it can make commodities (in U.S.$) relatively cheaper for foreign buyers which can increase demand and put upward pressure on prices.
The inflationary impact of changes in the value of the U.S. dollar is largely being superseded by tariff policy – the imposition of tariffs on countries exporting to the U.S. has a more meaningful and direct impact upon the price paid for products imported into the U.S. Thus, while the value of the U.S. dollar is a relevant economic indicator, the overall inflation rate in the U.S. for goods and services can be expected to be driven by tariff policy over the coming months and years.

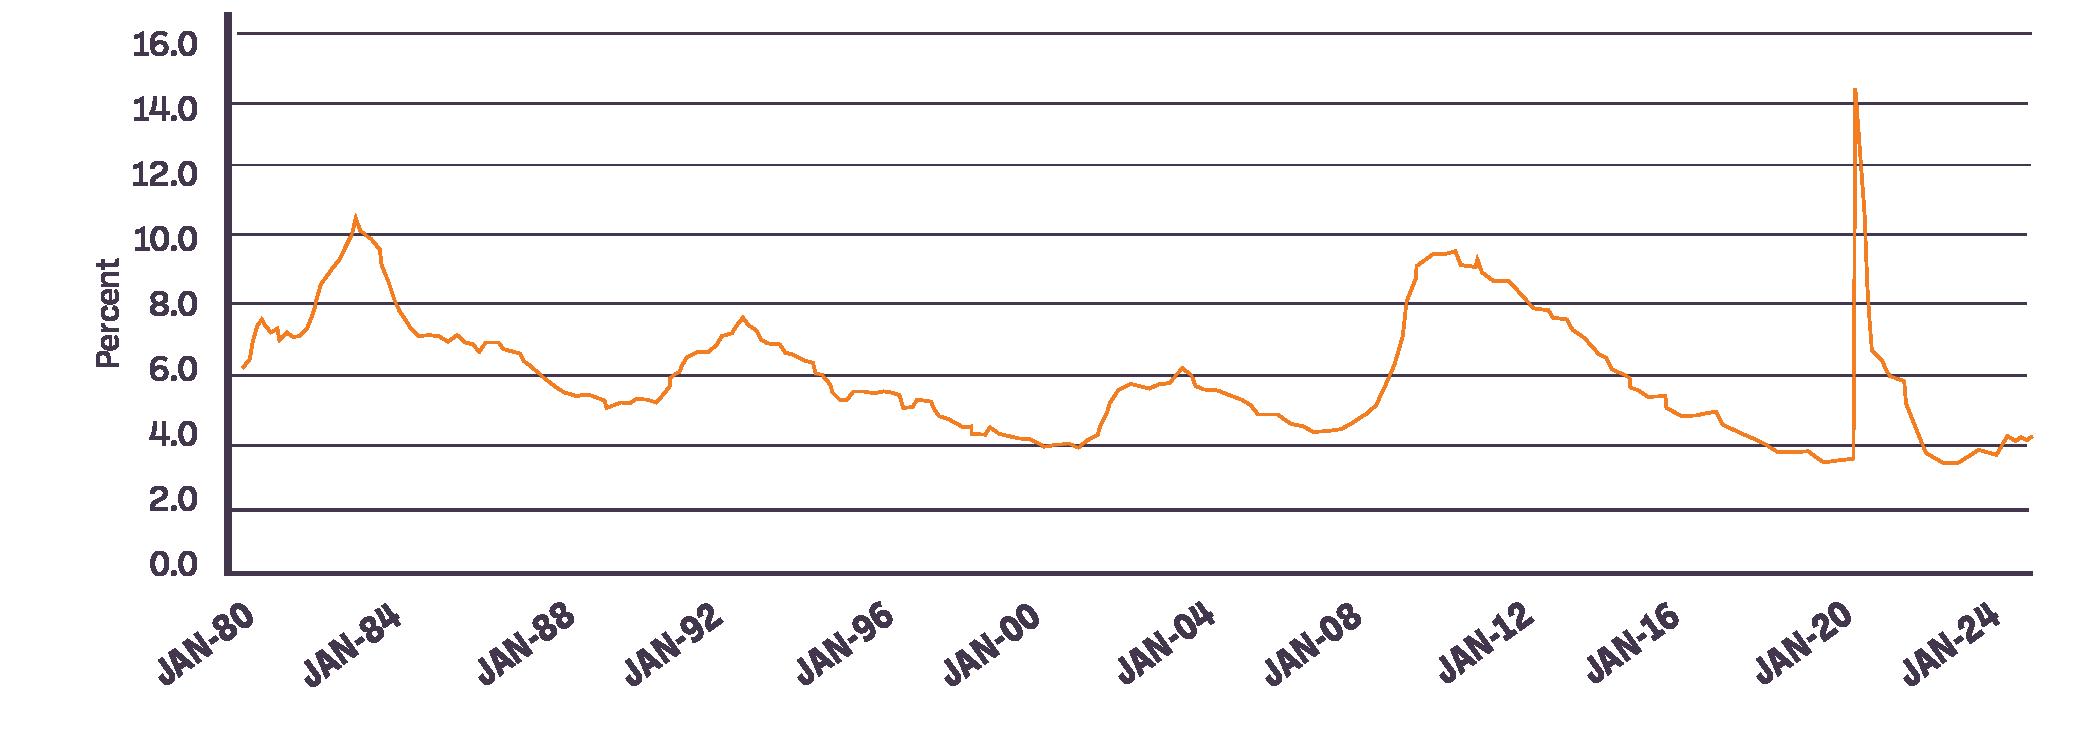
Due primarily to demographic trends, availability of labor in the U.S. and worldwide is going to be a challenge that will persist for the foreseeable future. Despite rising wages, the ability to track and retain employees will be a key challenge confronting businesses in the years ahead.
• Job growth through March 2025 did not show any sign of slowing – over the past 12 months, the U.S. economy has added a relatively strong 160K jobs per month.
• The U.S. unemployment rate has remained low, currently at 4.2%.
• If the U.S. economy falls into a recession, job growth is likely to turn negative and the U.S. unemployment rate would be expected to gravitate toward 5%.

• Immigration policy in the current administration appears to have taken a “back seat” to tariff policy but could dramatically alter labor availability later in 2025 and beyond.
• New initiatives imposed by the current administration will force some changes for food companies and may ultimately have a more meaningful impact upon food manufacturing, distribution and consumption.
• Tightness in the U.S. labor market should ease with a slowing U.S. economy.
• A new Farm Bill has been delayed and is more likely to be delayed until 2026.
· Limited impacts upon food prices are expected from Farm Bill deliberations.
• Geo-political tensions cannot be ignored and could have an adverse impact upon the U.S. and global economies.

• Based on the January 2025 Cattle Inventory report, the dairy cow and replacement heifer inventory remains tight.
· Replacement heifers also remain expensive – double the prices from Jan 2020 and 41% higher than last year.
‧ It takes about 3 years to get a heifer ready to enter the milking herd (breed cow, gestation, raise calf, breed heifer, and finally have milk).
· The reason for the tight heifer supply and why beef costs matter to dairy farmers:
‧ Dairy producers have recently been using sexed semen. This trend reflects a strategic shift in dairy herd management that balances genetic improvement and profitability. By using sexed semen selectively on their best cows, dairy producers can ensure they have enough high-quality heifers for replacement while minimizing a surplus of pure dairy calves, which traditionally have low market value. The remaining cows can then be bred with beef semen, producing crossbred calves that are much more valuable—as seen in current markets paying $800+ per calf at birth.
‧ This system aligns reproductive efficiency with market demand, reducing waste and increasing returns per pregnancy. It also creates a dual revenue stream: elite heifers for herd maintenance and high-value calves for beef markets.
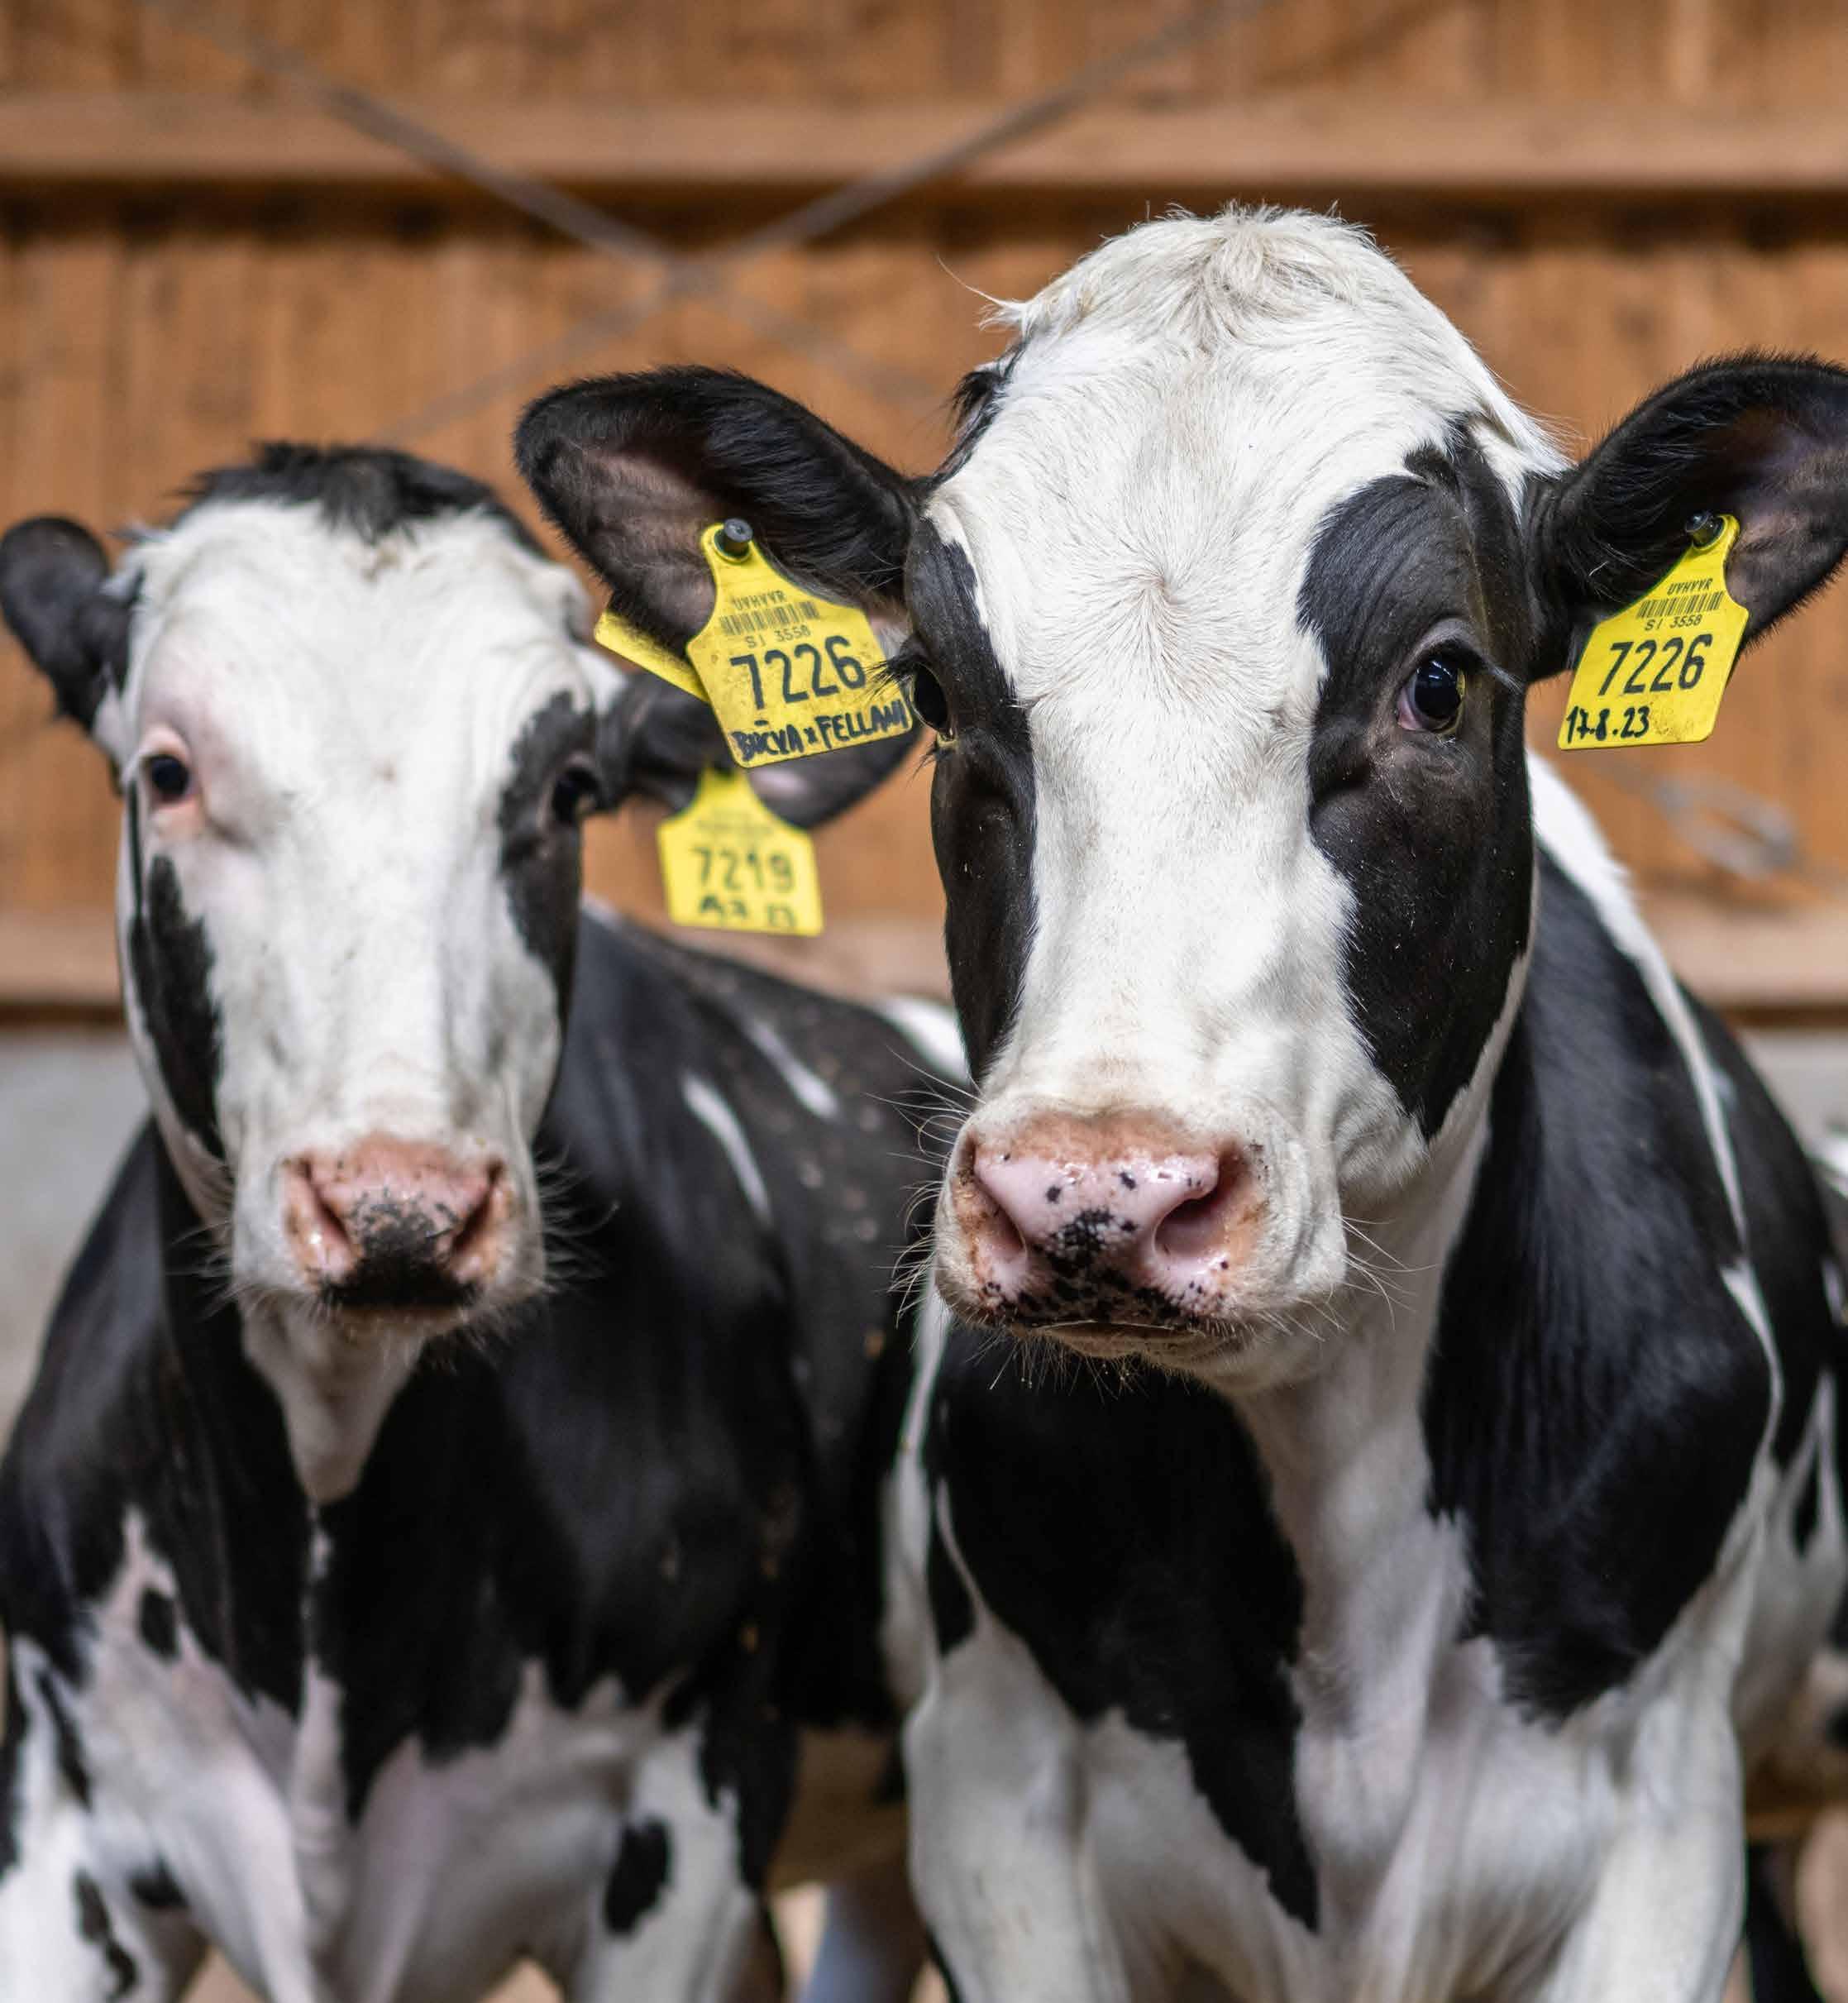
• Milk production was negative vs. the previous year in both 2023 and 2024.
· Margins have improved and producers are adding cows slowly and working to increase milk production in 2025. In calendar year Q1 2025, milk production was up 0.7%.
· Despite seeing lower overall milk output, butterfat that comes from the milk supply is growing.
‧ Having extra of this component is helpful in producing more dairy products.
• We are watching cow and milk expansion in the central region. Specifically, Texas and Kansas, where new cheese plants have been slowly ramping up production.
• We are expecting milk supply to continue this expansion through 2025.
• Tariff risk is a concern – this would be for retaliatory tariffs from other countries especially Mexico and this will need to be watched. Currently, Mexico is the biggest buyer of U.S. dairy and there are no tariffs between U.S. and Mexico as of mid-April.
• HPAI impacted many herds in 2024, especially in California.
· California is still recovering but increases in the last 4 months show that recovery is underway – we are expecting YOY milk supply in California to turn positive in the spring and summer.
· Bird Flu in cows is minimal thus far in 2025.

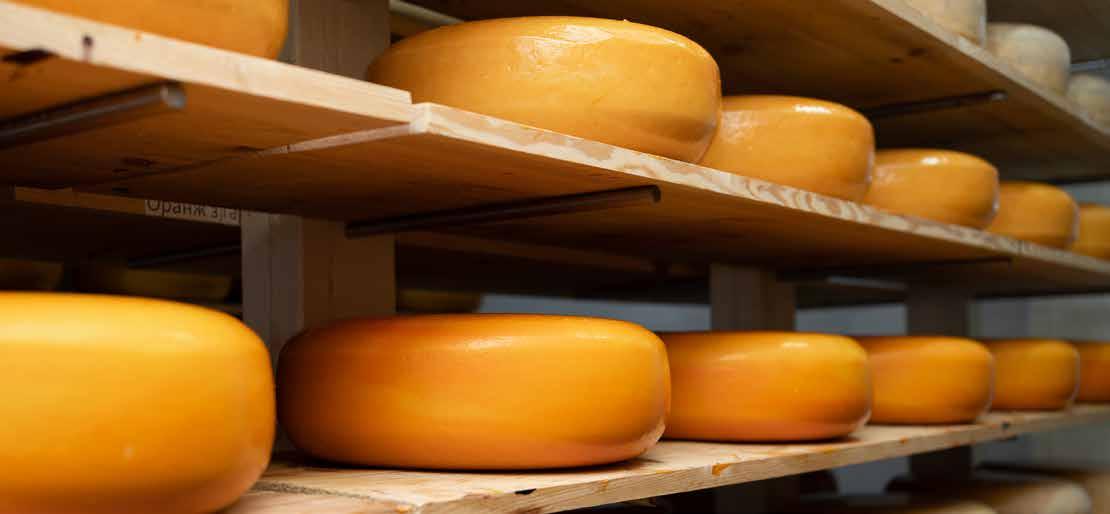
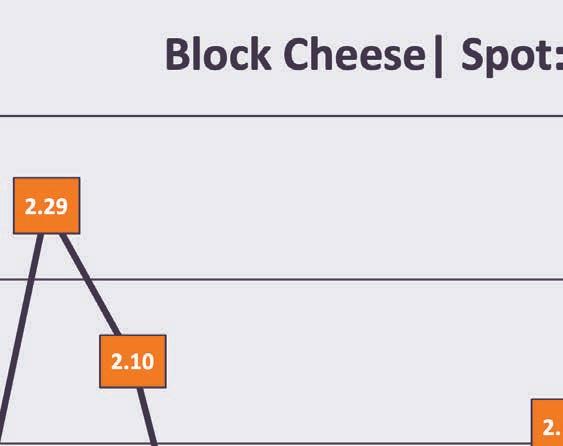
• Cheese production for 2025 YTD is up 1.5%.
· We are expecting cheddar to increase for 2025 as the new cheese capacity produces additional cheddar.
· Strong exports in 2024 pulled cheese inventories down – cheese exports were at a record level in 2024. As long as U.S. cheese pricing remains competitive with the rest of the world, cheese exports will remain strong.
· Cheese capacity has grown with two cheese plants in the central region that are now producing.


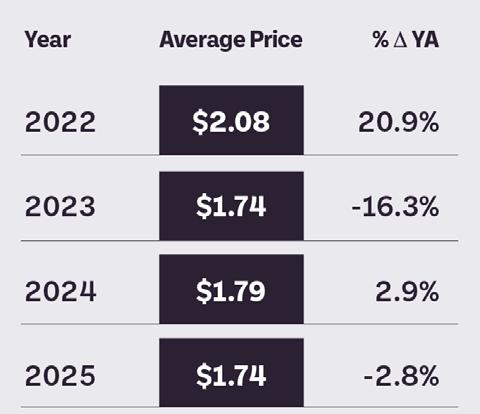
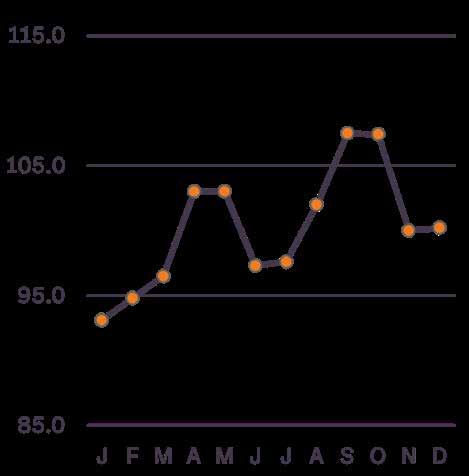


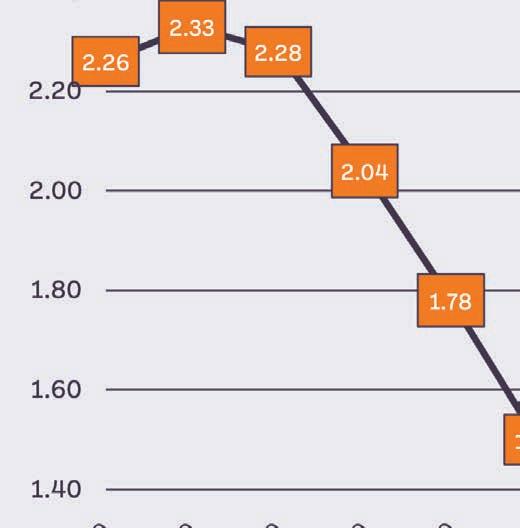
• More than adequate butterfat and cream availability have allowed butter producers to keep churning butter.
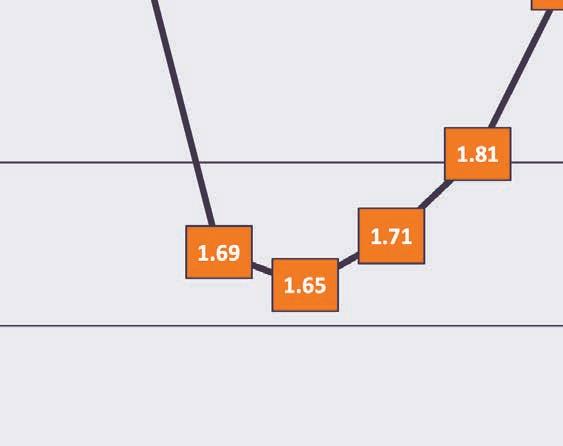
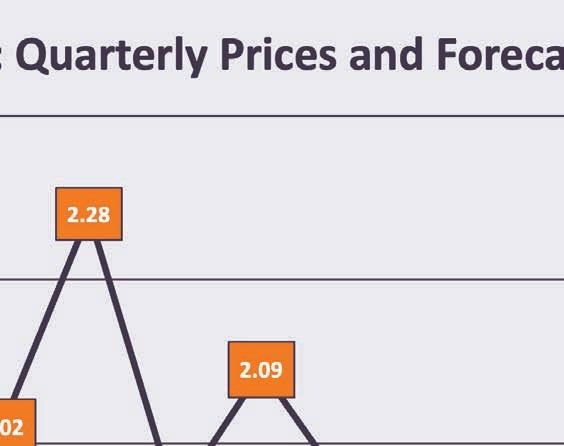
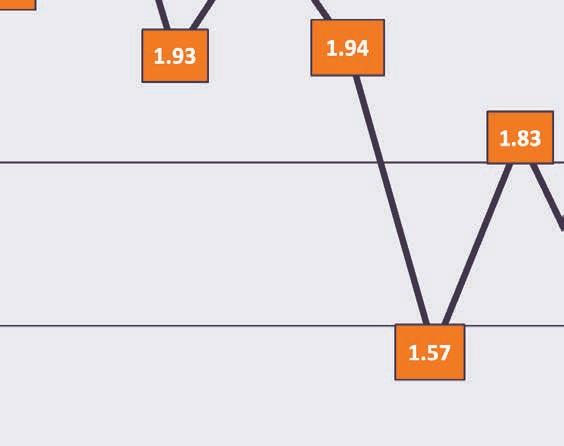
· Butter production has been positive each month for the last 15 months which has pushed inventories higher.
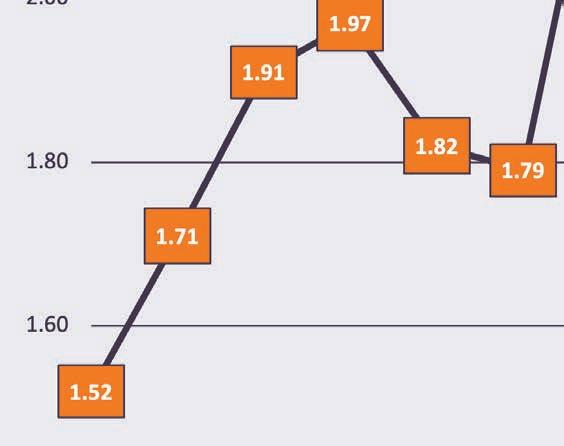
• Spot butter pricing has decreased as inventories have increased and buyer anxiety slows.
· Spot butter pricing is more than 20% lower than last year.
· Exports have picked up as U.S. butter is priced less than the rest of the world. Typically, the U.S. is a net importer of butter, but when U.S. prices were competitive in 2021, the U.S. became a net exporter and that may keep a pricing floor on butter through the rest of 2025.
• We are expecting to see seasonal increases on butter pricing into late summer and the holiday buying season. Pricing will not likely see the record levels experienced in 2023 and 2024.
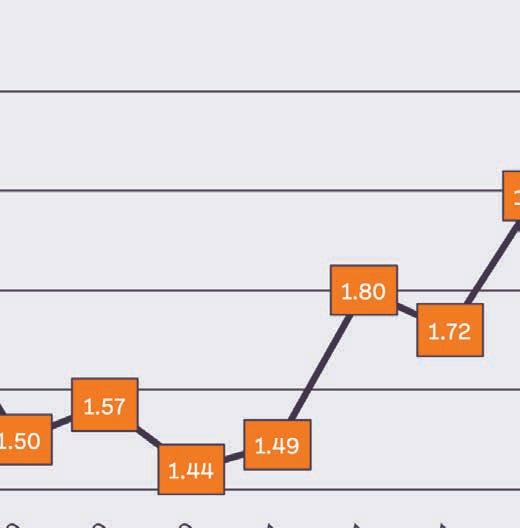
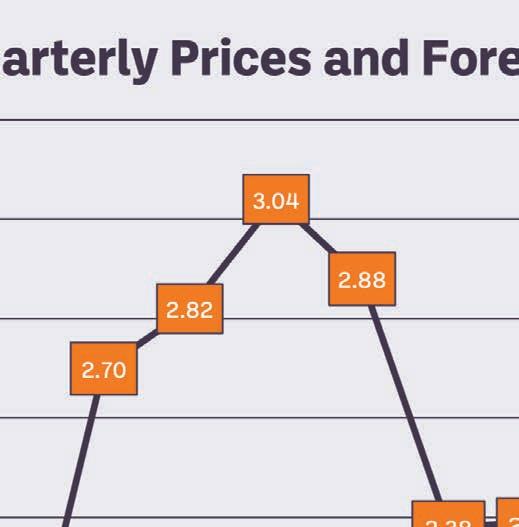
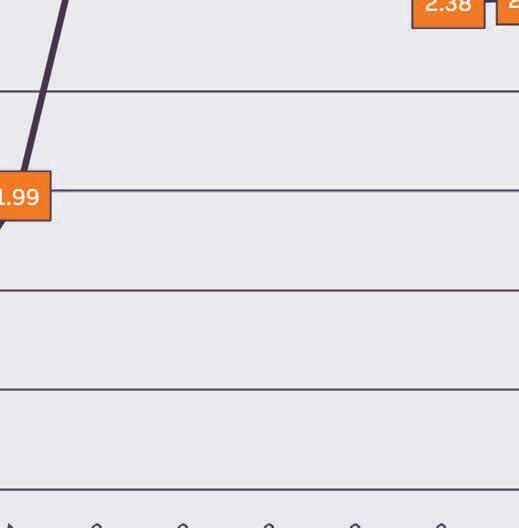
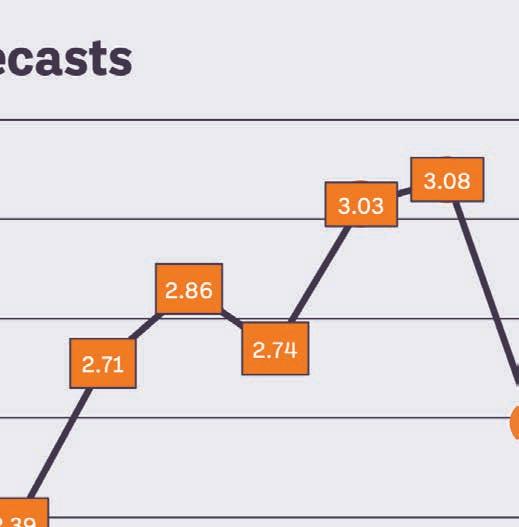




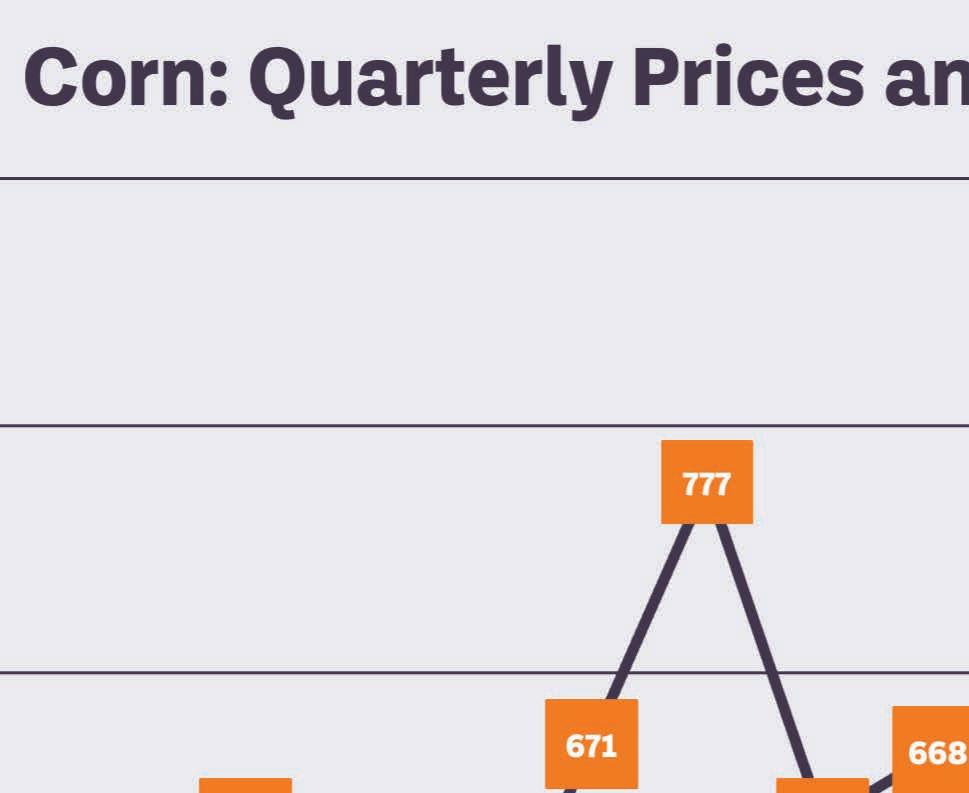
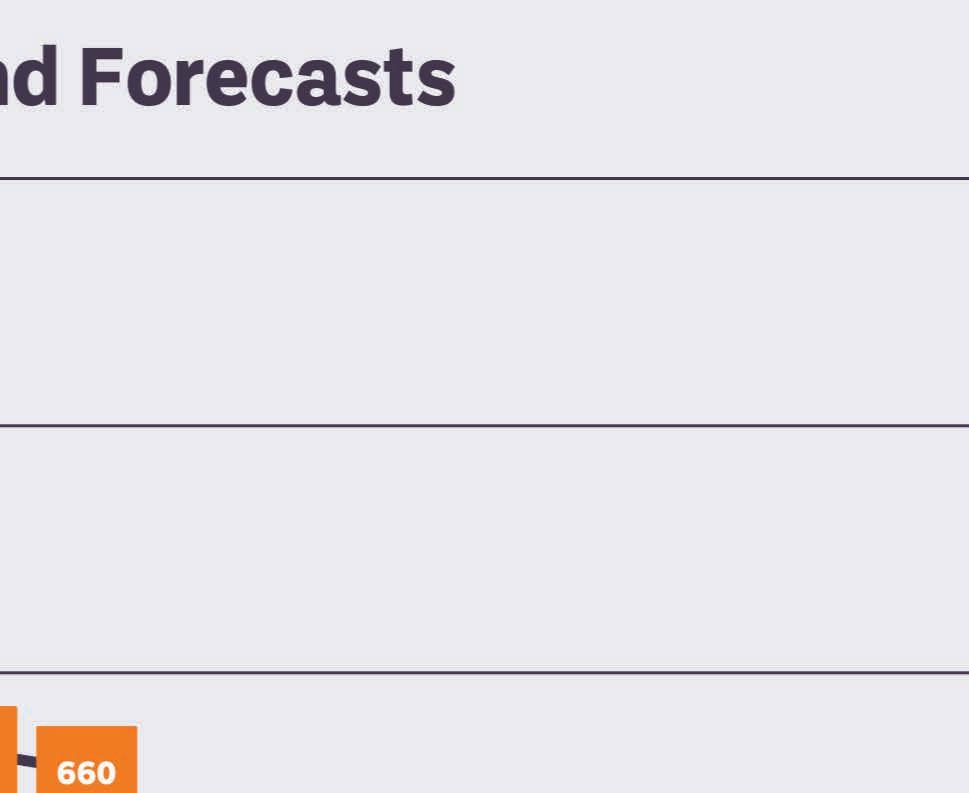
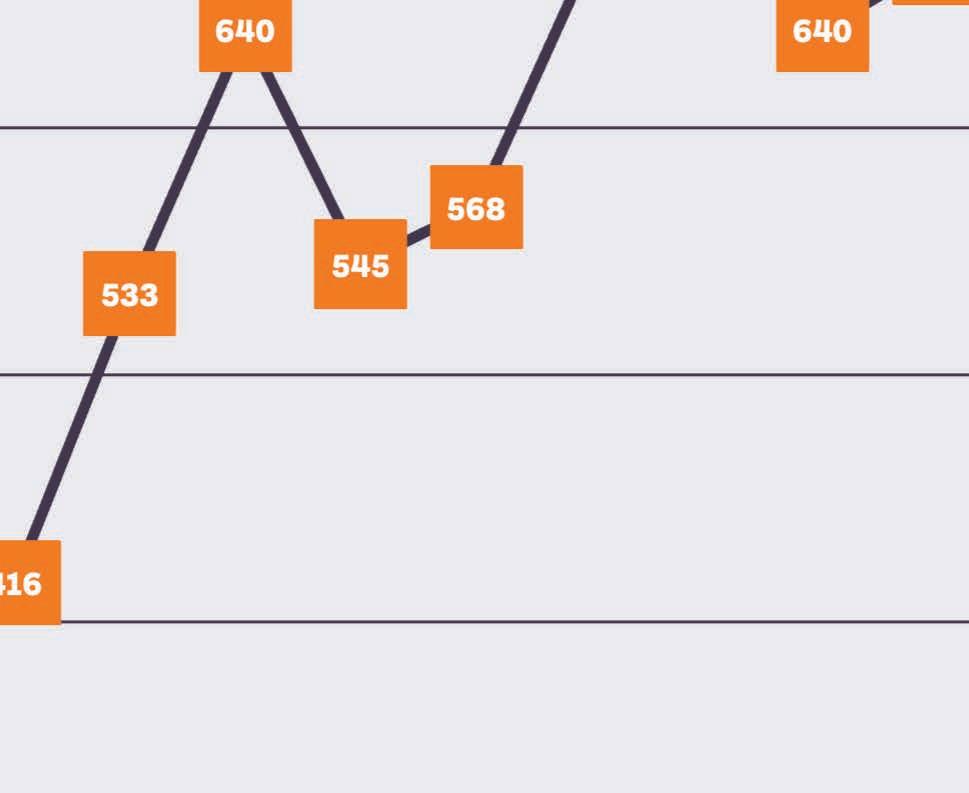
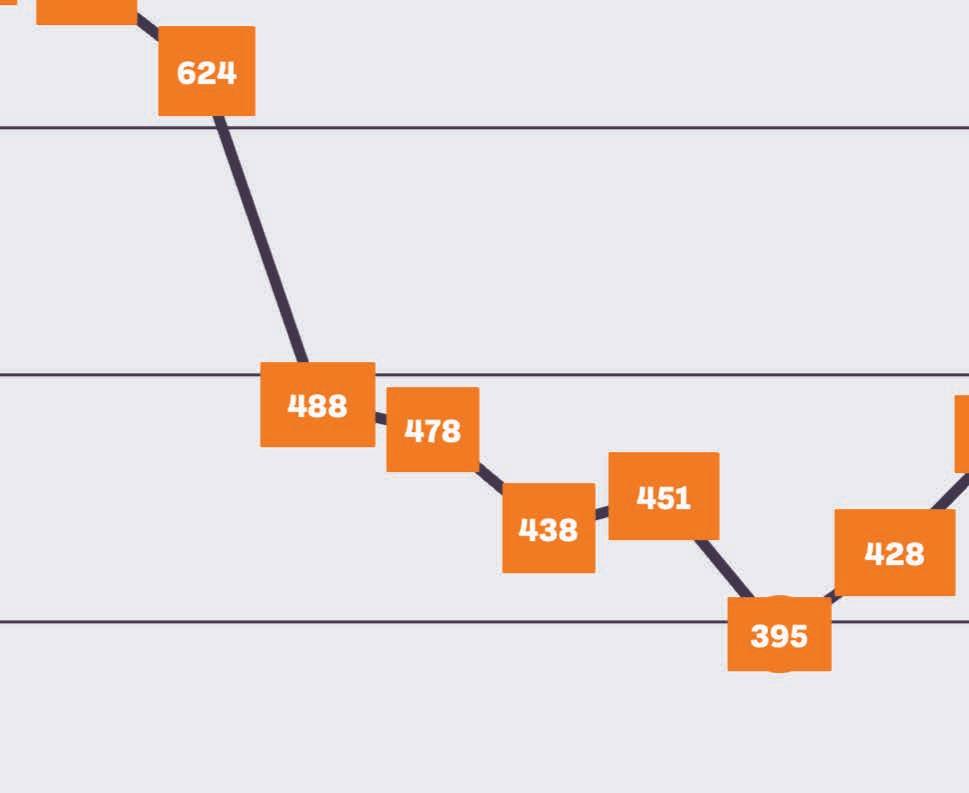
• After three years of rigid stocks, the extreme tightness in the corn market (and other crops) has reversed itself.
• Nearby corn futures have declined as inventories are projected to rebound over the next 18 months.
• Corn prices are important due to the size of the U.S. crop (relative to other crops), as well as the large-scale use of corn to feed livestock.


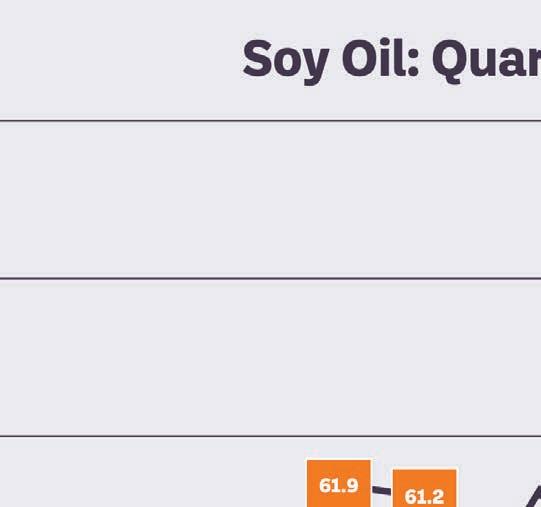
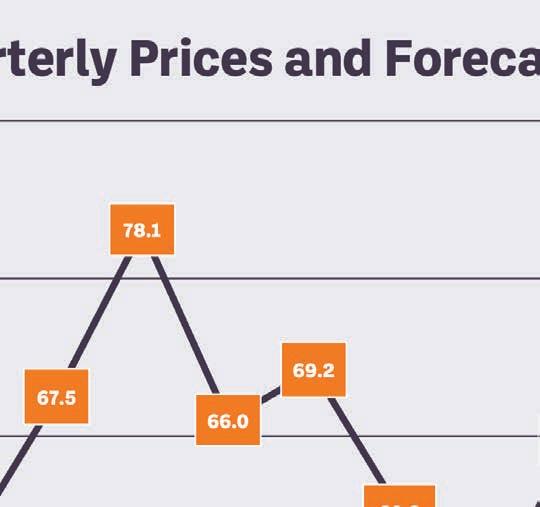
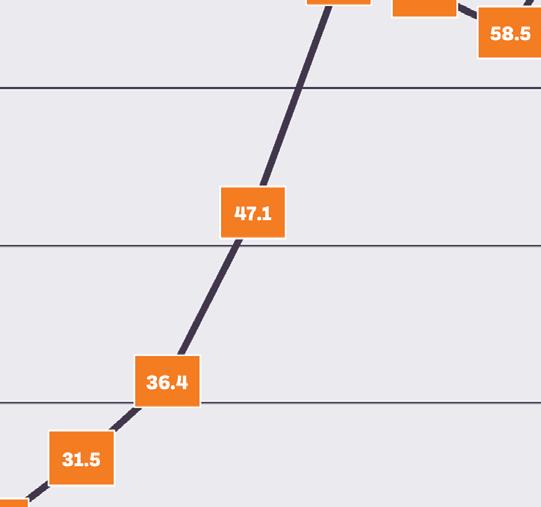
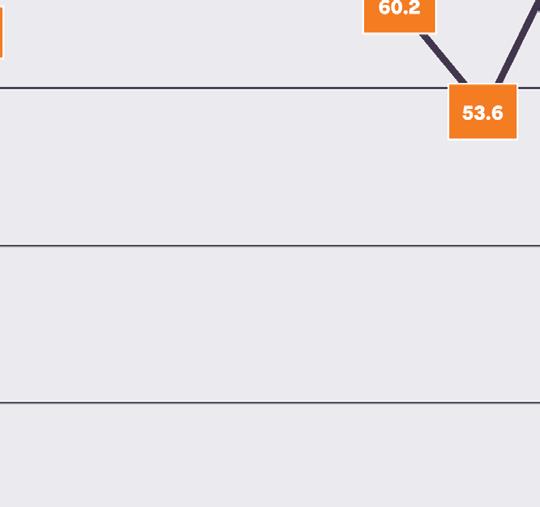
• Soyoil demand remains strong, both from biofuel usage as well as exports.
• Biofuel demand for soyoil is set to increaselimitations on imports of fats and oils, as well as an increase in annual biofuel obligations, will support soyoil prices going forward.
• The soyoil futures market has been extremely volatile.



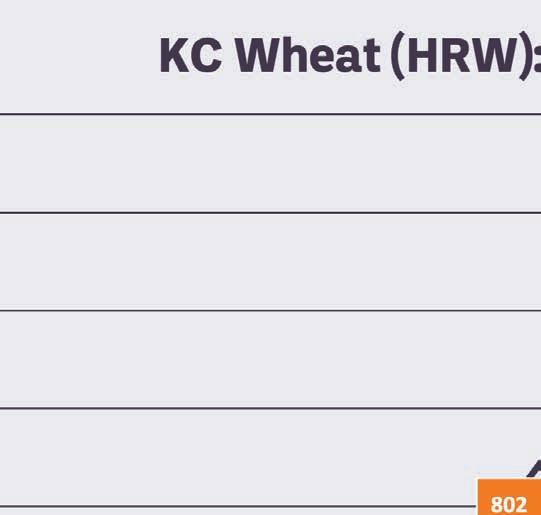
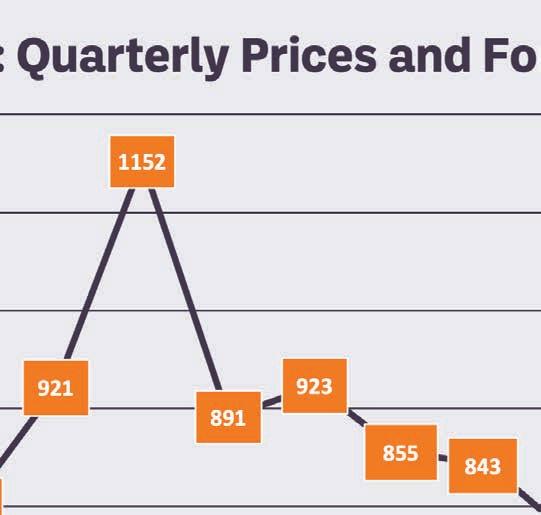
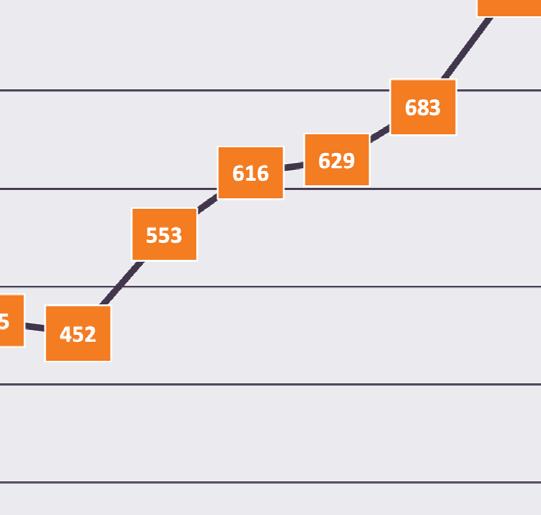
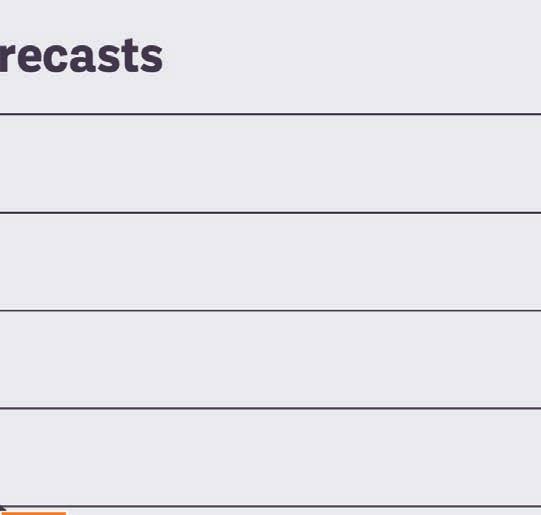
* Wheat

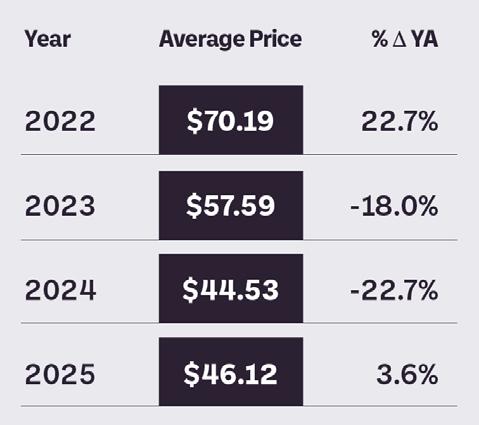
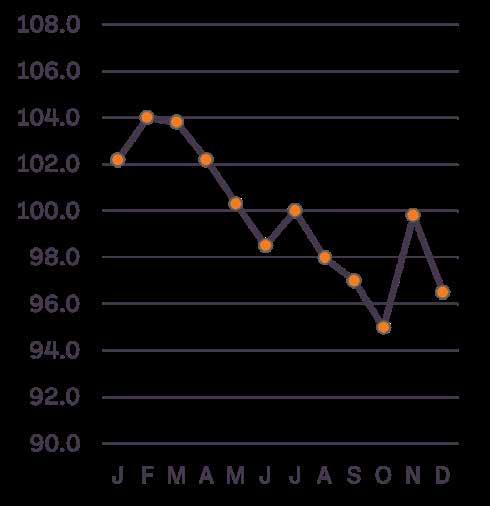
• Wheat prices peaked during May 2022, as supply concerns (Russia/Ukraine war) drove increased KC futures.
• With improved weather, wheat prices have fallen by 50% over the past 24 months, and barring dramatic weather events, are expected to remain near the current level
• Following a 9% rise in the 2024 U.S. wheat crop, production is expected to decline by 7% during 2025 due to reduced acreage and a return to more normal weather.


• The U.S. remains uncompetitive in global export markets, resulting in continued poor U.S. export demand and limiting price upside.
• Wheat prices (KC futures) have declined.
• North American durum wheat output has rebounded sharply (+42%).
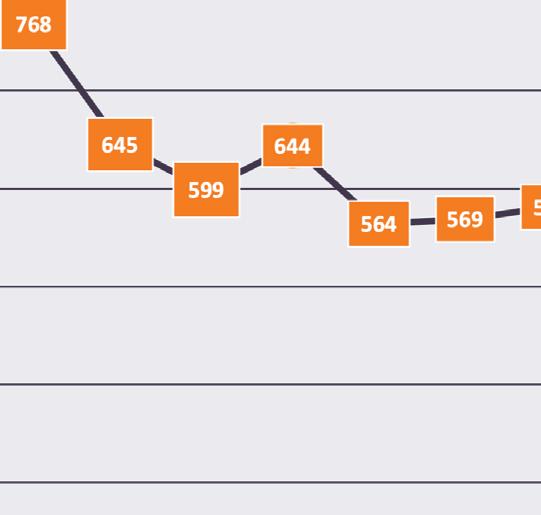
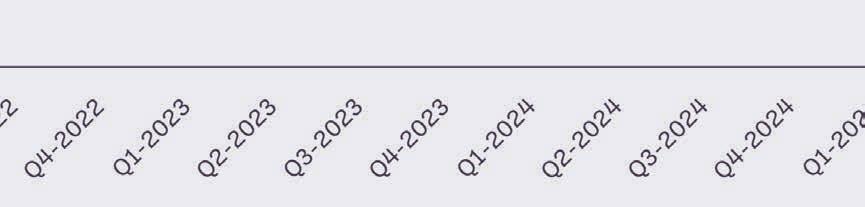

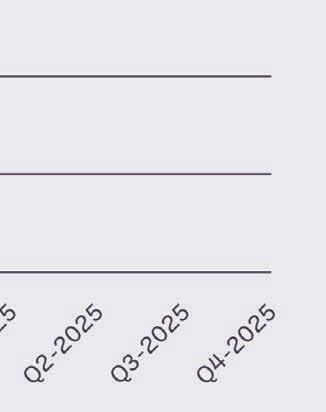
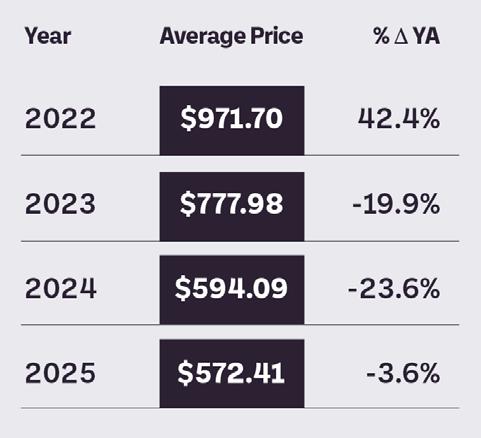
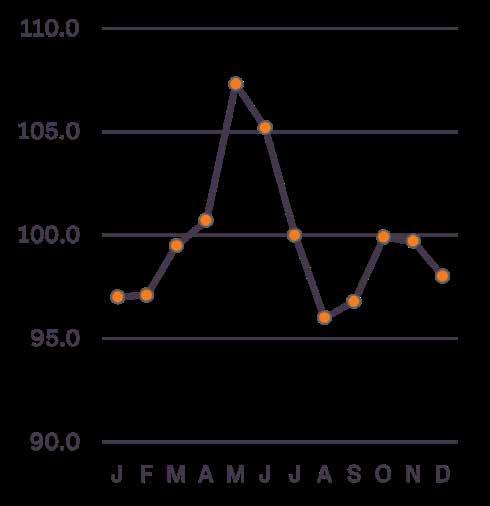

• Rice futures have declined sharply as larger U.S. supplies and declining U.S. corn/wheat prices have helped relax markets.
• An increase in U.S. rice supplies is expected to leading stocks to climb to a 4-year high.
• A modest increase in global exportable supplies is expected to pressure world prices.
• Rice prices have declined, and barring any major foreign supply disruptions, should remain in this price range.


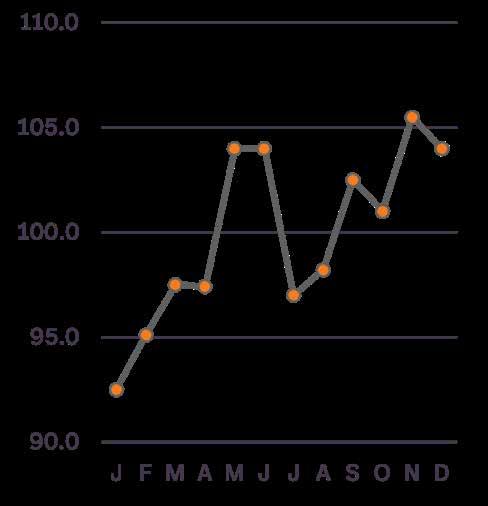
• Beef production for 2025 is expected to be below last year.
· The final production number will depend on weights as slaughter rates will be negative vs. the previous year, but the higher weights may prop up production.
· Heifers are not yet being retained; the rebuild will be slow as producers are very cautious.
• The number of heifers on feed saw a slight reduction at around 37.6%, the lowest heifer number on feed since 2021. The heifer % on feed has averaged over 39% for the past 16 quarters. This does not indicate expansion, but it’s moving in the right direction.
• Beef cow slaughter is down 18% and dairy cow slaughter is down 7.7%.
· Reduced supplies of non-fed beef have led to record wholesale trim prices and increased demand for imported beef – as well as strong lean demand for end meats (round and chucks)will continue well into 2025.
• Demand is a big question mark. It had been expected that the high prices in 2024 would start to slow down demand, but while there has been trade down from expensive beef to some less expensive cuts, beef remains a staple on the consumer’s menu even into 2025.

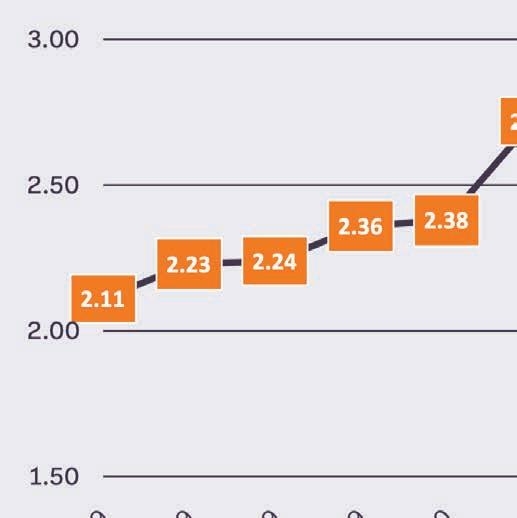
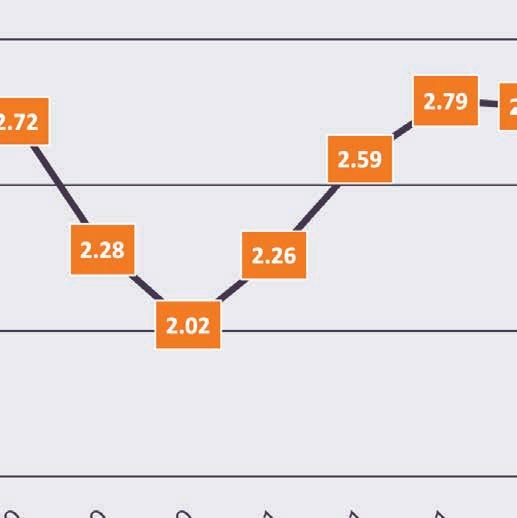
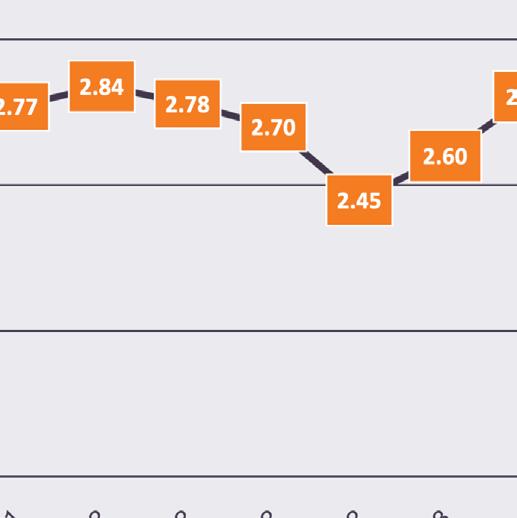
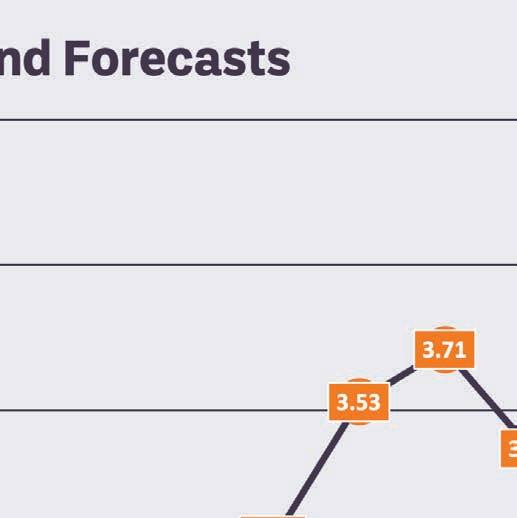
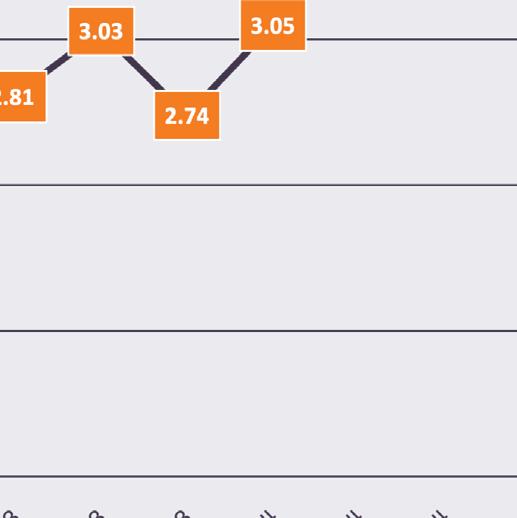
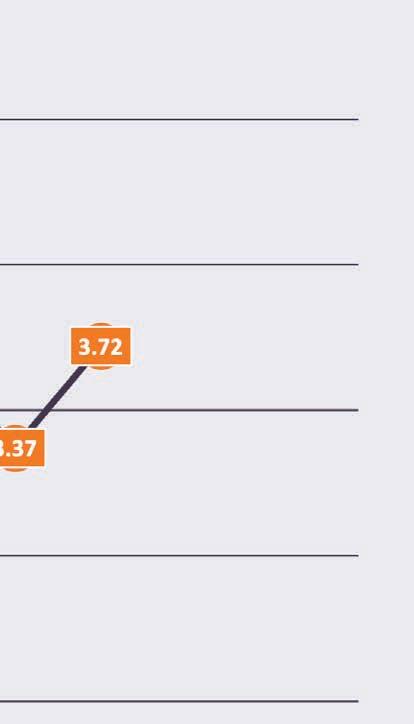
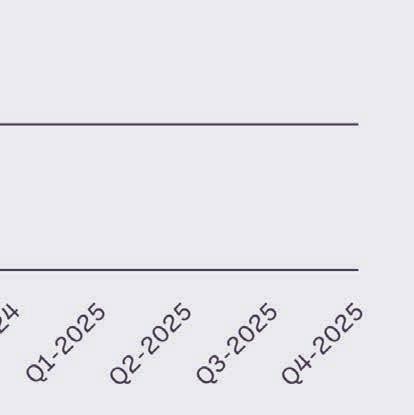
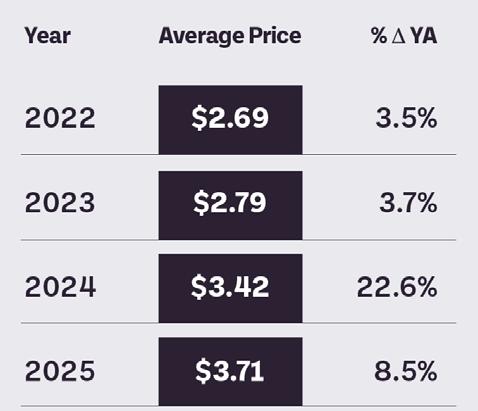
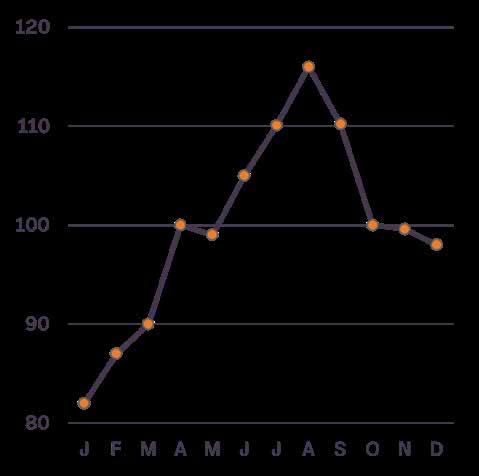
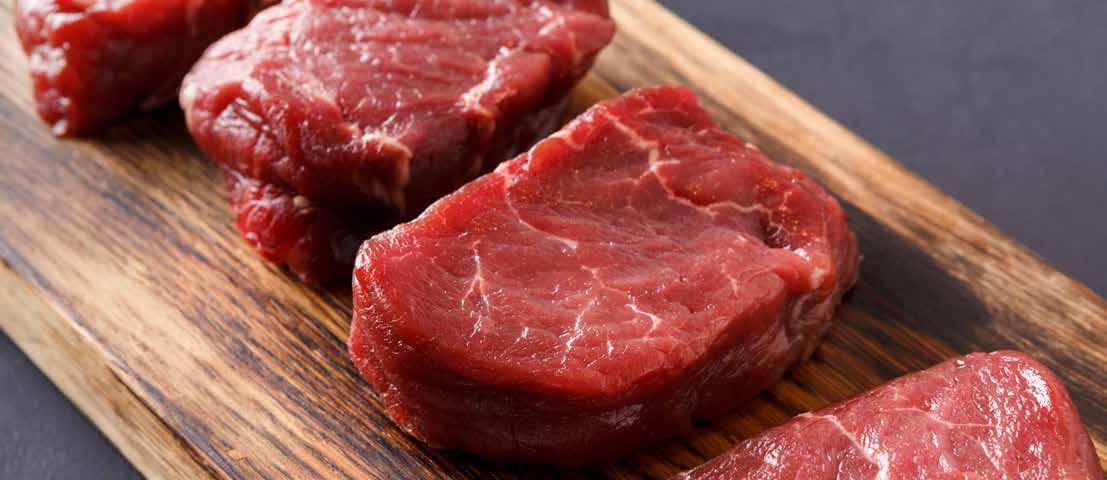
• Beef 90s prices for 2025 will remain historically high as cow slaughter remains constrained.
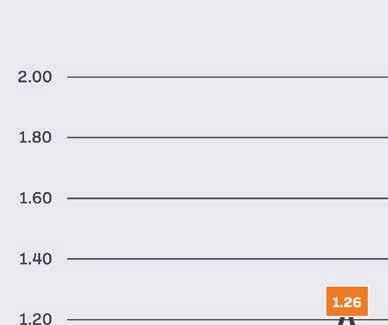
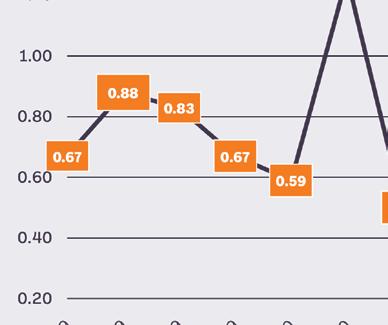
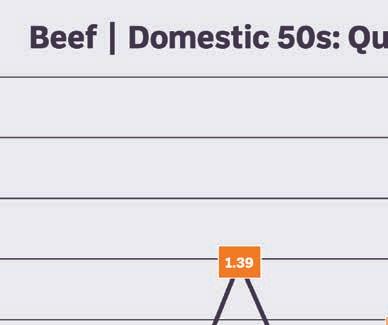
• Beef 50s are a bit of a bright spot compared to the rest of the beef complex.
· Overall weights remain well above last years’ levels and that is adding fatty beef to the ground beef supply and keeping B50s from surging. We are fully expecting that weights will remain above last year and that will keep a cap on where B50s prices go for 2025, but there may be volatility this summer depending on demand.
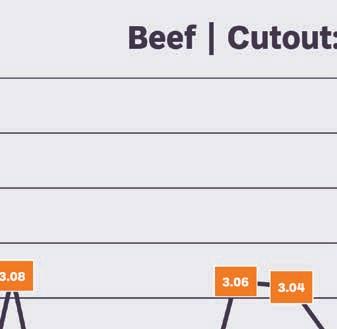
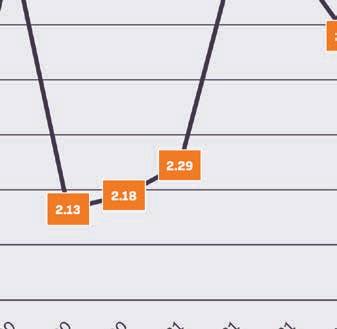
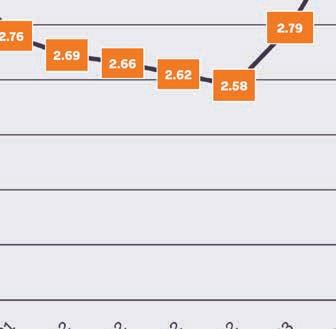
• The beef cutout has remained elevated; there has been some trade from middle meats into end meats and ground beef.
· In some cases, given where expensive ground beef prices are, a primal like round and chuck are used in grinding for ground beef. That has kept the round and chuck primals elevated and has contributed to the cutout staying firm.
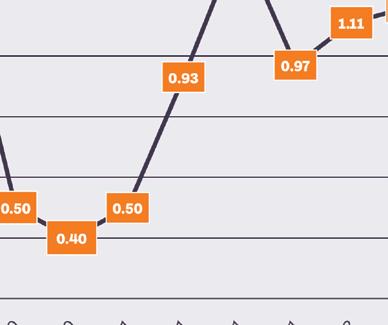
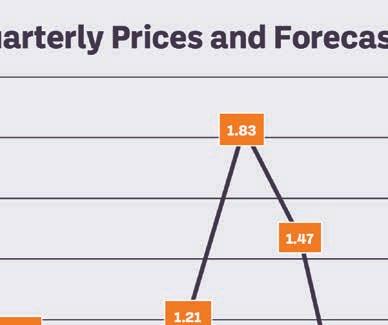
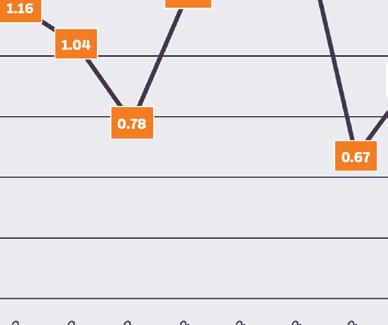

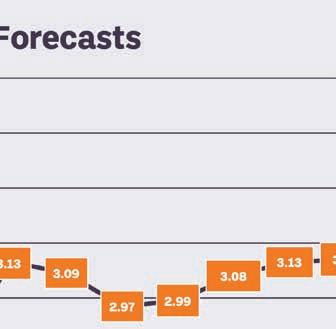
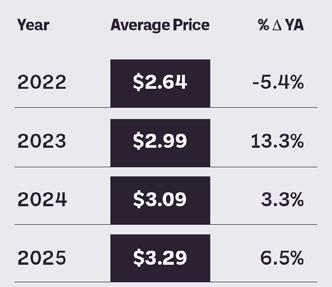
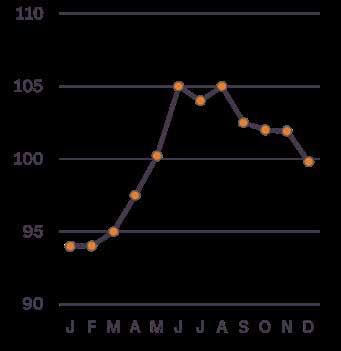
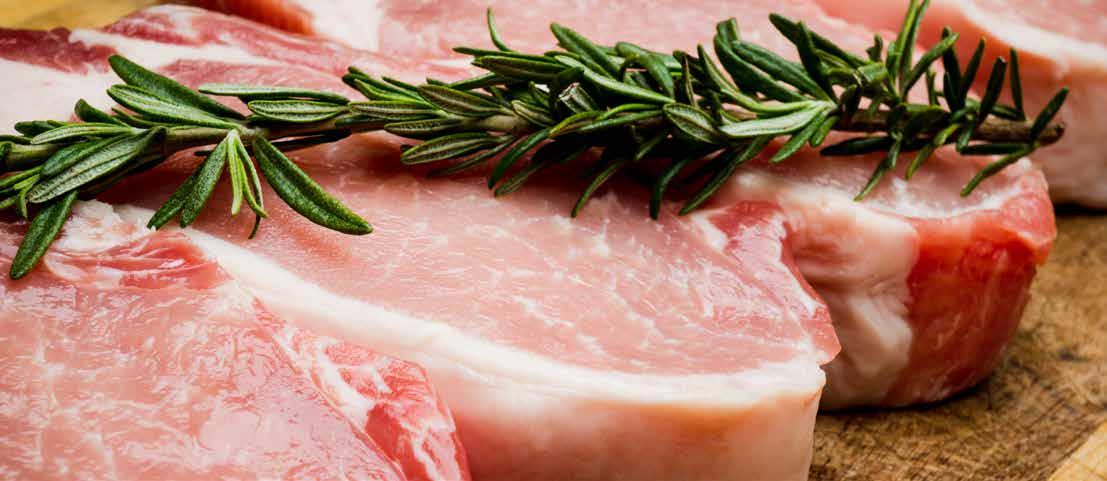

• Pork production into 2025 is expected to stay slightly positive despite big revisions to past pig crop numbers.
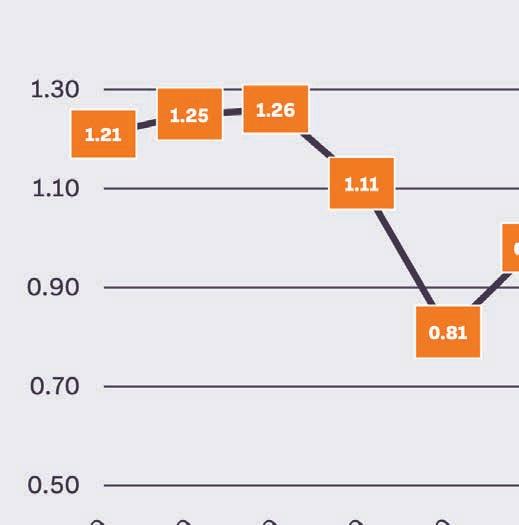
· Based on current pig crop estimates, production is expected to be flat through August. We may not know the final forecast until early summer, but production looks to be lower than anticipated based on weekly slaughter data.
• Iowa – a large pork producer - show that margins have stayed positive since early 2024.
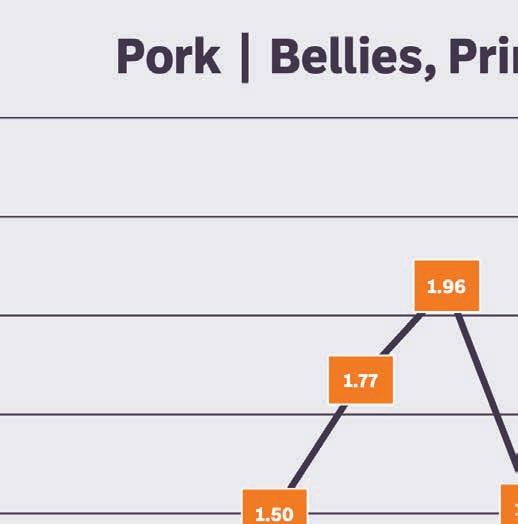
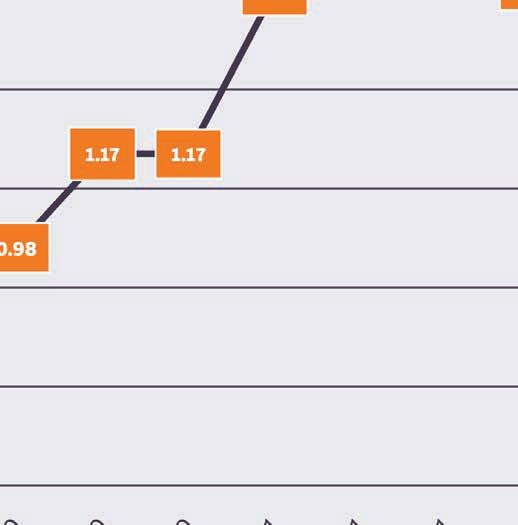
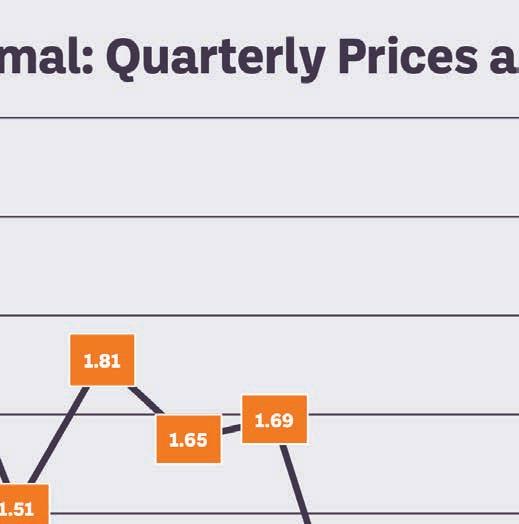
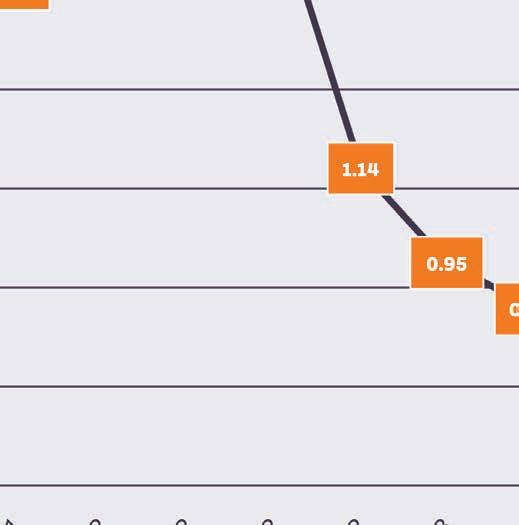
• Tighter than expected harvest and production pressured prices higher in early 2025, as it is 1%+ higher than last year.
• Belly primal pricing is following a similar trajectory as 2022 when cold storage was tighter; 2025 pricing has been 10% higher than last year.
• Pork stocks remain below last year and are the lowest in more than 20 years. Higher demand with lower stocks equals higher pricing, especially as harvest numbers remain lower than expected.
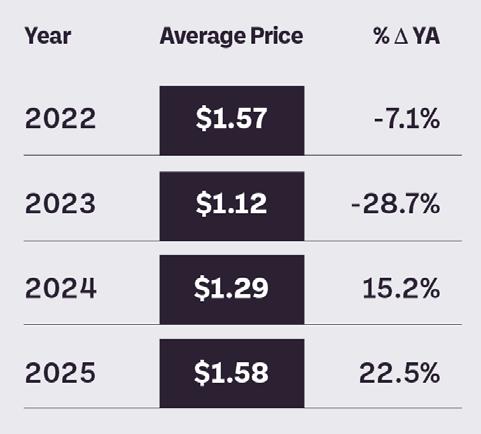
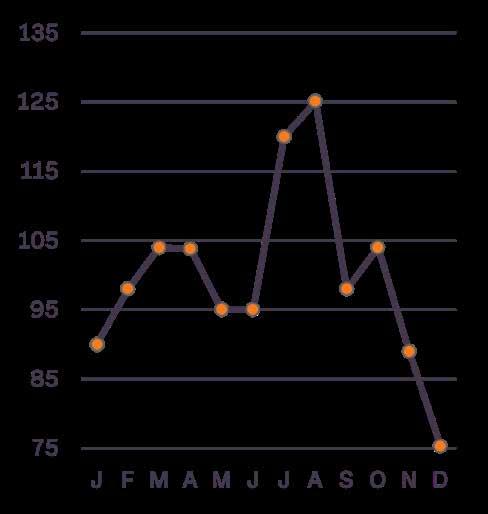
Poultry and Highly Pathogenic Avian Influenza (HPAI)
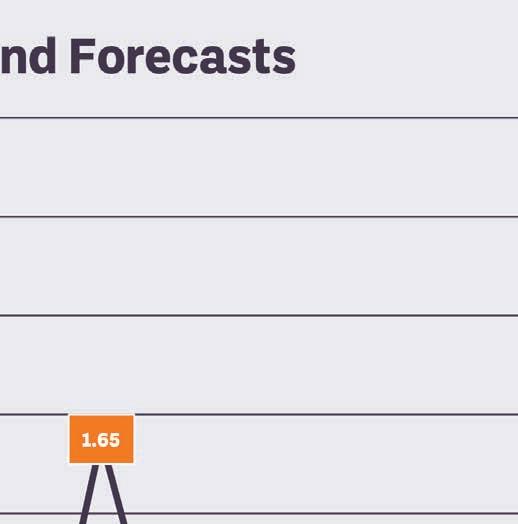
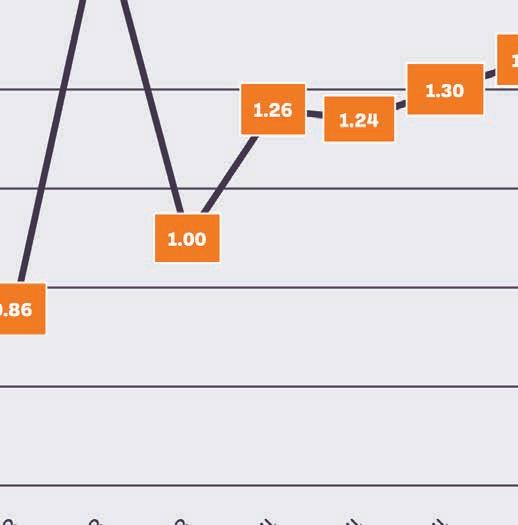
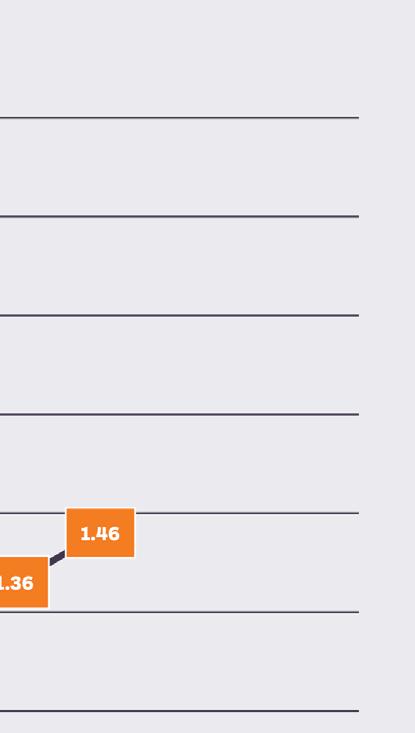
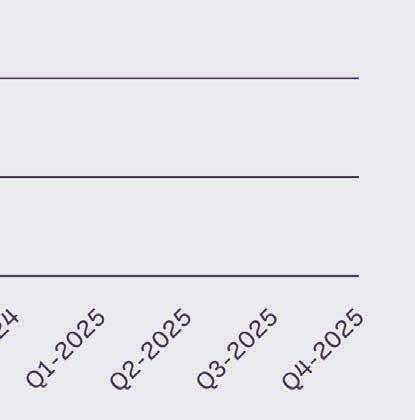
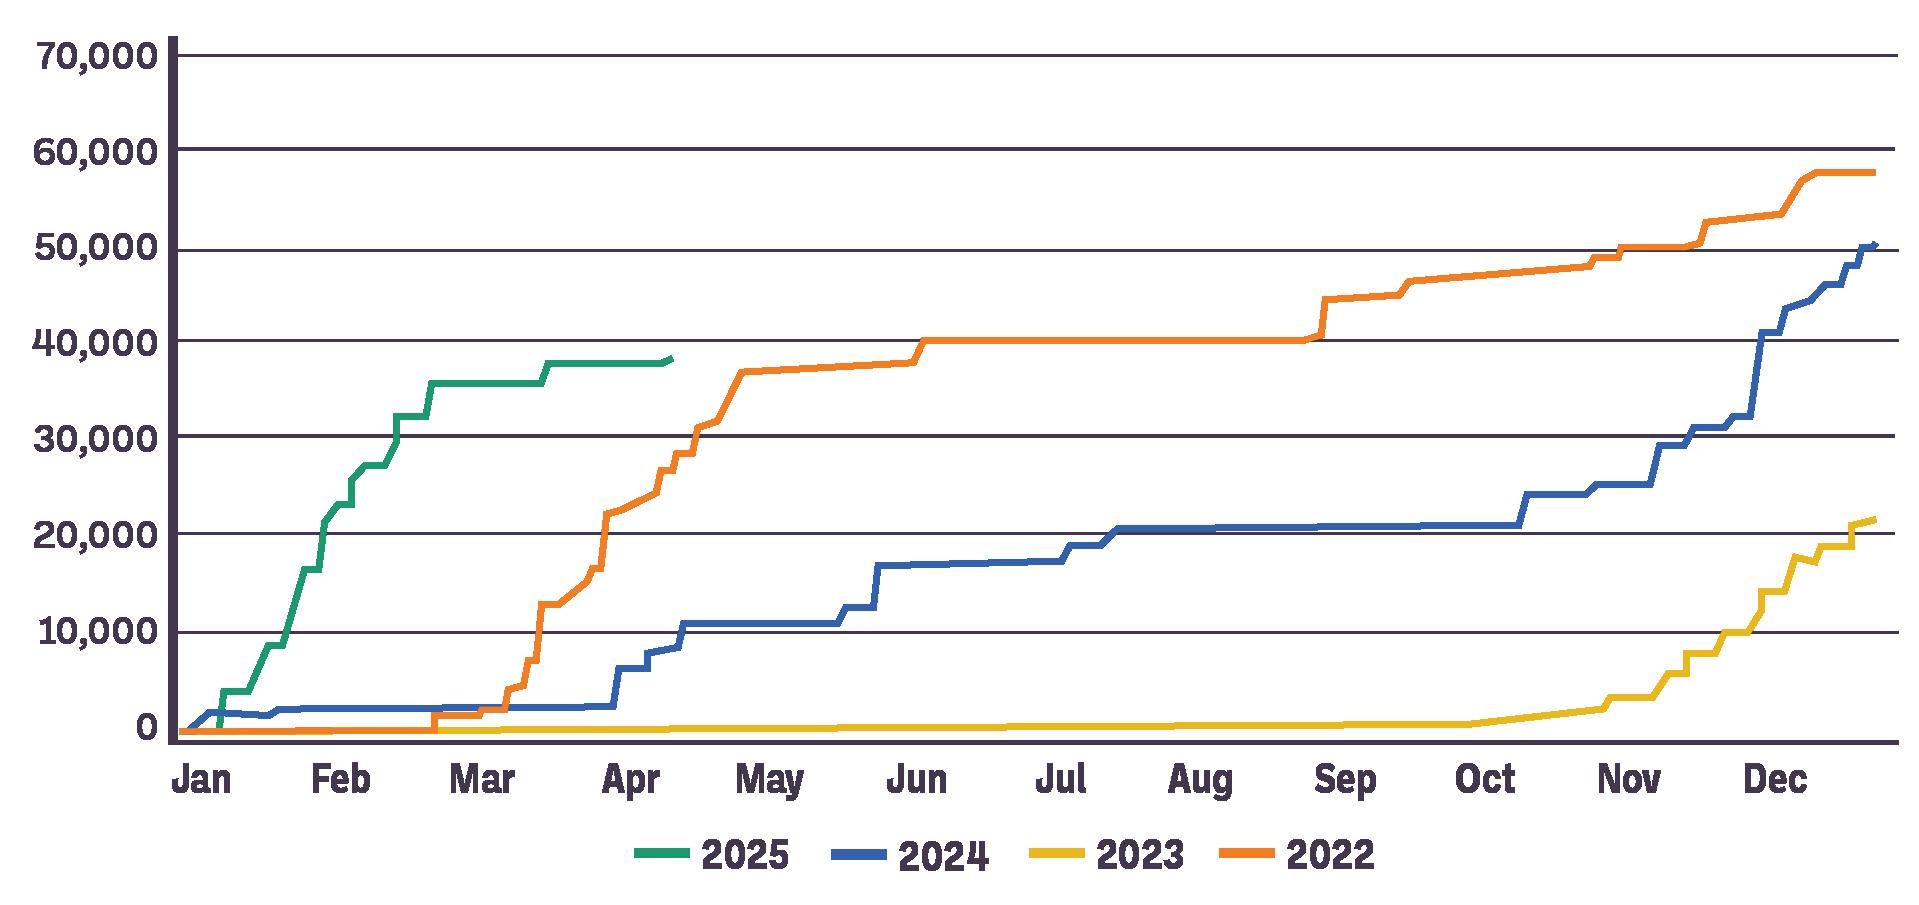
Since the start of this outbreak in February 2022, ~167 million commercial birds have been culled due to HPAI. The greater risks are during spring and fall, but there still does not seem to be a very consistent path of infection over the last several years. Egg layers have been particularly hit hard, with more than 132 million lost since February 2022.
Current USDA efforts to control HPAI are focused on surveillance, flock culling, and biosecurity measures on and around farms.
• Visitor Control: Limiting farm visitors and ensuring they follow strict biosecurity protocols, such as using disposable shoe covers and disinfecting footwear before entering the farm.
• Sanitation: Regularly cleaning and disinfecting equipment, vehicles, and footwear. Using footbaths with disinfectant solutions (e.g., bleach) to clean boots before entering poultry houses.
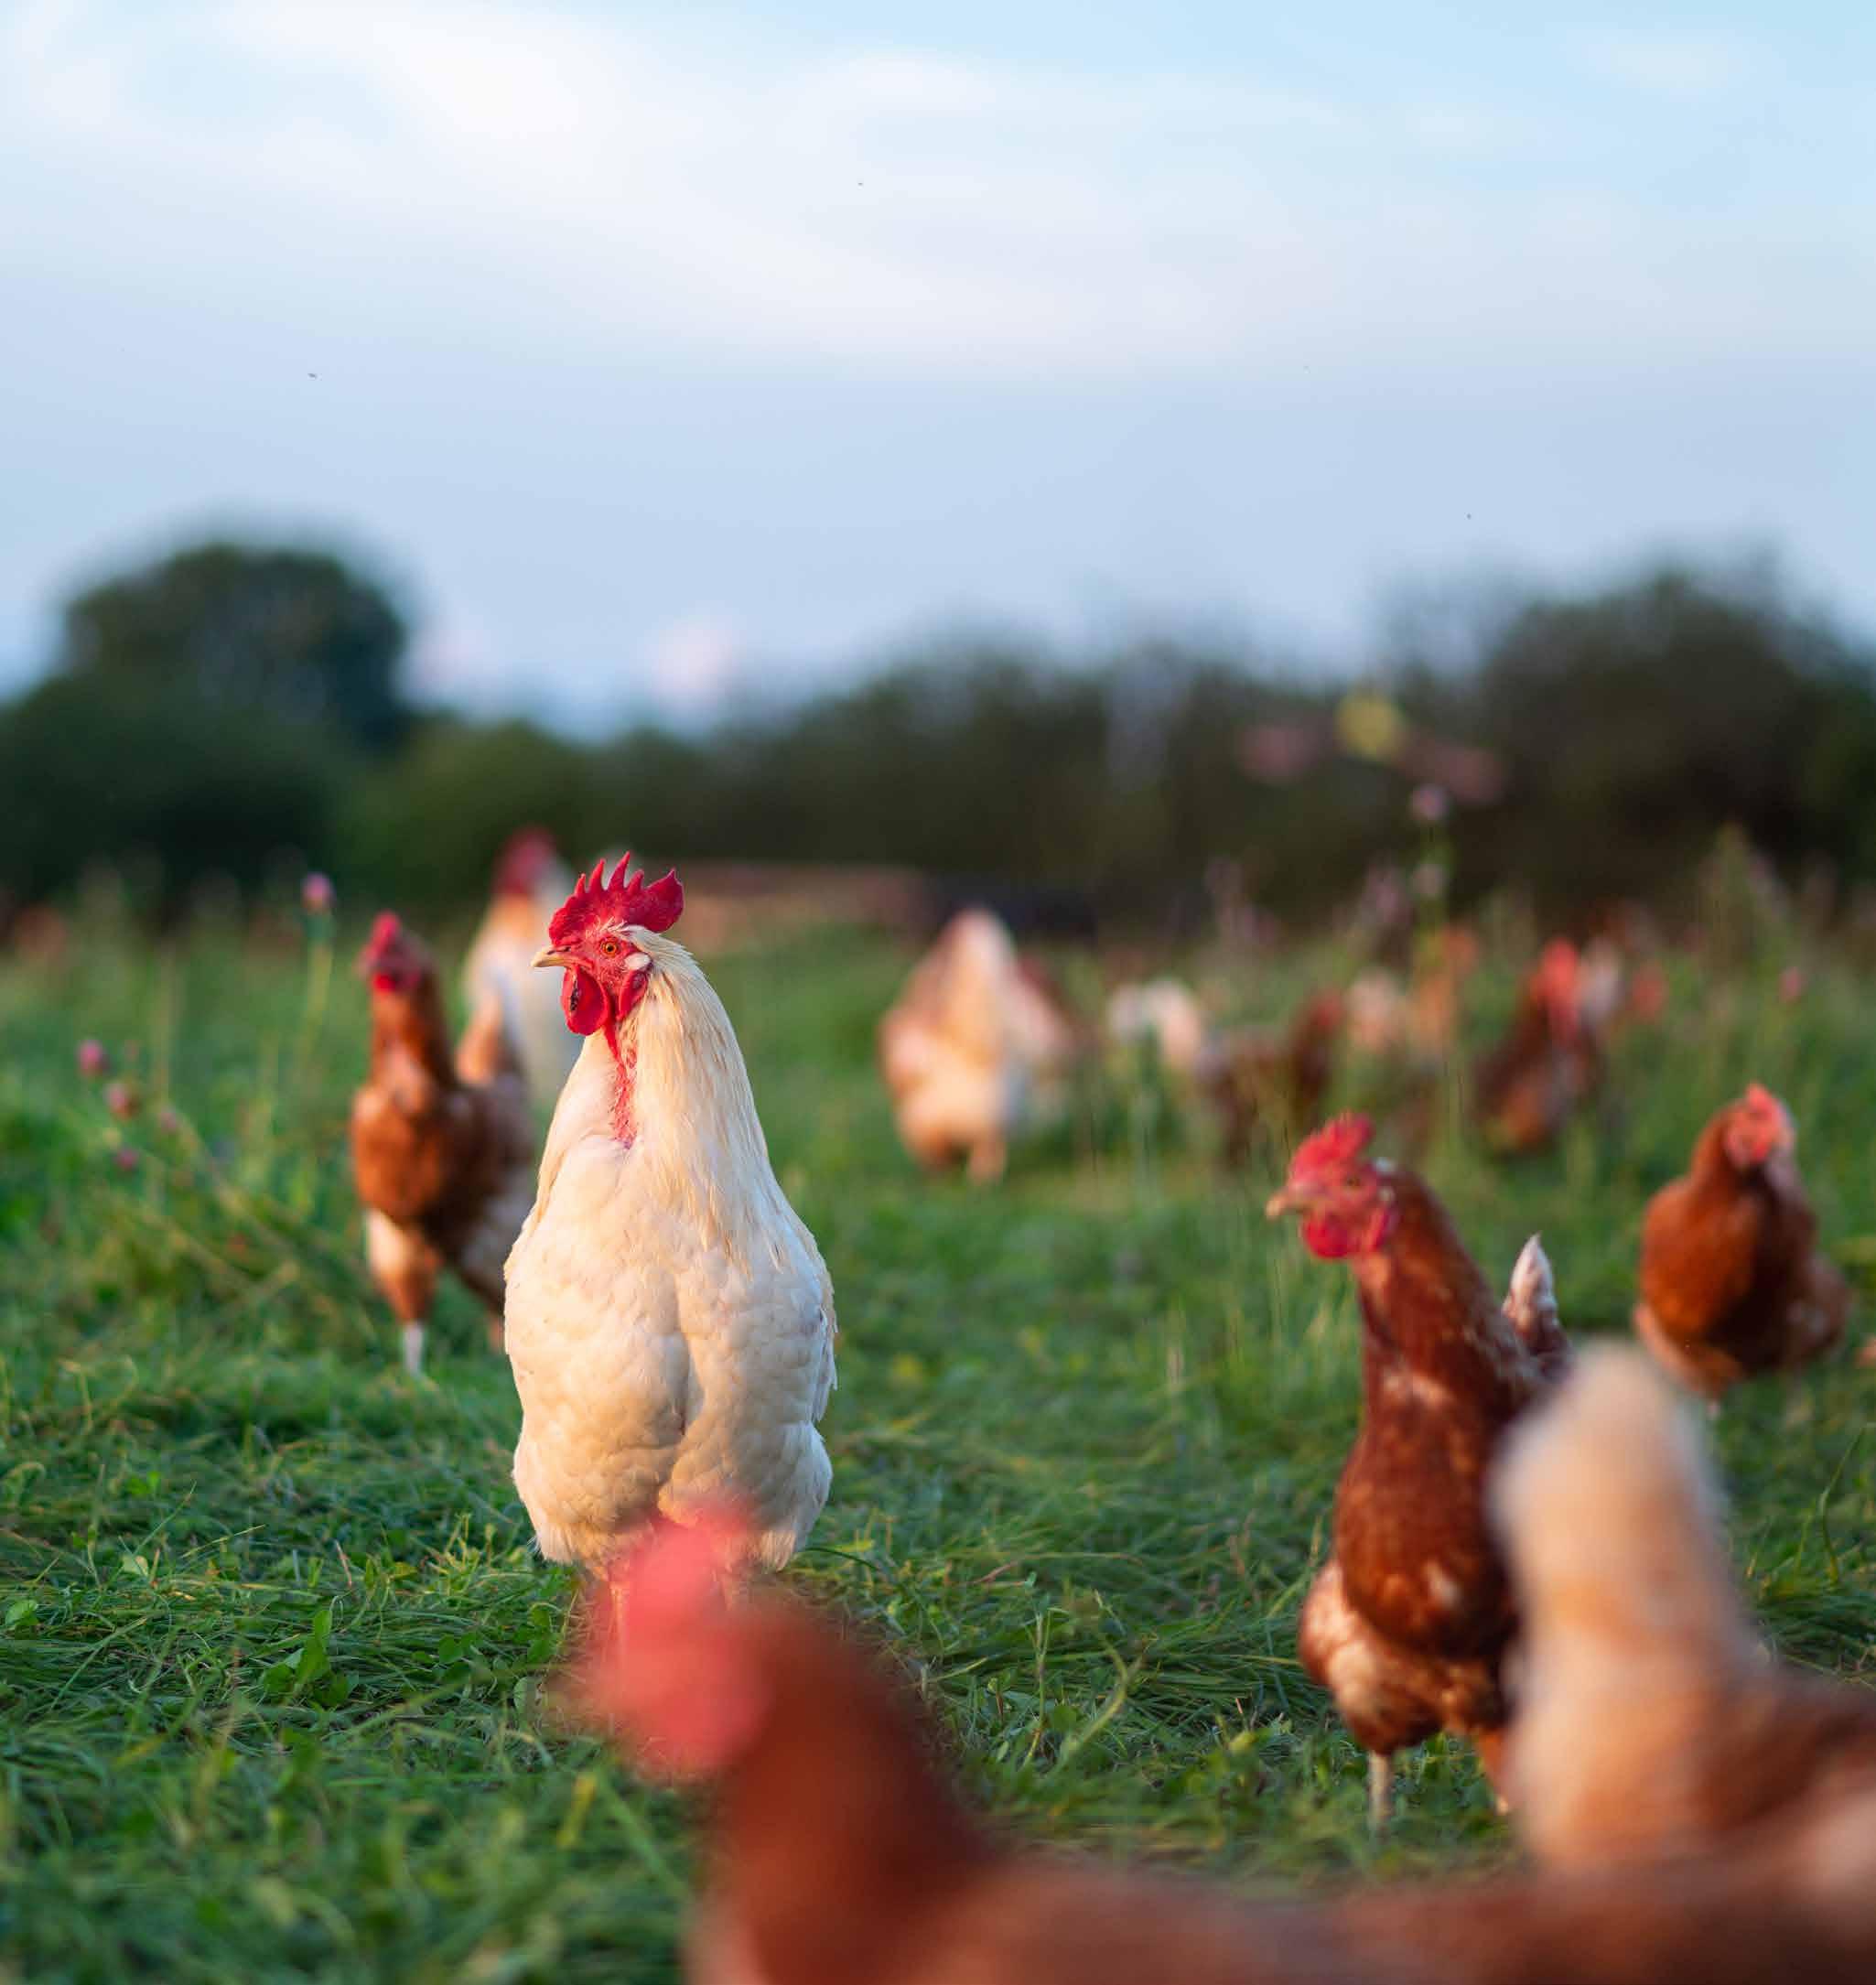
• Isolation: Keeping poultry away from other animals and wildlife to prevent cross-species transmission. Using fencing and netting to deter wild birds and animals from entering poultry areas.
• Water Management: Avoiding the use of untreated surface water for poultry. Removing standing water and managing ponds to prevent them from becoming breeding grounds for wild birds.
• Health Monitoring: Regularly checking birds for signs of illness, such as coughing, sneezing, or difficulty breathing. Isolating sick birds and reporting any suspected cases to veterinarians or authorities.
• Feed Management: Keeping feed storage areas clean and covered to prevent contamination by wild birds. Inspecting feed for any signs of contamination.
• Education and Training: Providing training for farm workers on biosecurity practices and the importance of maintaining a clean and controlled environment.
Cumulative cull current 2022-2025 outbreak
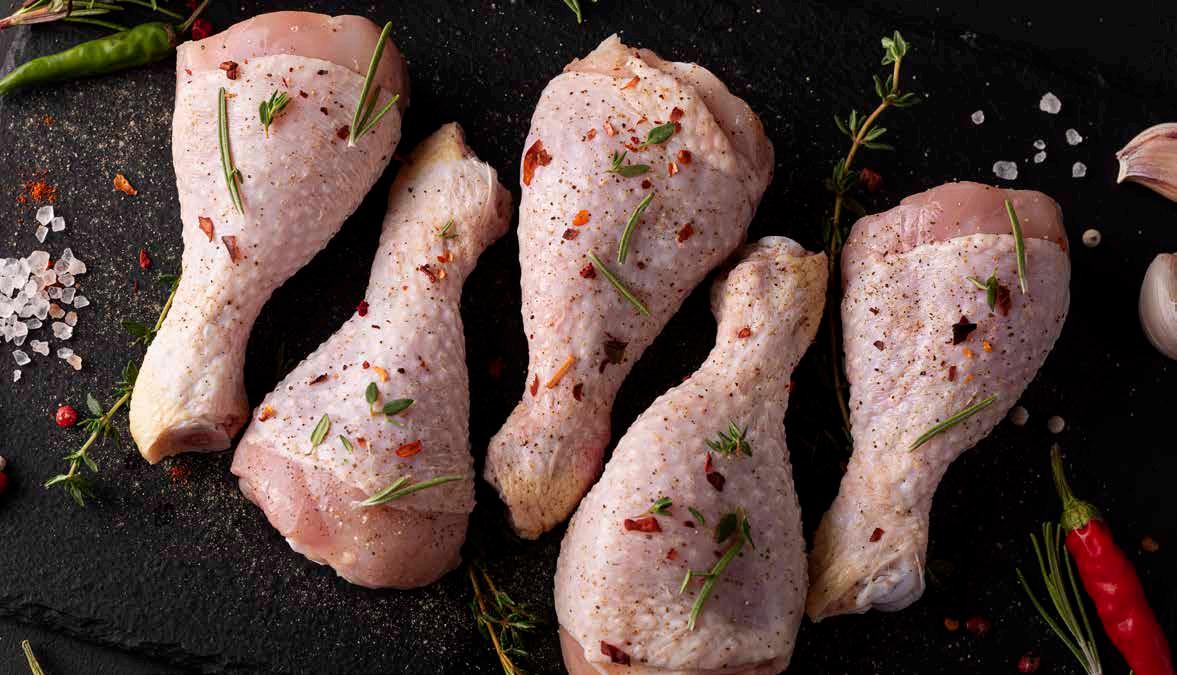
• Broiler production in 2025 should be higher than in 2024 based on recent hatchery data.
· Recent egg sets indicate expansion.
· Broiler production for 2025 should take advantage of record-high beef costs (if productivity can improve).
· Challenges do remain, as there have been production disruptions in early 2025. Production disruptions over the last several months include plant fires, winter weather and disease.
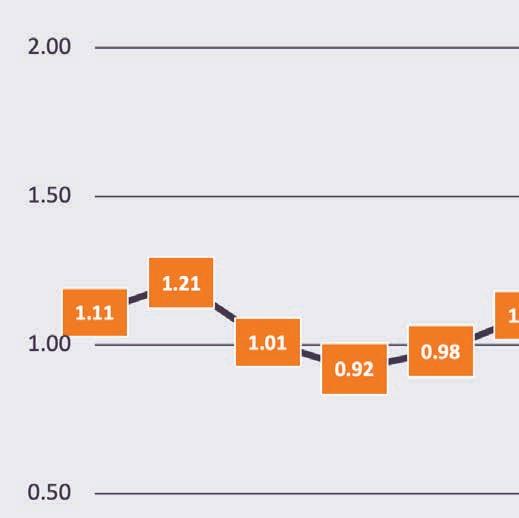
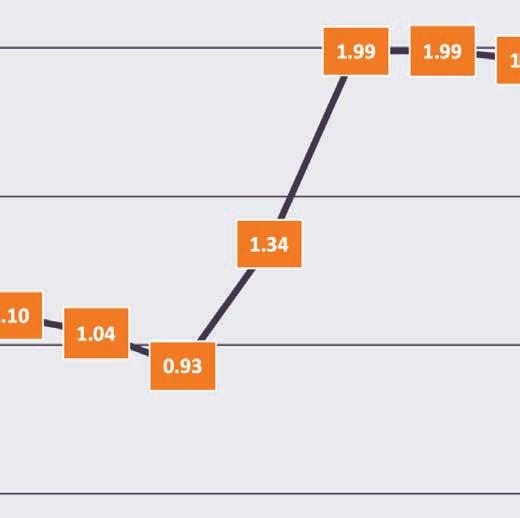
• Chicken pricing remains strong.
• Demand remains large; there is a 1.4% increase forecasted in per capita consumption by the USDA for 2025.
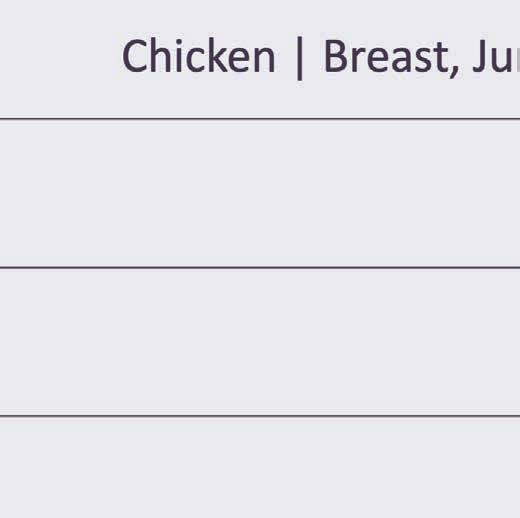
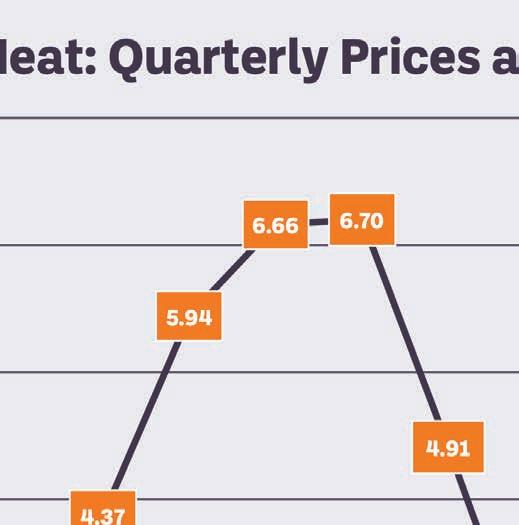
• Breast meat pricing fell seasonally in the fall and winter, but not at the normal rate.
• Chicken pricing is expected to remain higher than normal in 2025 unless the industry can improve productivity metrics.

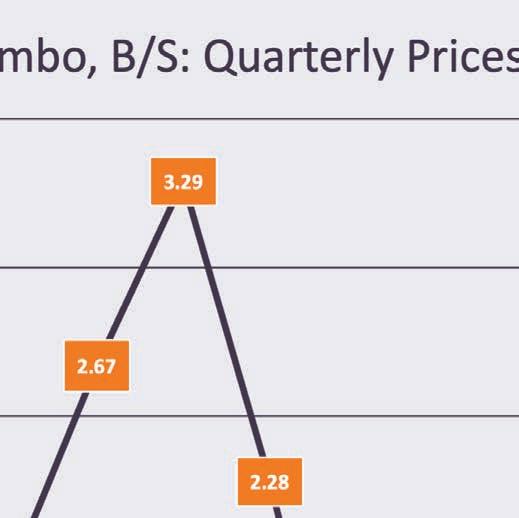
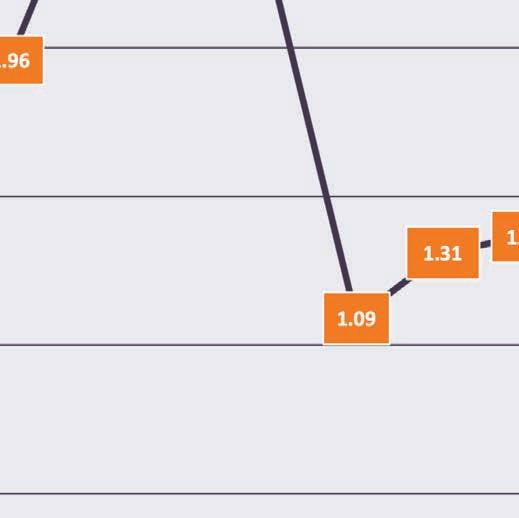
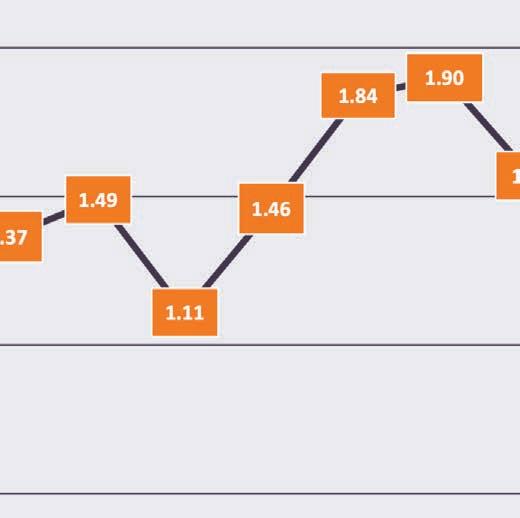
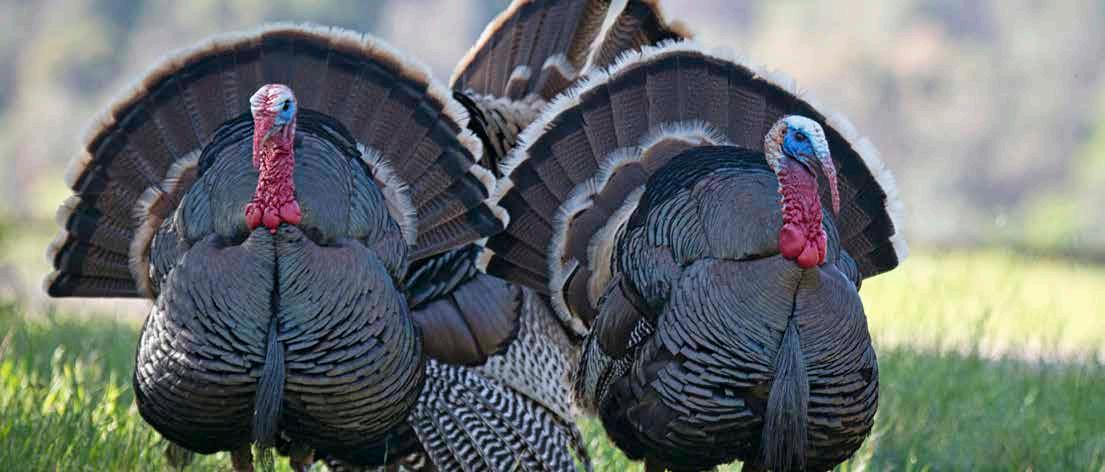

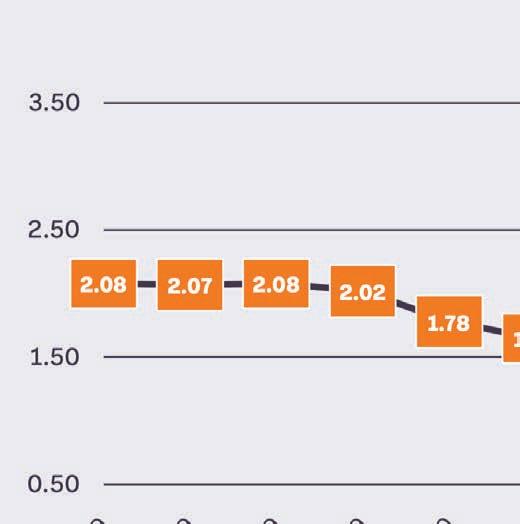
• Turkey production was impacted by HPAI in 2024 and has impacted breeding flock.
· 2025 production will be constrained due to HPAI as well as hatchery and processing closures and lower hatchery supplies.
‧ The industry is scaling back on egg sets and placements, which will impact growth into 2025 – much of this due to disease losses over the last several years and demand not coming back.
• HPAI has continued to infect flocks (see page 25).
• Eggs sets have been down since Nov 2023; for 2024 it was down 7.6% and 0.75% for the first 3 months of 2025.
• Placements are following the same trend –down 7.3% on average for 2024 – and supply will remain constrained into 2025.
• The industry remains in contraction, spurred both by HPAI losses, as well as producers reducing the hatchery.
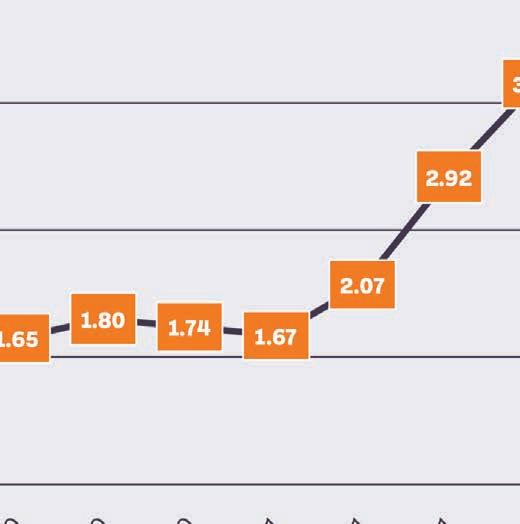
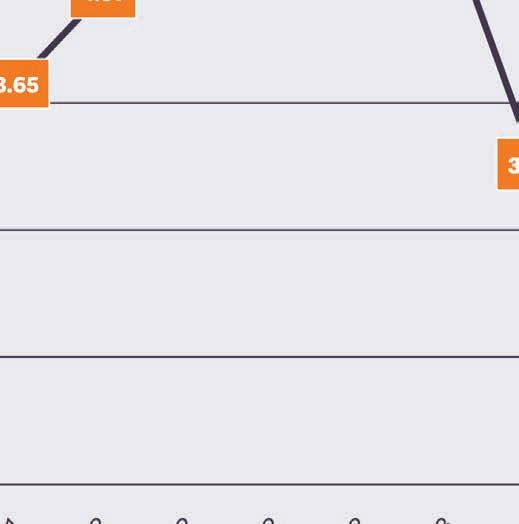
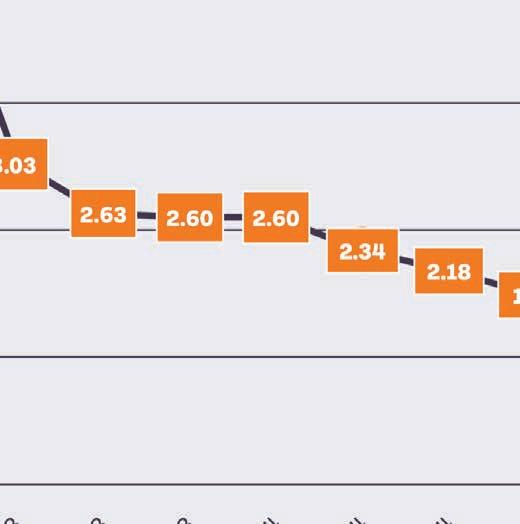

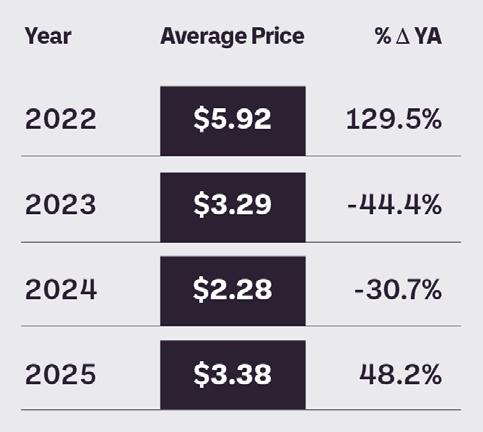
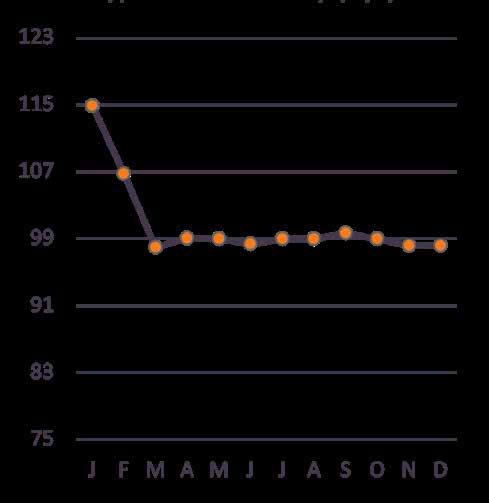

• HPAI impacted this industry significantly since February 2022 with total losses of more than 132.2 million layers from February 2022 – April 2025 (see page 25).
• HPAI losses thus far in 2025 represent about 12% of the total flock and the losses have pushed the flock number down to the lowest since 2015.
• The overall flock is 14% lower than it was before the start of the current outbreak.
• According to the American Egg Board, in general to keep pace with demand, there should be 1 egg layer for every American. Figures vary out there, but that equates to ~350 million head (according to the Congressional Budget Office).
· Current flock numbers are at 285.1 million head or an 18.5% shortfall.
• Pricing is expected to remain elevated as the industry works to rebuild.

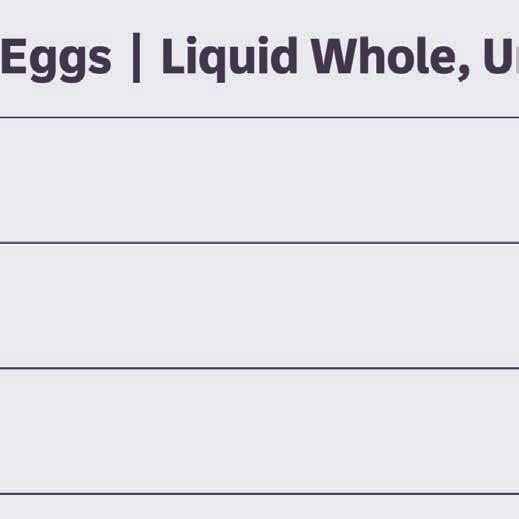
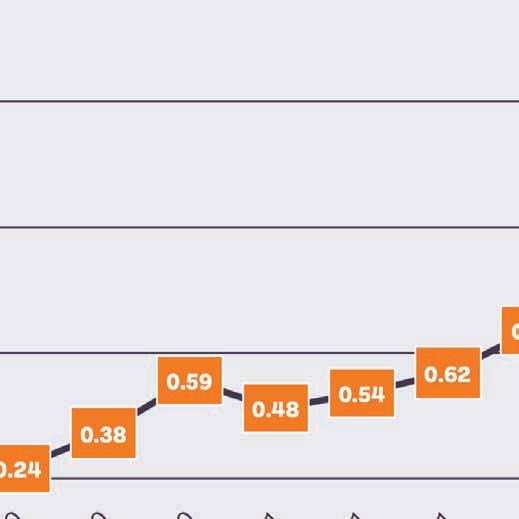
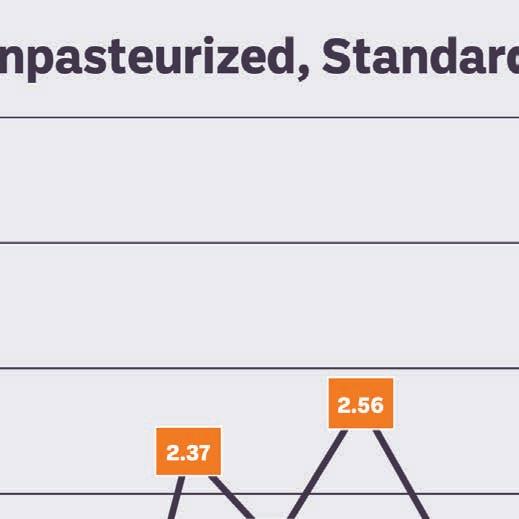
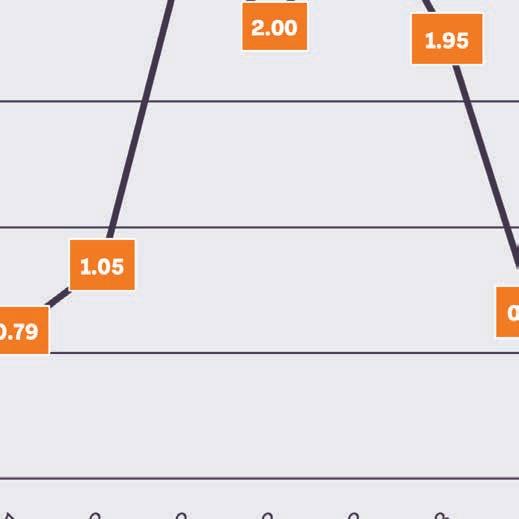
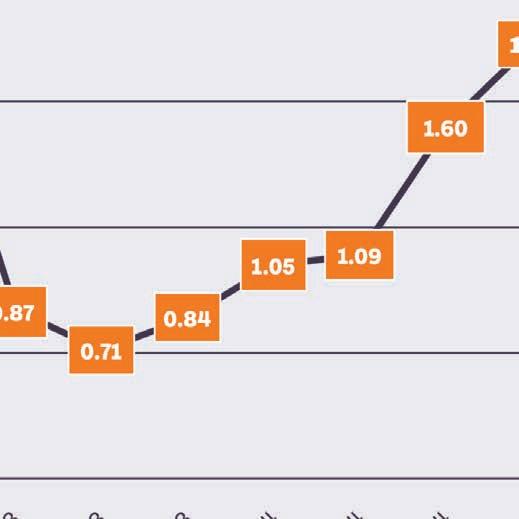
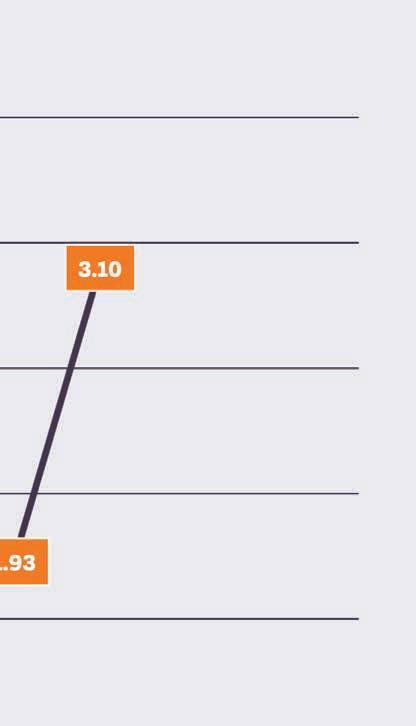
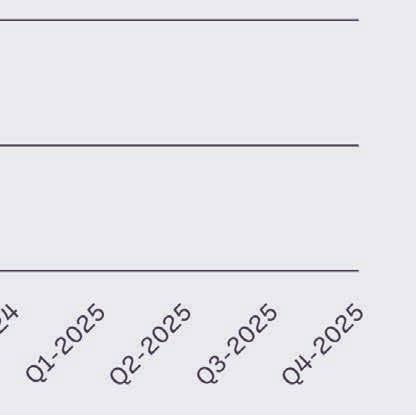
Source: Slade Gorton
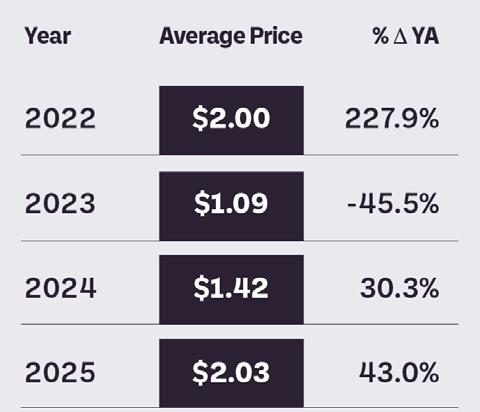
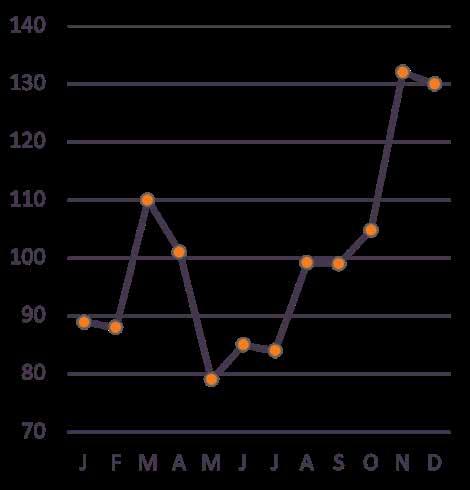
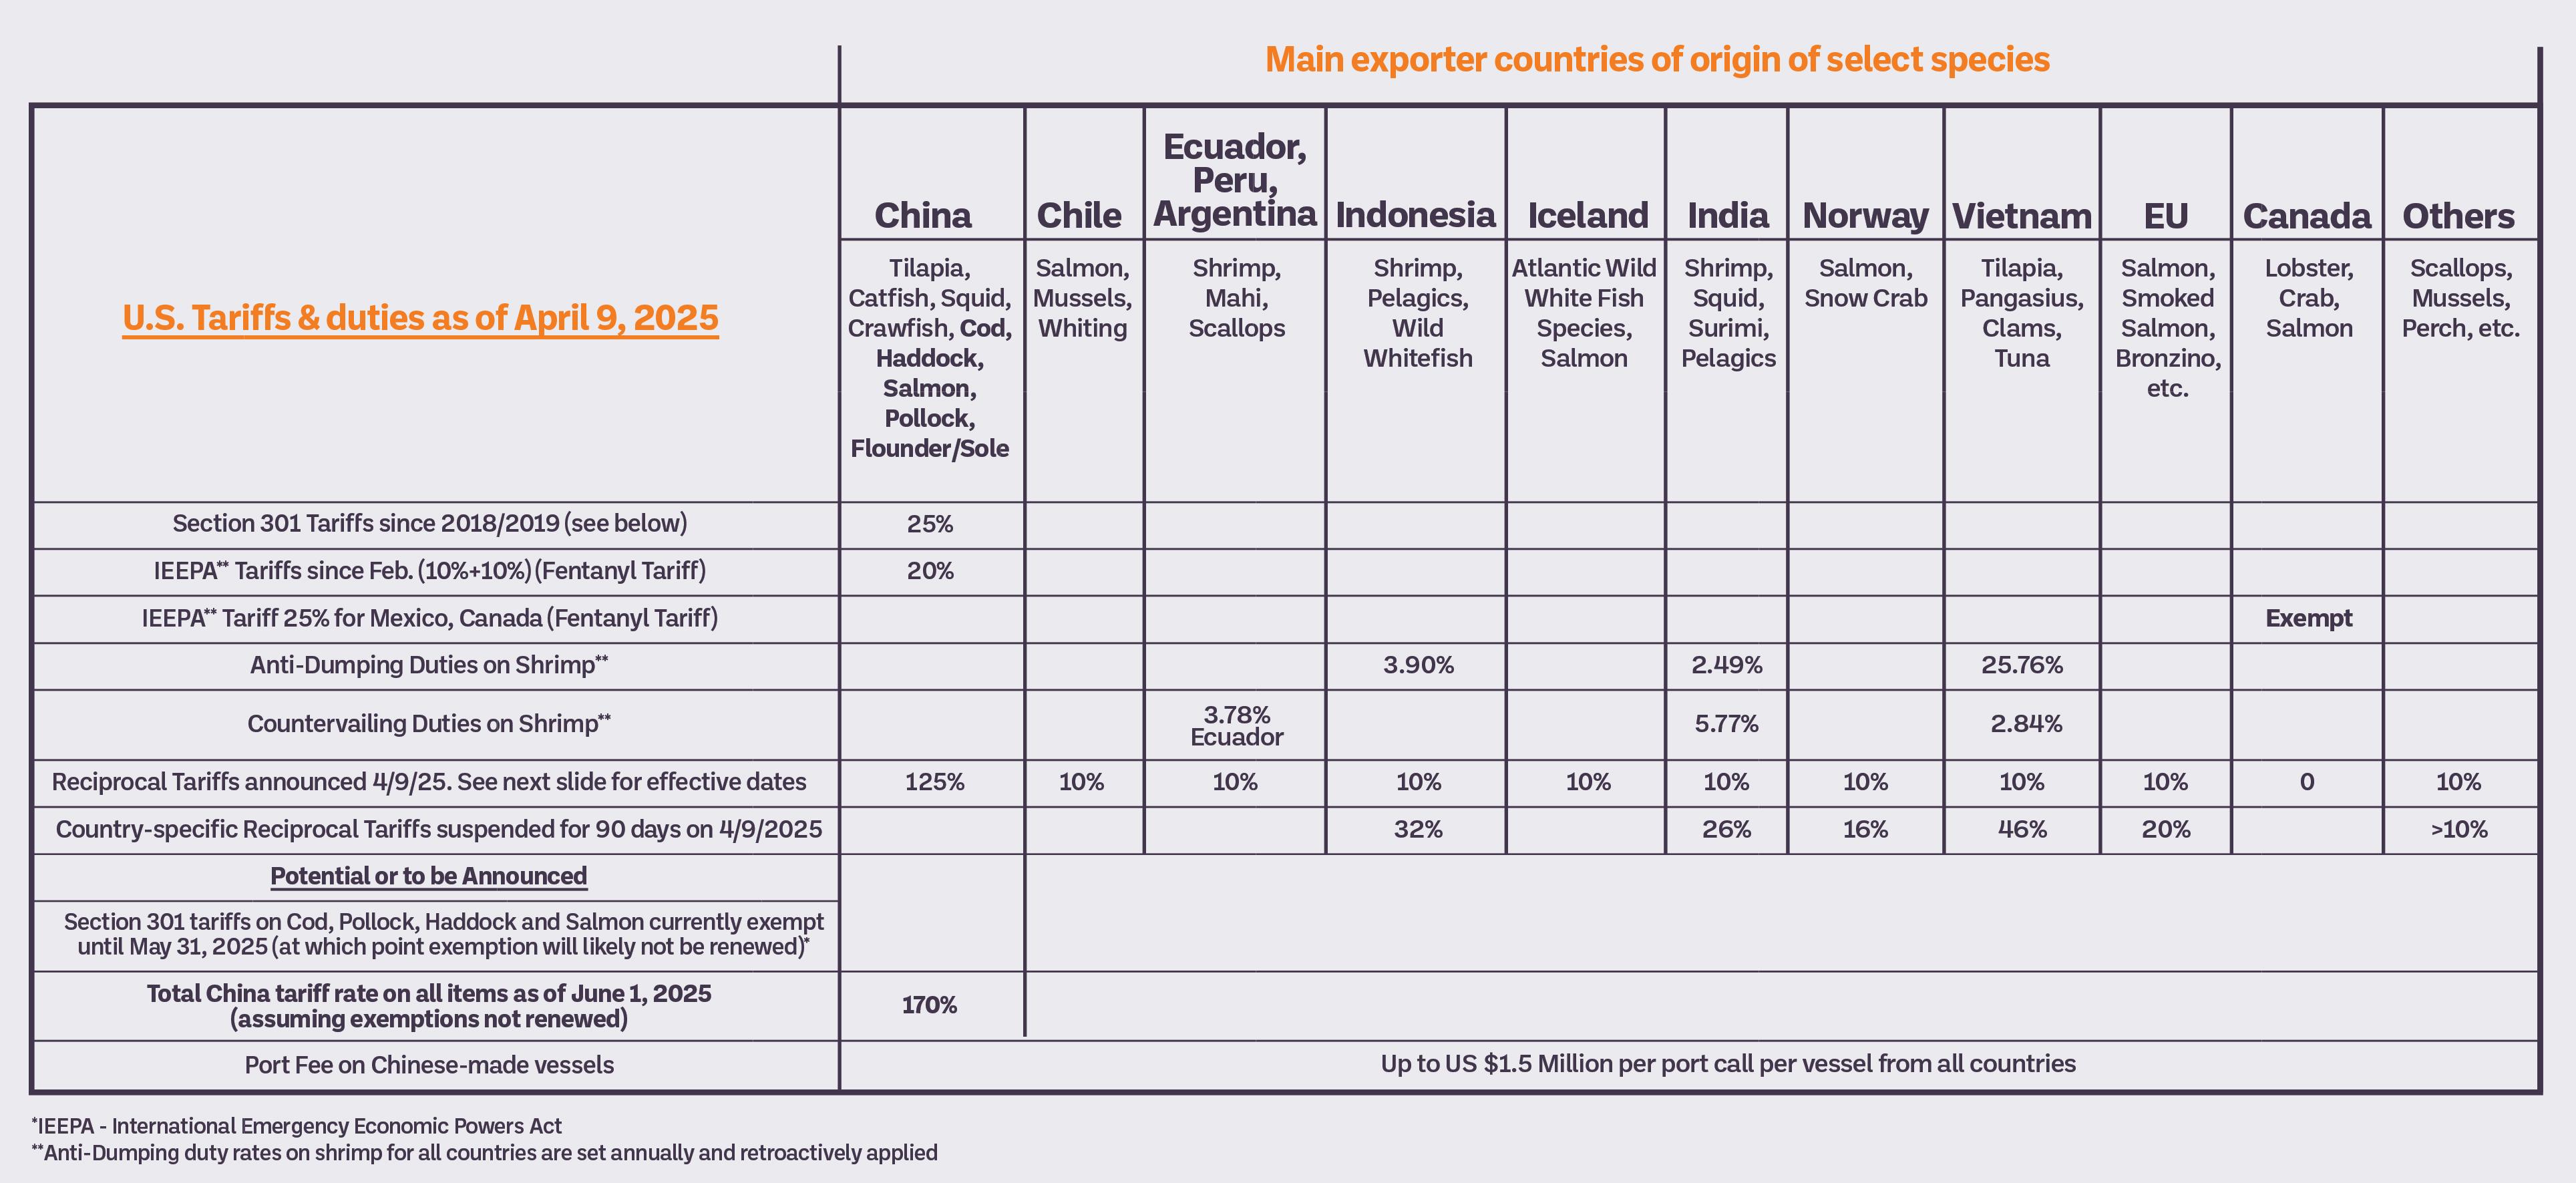
• Total U.S. seafood imports were up 4.9% YoY in 2024. Growth came primarily from tilapia, pangasius, scallops and lobster. Meanwhile, imports of shrimp, salmon, crab and wild groundfish declined in varying degrees. New U.S. tariffs are expected to inflate replacement costs of all imported species beyond the inherent supply and demand fundamentals.
• U.S. shrimp imports decreased 3% in 2024 due to the impact of new U.S. anti-dumping and antisubsidy tariffs but were up 14% in the first two months of 2025 before the new U.S. reciprocal tariff announcement. Global shrimp production has been stable over the last few years, with 1% growth expected in 2025. Shrimp prices were already rising before the new U.S. tariffs were enacted.

• U.S. salmon imports were down 4% in 2024. Salmon supply is projected to grow 2-3% in 2025. Growth will be from European producers, while Chilean and Canadian production is expected to be flat compared to last year.
• Tilapia and Pangasius imports surged 8% and 7% respectively in 2024 as production improved in China and Vietnam. If sustained, new high U.S. tariffs on China will severely limit frozen tilapia imports to the U.S. Tilapia pricing is set to surge in the second half of 2025 while supply dwindles. Pangasius demand will likely increase as an alternative to tilapia.



• Total wild Groundfish imports were down 2.2% in 2024 despite a late-year surge from China ahead of anticipated new U.S. tariffs. The downward trend will continue in 2025 with a 20%+ quota cut in Atlantic cod and high tariffs limiting Chinese production. The Russian ban remains in place and will continue to constrain supply for the U.S.
• Whitefish of various species, forms, and price points are expected to appear on more menus and retail shelves as end-users or consumers explore alternative options to tilapia and other lower-cost whitefish from China.
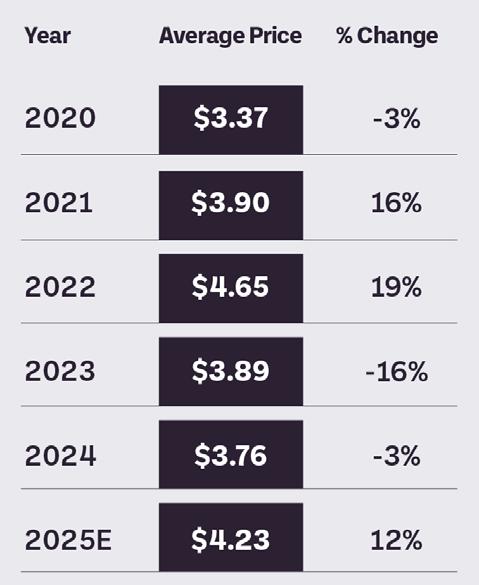
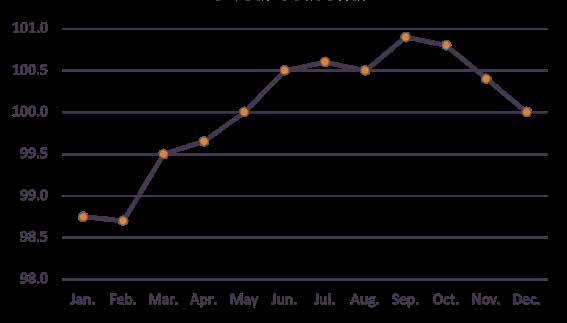
Global trade and geopolitics continue to impact the seafood market, raising costs and injecting uncertainty and volatility into the seafood supply chain.

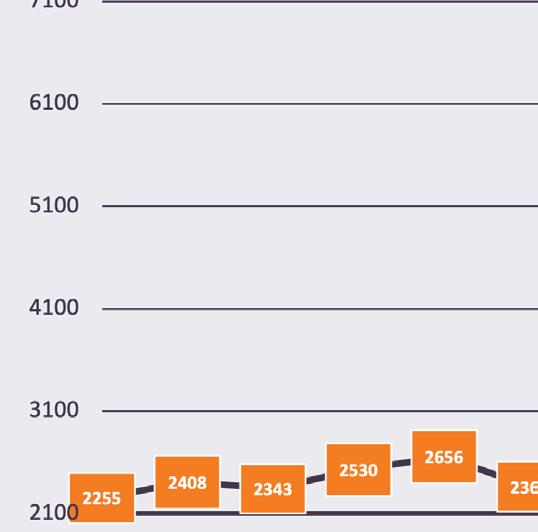
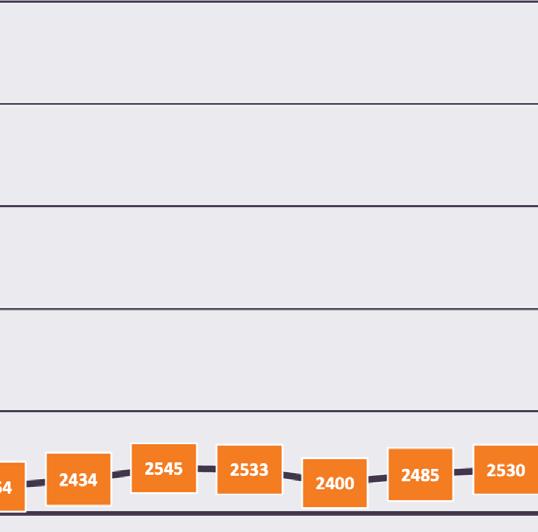
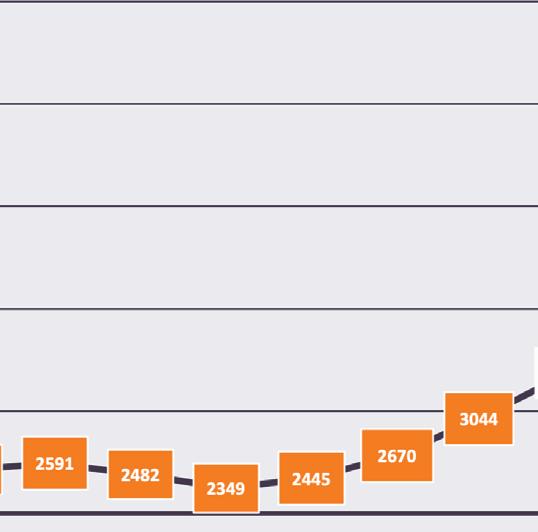
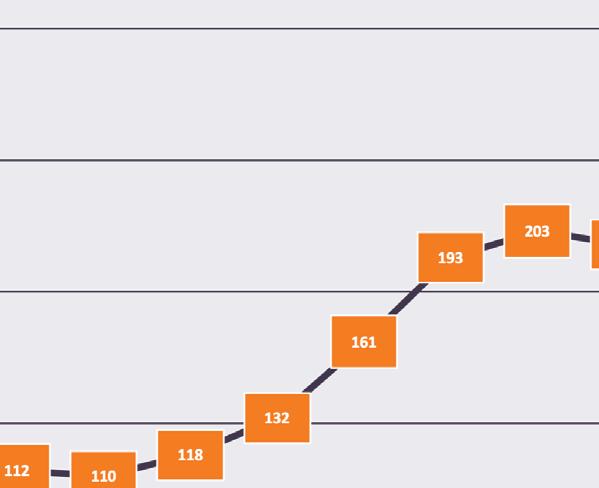
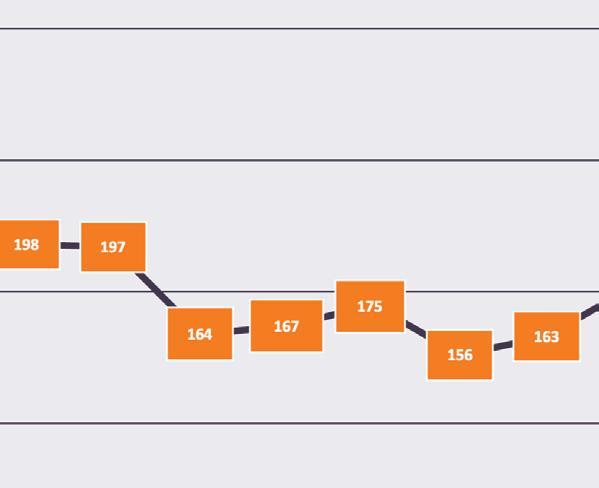
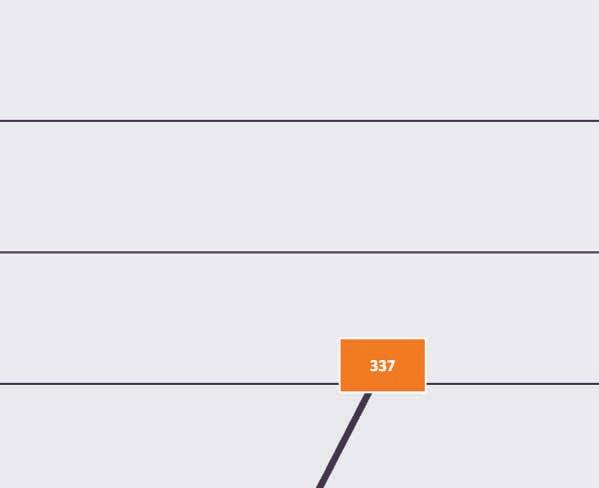
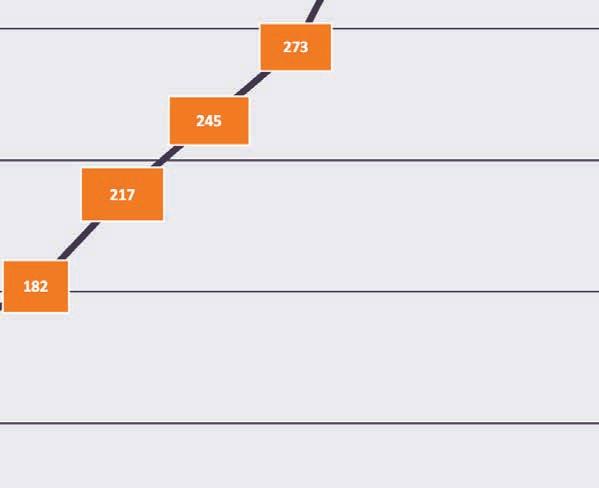
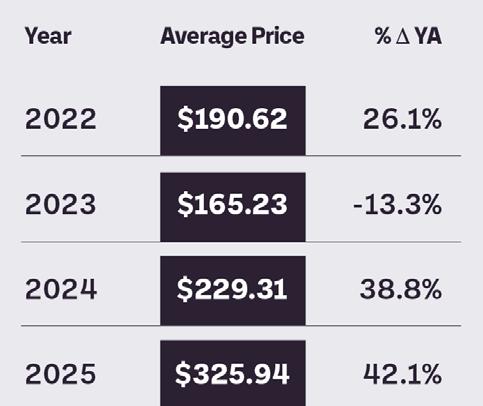
• After peaking earlier this year, cocoa prices have declined.
• Production in key growing regions is improving; Ghana’s production for 2024/2025 is up by 34%. This improvement is driven by more favorable weather and improved cocoa tree management.
• Cocoa grindings data indicates that demand is declining – 2024 was down 5% - as companies and consumers look for alternatives due to the high prices of cocoa.
• This is indicative of a slight surplus for 2024/25, but after 3 years of a significant deficit, continuing risks of disease and unfavorable weather conditions, this is only expected to result in slight price relief.
• While fundamentals are improving, it will take multiple years for world cocoa production to recover and prices are expected to decline throughout 2025 and are not expected to return to previous levels.

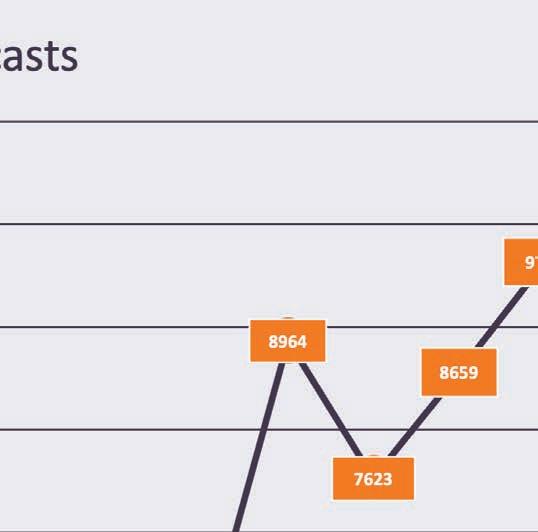
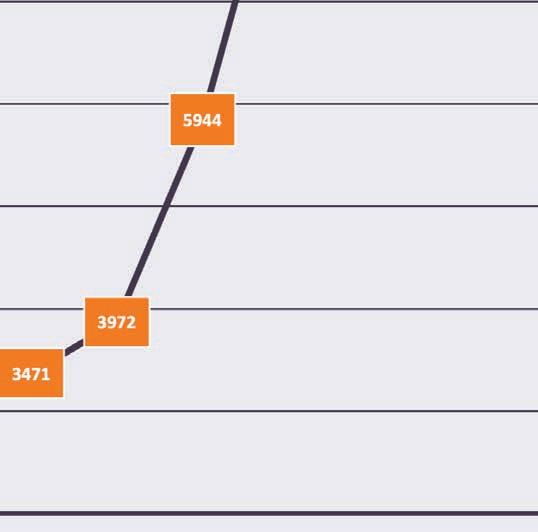

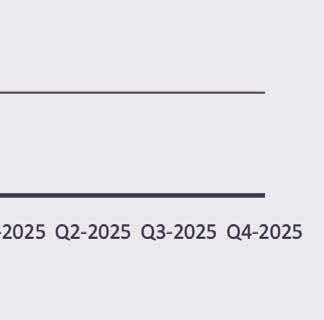
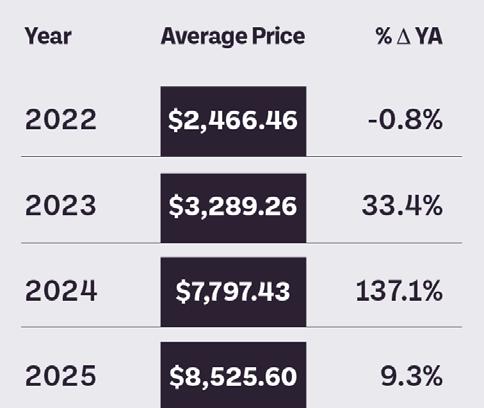
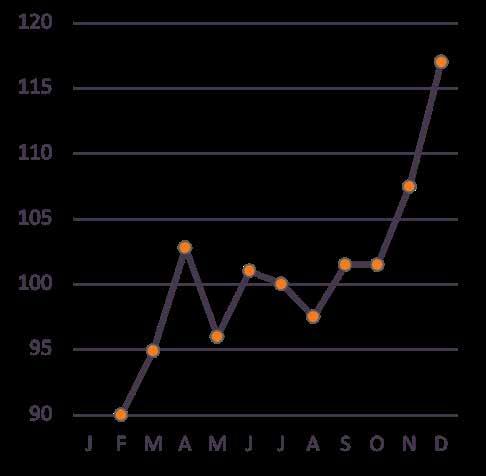

• Tariffs and tight supplies have kept the coffee market very volatile and prices high. The coffee market reached record highs February and has since decreased.
• Tight Arabica supplies are keeping prices elevated – Brazil’s Arabica crop is now expected to be 12% smaller than last year’s crop so supplies are expected to remain tight. Certified stocks have also continued to decline.
• Vietnam’s Robusta crop has slightly recovered and Brazil’s Robusta crop is expected to be 19% larger than last year’s crop.
• Robusta prices are expected to decline in 2025 while Arabica prices are expected to remain elevated. Our current forecasts for futures prices indicate slightly higher prices in the short term for Q2 and declining prices in the second half of this year with a similar pattern for the ICO index, just driven lower by Robusta prices.




• Sugar prices have declined.
• Record sugar production for crop year 2024/25 and slower than expected deliveries indicating decreased demand are putting downward pressure on prices.
• While sugar program-controlled imports (Mexico and TRQ) are restricted to the minimum amounts per agreement terms due to the large domestic production, high-tier imports continue to increase. Low world prices make it economical for non-integrated refiners to continue to import this high-tier sugar.
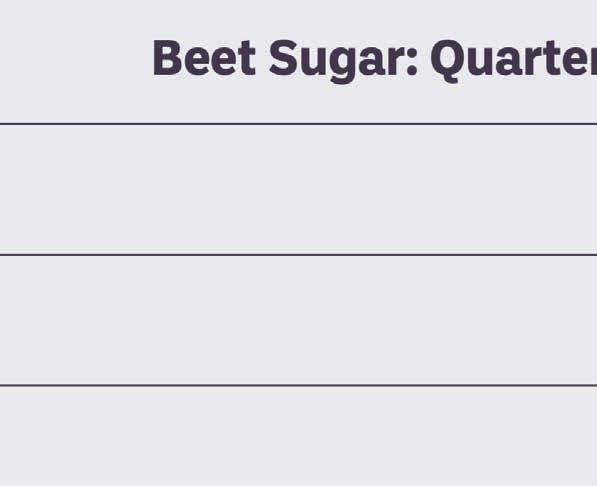
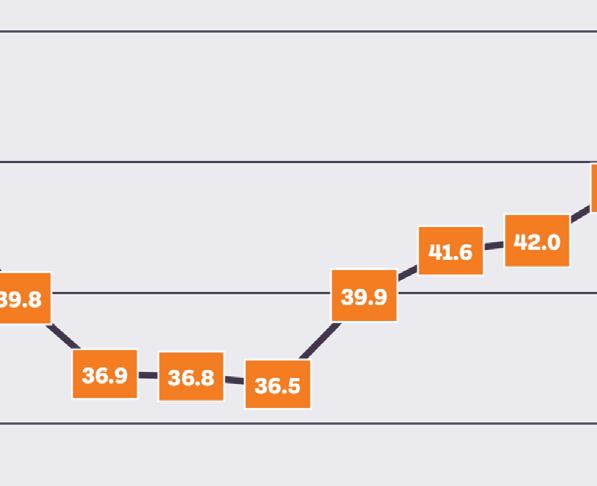
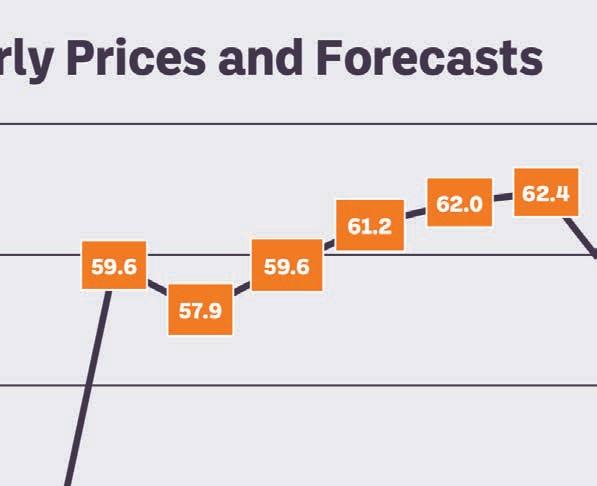
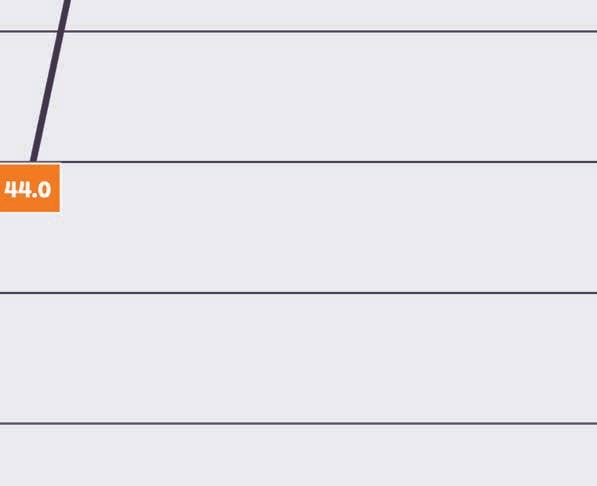

• The March prospective planting report also indicated an increase in sugar beet acres planted in 2025.
• Record crop year production and decreasing demand continue to keep prices depressed.
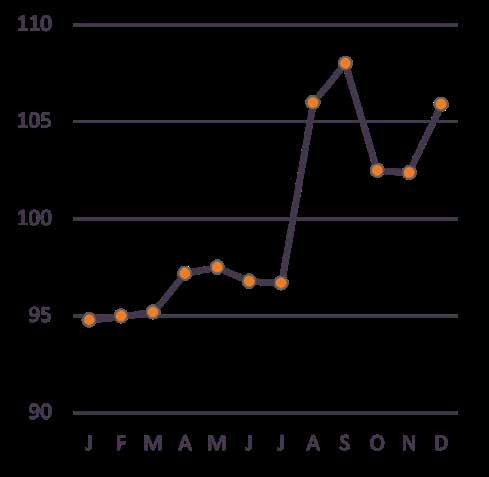
Source: Fresh Concepts
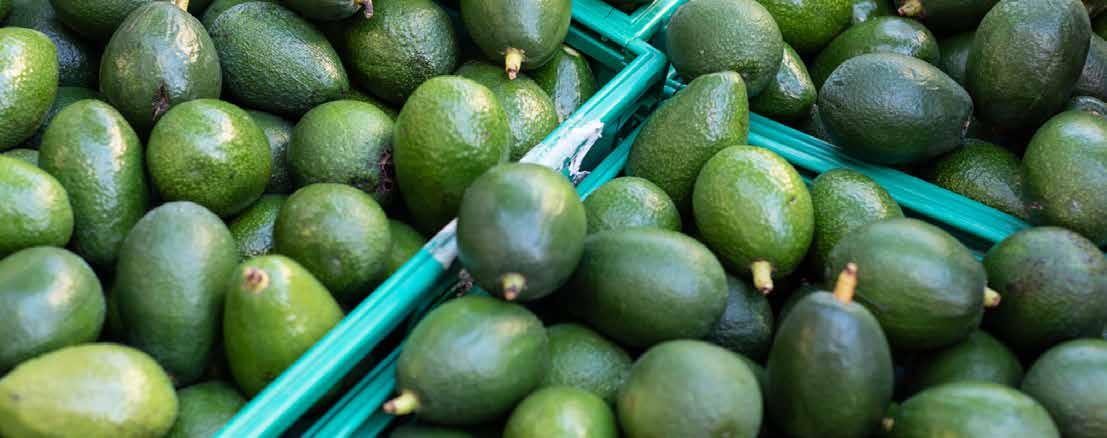
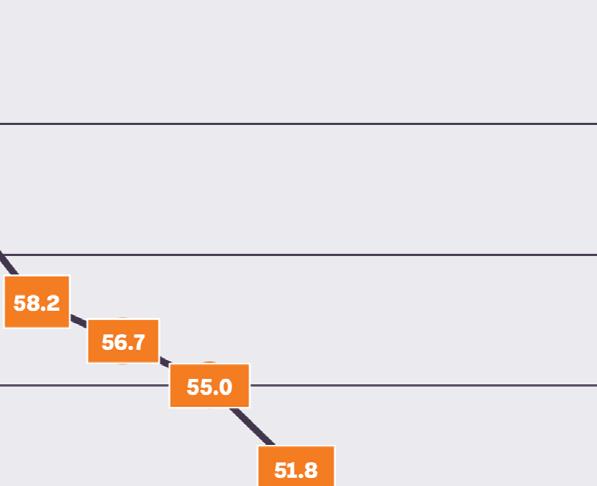
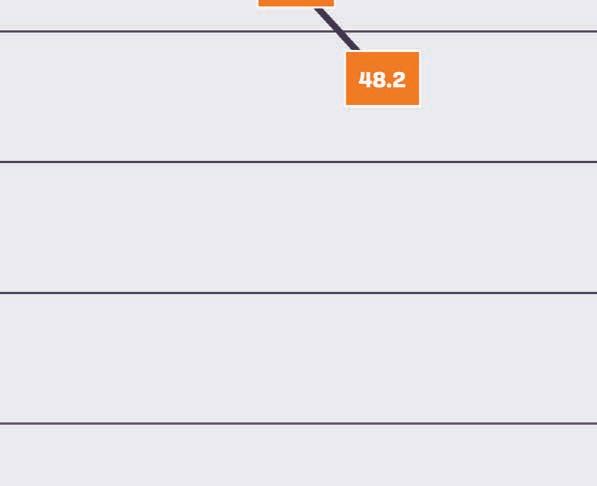
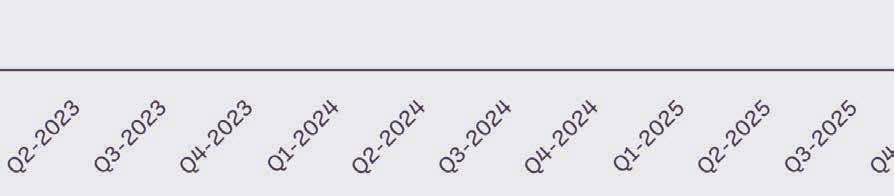
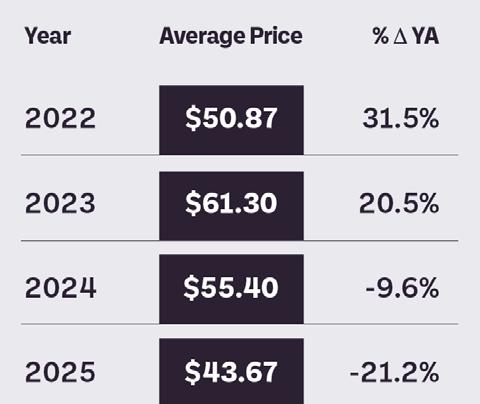
Avocado supply has been extremely tight due to a 20% reduction in the Mexican crop, caused by poor weather conditions including low rainfall during growth, extended rain during harvest, and the emergence of the branch borer worm, which has damaged fruit and caused a reduction in yields. USDA-imposed security restrictions on packing houses have further slowed exports, limiting available product.
As demand spikes ahead of Easter and Cinco de Mayo, prices are expected to remain elevated throughout Q2. Thereafter, production is expected to transition to the new crop in Mexico, which should help bring relief to the market.
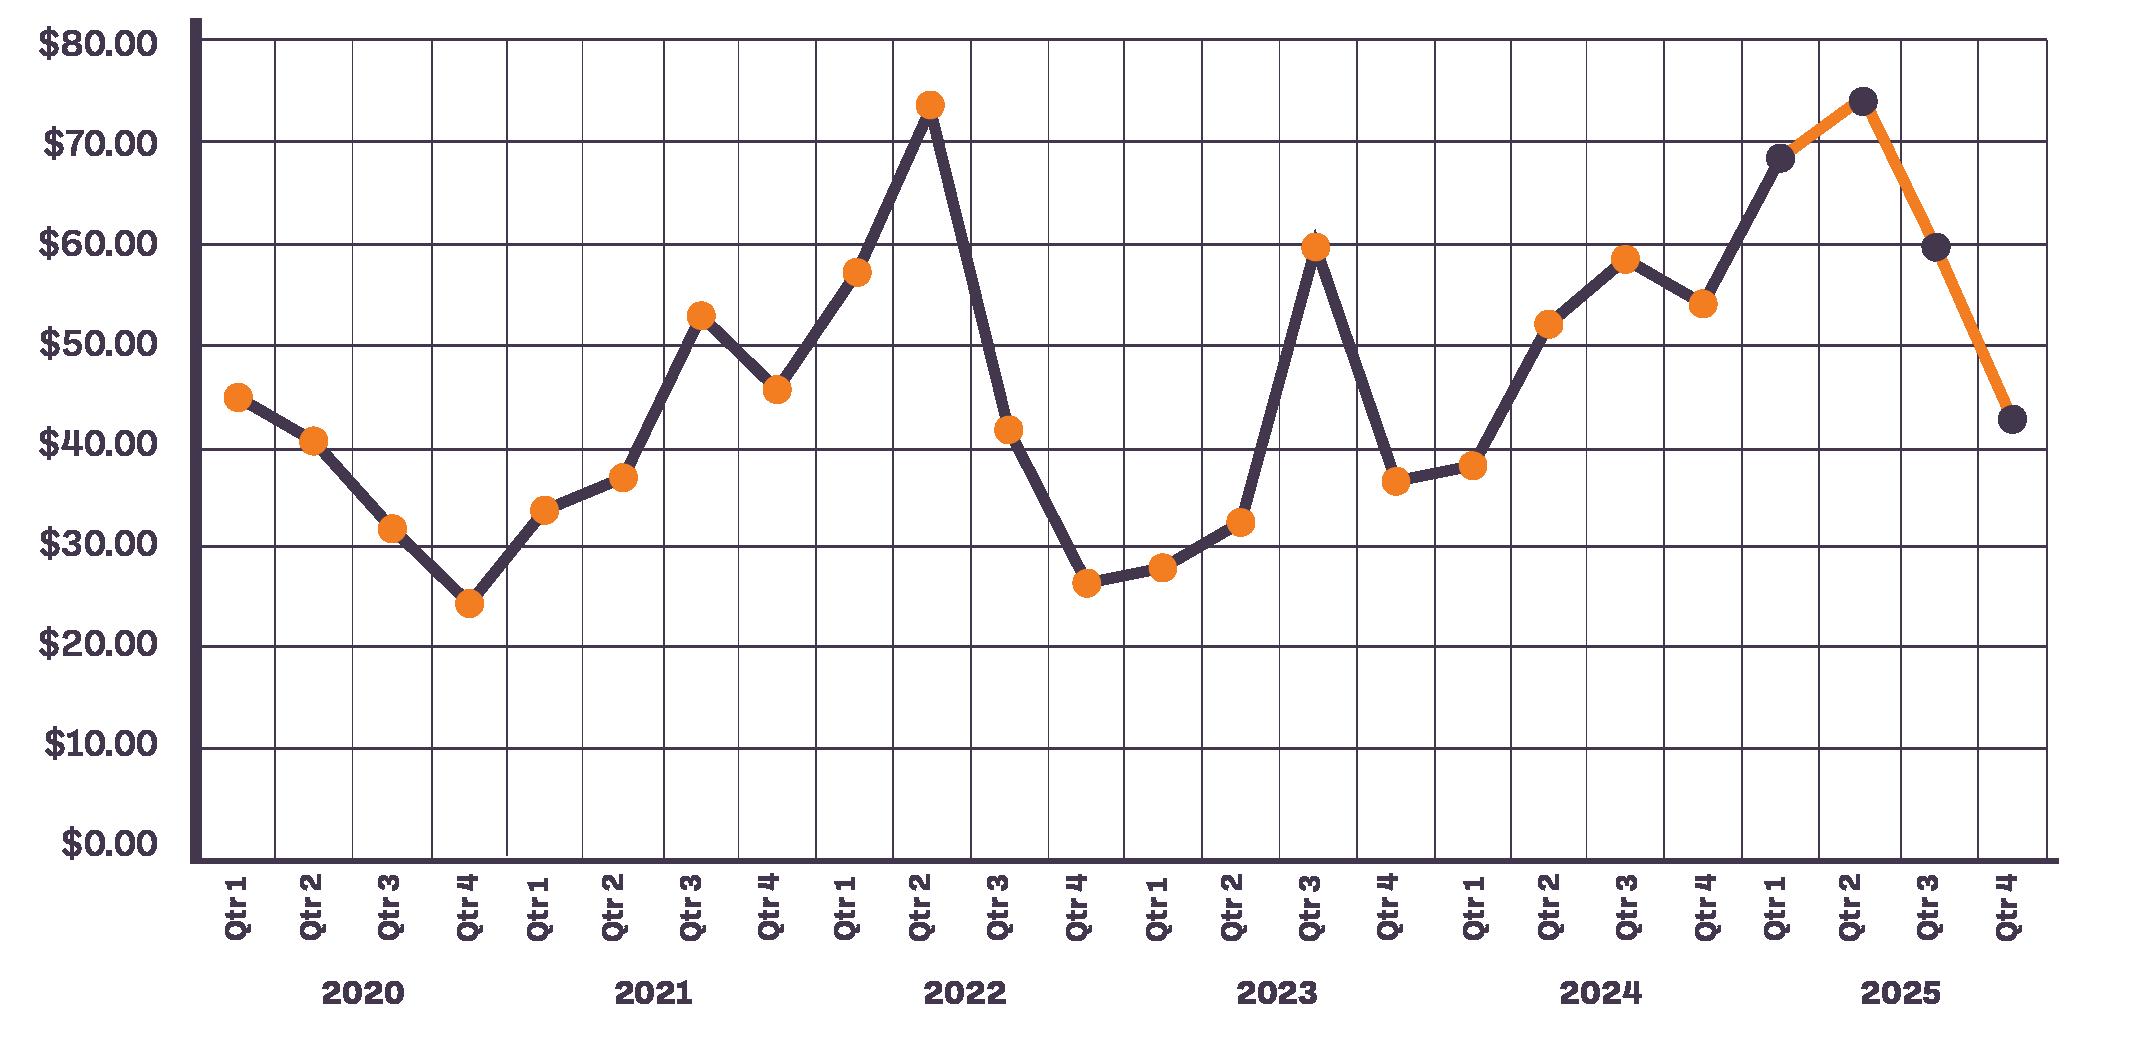
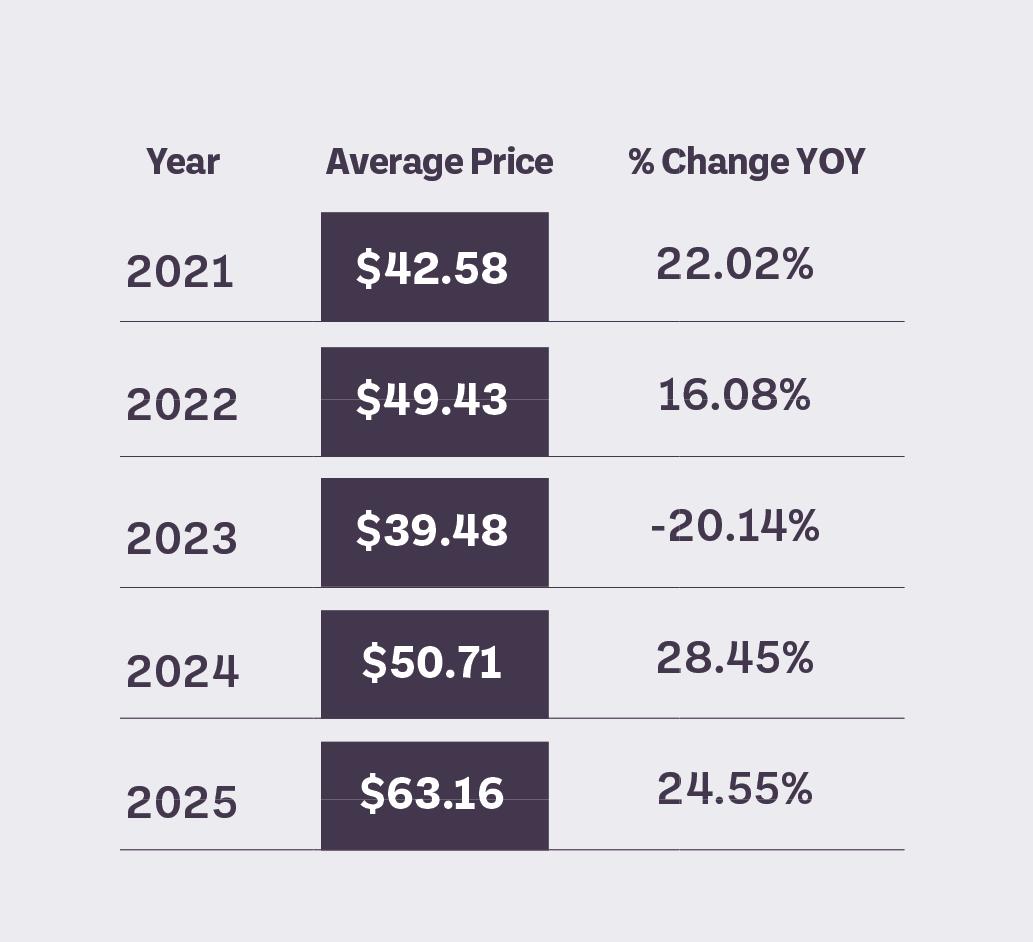
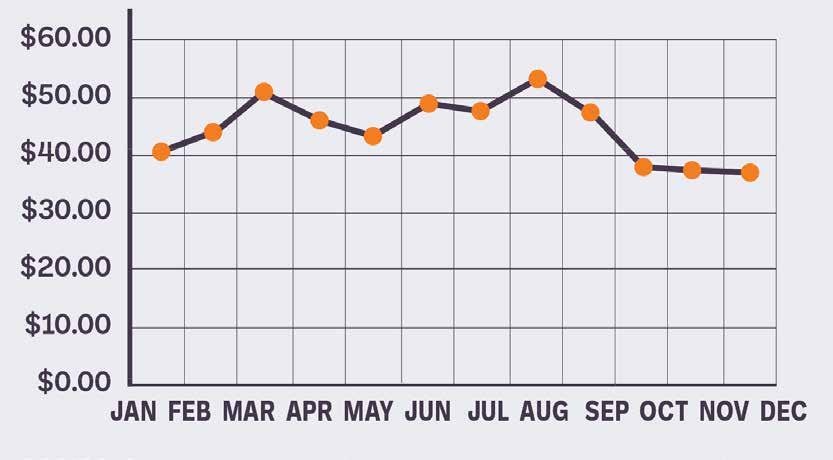
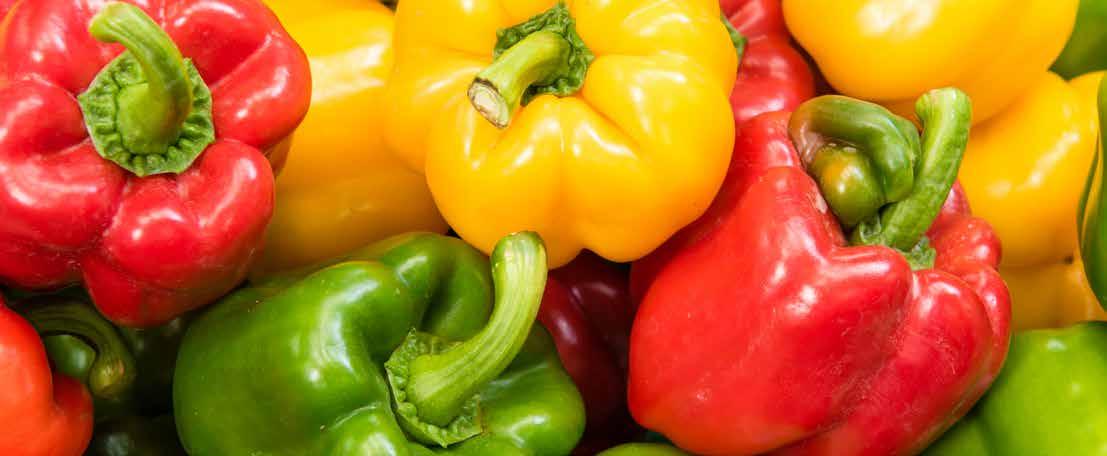
Crops in both Mexico and Florida are seeing sufficient supplies to meet demand, however both growing regions are seeing some quality issues, causing a shift in availability, with less #1 large grade product available and more choice. Supplies are expected to remain steady in both Florida and Mexico.
The East will inevitably plan to transition to Georgia and thereafter ramp up for its local seasons, and Mexico will plan to transition to Baja California and the California Desert.
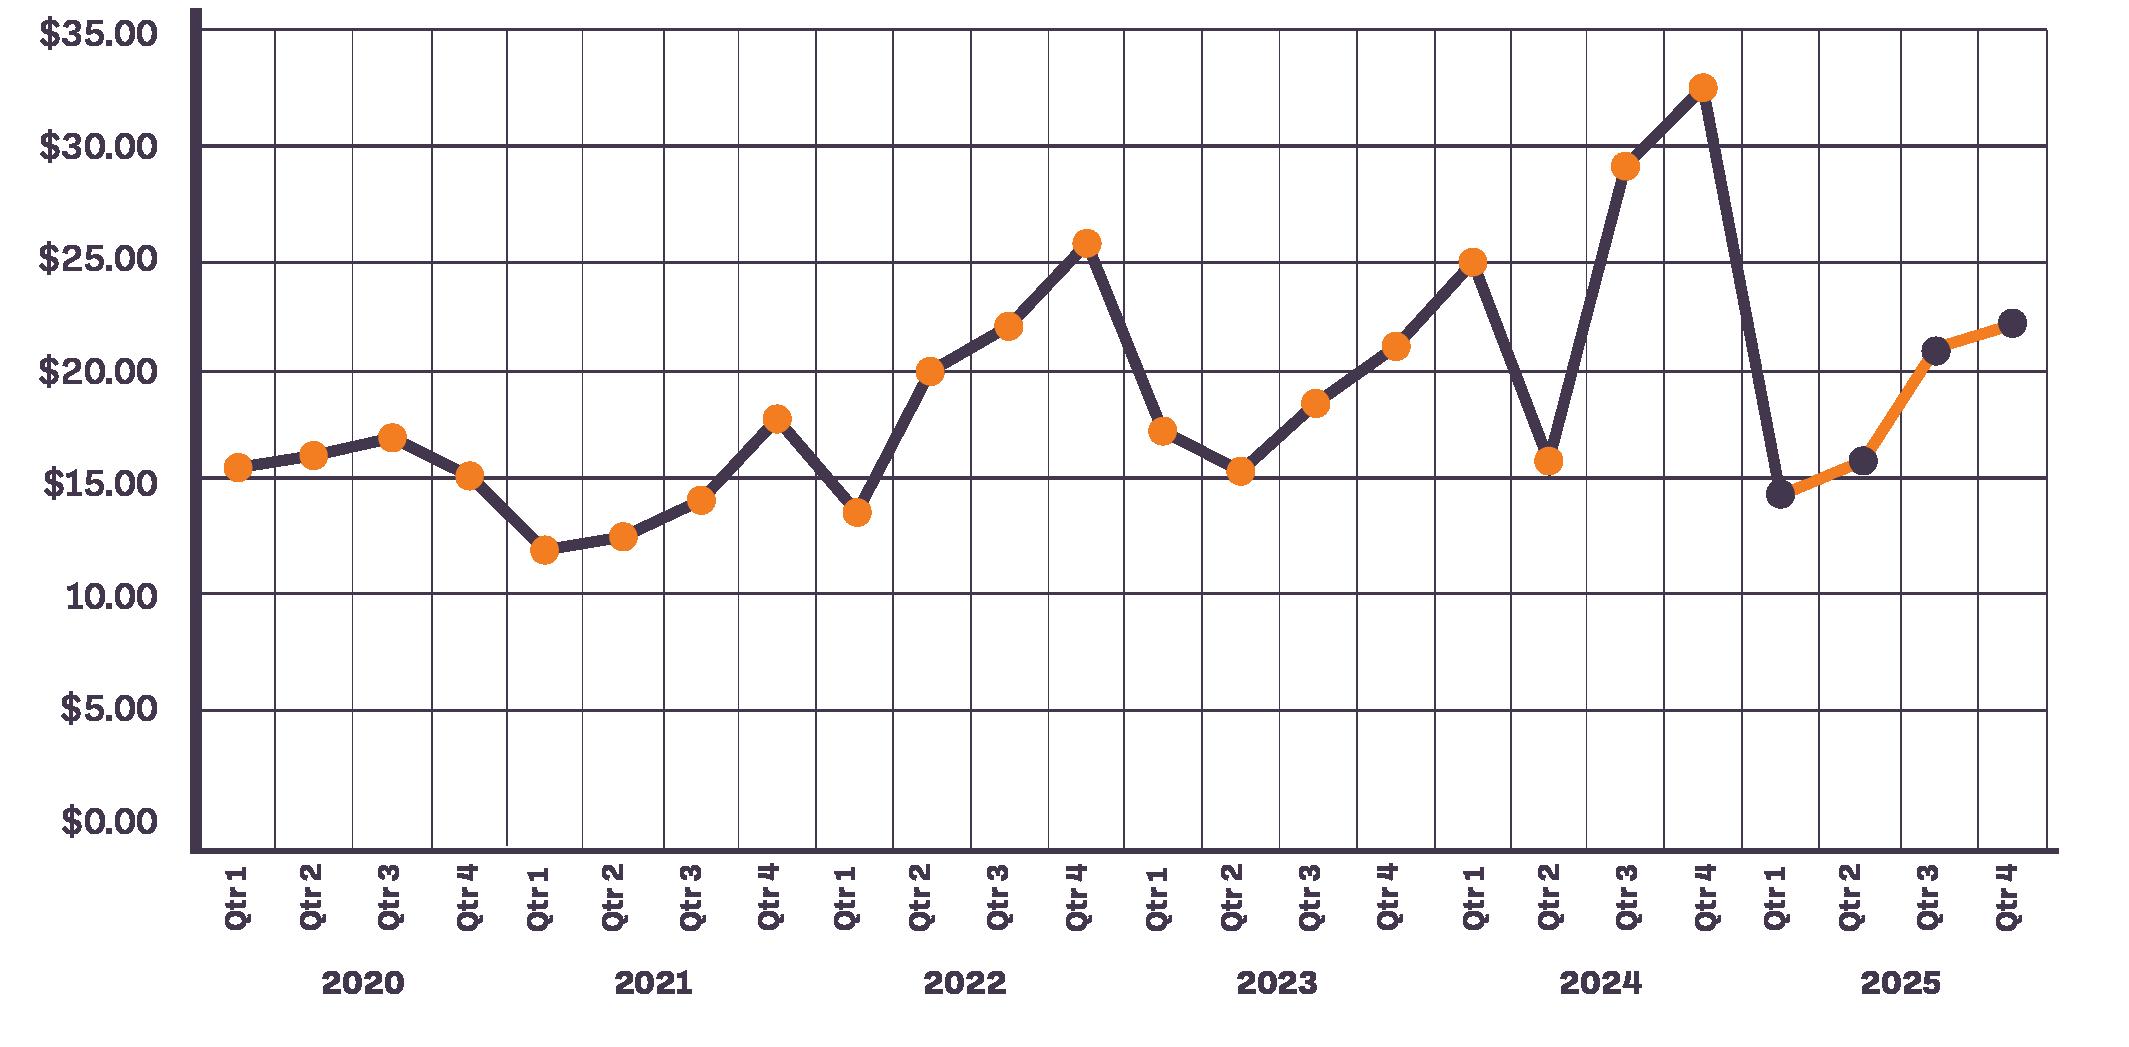
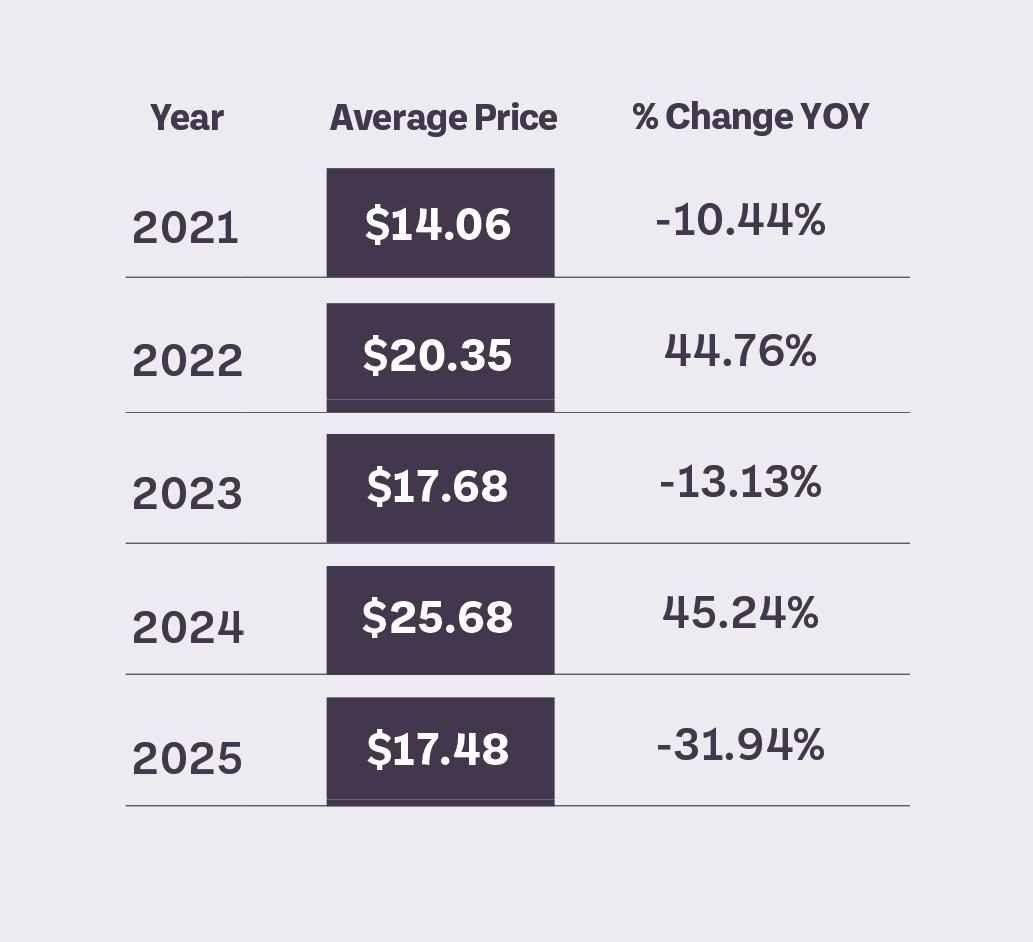
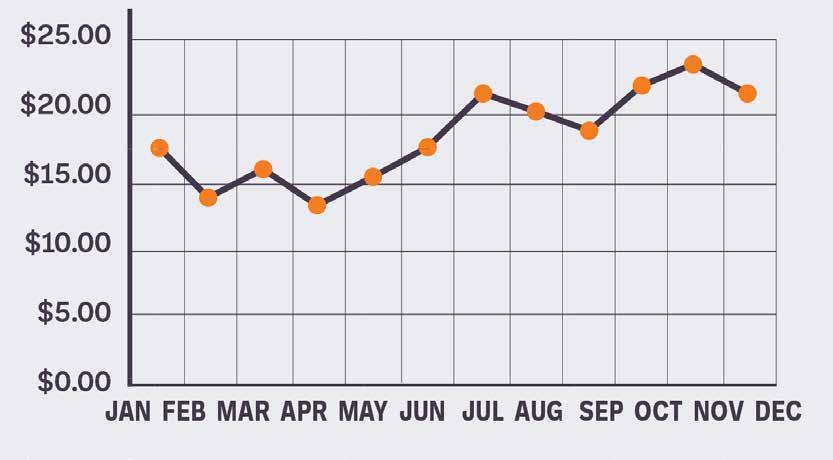

While Q1 saw a general glut of available iceberg supplies that easily met demand and good quality, with the transition to Yuma underway the market is quickly picking up. Moving into Q2, some growers will be utilizing Huron as a buffer in between Yuma/Salinas, however many will not; as a result, we are expecting some quality and supply challenges due to the typical transitional volatility.
As growers settle in to Salinas, the market should reach a steady level, and barring any significant adverse weather conditions we should see a relatively steady summer.
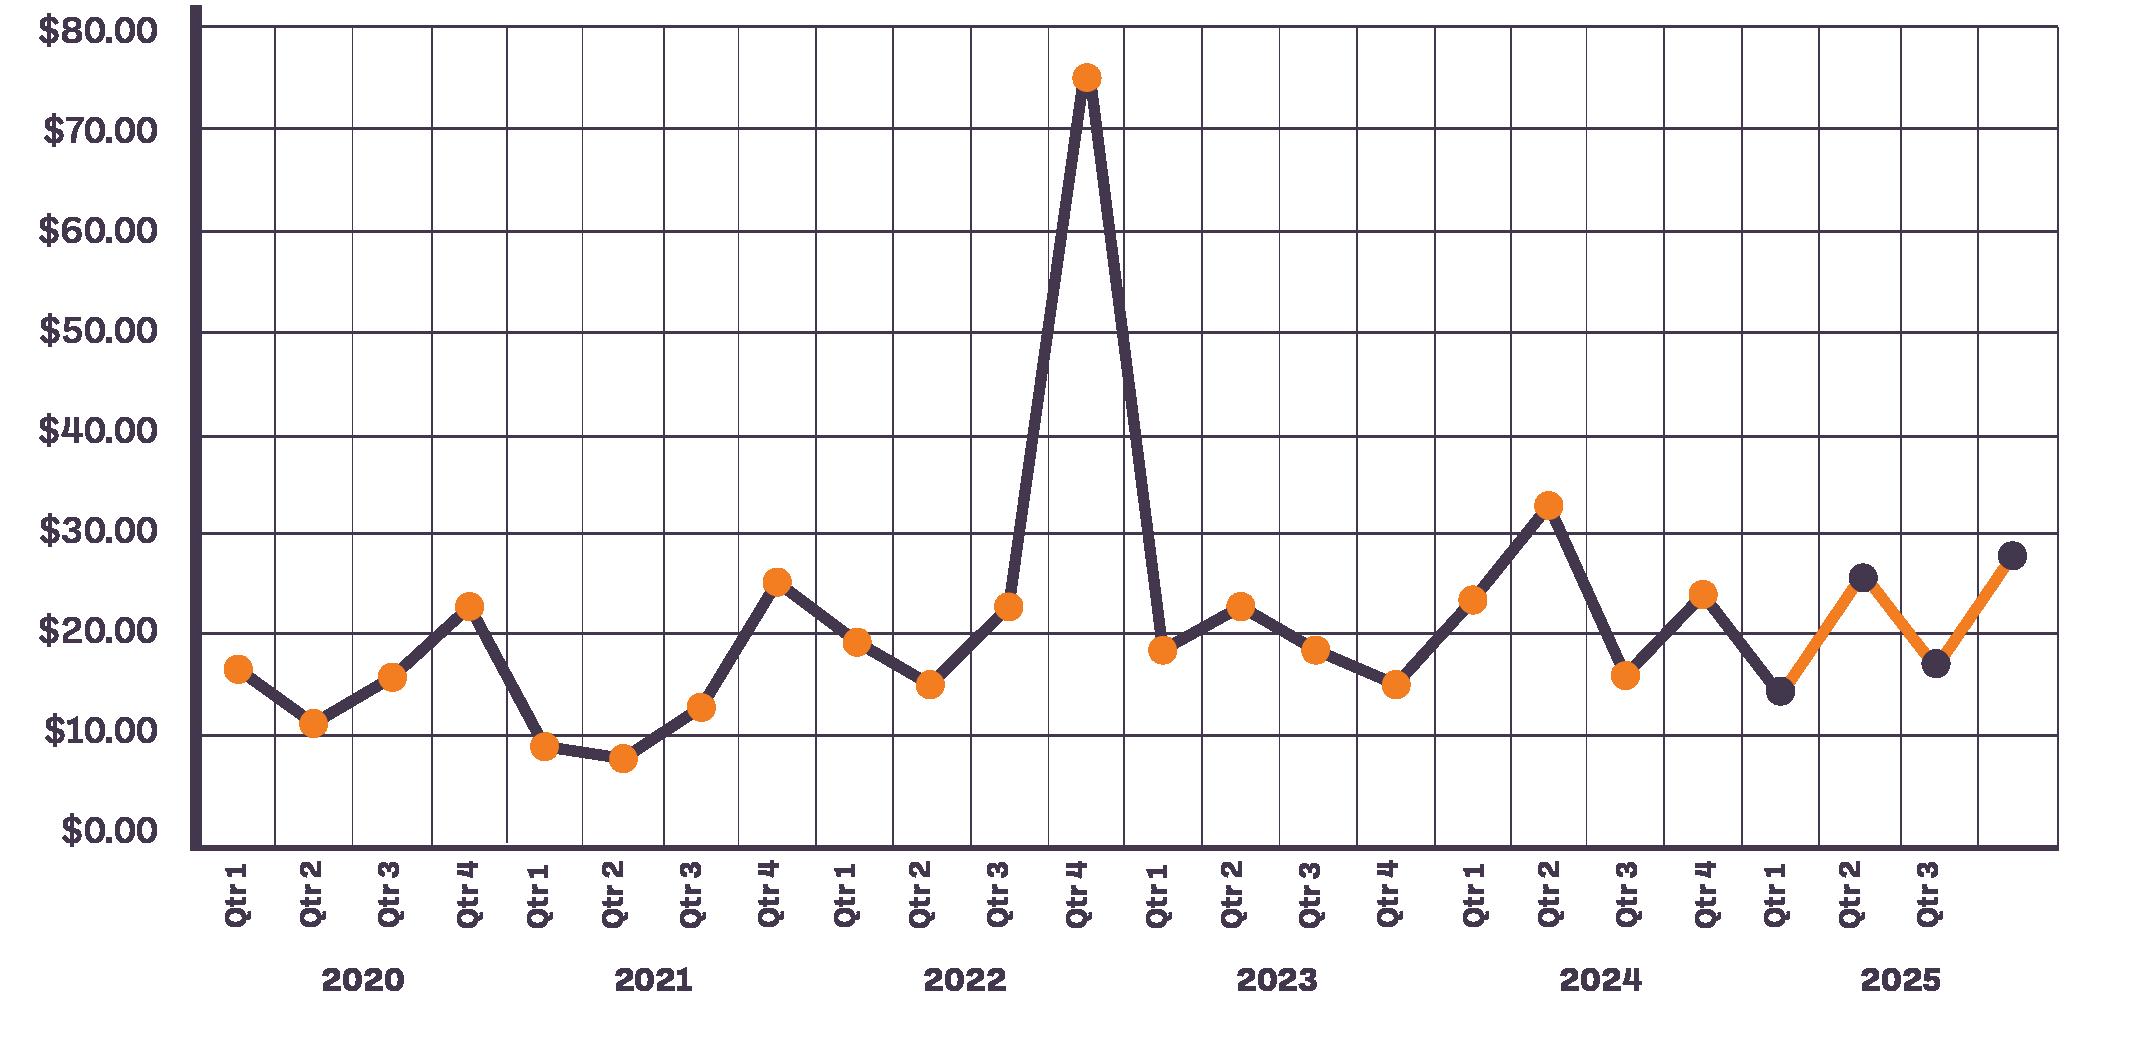
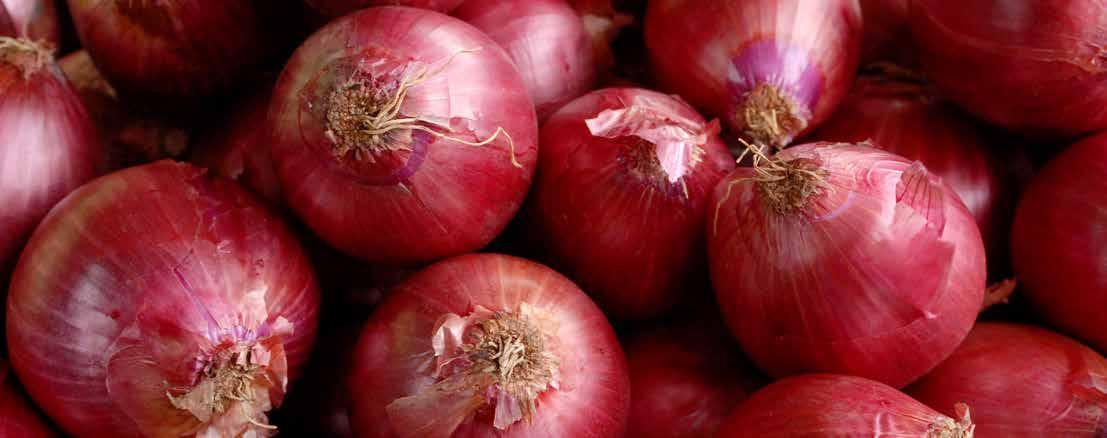
Onion growers are at the tail end of their storage crop in the Northwest, and California is beginning to ramp up its first season in Southern California. As the market transitions, it is safe to expect at least a moderate degree of volatility throughout April and into May. Come June, California will transition to Central California, and New Mexico’s season will pick up as well, which will help stabilize the market.
Growers will plan to transition once again to the Northwest growing regions in September. At this point it is far too early to tell with any degree of certainty what that crop will look like; growers have planted accordingly, and barring any significantly adverse weather events, we will be hopeful for a smooth transition.
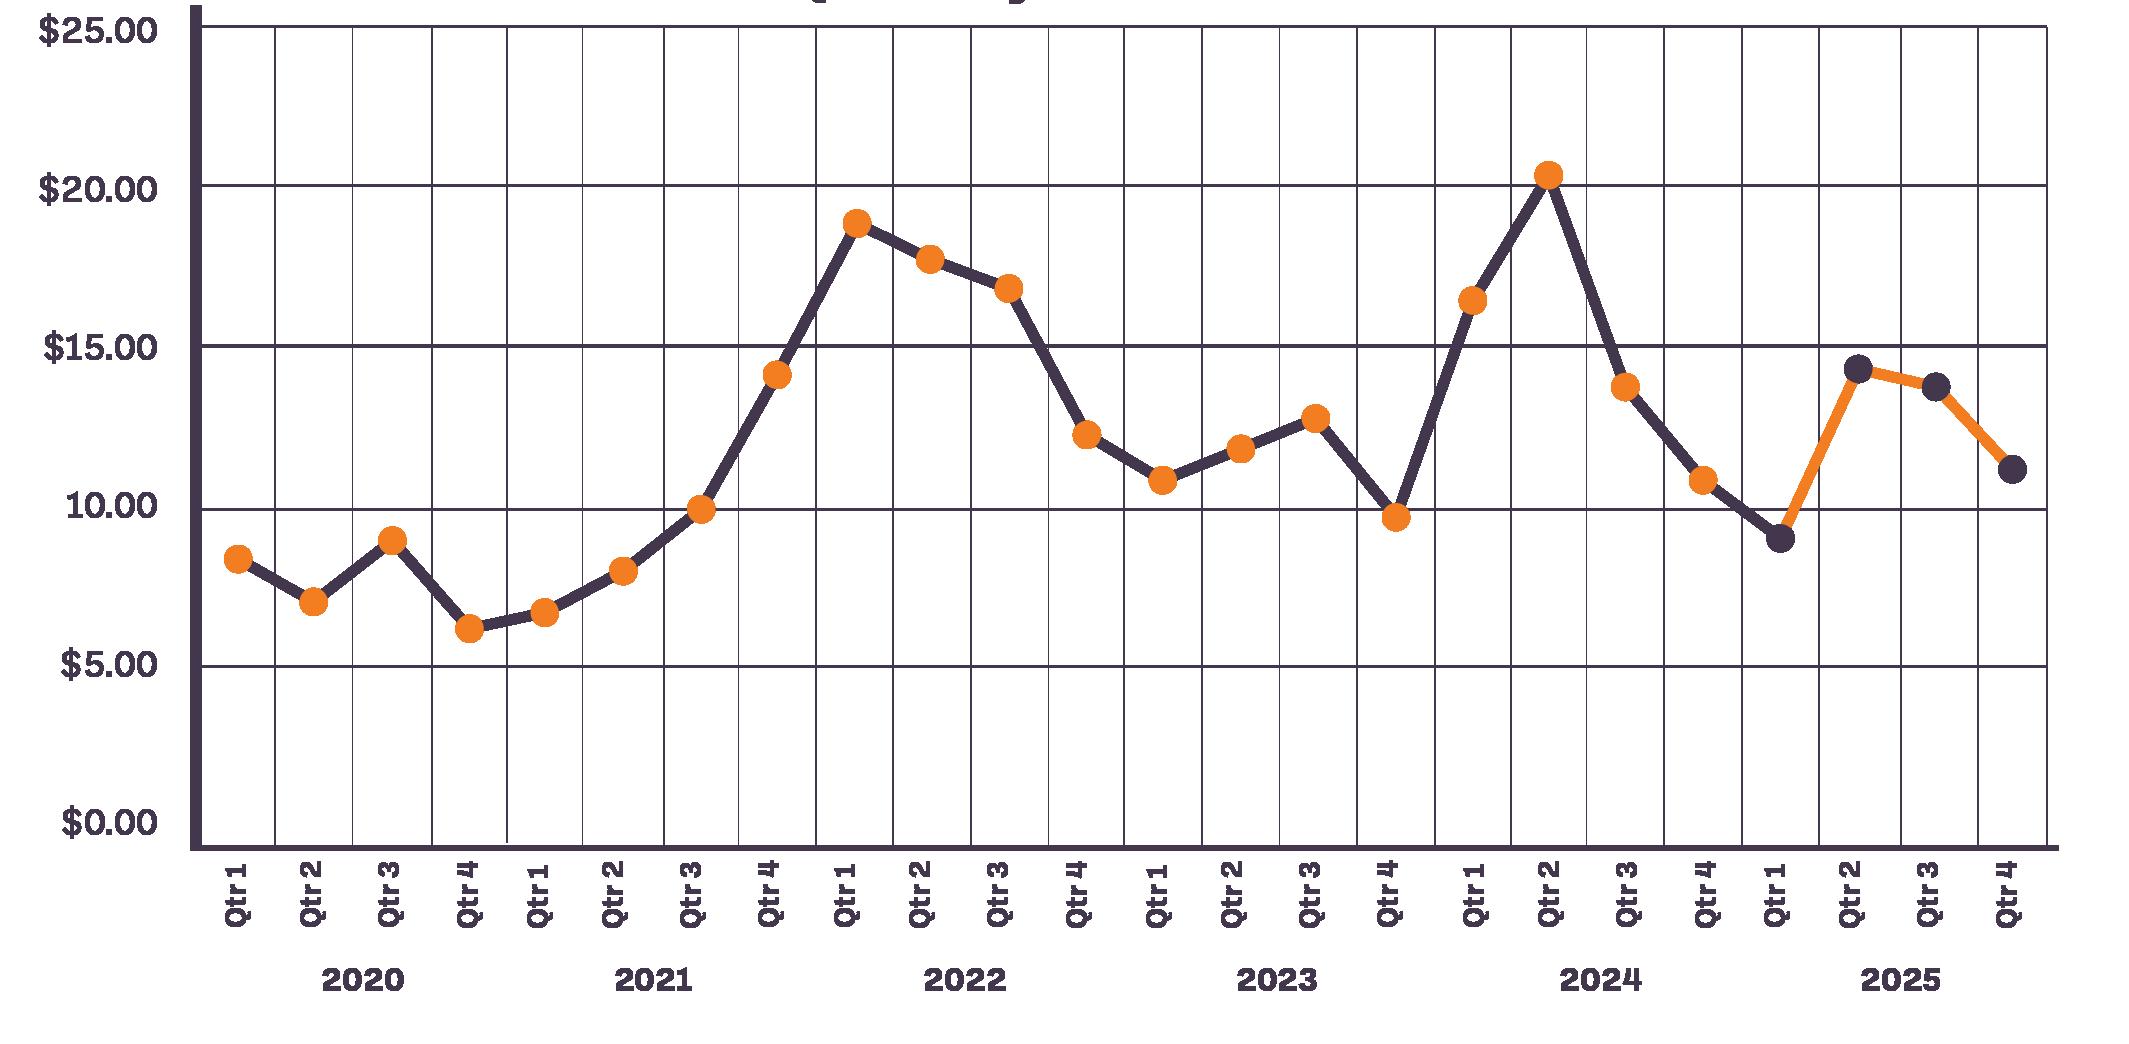
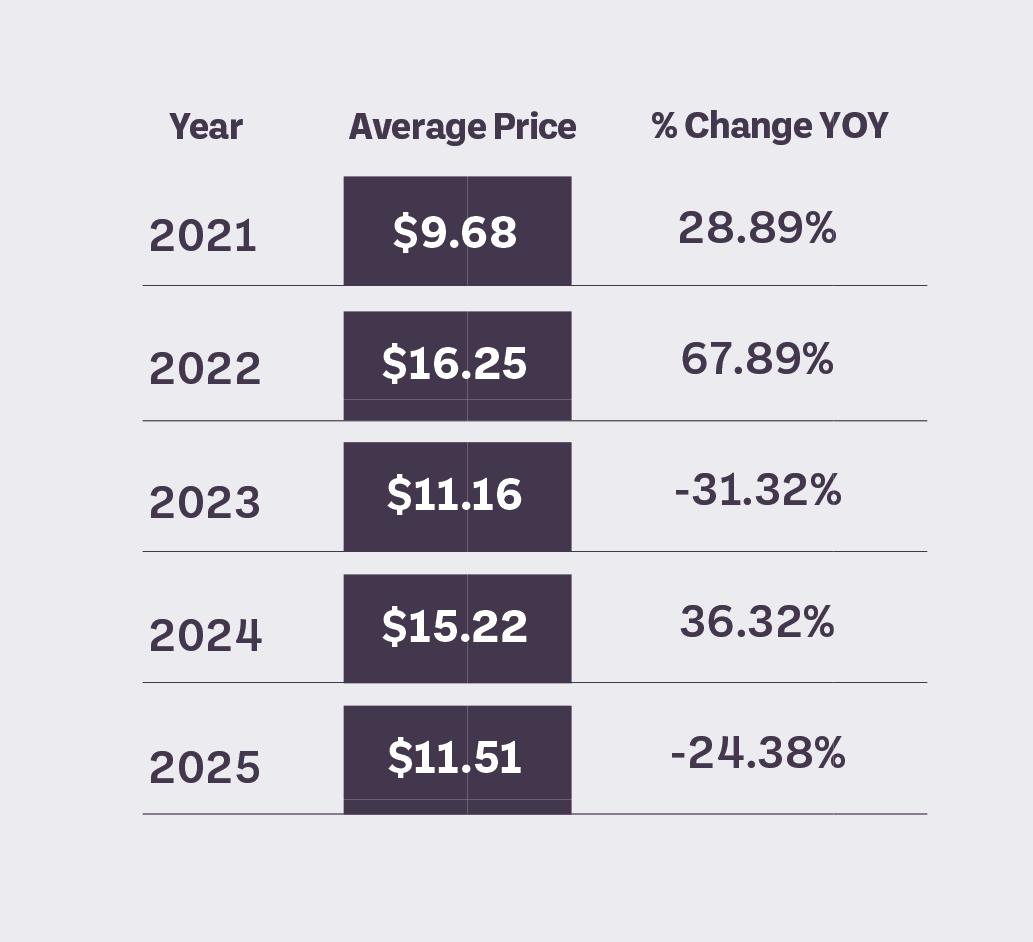
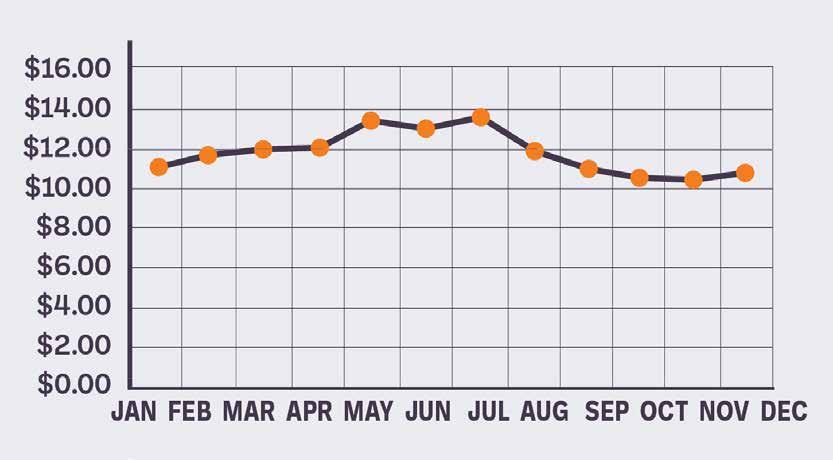
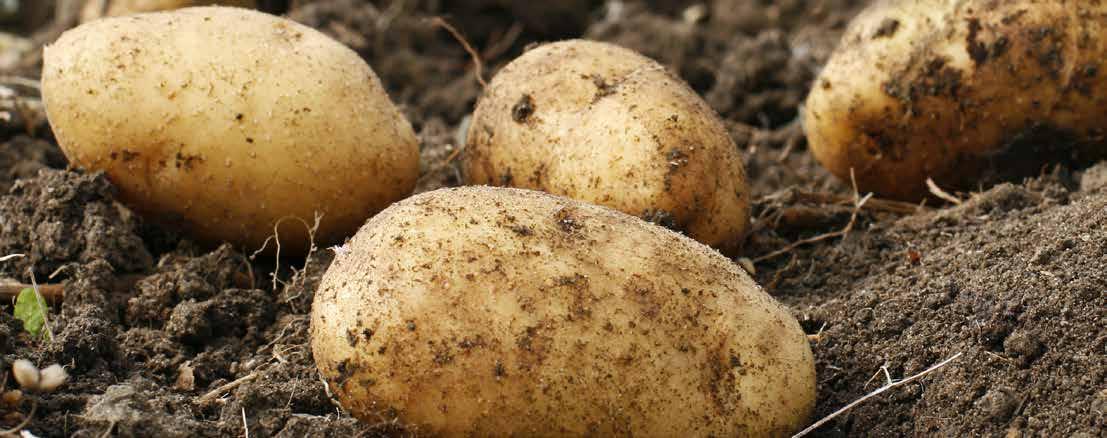
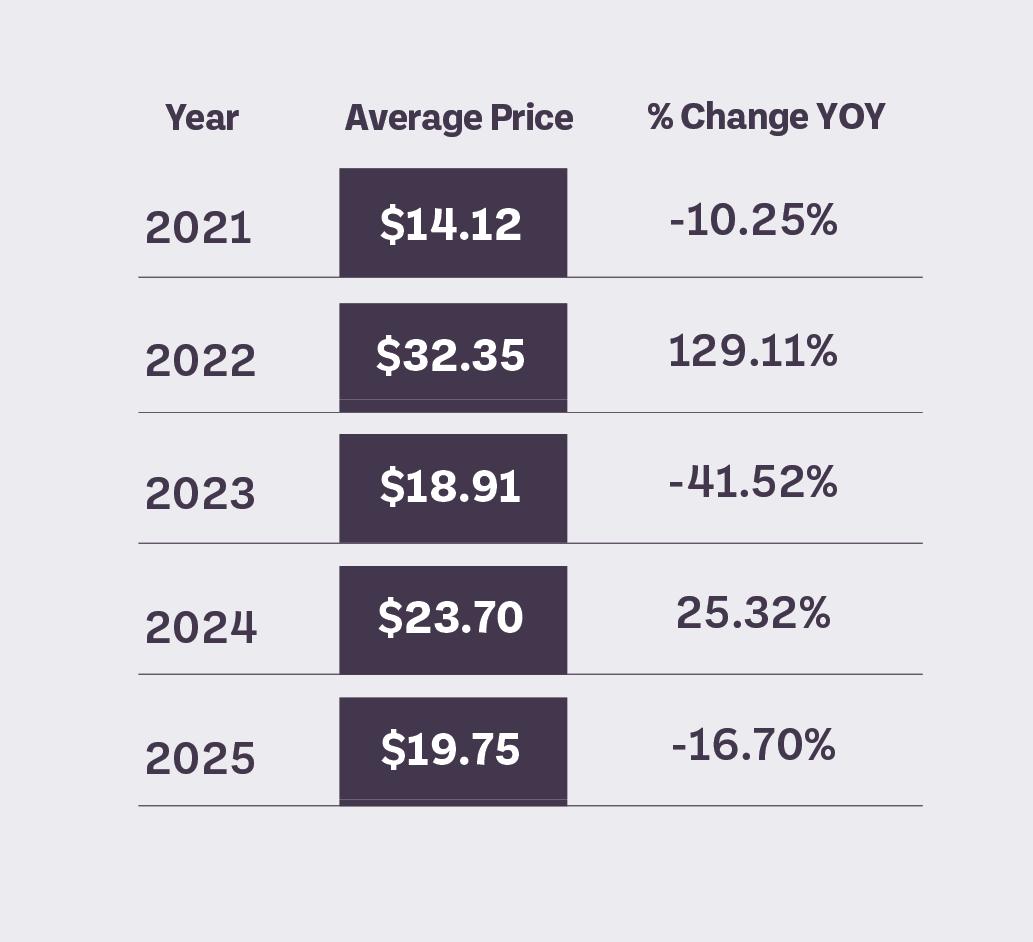
The russet potato market has been incredibly depressed this 2024-2025 season. As Norkotah’s are finishing up and shippers plan to move to Burbanks for the final stretch, the market is expected to pick up a bit, though the degree that it does will depend on demand throughout the summer.
Growers have begun to plant in ID with similar acreage to that of 2024. Consequently, there’s a chance that the 2025-2026 season will see similar levels to that of 2024-2025. This has undoubtedly been nice for the consumer, but very challenging for the growers.
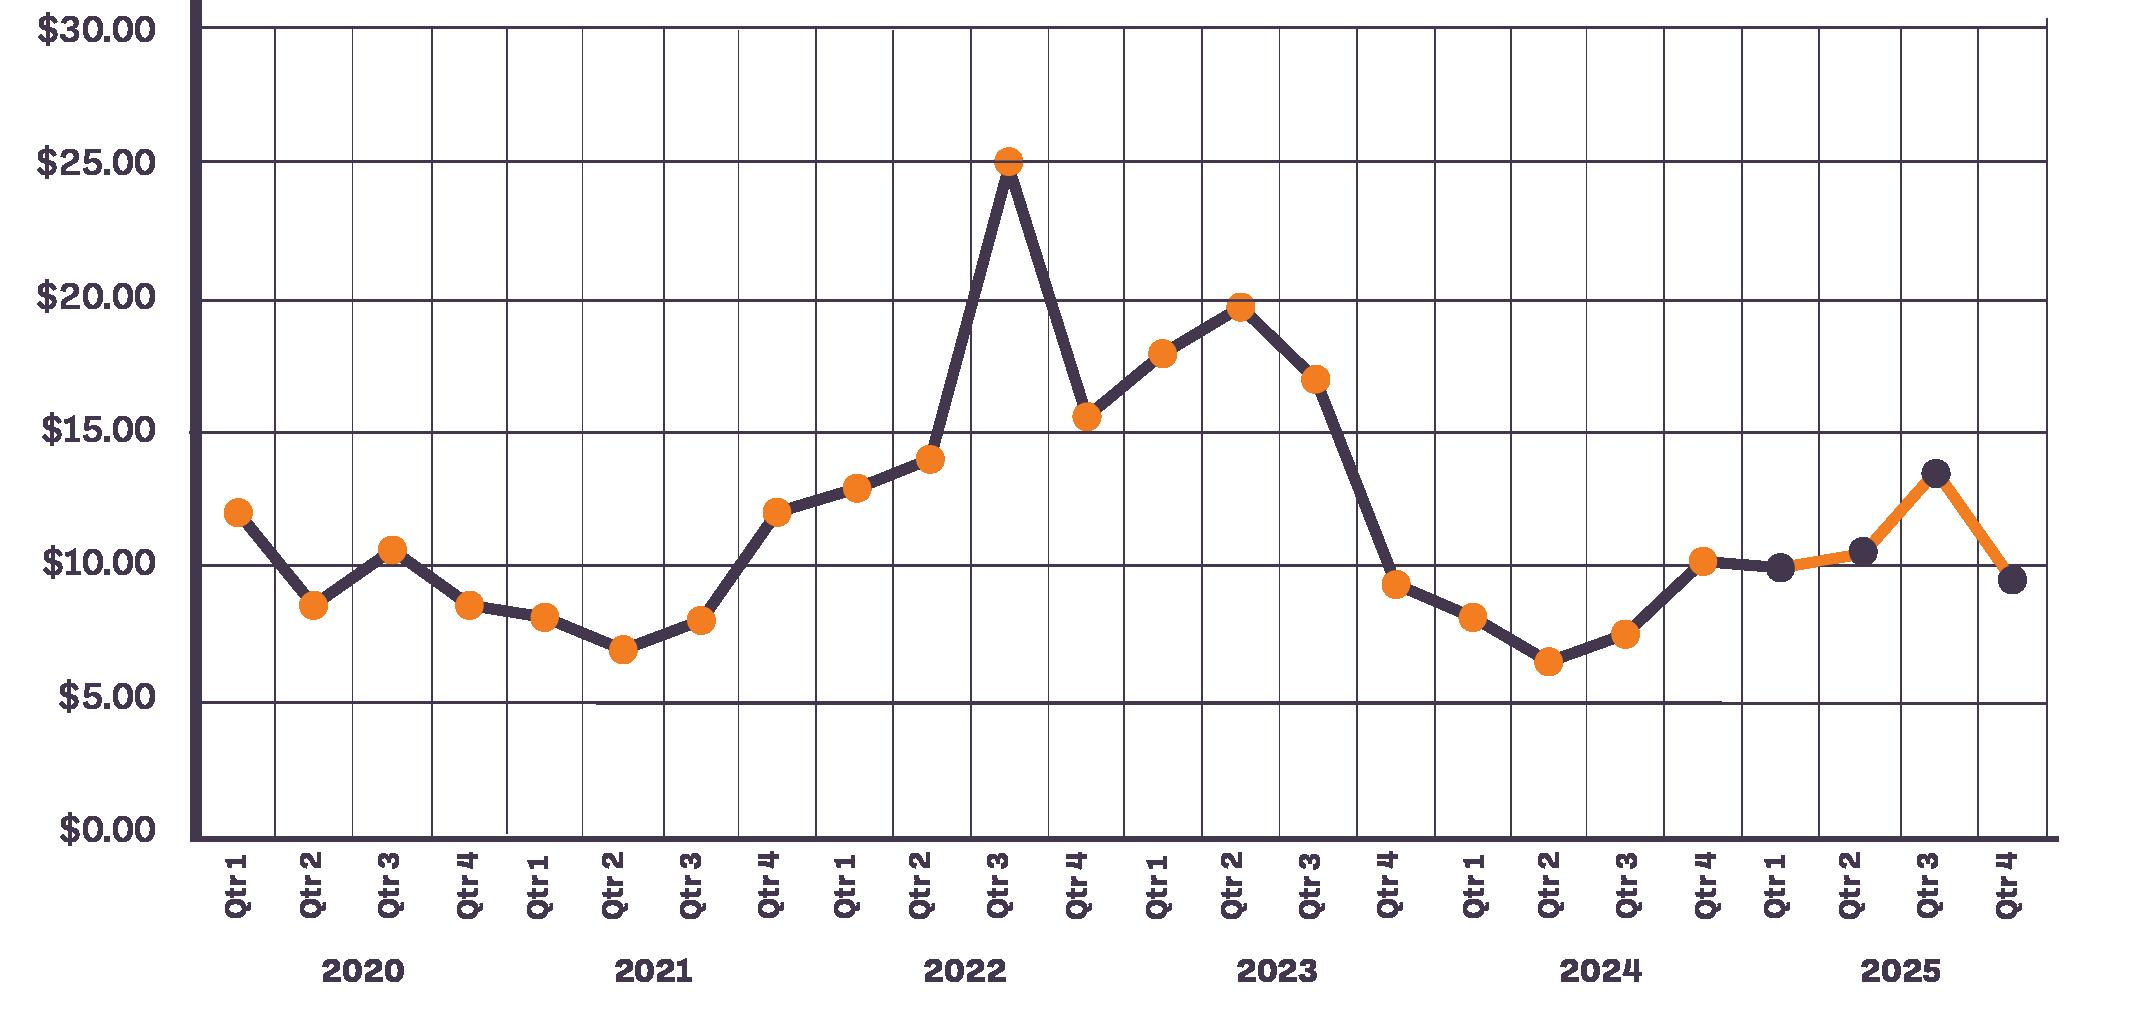
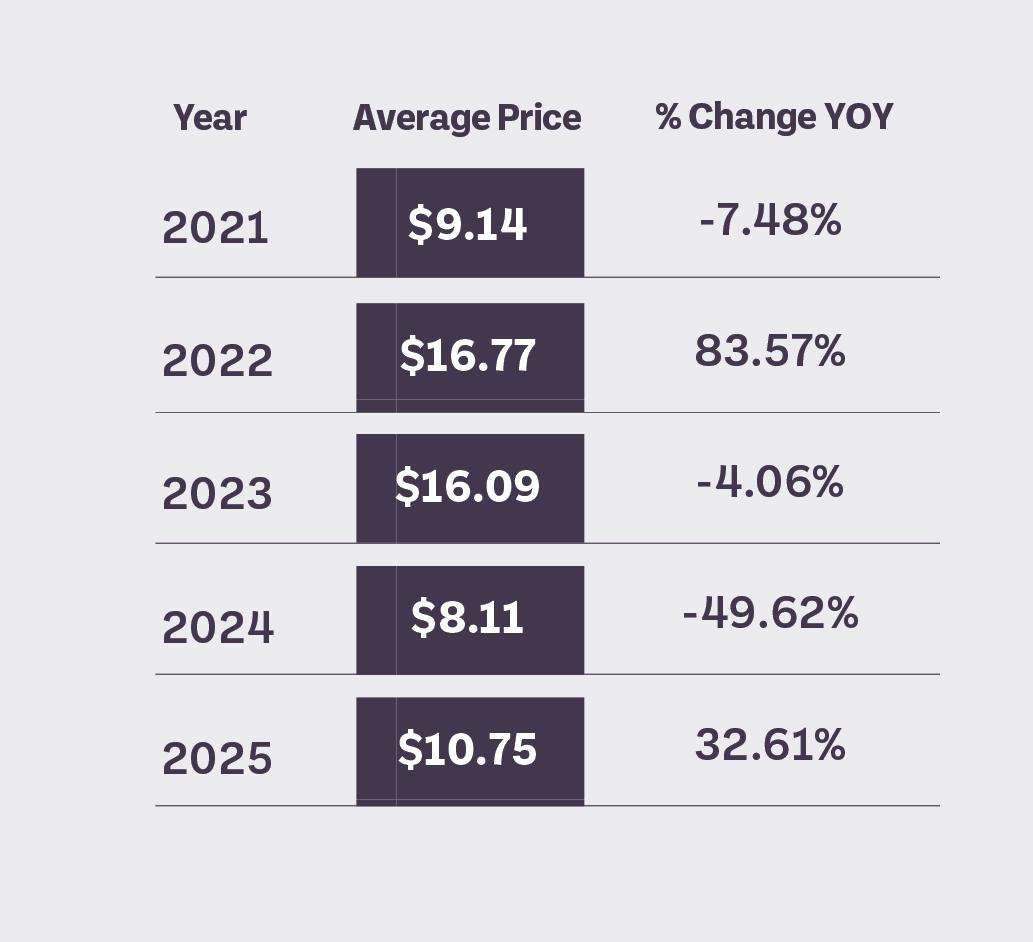
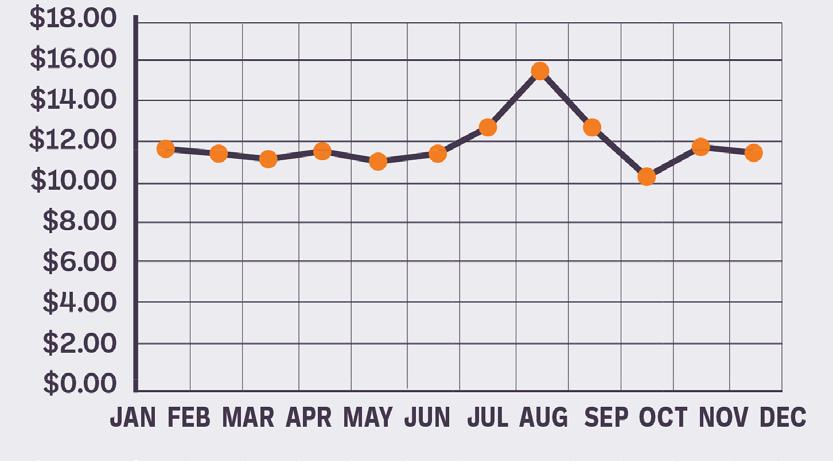
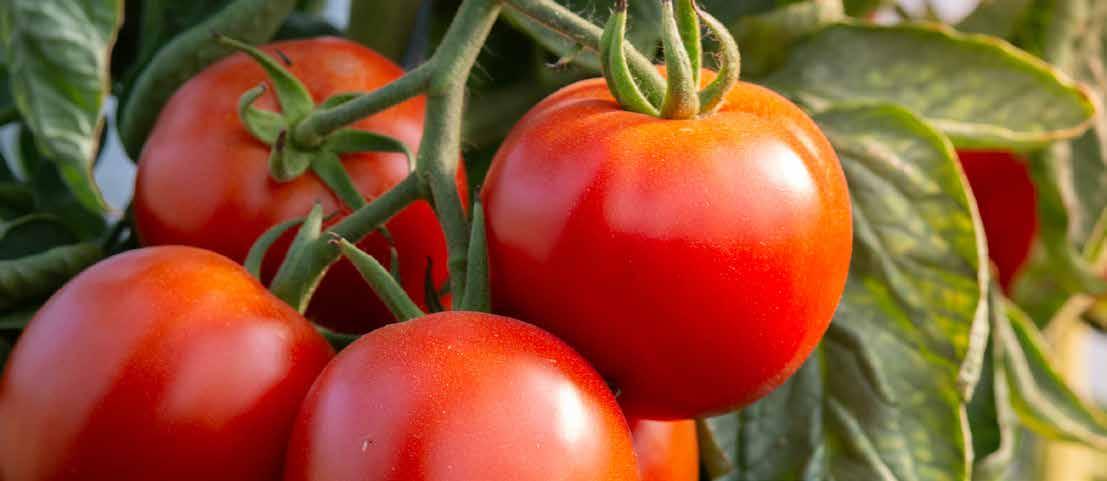
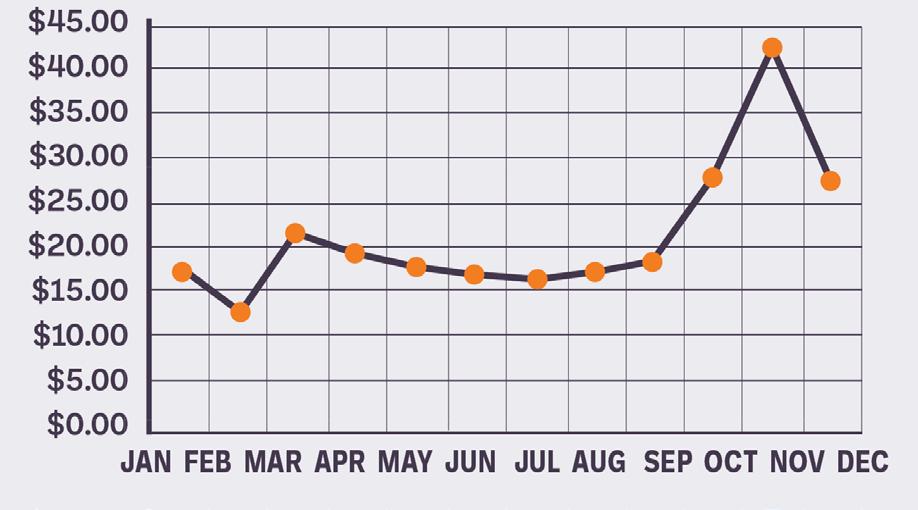
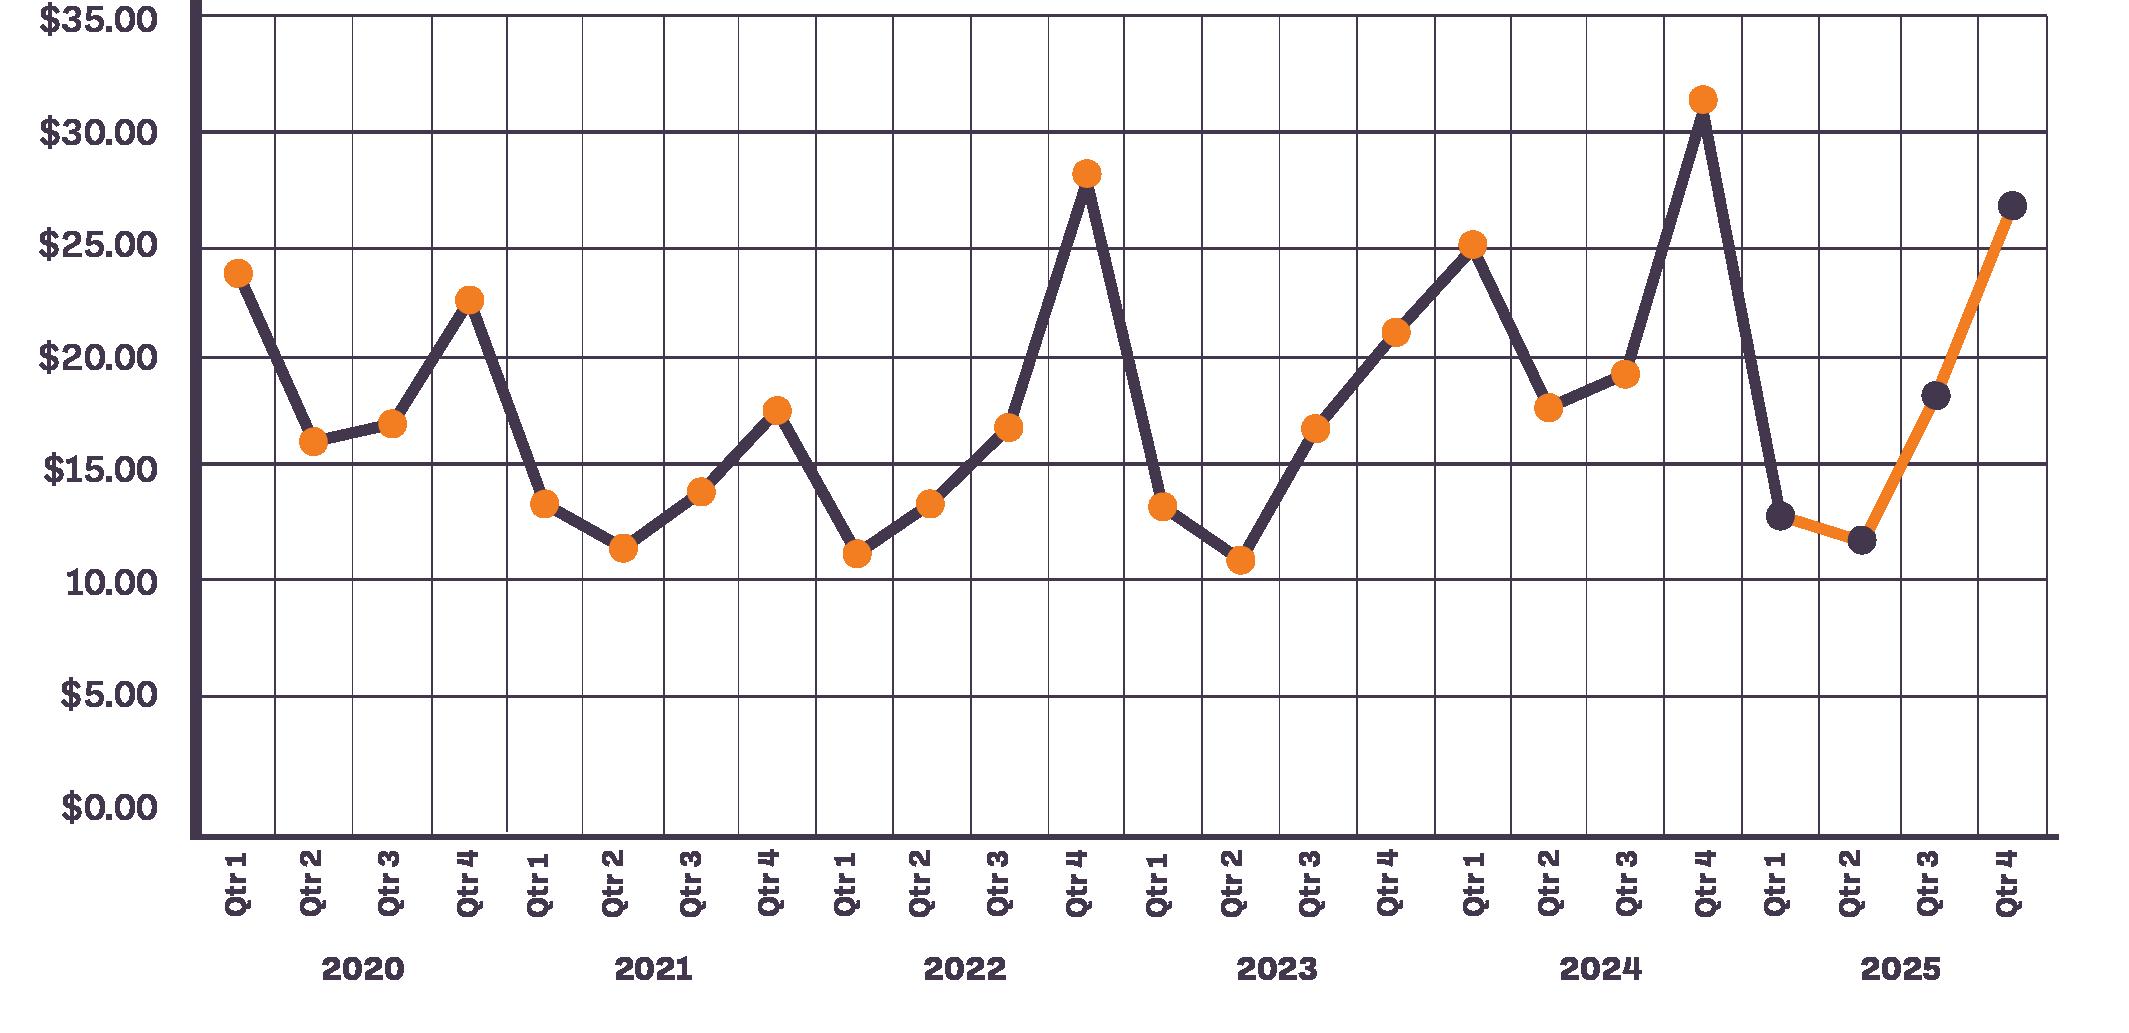
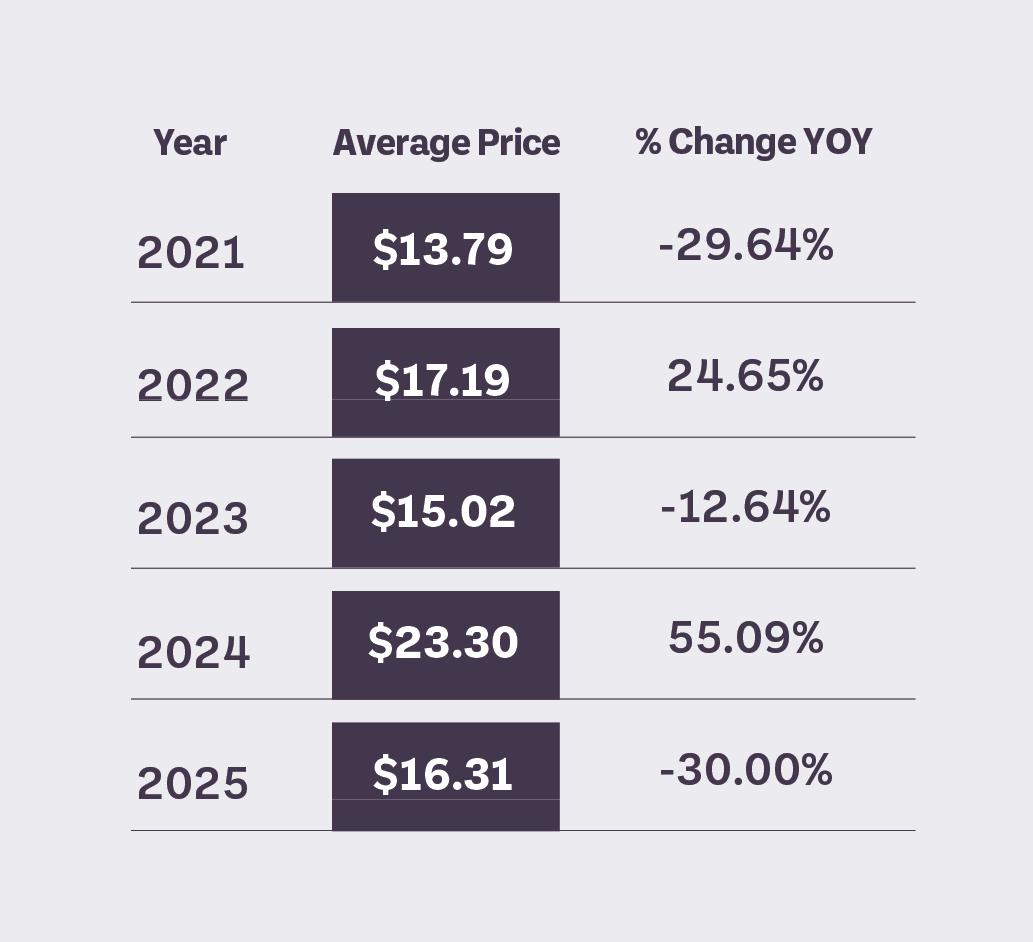
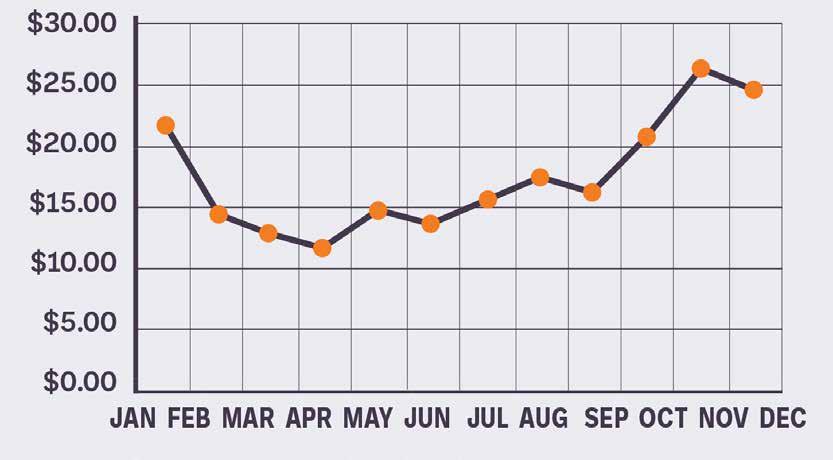
Q1 has been a very steady, if not relatively depressed, quarter for tomatoes, and these conditions are expected to continue as growers in both Florida and Mexico prepare to transition to their next respective grower regions. As of now, all indicators seem to point to a smooth transition out to Baja California and California in the West, and to north Florida/Georgia in the East.
Along with most other commodities, the degree of volatility of these transitions will depend heavily on mother nature cooperating.

• Paper
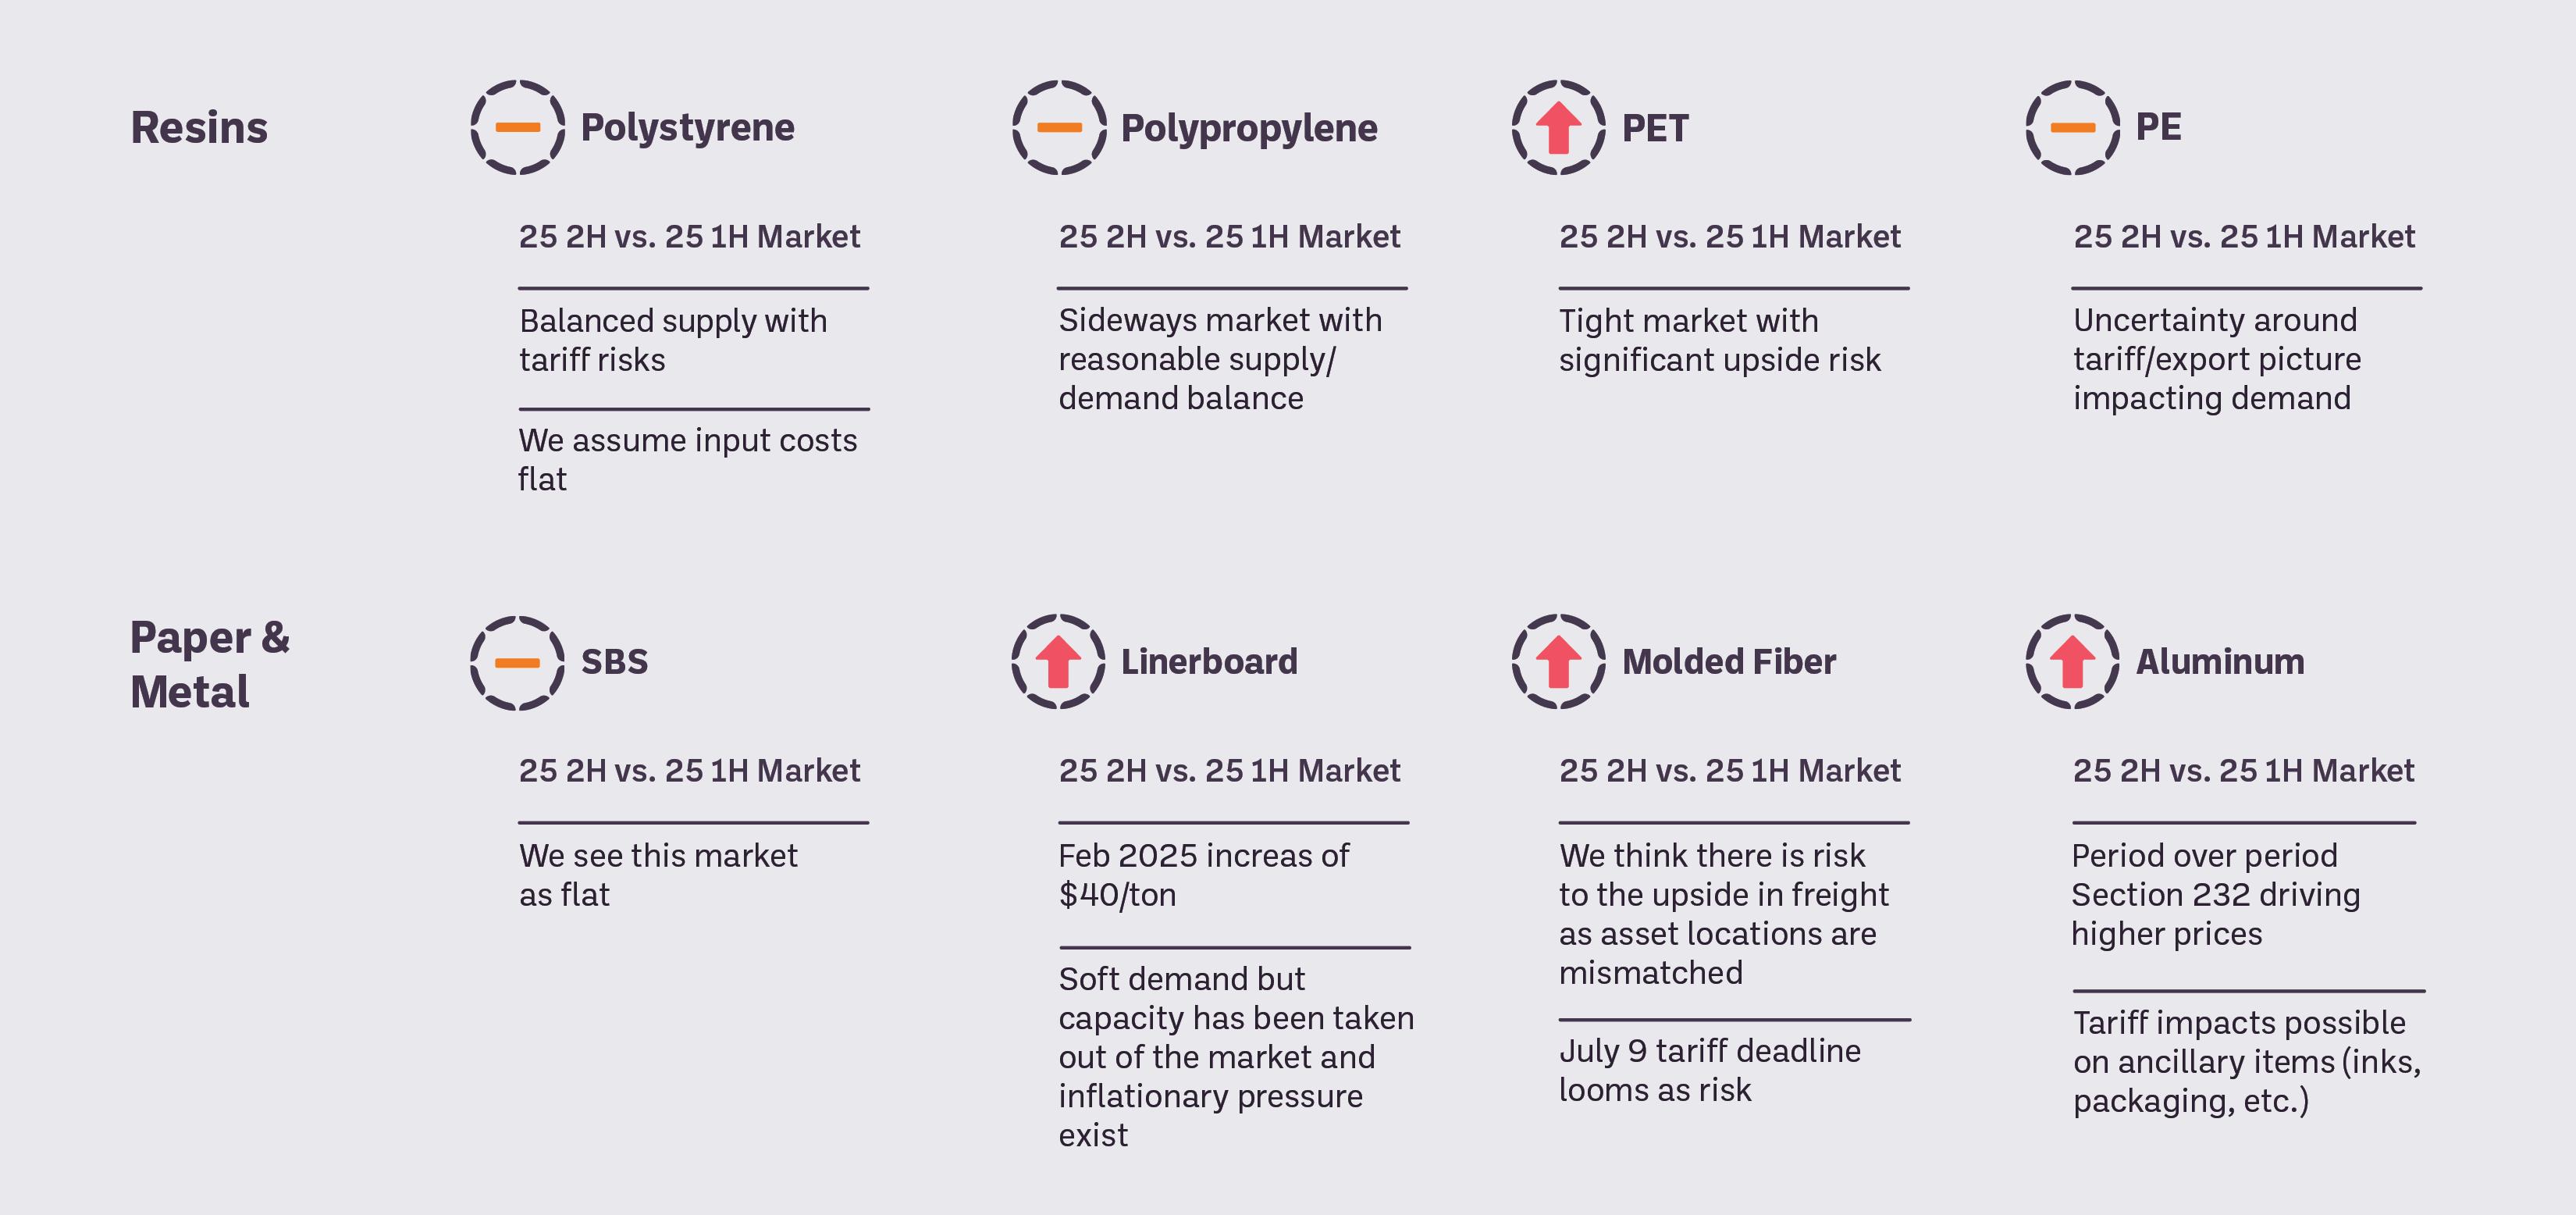
· Corrugated manufactures announced a $60-80 linerboard increase in January.
· The market indexes confirmed that there would be a February increase after not taking the January announced increase; it only took about half of the January announcement in February.
· Demand is still weak, and input costs are about flat, so this increase is likely margin improvement.
• Resins
· We continue to see lower demand for polyethylene and polypropylene resins.
• Steel – 70% of tinplate steel used in food and aerosol can making is imported. The U.S. has only 3 tinplate steel lines in production. There is a 25% tariff on the table on all imported tinplate steel and this tariff could increase the cost of a food or aerosol can by 17.5%. Hot and cold rolled steel prices have jumped 23%+ since December.
• Aluminum - Containers and packaging accounted for about 17% of the aluminum used in the U.S. Major importers include Canada, Mexico and South Korea. Beverage can manufacturing has not been able to keep up with demand so small and medium size customers have been importing “bright” unprinted cans from overseas sources. A significant cost increase could force brewers into more glass packaging and beverage manufacturers into PET packaging. Ultra-thin gauge foil used in flexible film laminations is almost exclusively imported. Most customers have switched their packaging laminated films to metalized polyester as a replacement. Still see foil laminations used in dairy lidding films. Expecting costs increases in foil-based films.
• Lumber – prices have increased for framing lumber, but we are still not seeing the record highs from mid-2021.
• Pulp and Paper - Most corrugated and linerboard/medium converters have manufacturing plants in the U.S., Canada and Mexico. We may see transshipping issues between the countries but do not expect a significant issue.
• Resins - Any changes would be related to a shift in demand out of one package format and into another format. These format changes require capex and are not easily reversible.
• Molded Fiber - Anti-dumping tariffs have been placed on Asian producers of molded fiber packaging heavily used in the fast-food industry. Tariffs have been set at between 10% and 153%, depending on the Asian company; this could force customers into less eco-friendly alternatives, given the lack of U.S. capacity.

• Key drivers impacting pricing on textiles for the next 6-12 months include:
· Fiber prices (cotton and polyester)
· Labor shortages
· Global demand
· Exchange rate
· Tariffs and other trade barriers
‧ 10% Universal Tariff in place
‧ Reciprocal Tariffs on hold for 90 Days
‧ Combined 145% additional duty rate in effect on Chinese goods
‧ Retaliatory tariffs on goods from the U.S.
• Inflation is expected to remain elevated and face renewed pressures, particularly due to factors like tariffs.
• Slower global growth and potential trade wars are expected to contribute to higher inflation and economic uncertainty.

Aluminum and steel
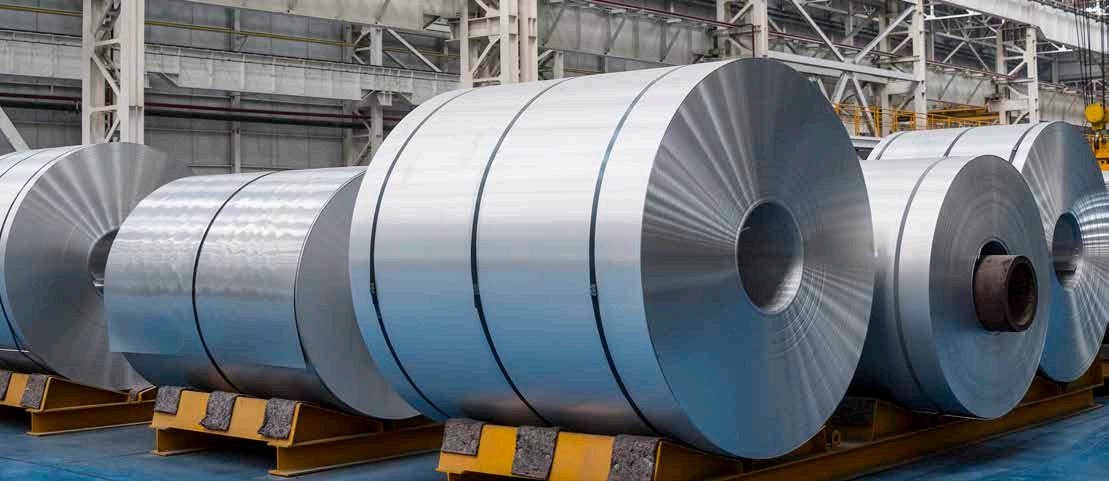
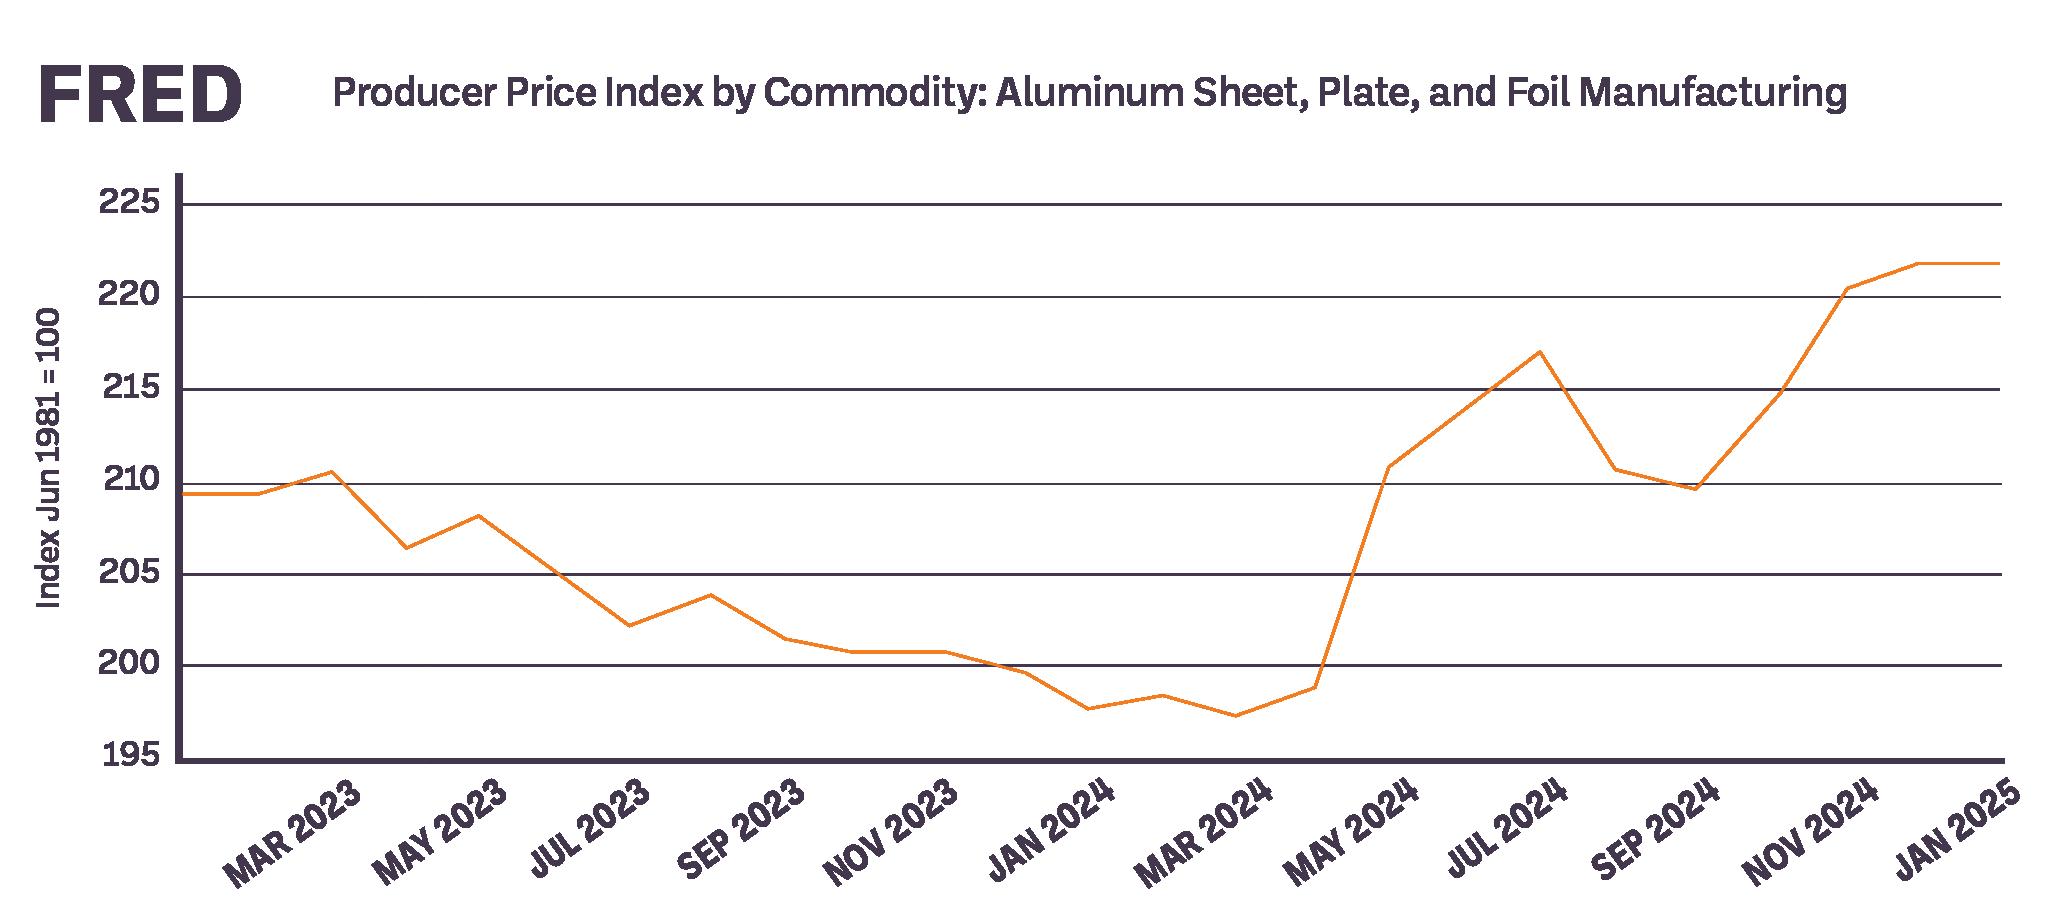
• Aluminum: Prices are expected to rise due to a global deficit driven by record high aluminum prices.
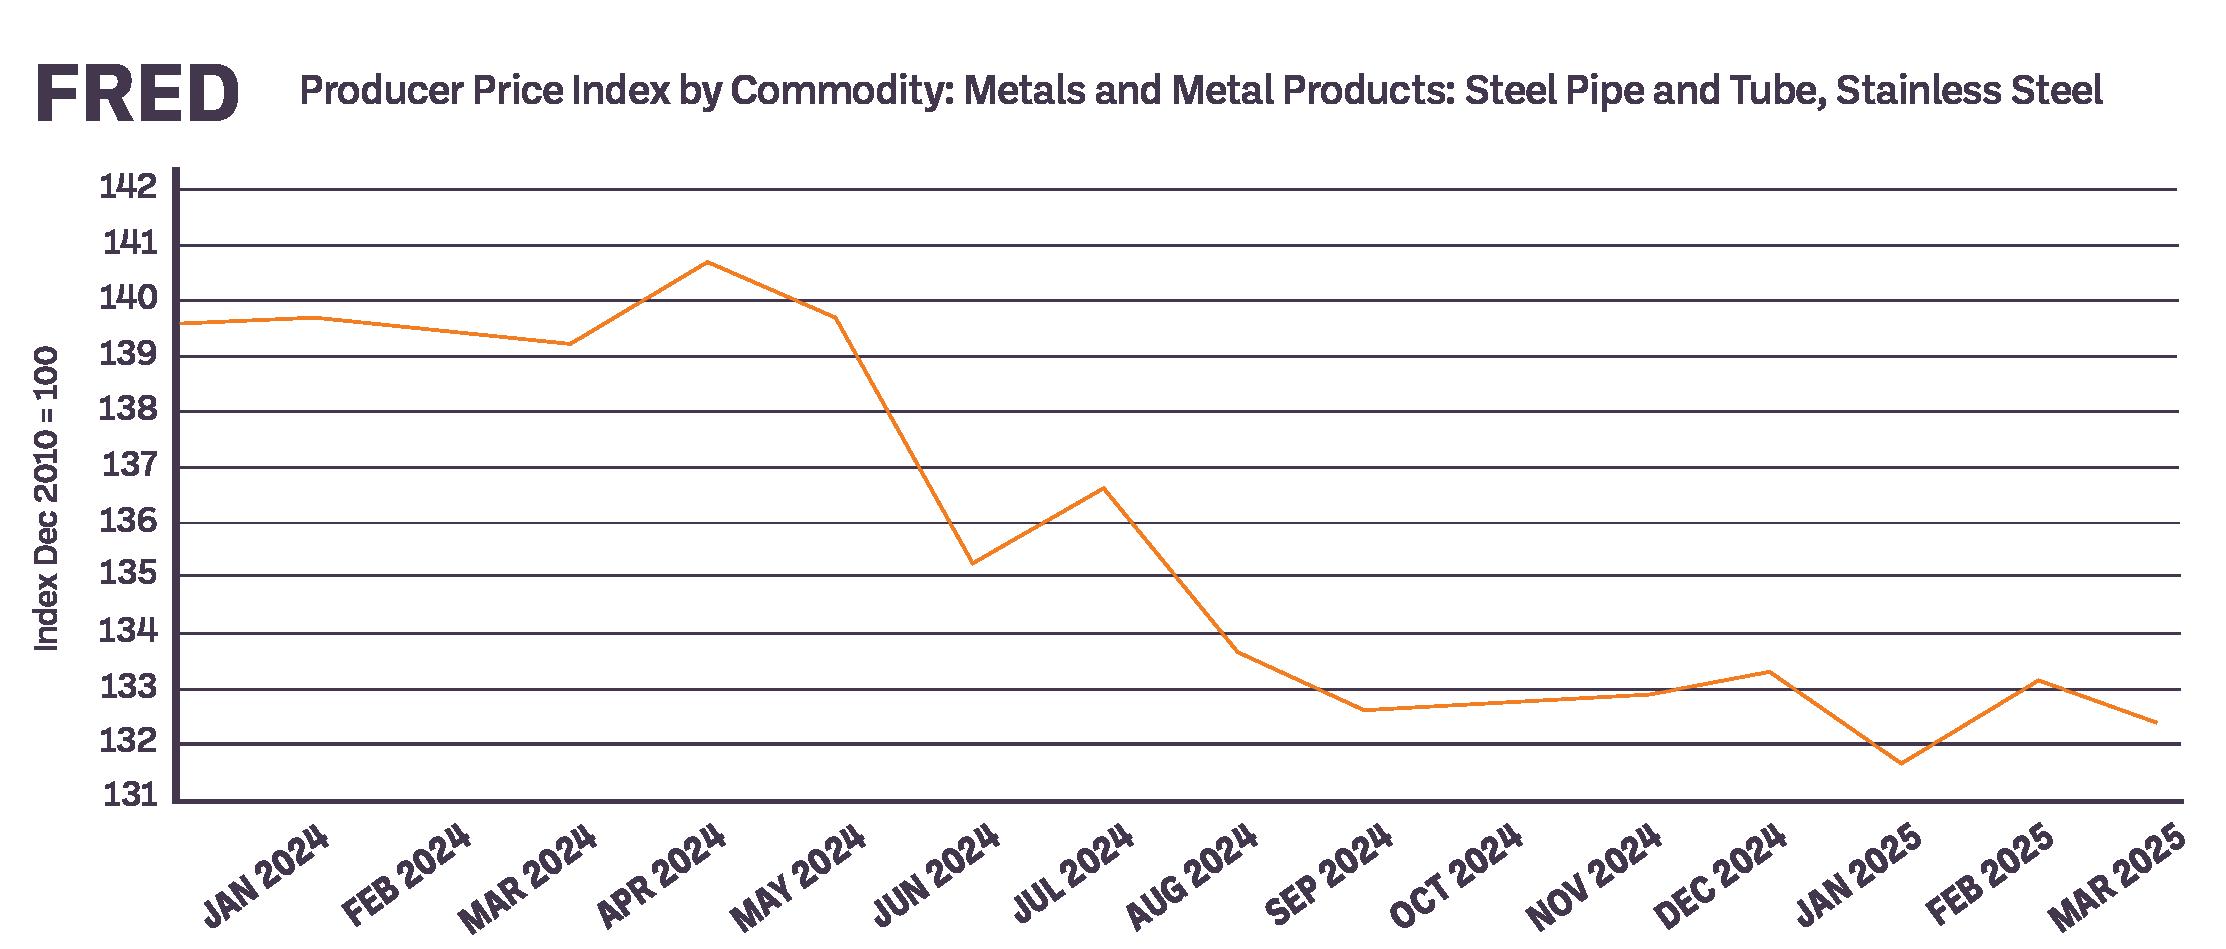
• Stainless Steel: Price remains stable, but manufacturers are cautious about large investments amid high interest rates and political uncertainty.
• Market Dynamics: The U.S. market is expected to remain resilient, while Europe faces supply risks affecting regional prices.
• Tariffs: China tariffs are starting to raise prices as it relates to components and material sourced from China.
Overall, while aluminum prices are projected to increase in the U.S., the outlook for stainless, if not imported from China, remains more stable.
CONTINUED

• Impacted products: Clear and high heat pans, cutting boards, plastic covered handles on smallwares utensils.
• The cost outlook on plastic resins indicates an upward trend for polyethylene (PE) and polypropylene (PP) prices, particularly for the second quarter of 2025, driven by tight availability. Overall analyses suggest that the prolonged period of low-cost resins is coming to an end, with projections indicating an uptick in contract prices for these materials in Q4-2025 to Q1-2026.
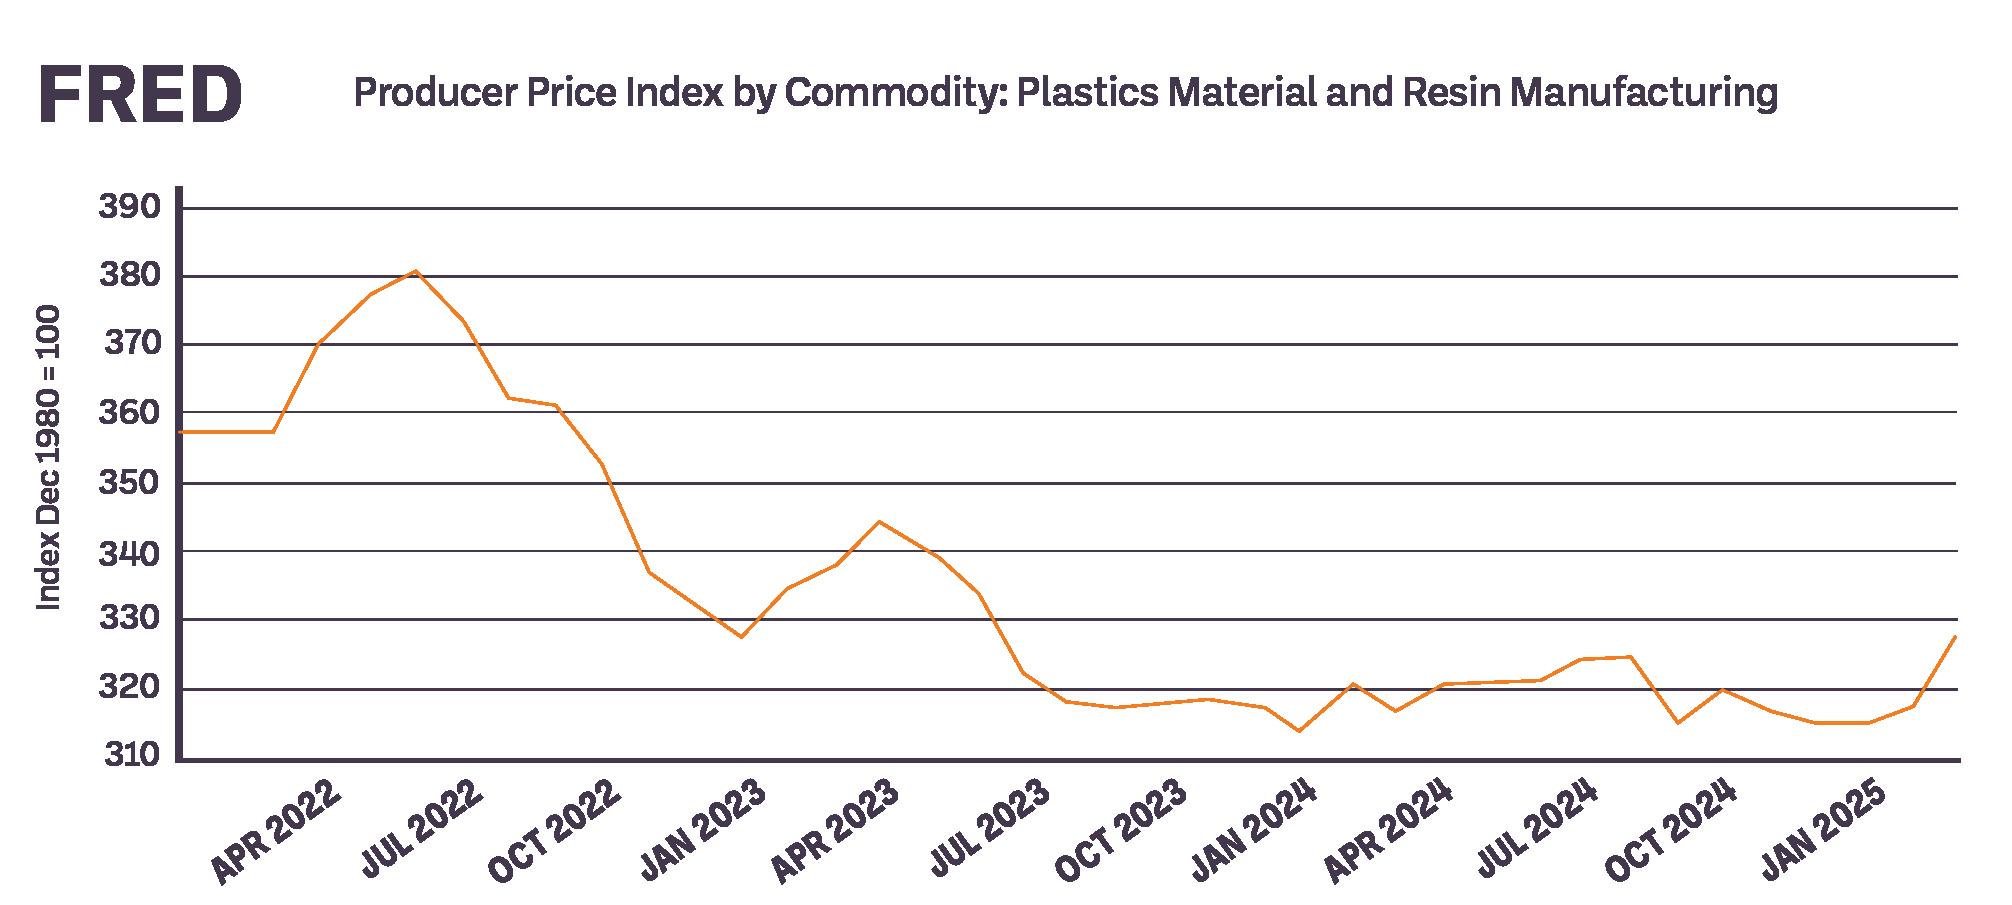
• Significant disruptions to the global supply chain have made building products more costly and harder to find; disruptions are expected to continue in 2025.
• Factors that could drive up transportation costs in the upcoming year include the following:
· Ocean shipping times will remain longer than usual due to the continued slowdown at Suez Canal and a general shortage of qualified ship workers.
· Freight rates have increased significantly in 2024 with container prices rising 20%.
· FedEx Corp and UPS have each announced rate increases of 5.9% for 2025.
· Diesel fuel is expected to rise to an average of $3.60 a gallon.
• Despite the above challenges, the global transportation market expects to stabilize in 2025, with a projected 8% gain in overall shipping capacity compared to a 3% rise in shipping demand, which should reduce some delays and price volatility.

Entegra is the procurement partner that helps hospitality-driven businesses shine. With significant savings, digital tools and strategic services, we make it easier to meet your business goals.
Visit EntegraPS.com for more resources


Energy solutions
Don't tackle energy price volatility alone. Entegra’s advisors can help you mitigate the ever-rising costs of energy with our comprehensive Energy Management Solutions.
See our energy solutions
Read our energy service guide

Labor solutions
Navigating a tight labor market requires expertise in retention, training and efficiency. Entegra’s advisors will work with you on solutions to improve employee upskilling, secure temporary labor, drive operational efficiency and more.
See our labor solutions
Read our labor solutions guide
Other resources from Entegra
Client exclusive content
• Commodity Reports
• Inflation Reports
• Program and Pricing Updates
Added value content
• The Operational Efficiency Guide
• Bringing Hospitality to Life
• Why join a GPO?