




Increasingly, businesses are turning to Entegra because we are their business performance improvement partner, helping them get preferred product pricing, ensure swift and reliable deliveries, and benefit from a comprehensive view of their operations through data and digital tools. The Cost Outlook is another of the exclusive tools we offer, along with the Cost Outlook webinar, to aid your understanding of the forces driving price changes.
Through this report, Entegra shares what our supply chain experts are seeing and how the culinary team uses the information in its decision making around F&B recommendations.
We want you to use it to prepare your business.
The market data analysis across key food commodities, macroeconomic conditions, packaging, and transportation gives you a full picture of the main areas impacting your cost of goods and services.

Paul McArdle Chief Executive Officer, North America
Please review the report and join us on the live Cost Outlook webinar. Helping hospitality-driven businesses make decisions about their purchasing and their day-to-day operations is at the heart of what we do.
Take advantage of all the ways Entegra can add value.
• Entegra PurchasingIQ: Gives you a 360-degree view of your procurement spend with an integrated AI shopping tool.
• Entegra Culinary Consulting: Focuses on helping you improve your culinary operations and use ingredients more creatively, efficiently, and affordably.
Thank you for placing your trust in Entegra to deliver cost saving programs, expert advisory services, and timely commodity pricing guidance. Whatever the markets bring, Entegra has your back. Please don’t hesitate to reach out to an Entegra representative for support.
Welcome to the Entegra Cost Outlook.
As highlighted in our Summer/Fall 2025 issue, tariffs continue to be a key area of focus. We remain vigilant in monitoring all proposed and enacted changes to federal policy. Thanks to our broad network of contracted suppliers, Entegra is well-positioned to respond quickly and effectively to shifts in the market.
Recent positive shifts in the marketplace include milk supplies remaining ahead of demand, which is expected to hold into 2026, and strong U.S. wheat exports. However, meat has been a consistent driving category of inflation for the last several months due to the U.S. cattle herd being at its lowest in decades.
To maintain the high standards of quality and consistency that our clients and their consumers expect, it is critical that all operators continue relying on their contracted suppliers. Sourcing ingredients or products outside of our contracted network can result in significantly higher costs and may introduce food safety risks.
While we base our strategies on comprehensive analysis of all available data, please keep in mind that markets can shift rapidly and unpredictably.
Thank you for your continued partnership, engagement, and trust in the Supply Management team.

David Kourie Chief Purchasing Officer and Senior Vice President Supply Management
There are multiple indices used to measure and report on inflation.
Urban Consumers
The Consumer Price Index for All Urban Consumers (CPI-U) measures changes in U.S. consumer prices based on a representative basket of goods and services.
• CPI-U covers 93% of the U.S. population based on location and population size. This index only measures inflation as experienced by consumers, not producers.
• This basket of goods and services is compiled by the Bureau of Labor Statistics who track 94,000 prices monthly to assess inflation for more than 200 categories of products and services.
• Broad consumer spending categories like food, energy, apparel, and services include subcategories tracking inflation for everything from apples and premium unleaded gasoline to men's underwear and funerals.
The Consumer Price Index (CPI) can be further broken down into Food at Home (FAH) and Food Away from Home (FAFH).
• The CPI for Food at Home (FAH) includes categories such as cereals and bakery products, meats, poultry, fish, eggs, dairy, fruits and vegetables, and beverages that are designed for home consumption. It also includes products that are obtained through traditional food shopping outlets such as grocery stores, convenience stores, and supercenters.
• This index covers the “sale of food meant for home or off-site consumption” — food at home.
• The CPI Food Away from Home (FAFH) covers much of Entegra’s business. This includes full-service restaurants, limited-service restaurants, drinking places, hotels, motels, retail stores, vending machines, recreational places, schools, and colleges.
• This index covers the “sale of food meant for immediate consumption” — generally onsite and away from home.
This index resembles a CPI and reflects changes over time. However, instead of retail prices, the PPI provides a measure of the average prices paid to domestic producers for their output.
• Think... “industry,” “farm,” and “wholesale” instead of individual consumer.
• PPIs are reported for nearly every industry in the goods-producing sector of the economy.
• The PPI is typically more volatile than the CPI as price volatility decreases as products move from farm, to wholesale, to retail.
• Additionally, the CPI typically lags movements in the PPI.
When reporting on inflation, Entegra uses a blended approach from all indices designed to cover all Entegra contract types and segment-specific requirements.
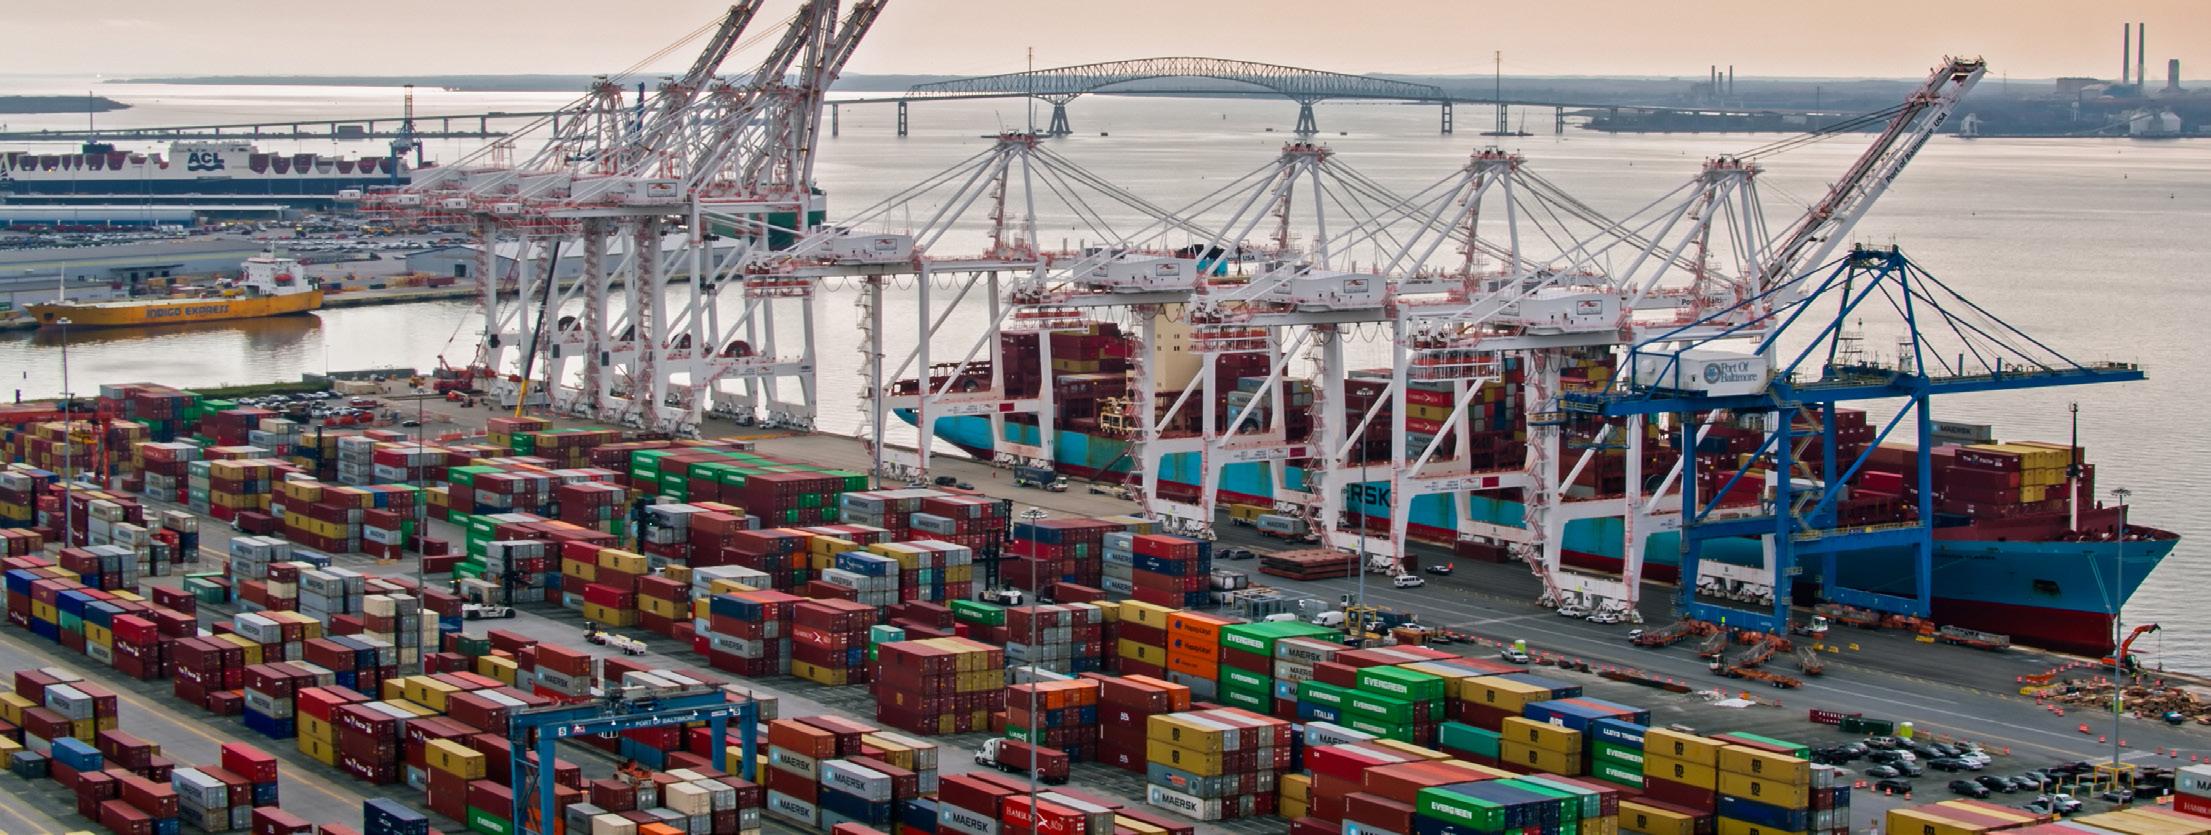
In April 2025, the current administration introduced broad “reciprocal tariffs” on goods from most U.S. trading partners. These tariffs aim to:
• Level the global trade playing field
• Revitalize U.S. manufacturing
• Serve as leverage in negotiations
• Help offset the cost of proposed tax cuts
While some exemptions have been granted, most countries still face a minimum 10% tariff. Notably, food-related imports from Canada and Mexico are largely exempt, helping avoid major disruptions in the supply of fruits, vegetables, and other staples.
The most significant impact is on trade with China. U.S. exports to China in 2024 totaled $25 B in agricultural goods — $12 B in soybeans and $3 B in meat — while imports from China reached $6 B across various food items. Tariffs have reduced trade volumes and have begun to affect prices.
Legal challenges to the tariffs enacted under the International Emergency Economic Powers Act (IEEPA) are ongoing, but the White House has alternative legal avenues to maintain them.
A continued aggressive tariff stance is likely through 2026.
So far, consumer food prices have seen limited increases. However, tariffs are expected to raise costs for imported essentials like coffee, cocoa, olive oil, and lean beef. Broader economic risks from the tariffs include job losses, reduced investment, and slower GDP growth. Experts estimate it could take 3-5 years to rebuild domestic industries to meet demand.
• The U.S. economy is projected to slow through late 2025 and into 2026.
• A recession is a 50/50 possibility by year-end 2026.
• Uncertainty around tariffs and immigration policy will remain a drag on economic activity.
• Consumer spending remains resilient, especially among higher-income households.
• Auto sales and housing starts are steady despite declining consumer confidence.
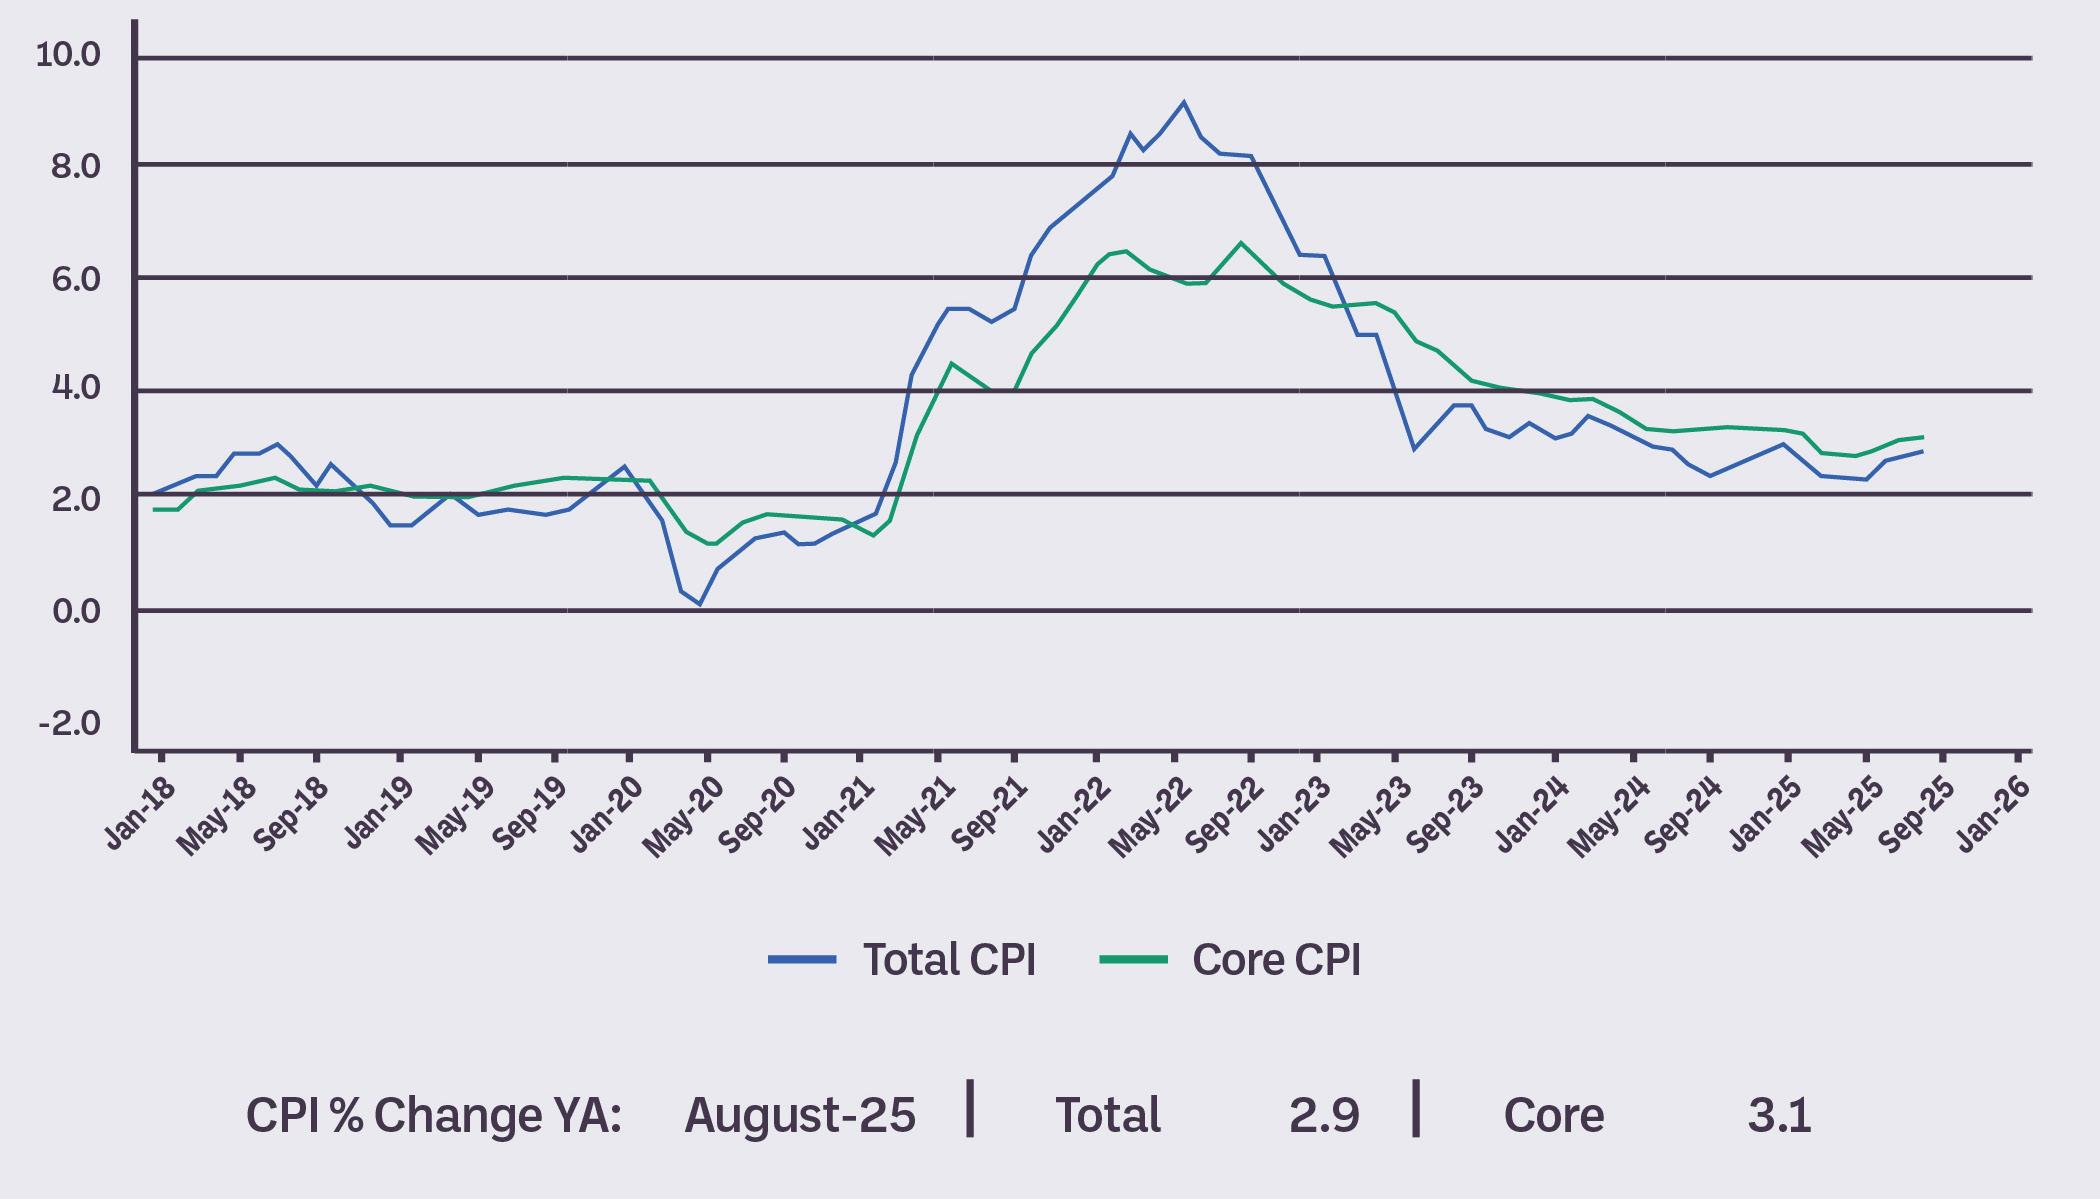
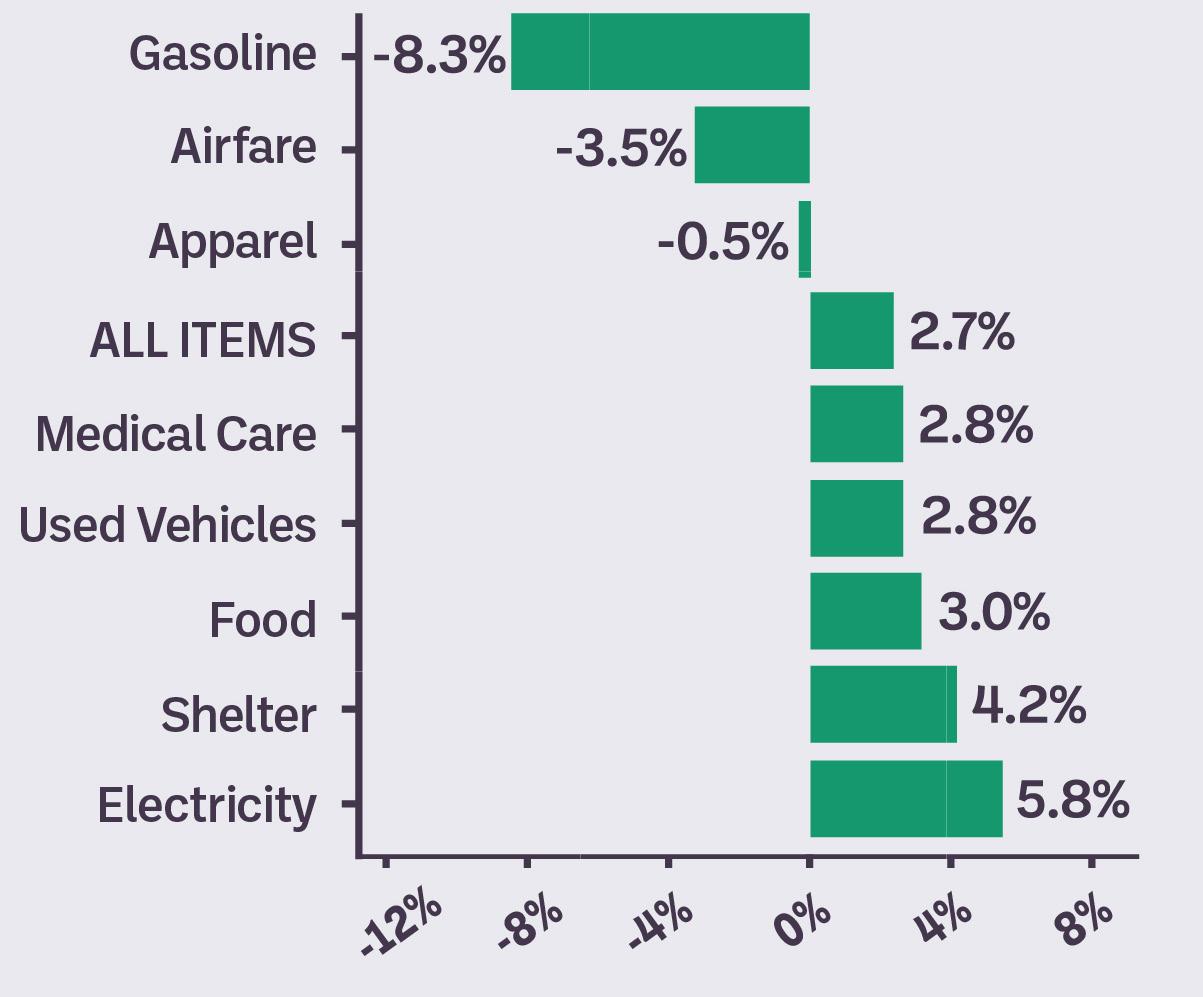
• Inflation is contained for now. August CPI rose 2.9%, with falling gas prices (-8%) offsetting increases in electricity, shelter, and food.
• Tariffs could push increases in the CPI higher in late 2025 and into 2026.
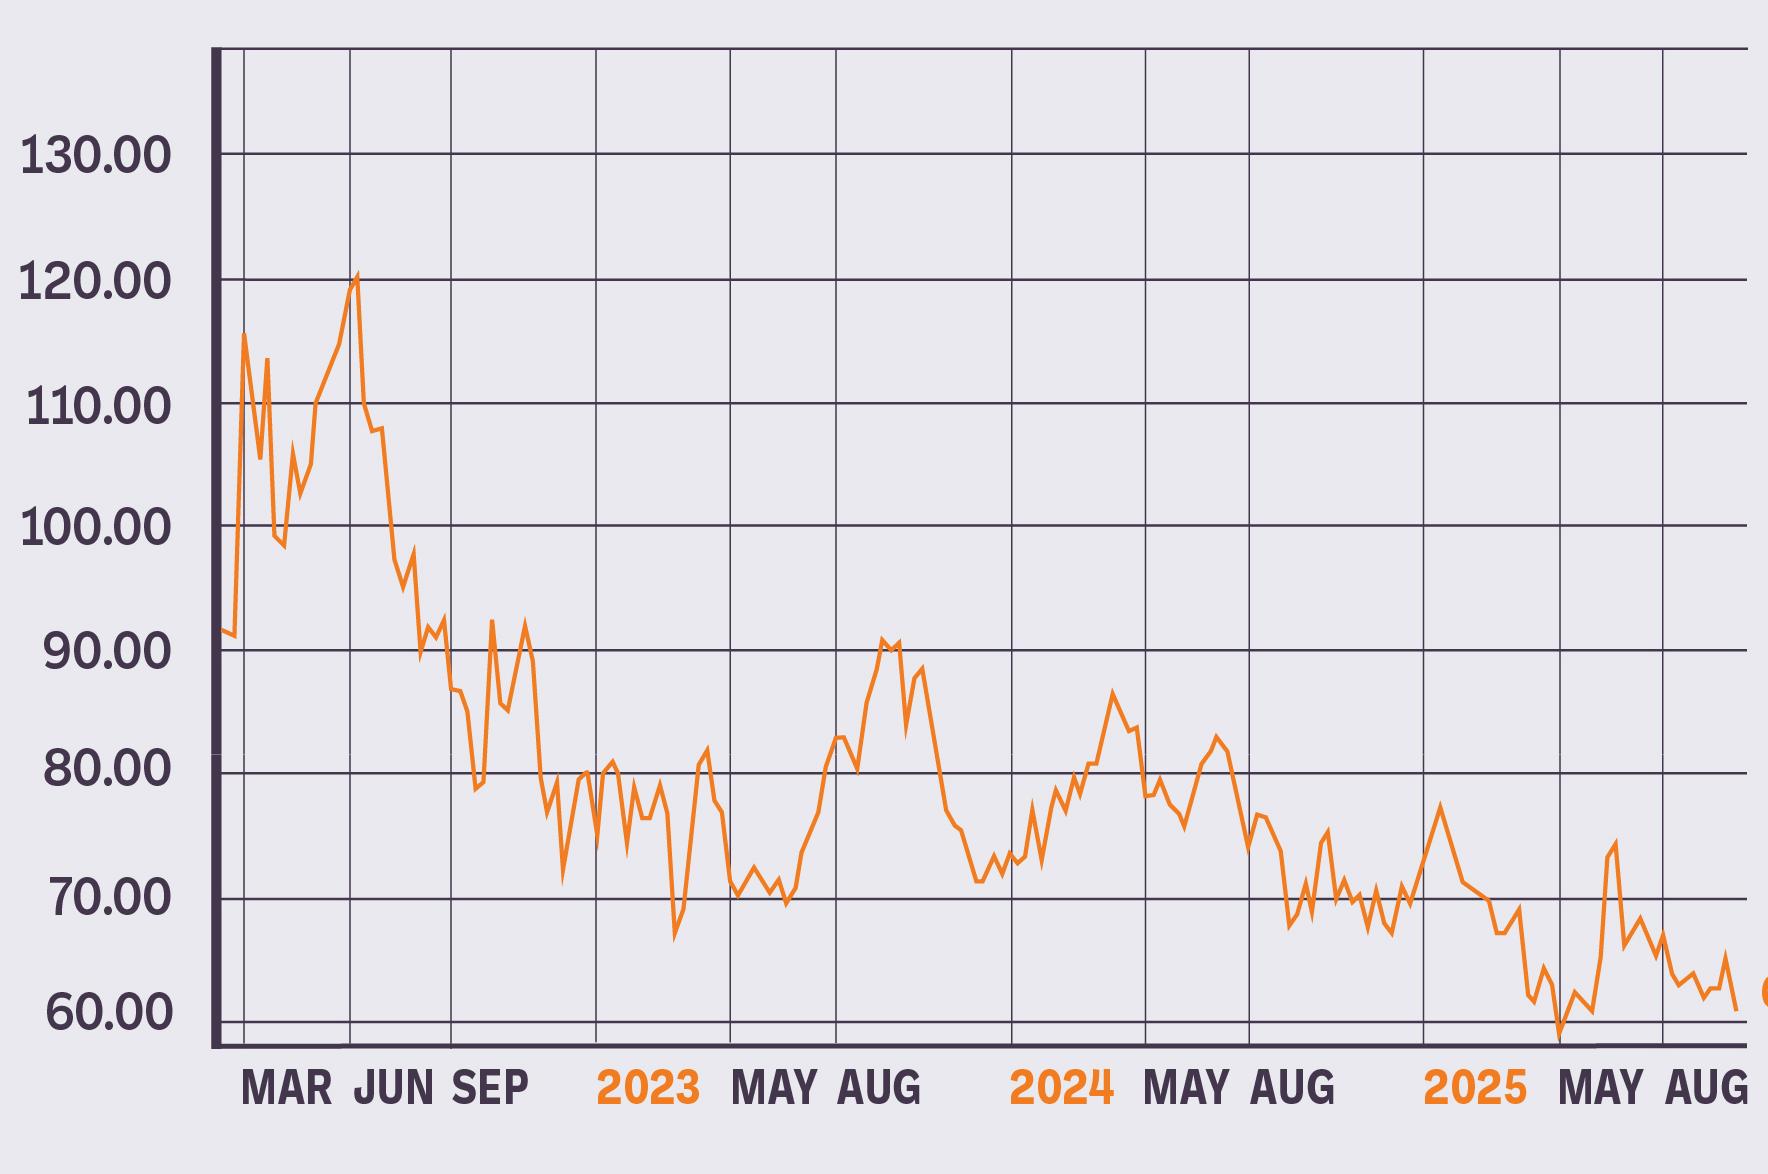
Crude oil prices remain volatile, typically swinging $25/barrel annually. U.S. consumers spend over $400 M/year on gasoline, making energy costs a key inflation factor.
• Rising OPEC output and weak global demand are driving oil inventories higher.
• NYMEX crude futures have declined into a range of $61–$65/barrel.
• 2026 forecasts:
· Crude oil: $62.50/barrel (vs. $65.59 last year)
· Gasoline: $3.14/gallon (lowest in 5 years)
· Diesel: $3.54/gallon (lowest in 5 years)
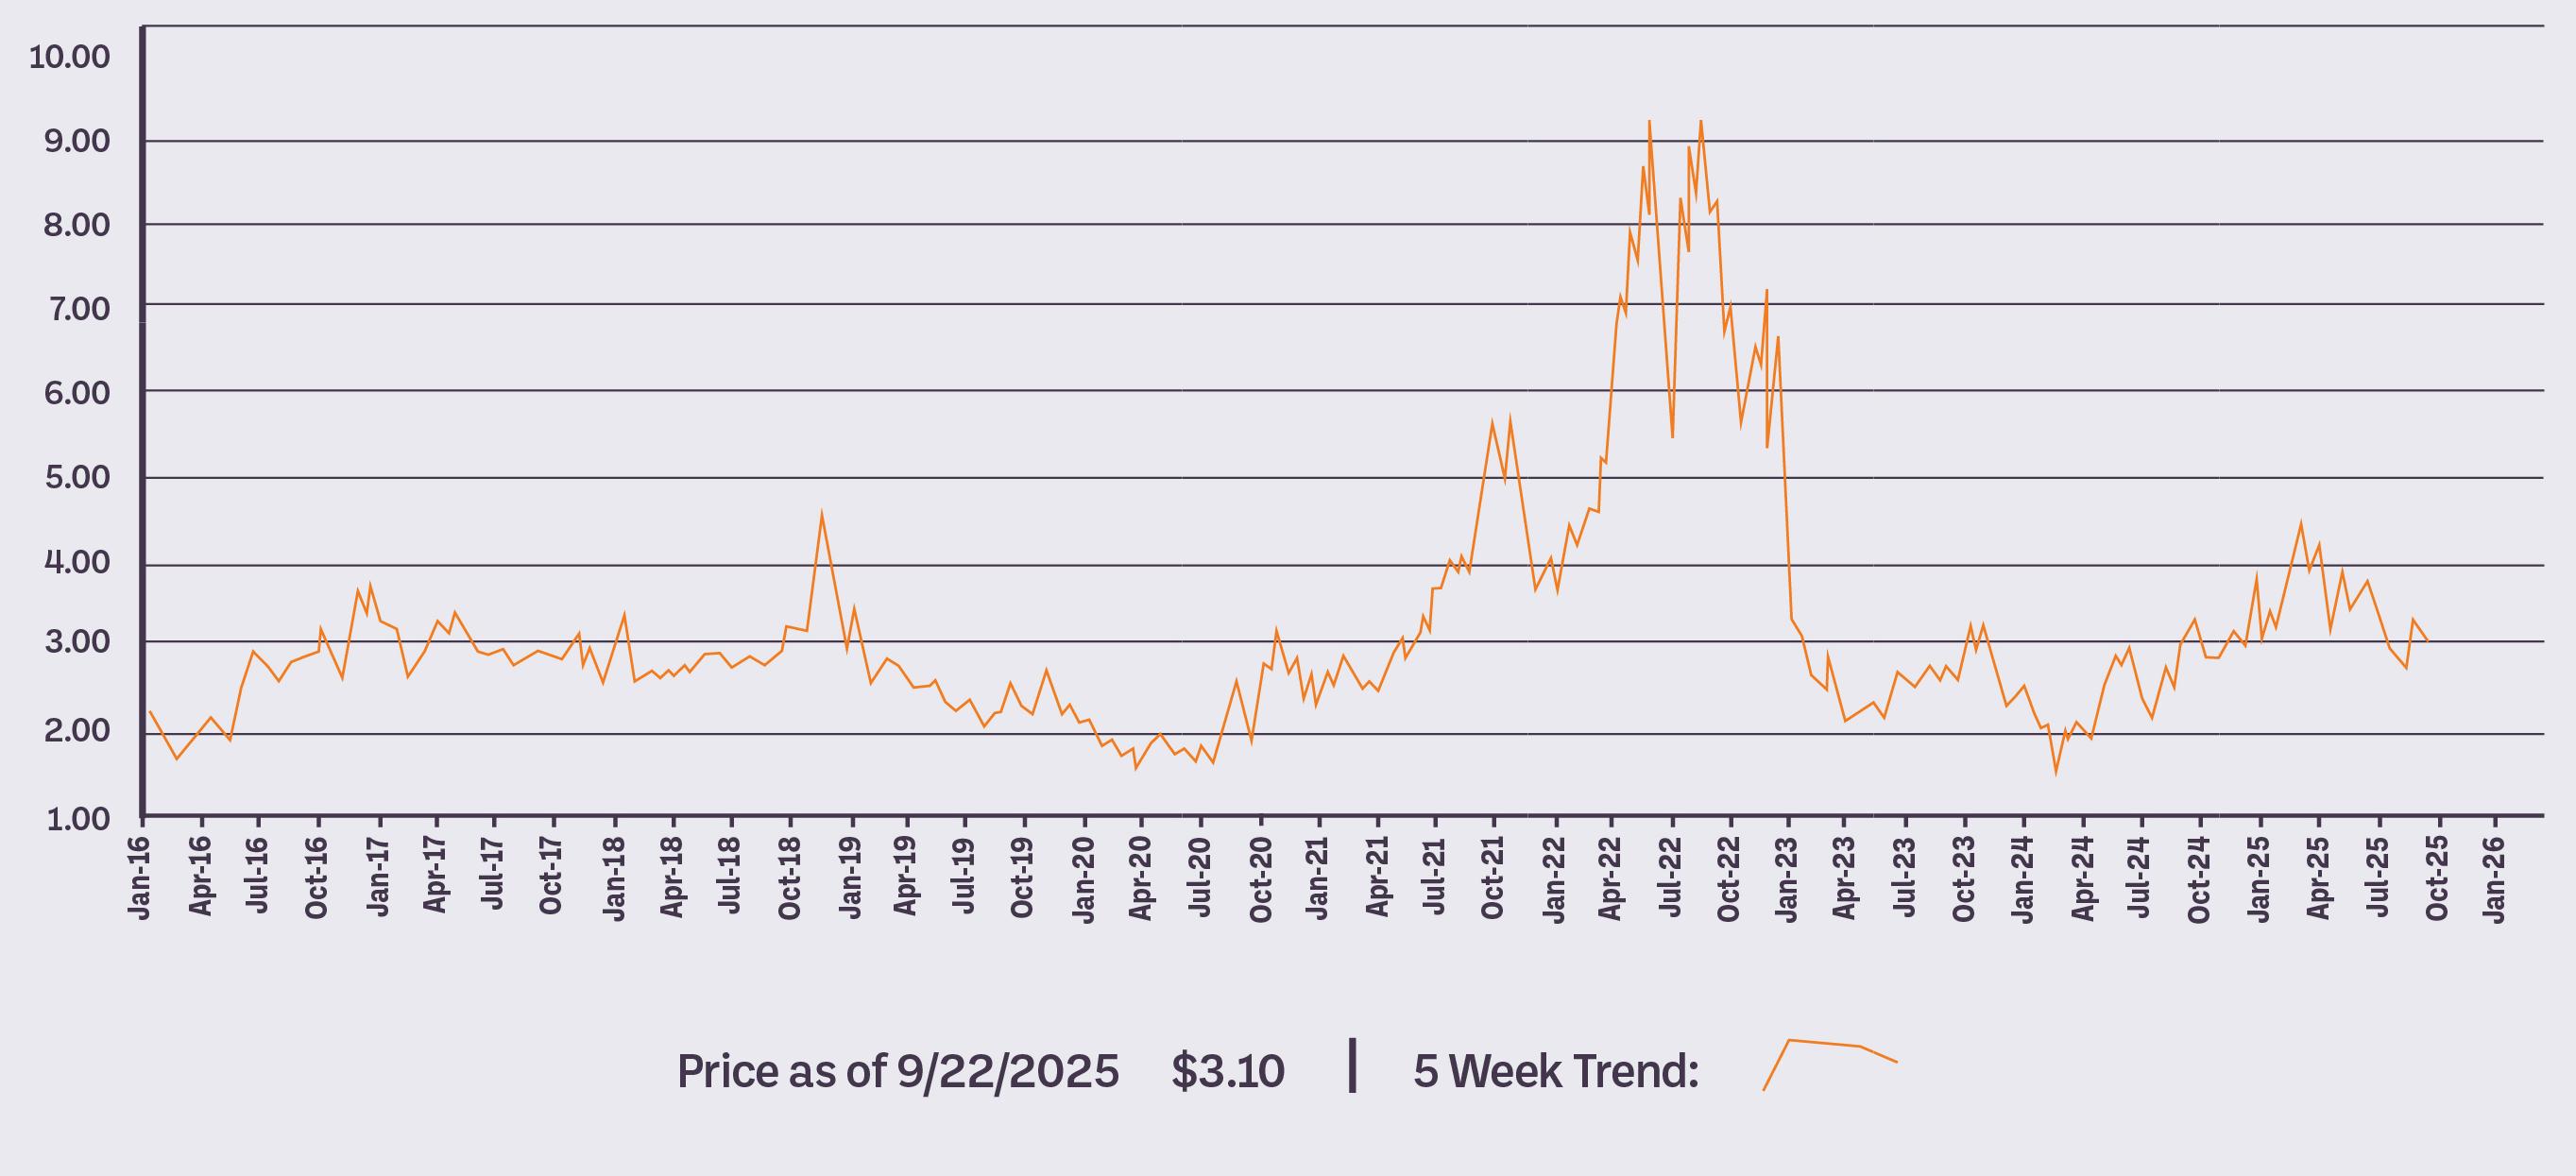
Natural gas demand is rising due to increased electricity use. Inventories are strong, but rising demand has elevated futures into a $3.00–$4.00/ MMBTU range.
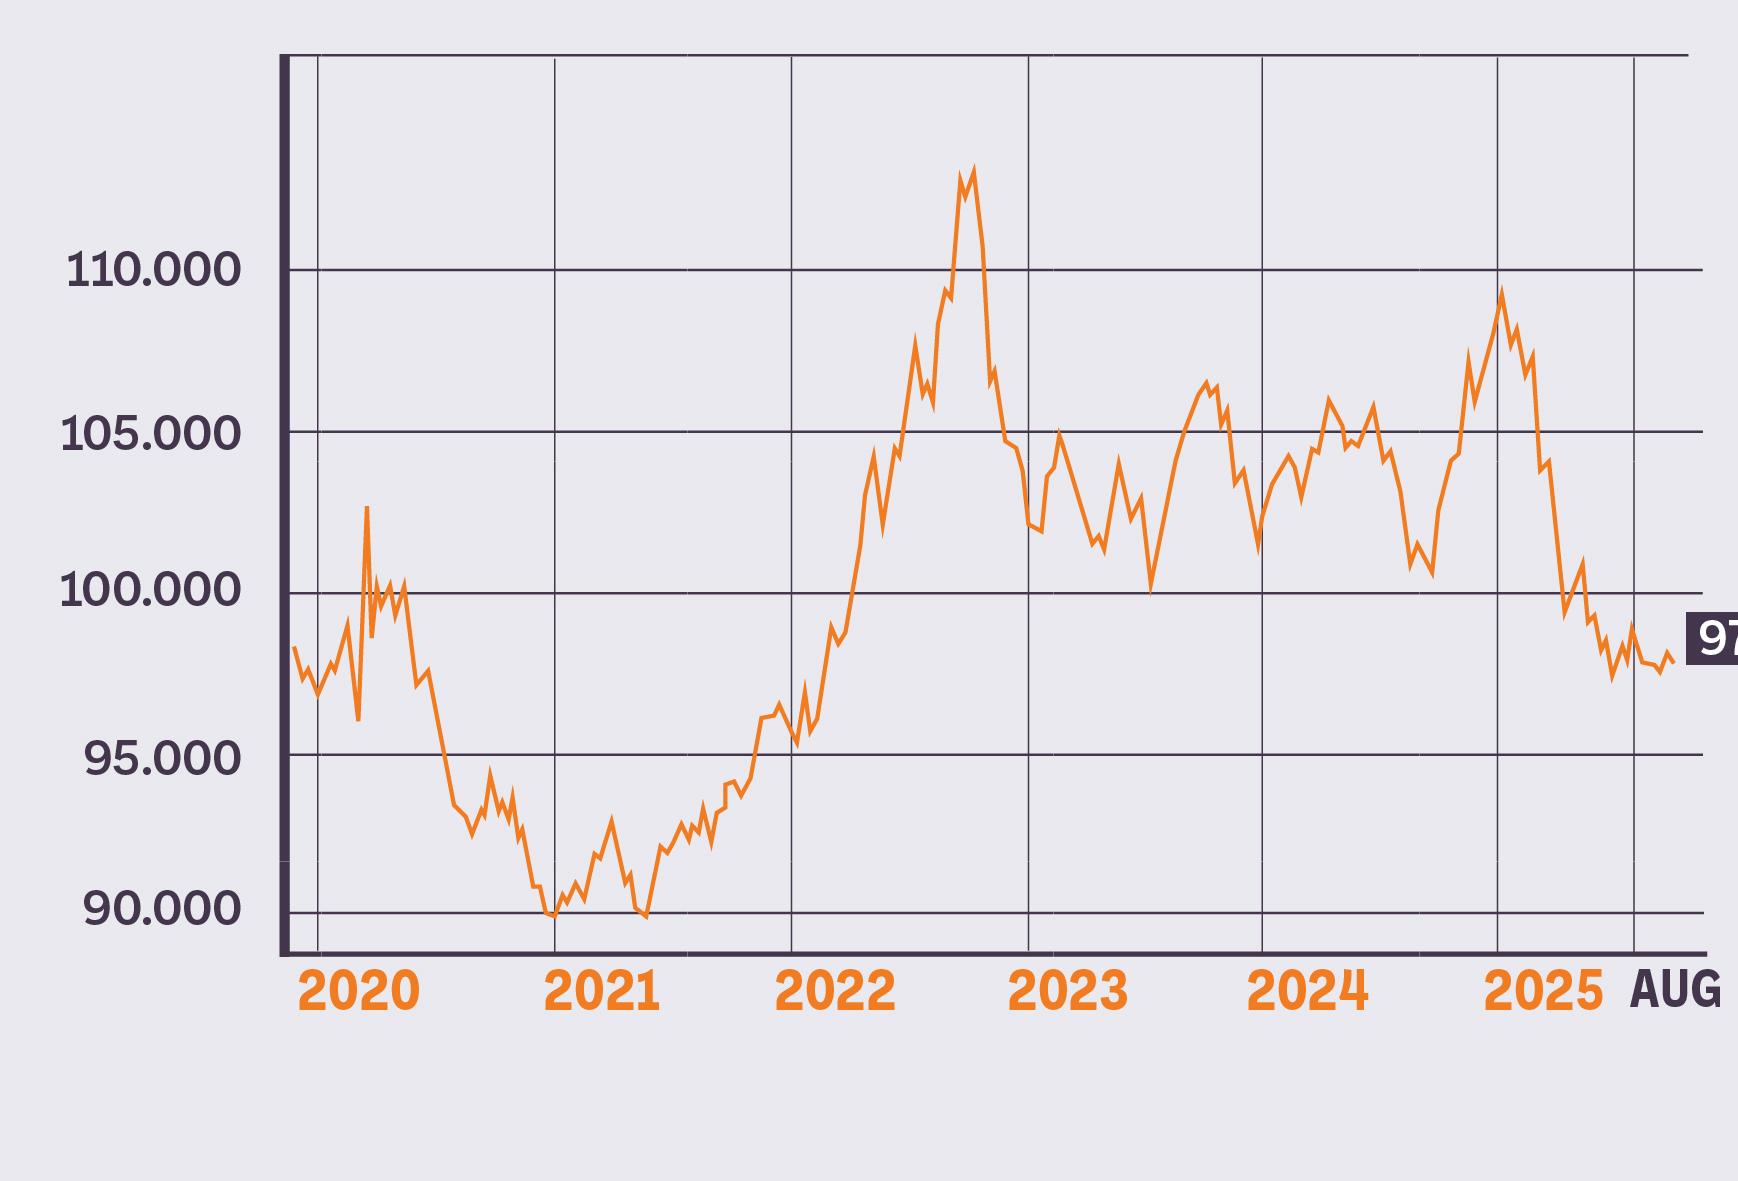
The U.S. dollar has dropped over 10% since early 2025, driven by tariff policy shifts and concerns over changes in Federal Reserve governance. While a weaker dollar typically fuels inflation, tariff policy now plays a more direct role in driving import prices.

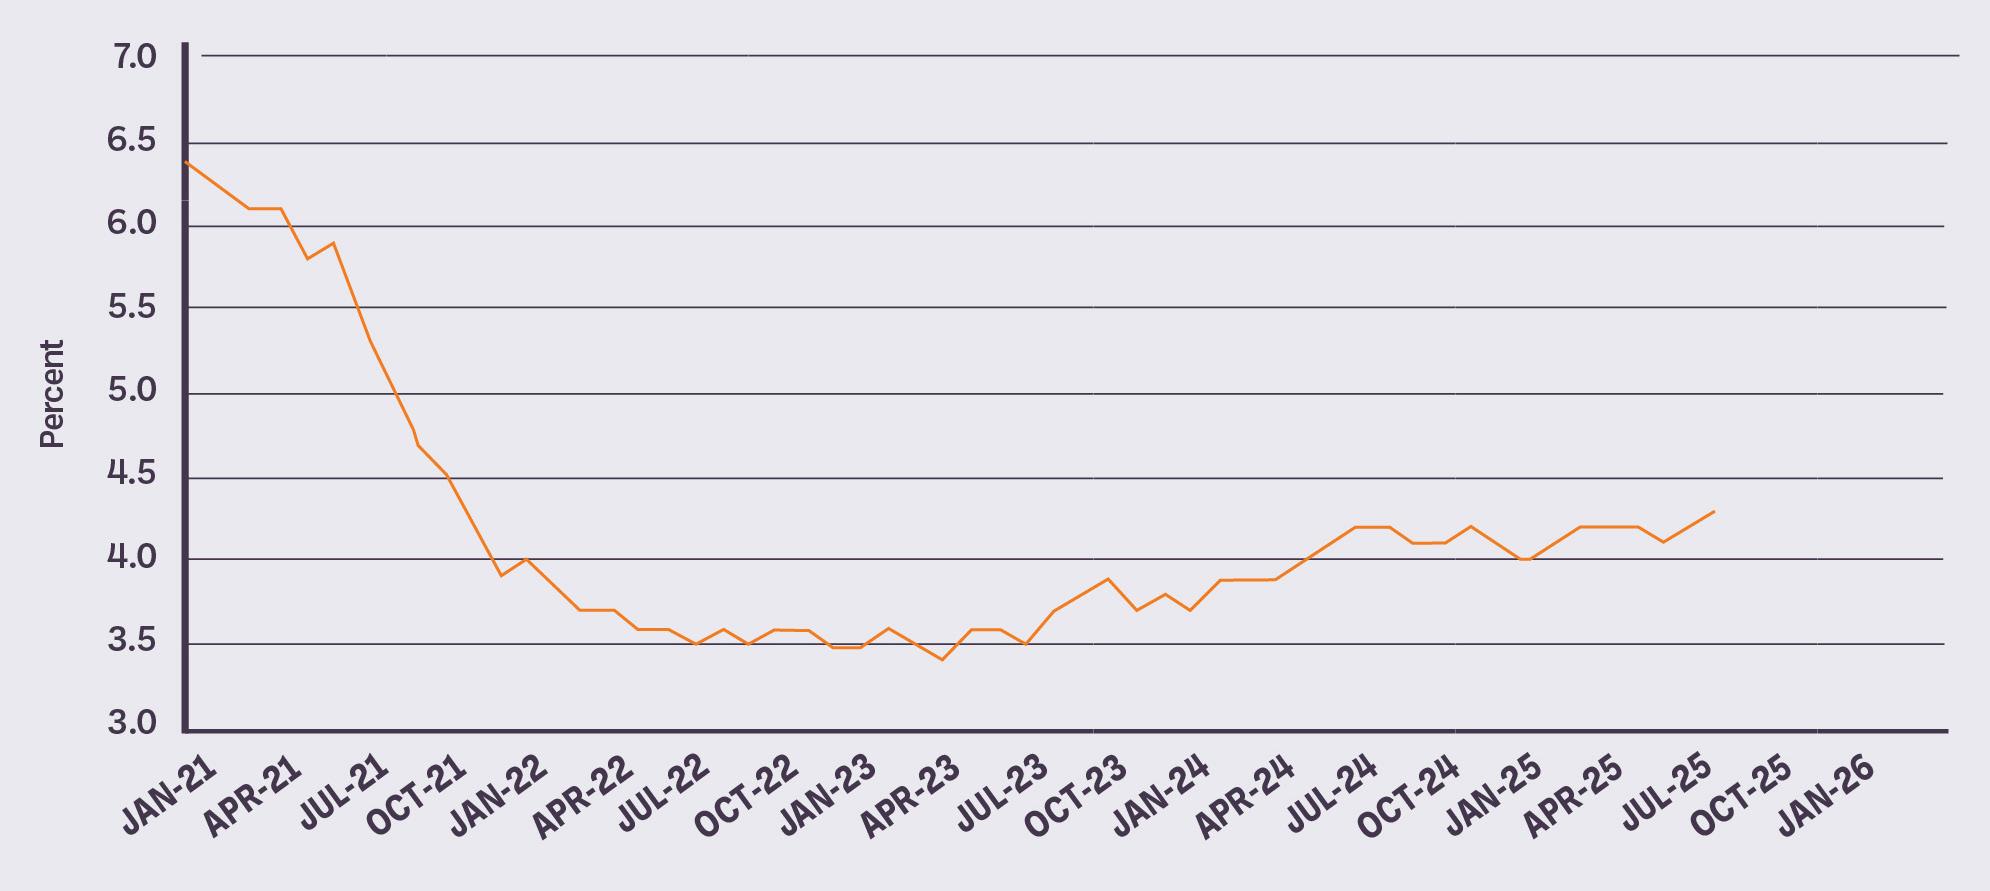
Labor shortages — driven by demographic trends — will remain a long-term challenge despite rising wages.
• Job growth slowed to just 26K/month from May–August 2025.
• Unemployment has edged up to 4.3%, still historically low.
• A recession could push unemployment toward 5%.

• Stricter immigration policies are reducing labor availability in food/agricultural sectors and dampening immigrant spending.
• New U.S. Department of Health and Human Services initiatives may reshape food manufacturing and distribution and product offerings — nothing dramatic thus far, but worth keeping an eye on.
• The delayed Farm Bill is expected to pass in 2026, with minimal impact on food prices.
• Geopolitical tensions (e.g., Middle East conflicts) remain a wildcard that could disrupt global and domestic markets.


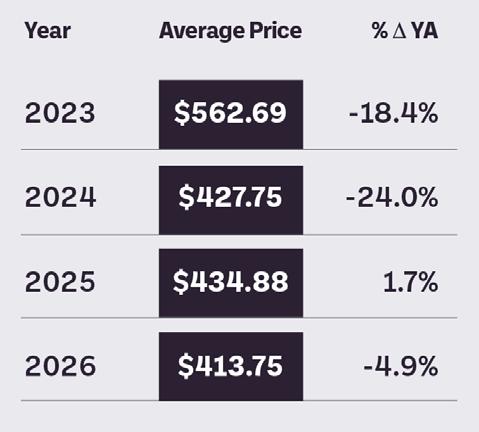
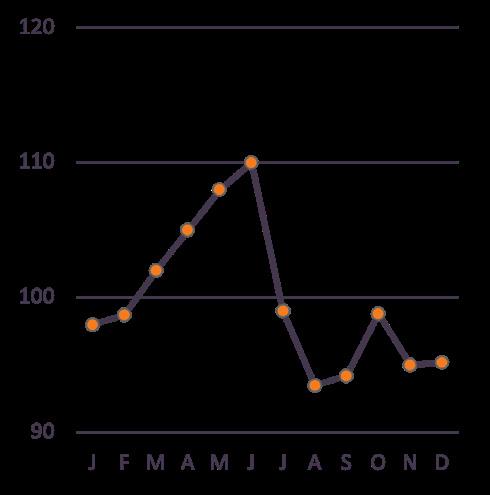
• Corn futures have declined to a $4.00–4.50 range (near the pre-2020 levels).
• Corn prices are important due to the size of the U.S. crop (relative to other crops), as well as the large-scale use of corn to feed livestock.
• Outlook into 2026: Corn stocks are expected to rise to a 7-year high, reflecting record U.S. corn yields and the largest acreage since 1936.
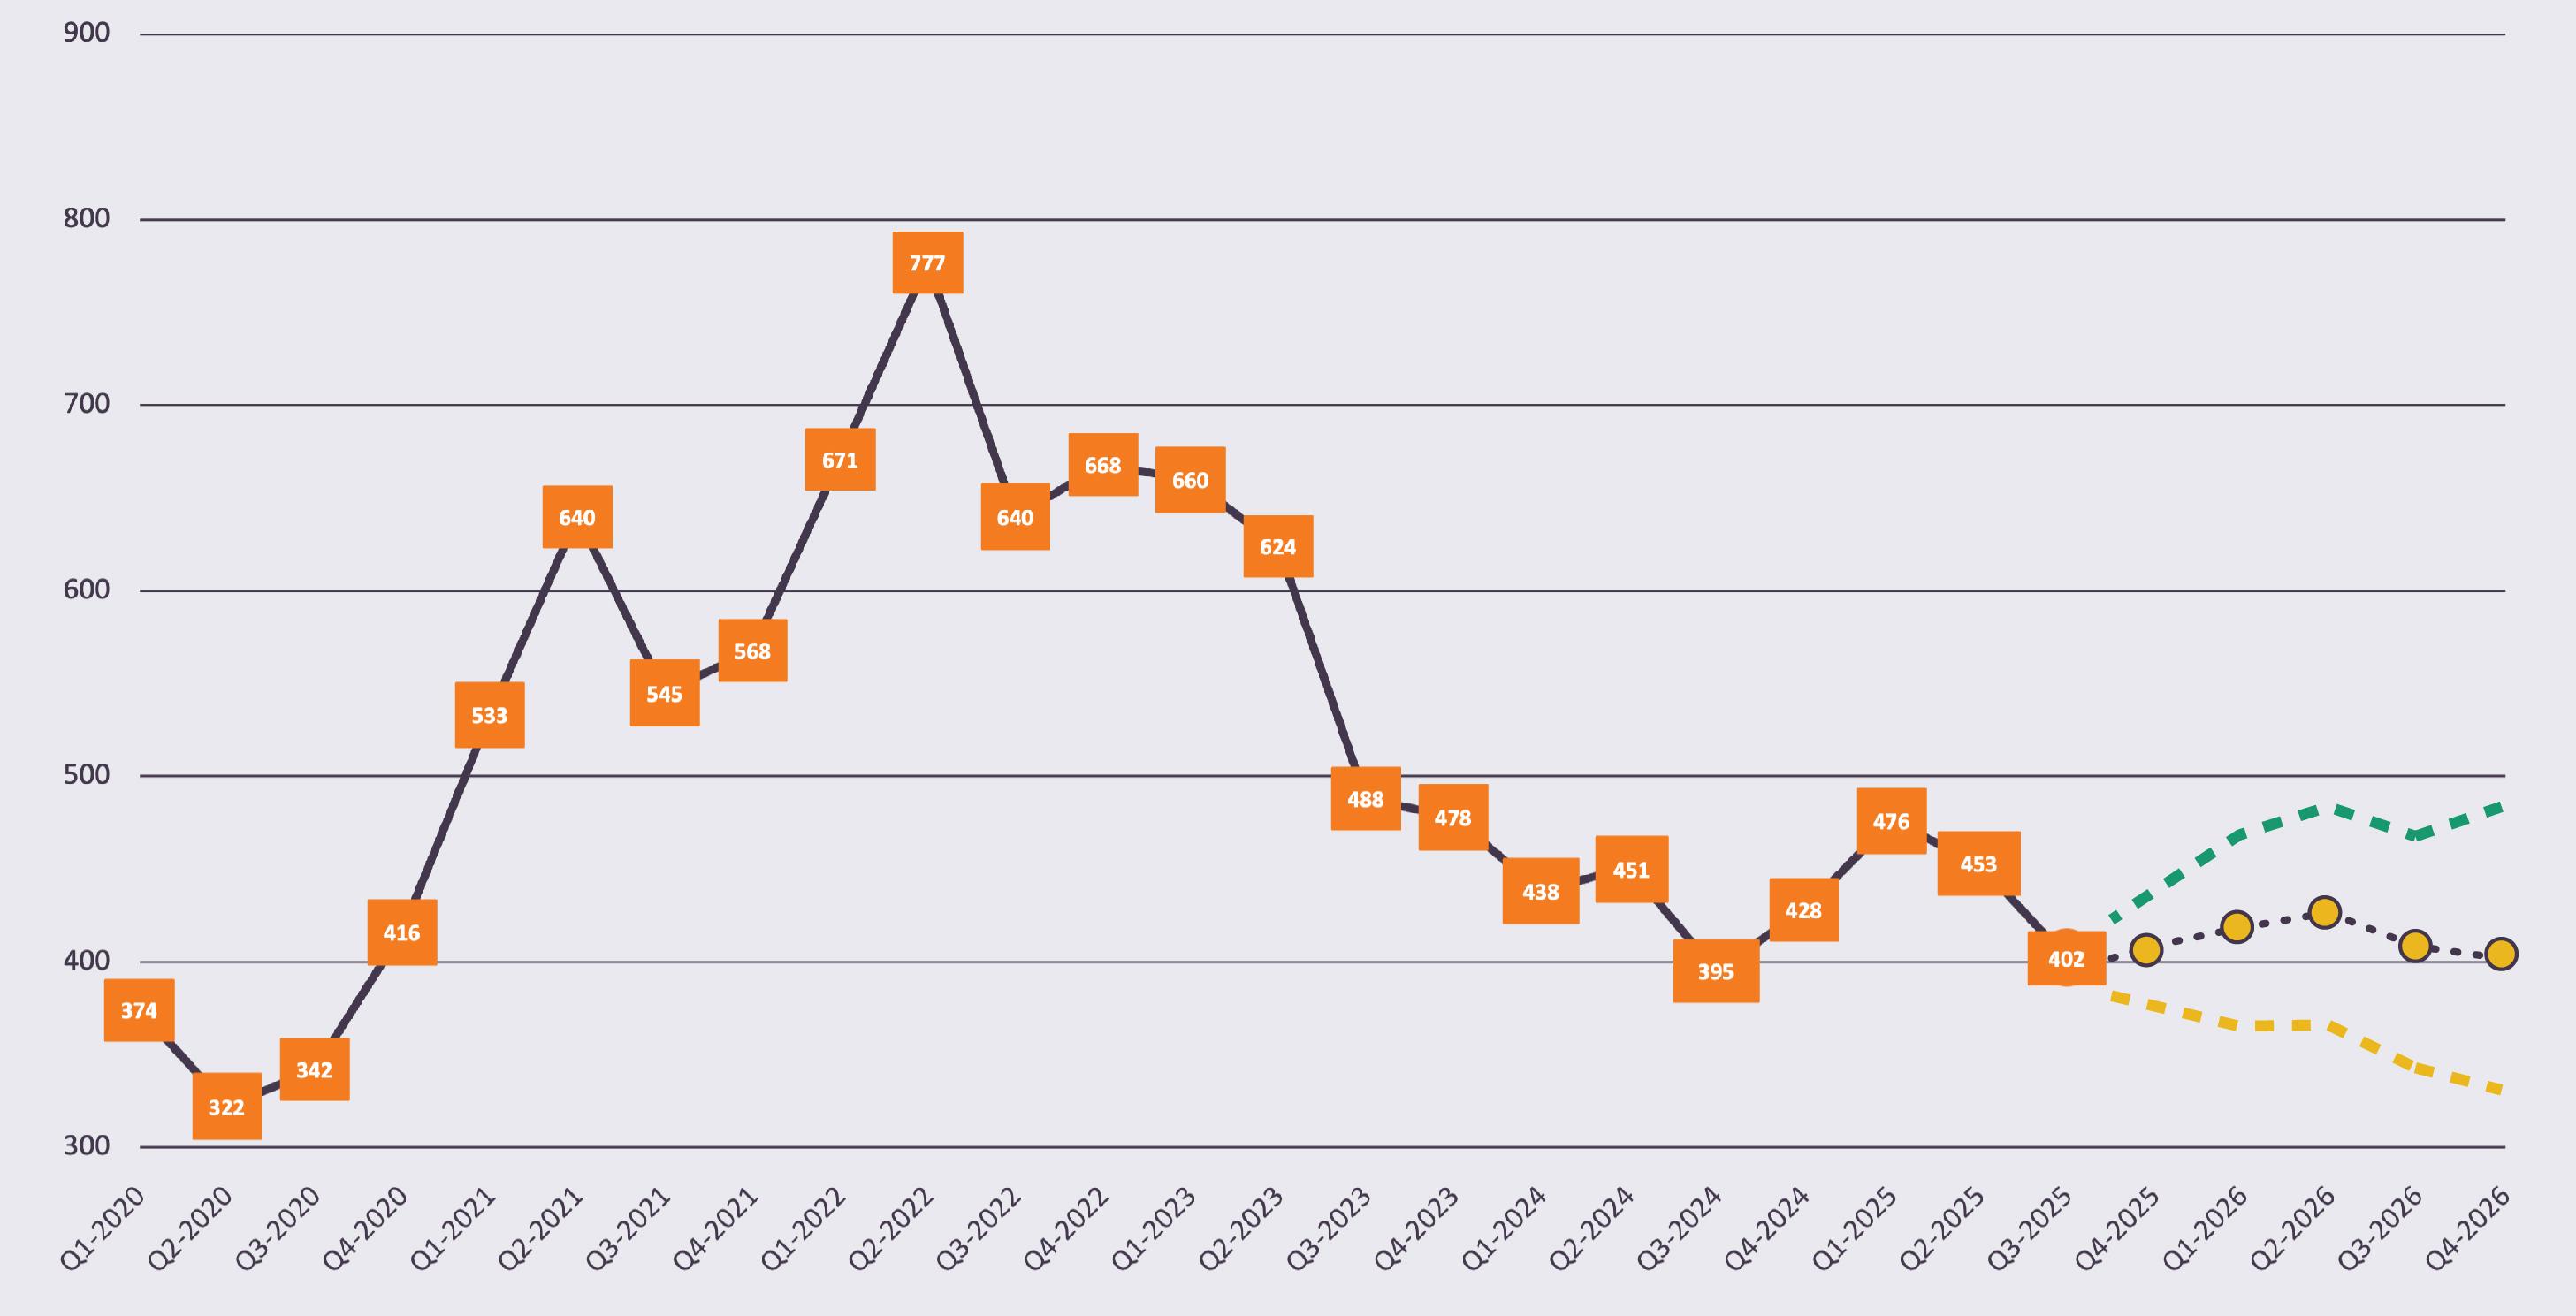

• Biofuel demand for soyoil is set to rise sharply in 2026/27 — limitations on imports of fats and oils, as well as an increase in annual biofuel obligations, have elevated soyoil prices to over $.50/lb.
• Outlook into 2026: The soyoil futures market is expected to be volatile through 2026 —futures are forecast to average $.508/lb. but could range from $.46 to $.54 over the course of the year.
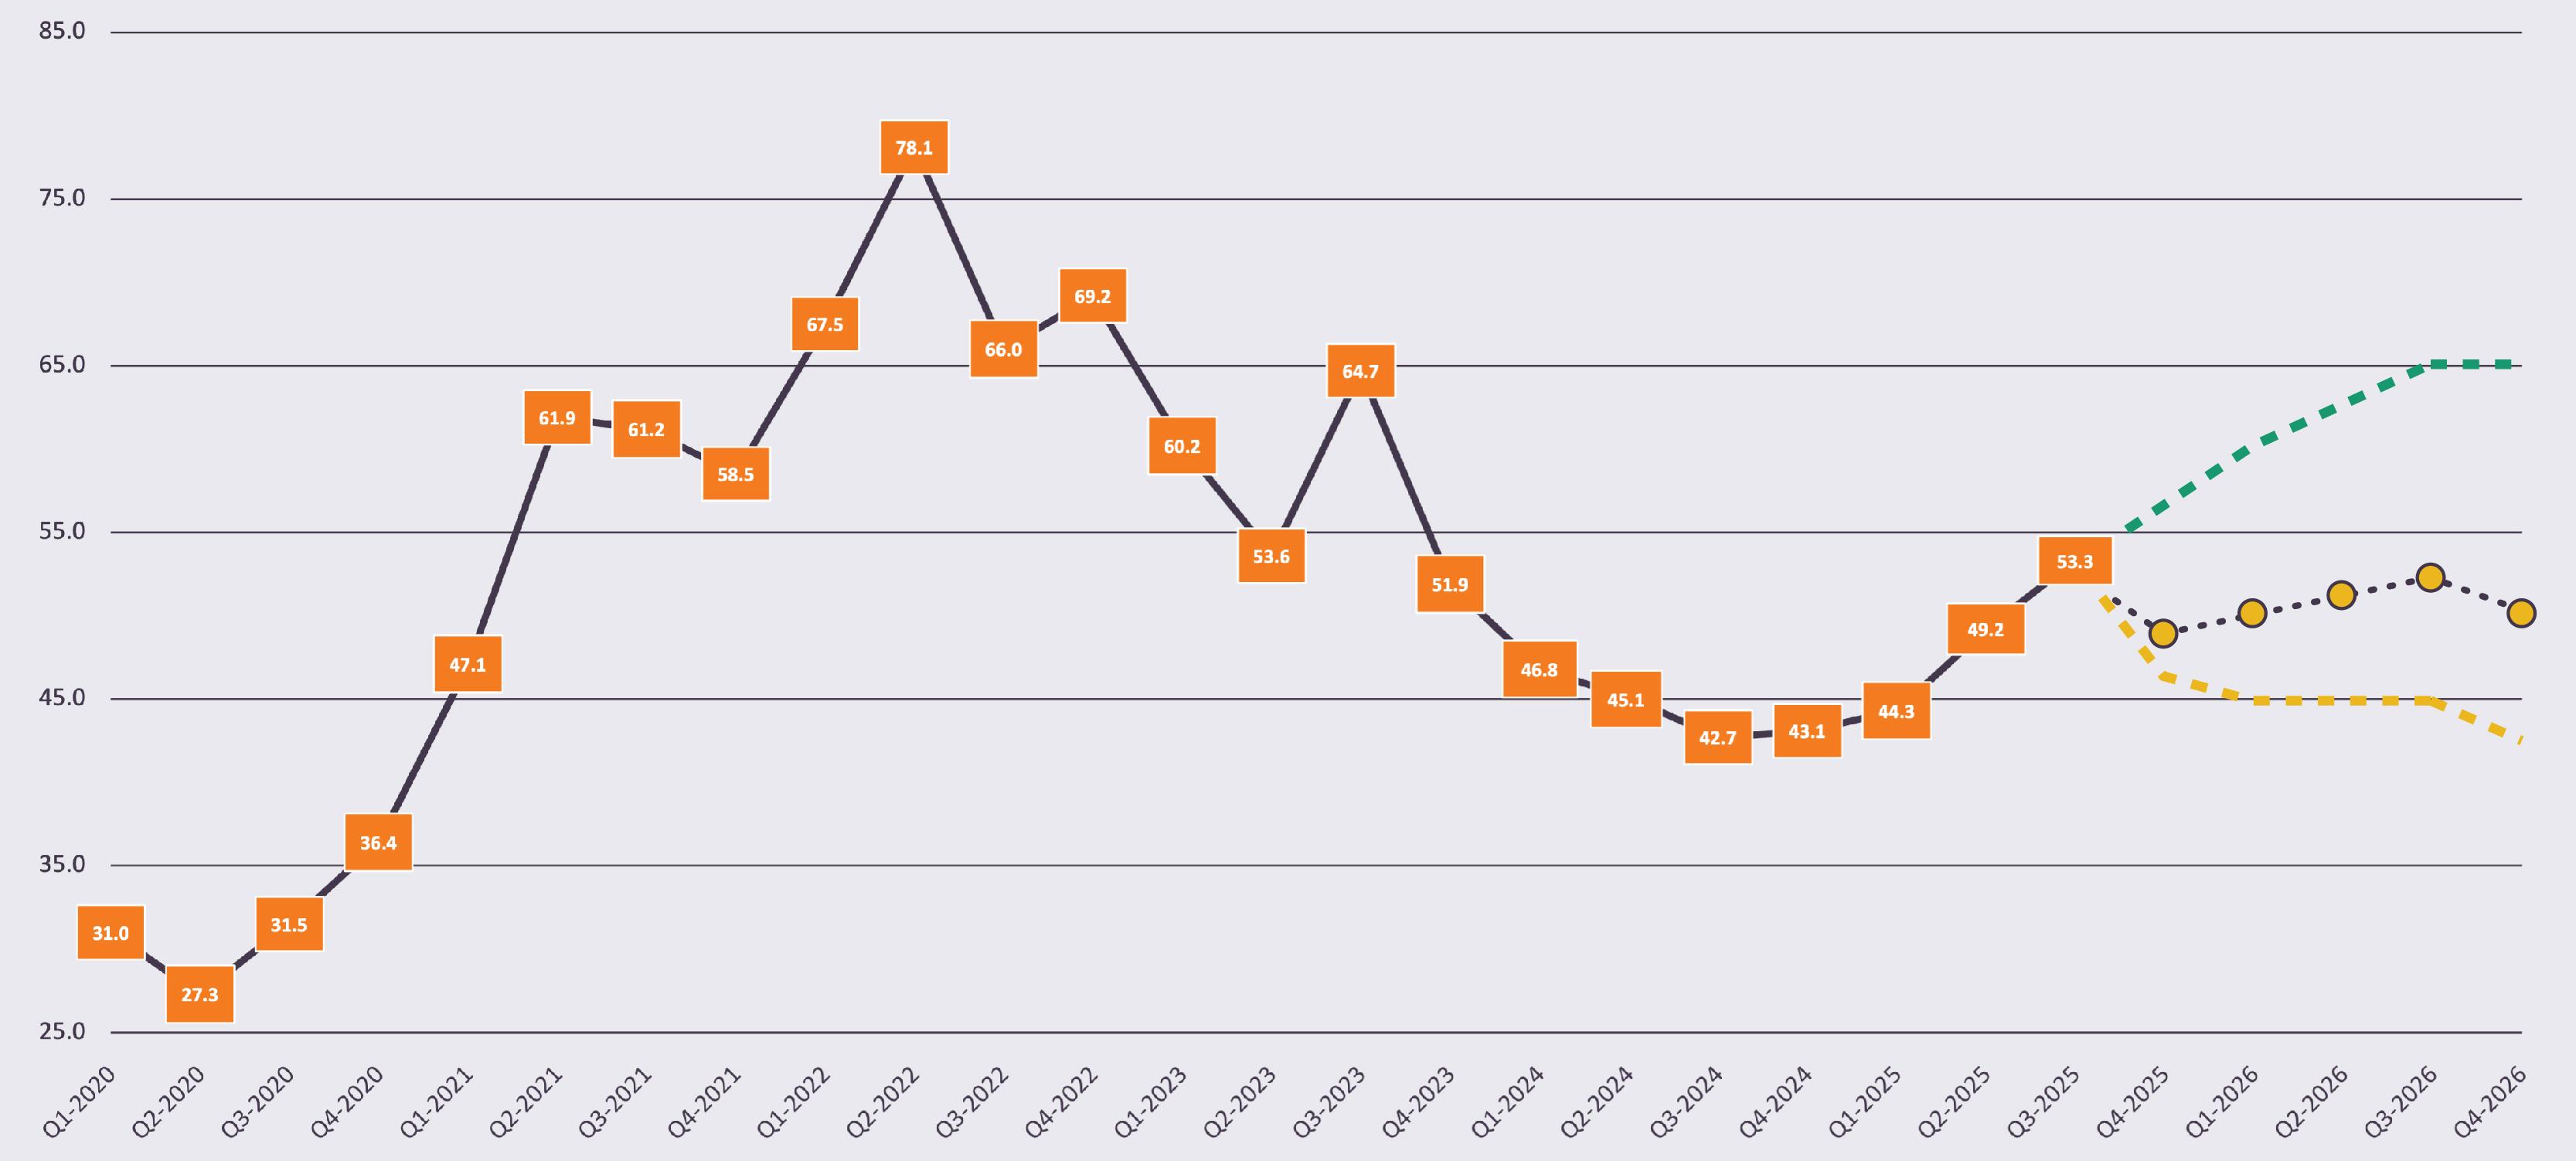
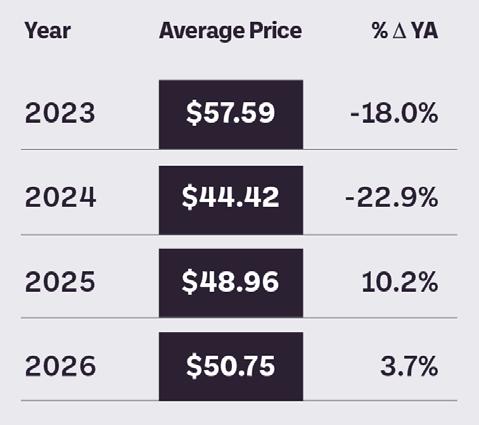
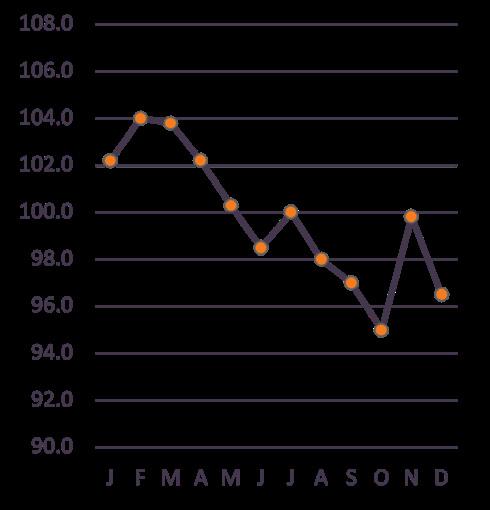

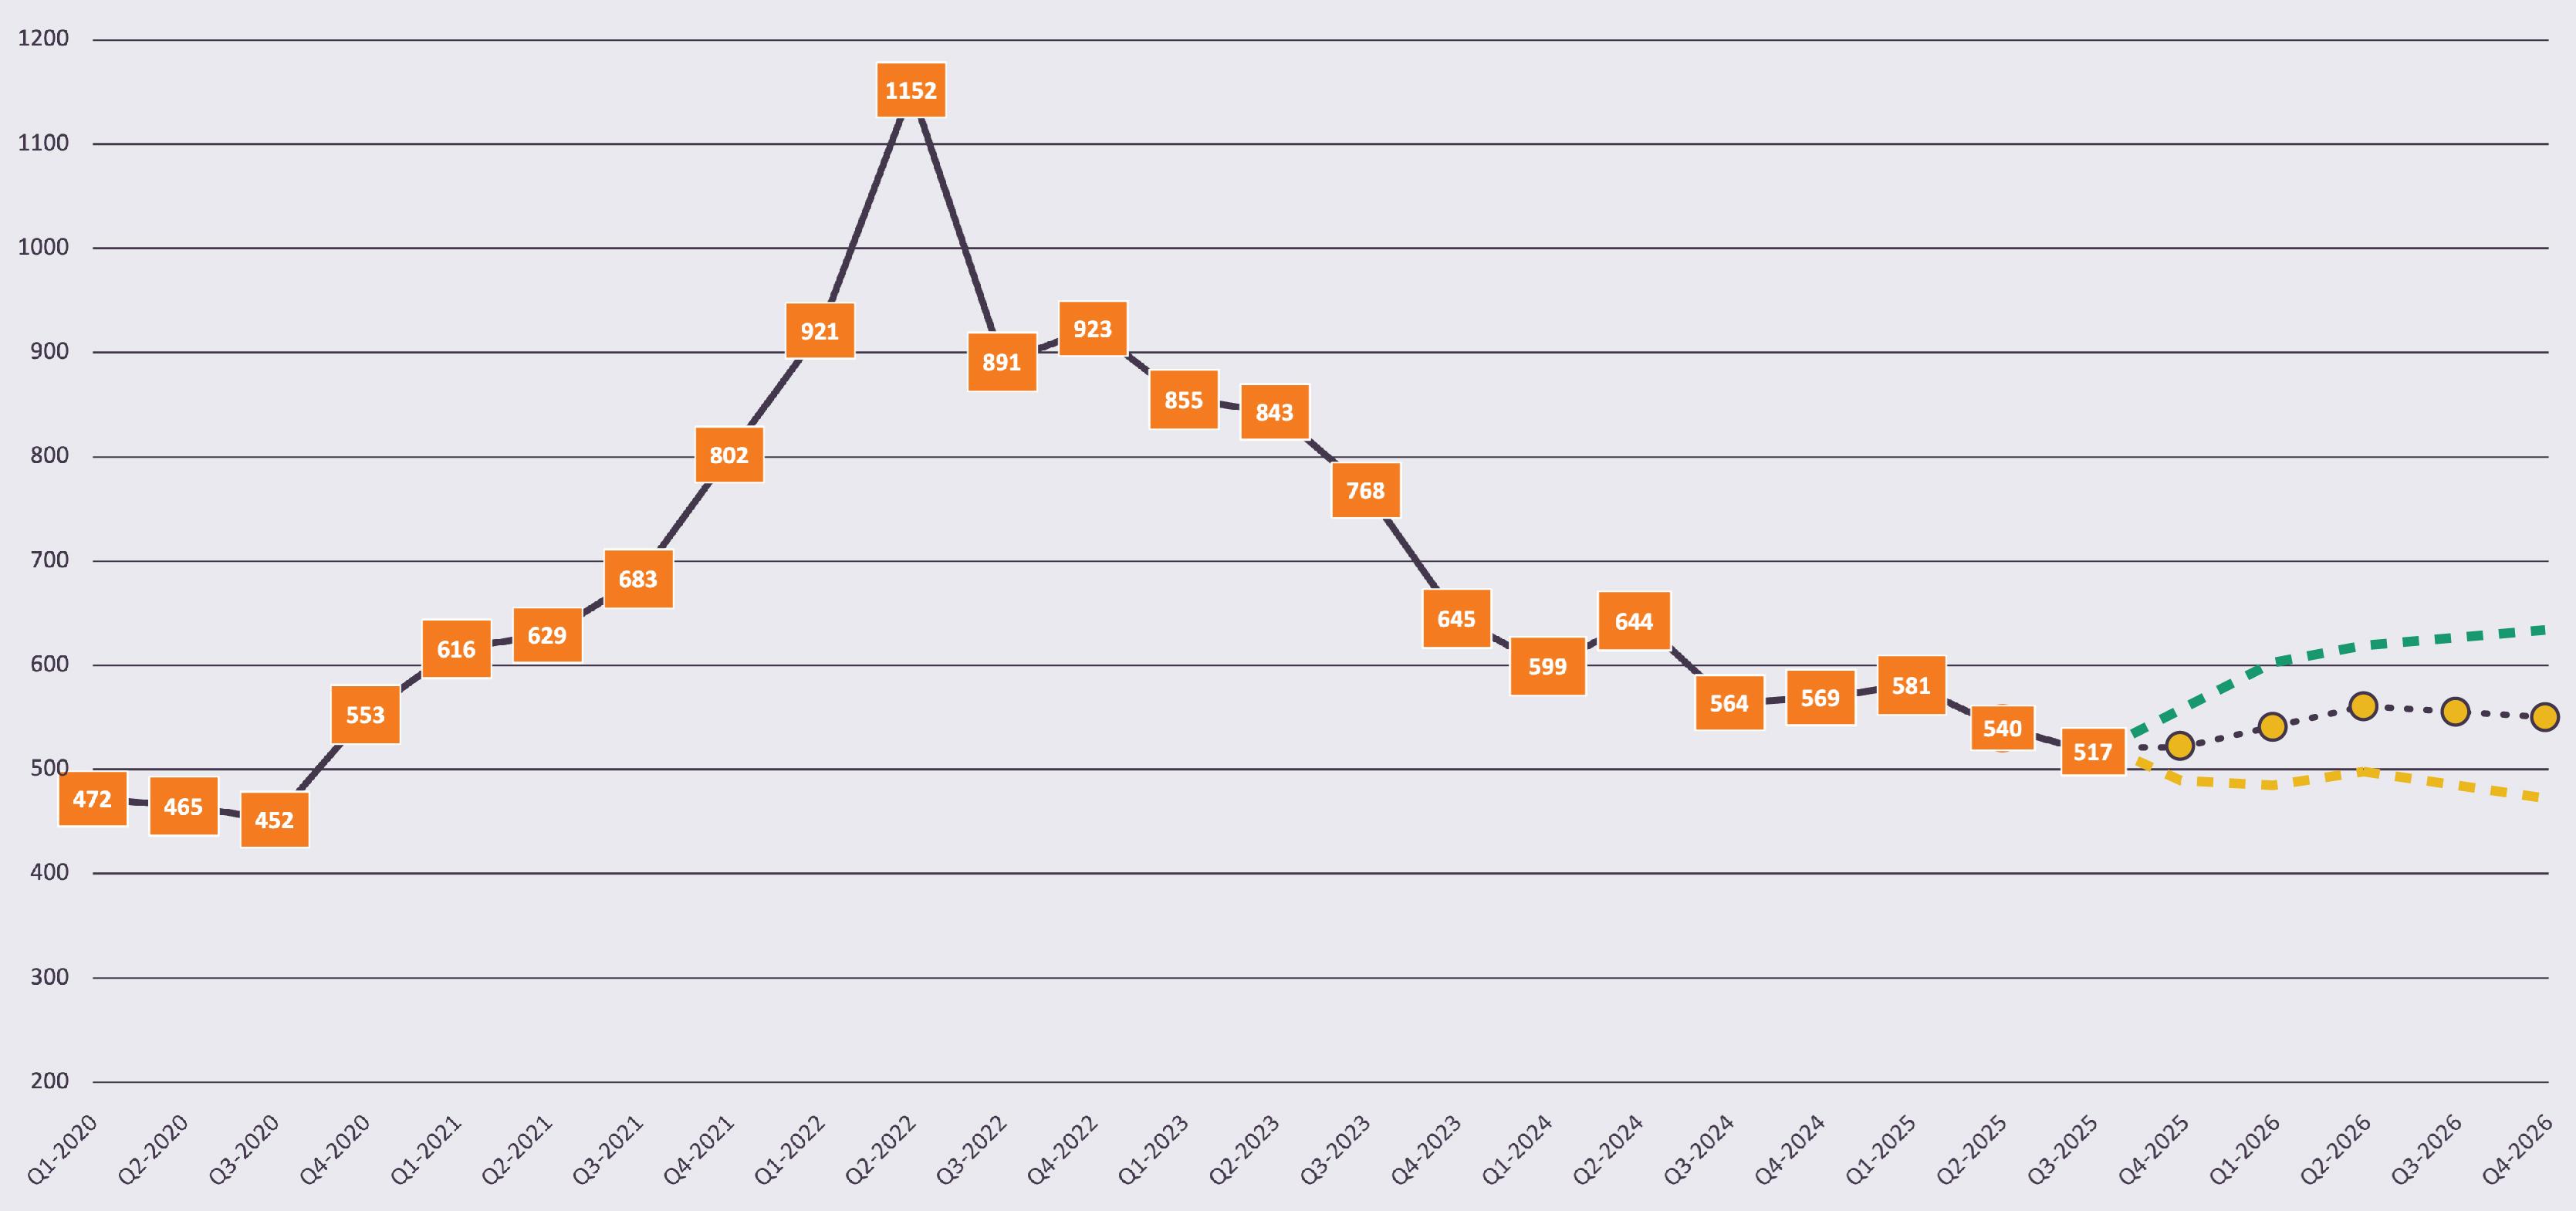
• With record yields, U.S. wheat ending stocks are expected to rise to a 7-year high at the end of the 25/26 crop year. World wheat supplies have also rebounded sharply.
• The larger supplies, as well as weak corn prices, have led to a sharp decline in KC wheat futures, from over $14 into a $5.00-5.50 range. Other futures prices have followed.
• Outlook into 2026:
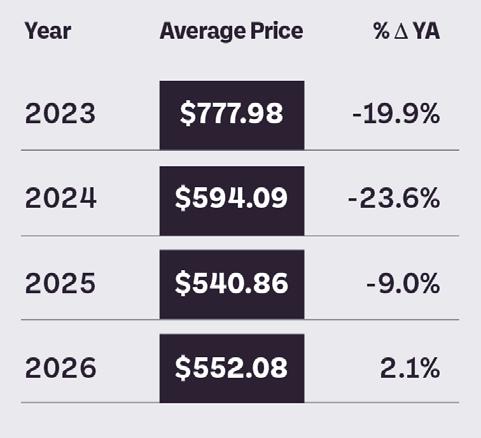
· AES is forecasting 2026 KC wheat prices to average $5.50 (+2.1% vs. last year), while Chicago wheat futures are forecast to average $5.45 (+1.5%). Mpls wheat futures are forecast to remain at a wide premium to KC, averaging $6.07 (+2.4%).
· North American durum wheat supplies are expected to remain ample during 2025/26, leading to cash durum prices declining to an average of $9.15 (-3.6%).
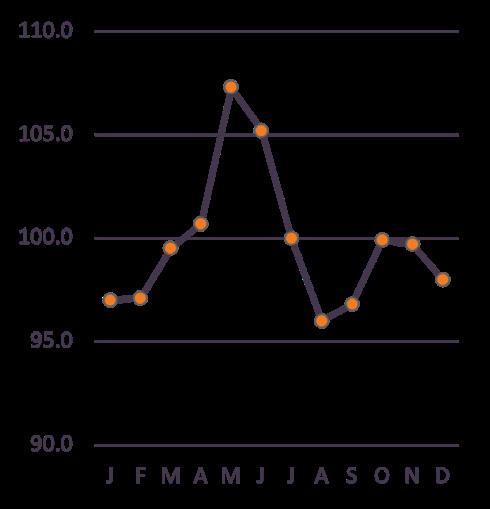

• Long grain white rice prices have been trending downwards and are expected to continue that trend through Q4 and then remain flat throughout 2026.
• U.S. rice production for 2025/26 is expected to be down 10% but large carryover stocks are resulting in a slight increase in supply. Use is expected to be up slightly as well, resulting in ending stocks flat versus last year.
• Farm prices are expected to decline from $14/cwt to $12/cwt, supporting lower prices in 2026.
• Outlook into 2026: Steady ending stocks and lower farm prices are expected to drive prices lower in 2026 to around $33/cwt.
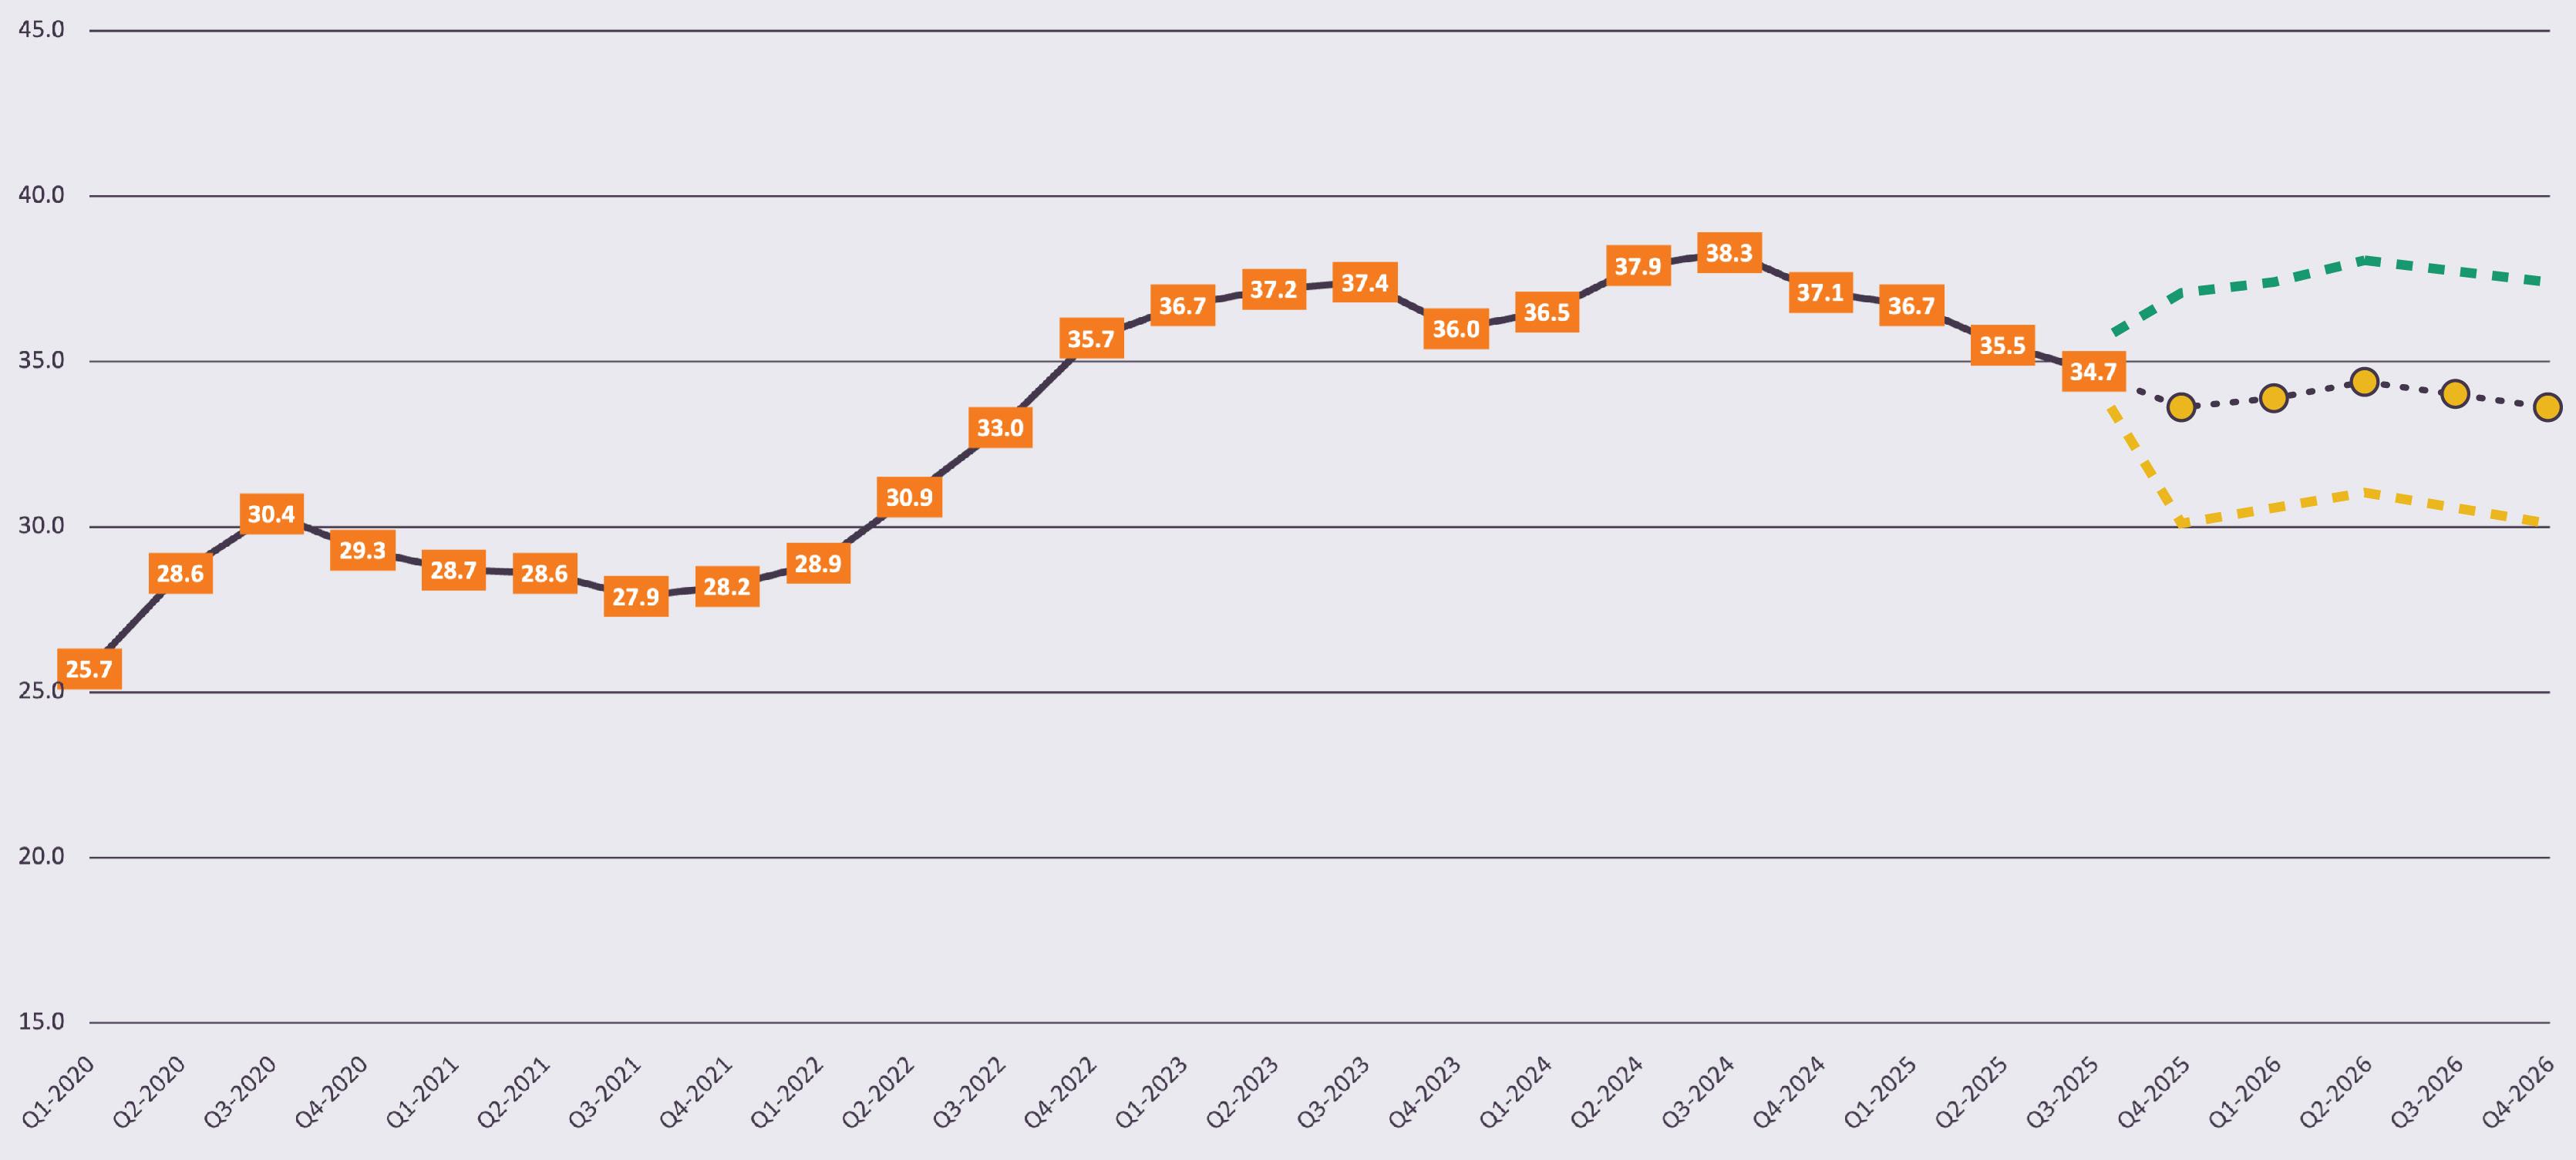
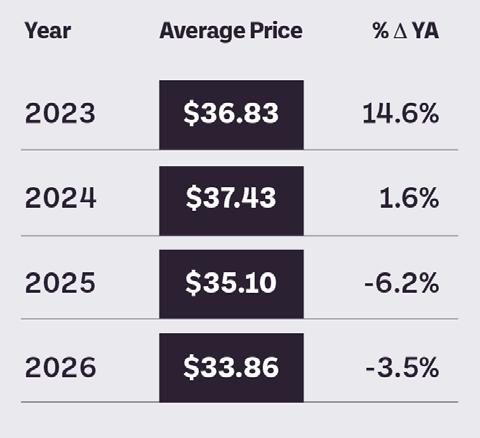
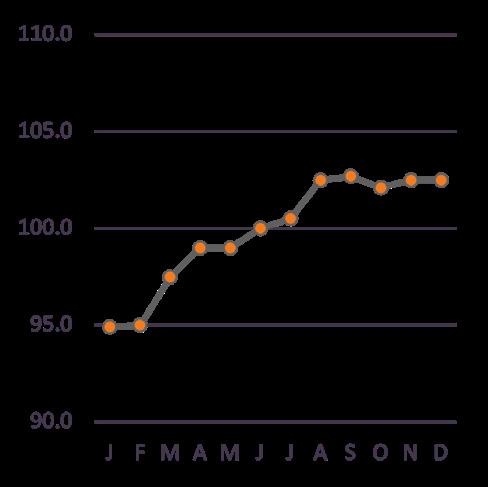
• Tight protein supplies continue to underpin a bullish price environment into late 2025. Total cold storage stocks as of end-August were 1.98 billion lbs., the lowest since 2010, 2.8% below a year-ago and 8.0% below the 5-year average.
• Feed costs are well below 2022 peaks, supporting producer margins across species. Lower corn and soybean meal prices are incentivizing broiler expansion and supporting hog producer profitability, while easing cost pressure on dairy operations.
• Trade policy and animal health shocks (Brazil beef tariffs, Mexican screwworm border closures, HPAI, PRRS, metapneumovirus) are exerting material structural impacts on supply chains across all proteins.
Dairy Production & Herd
• Milk output: YTD +2.1% — strongest growth since 2021. Herd is the largest since the 1990s, aided by lower cull rates.
• Drivers: >170k head added over 12 months; record component tests (butterfat +2.0% YTD after +2.4% in 2024) lifting dairy product manufacturing potential.
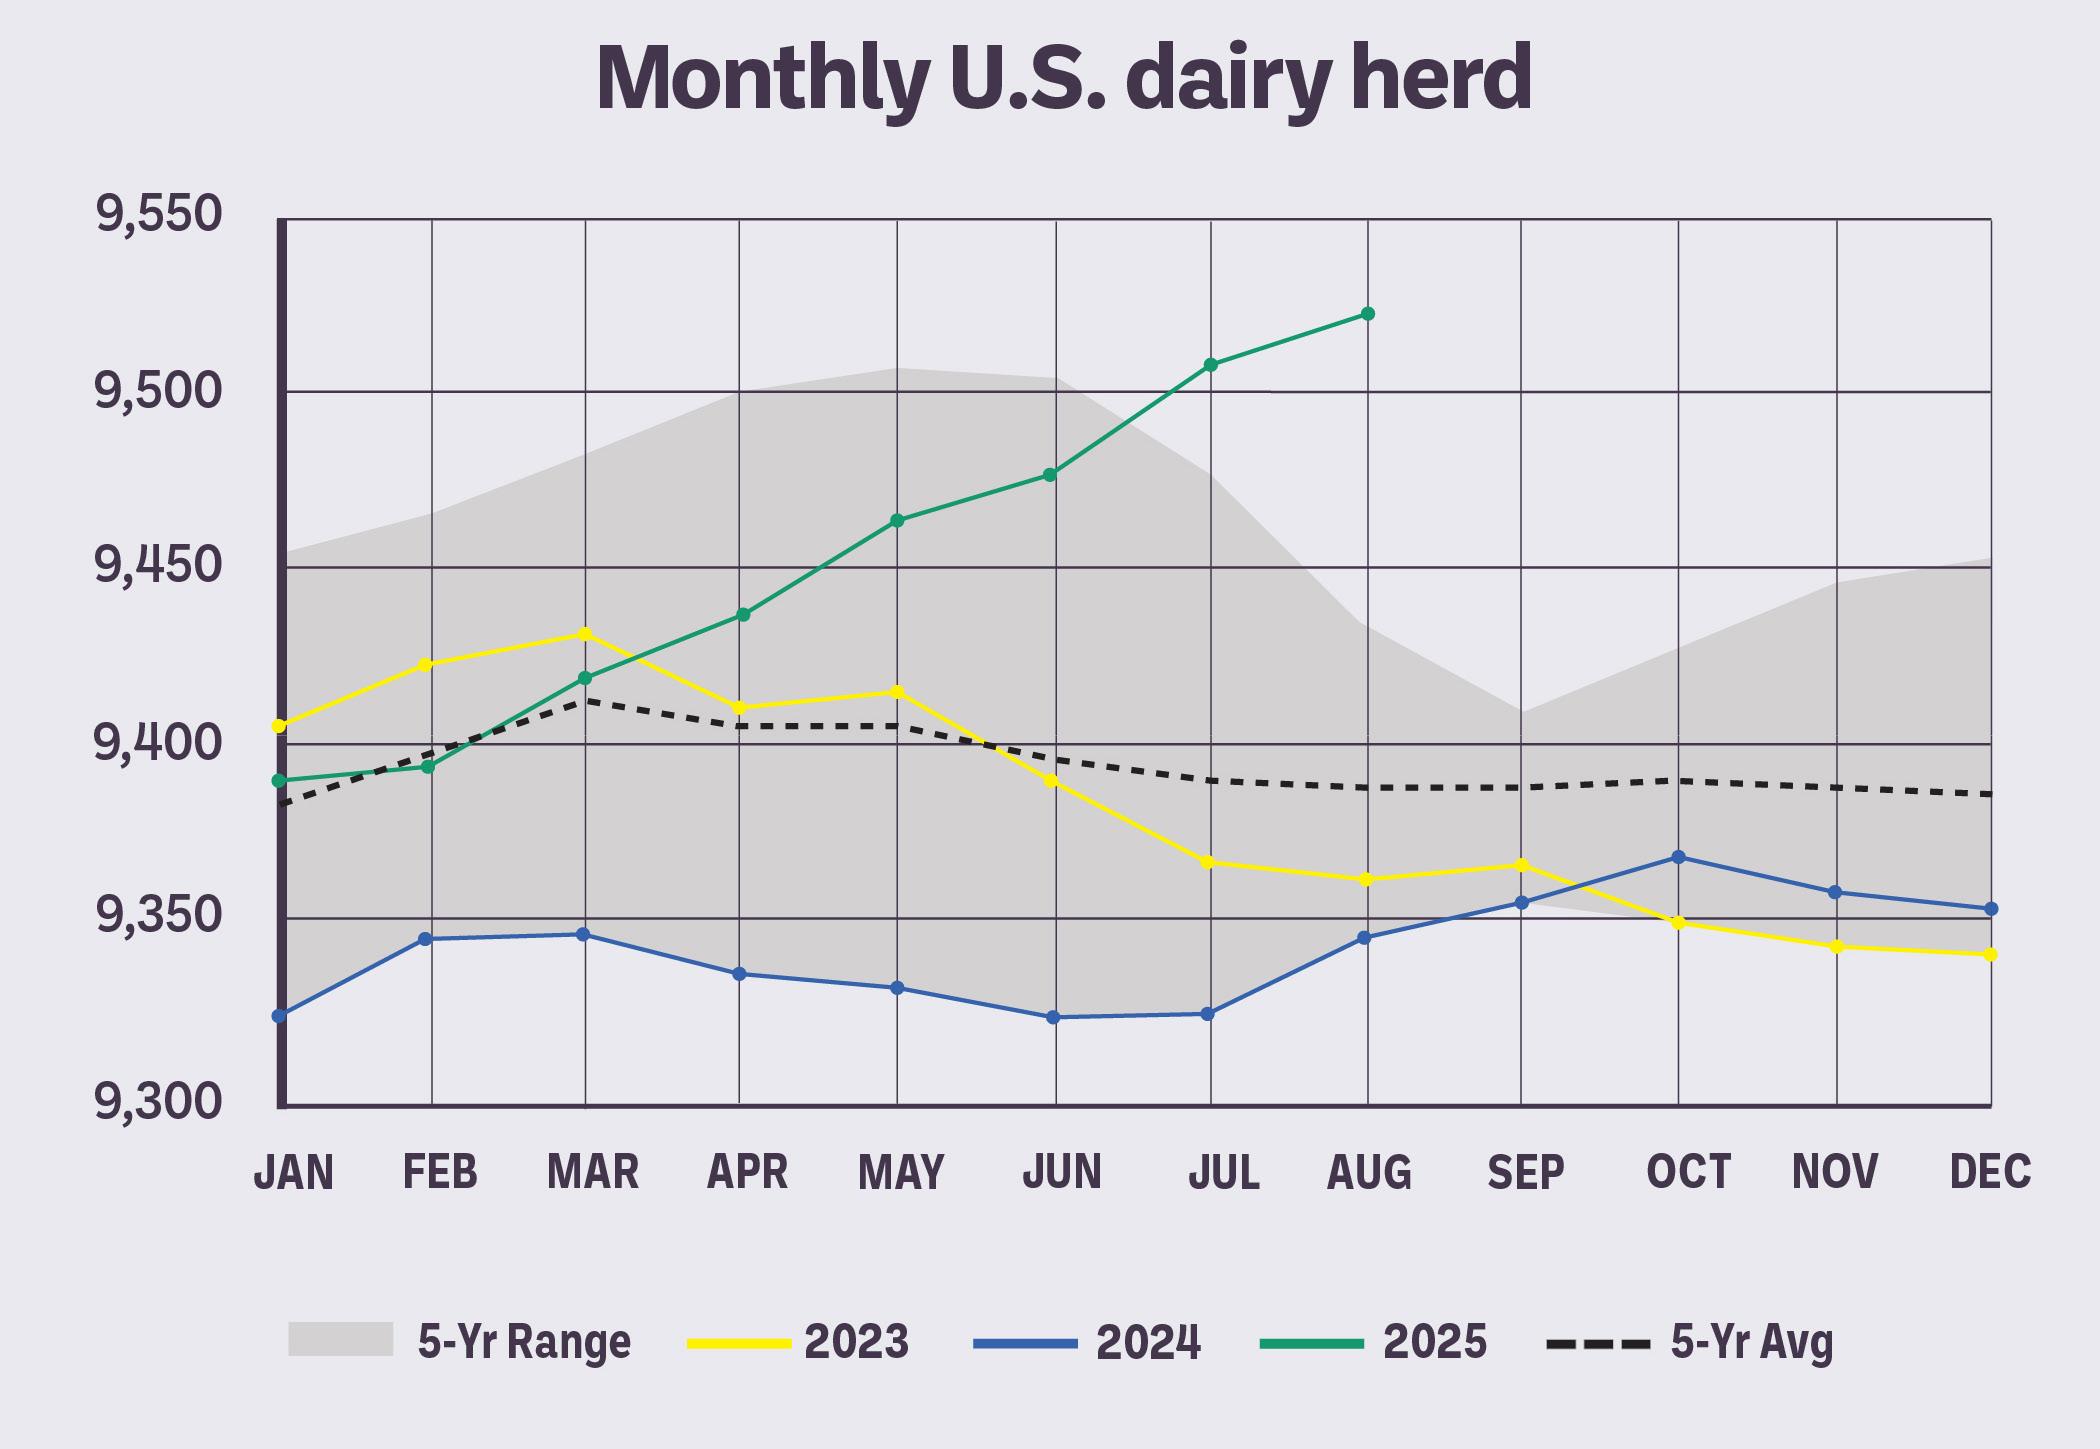
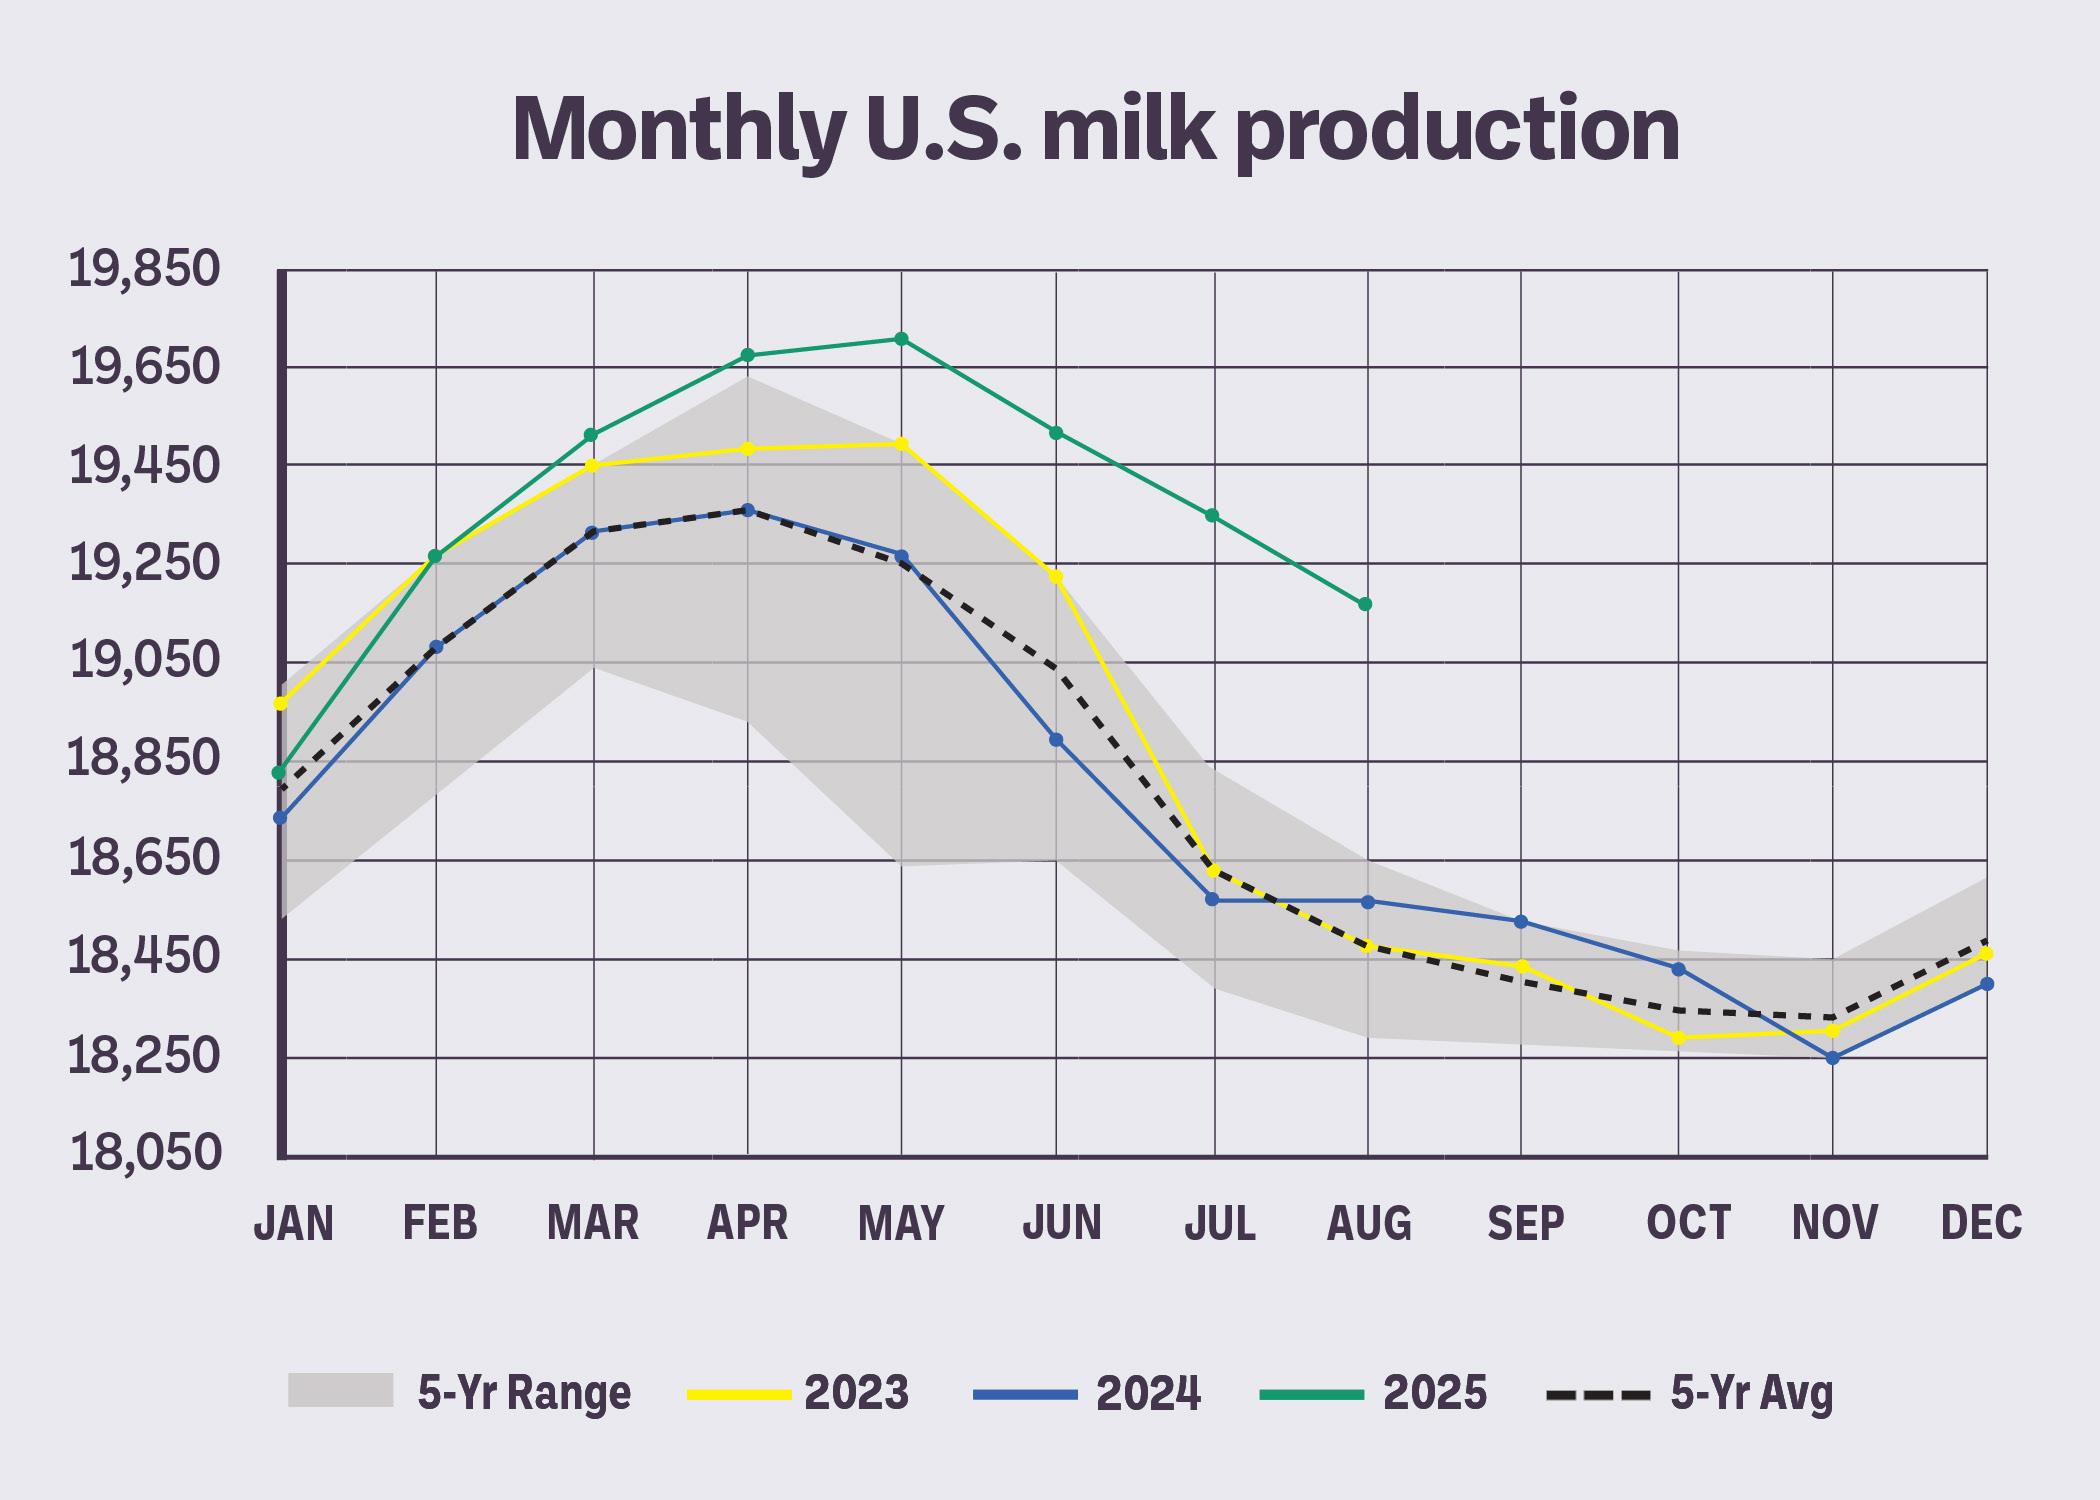
• Exports: Overall dairy exports +8.9% (outpacing 2024 which was a record year); U.S. butterfat moving at record pace. U.S. prices remain competitive vs. EU/Oceania.
• Global supply: EU and Oceania milk output modestly positive; watch for global price convergence that could cool U.S. export pull.
• Outlook into 2026: High milk plus high components keep product output strong. Soft domestic cheese demand is a swing factor, but export competitiveness keeps inventories from growing significantly.
• Risks to watch:
· If global prices fall toward U.S. levels, export pace could moderate.
· If butter exports stay elevated while stocks remain below last year, butter could firm materially into 2026.
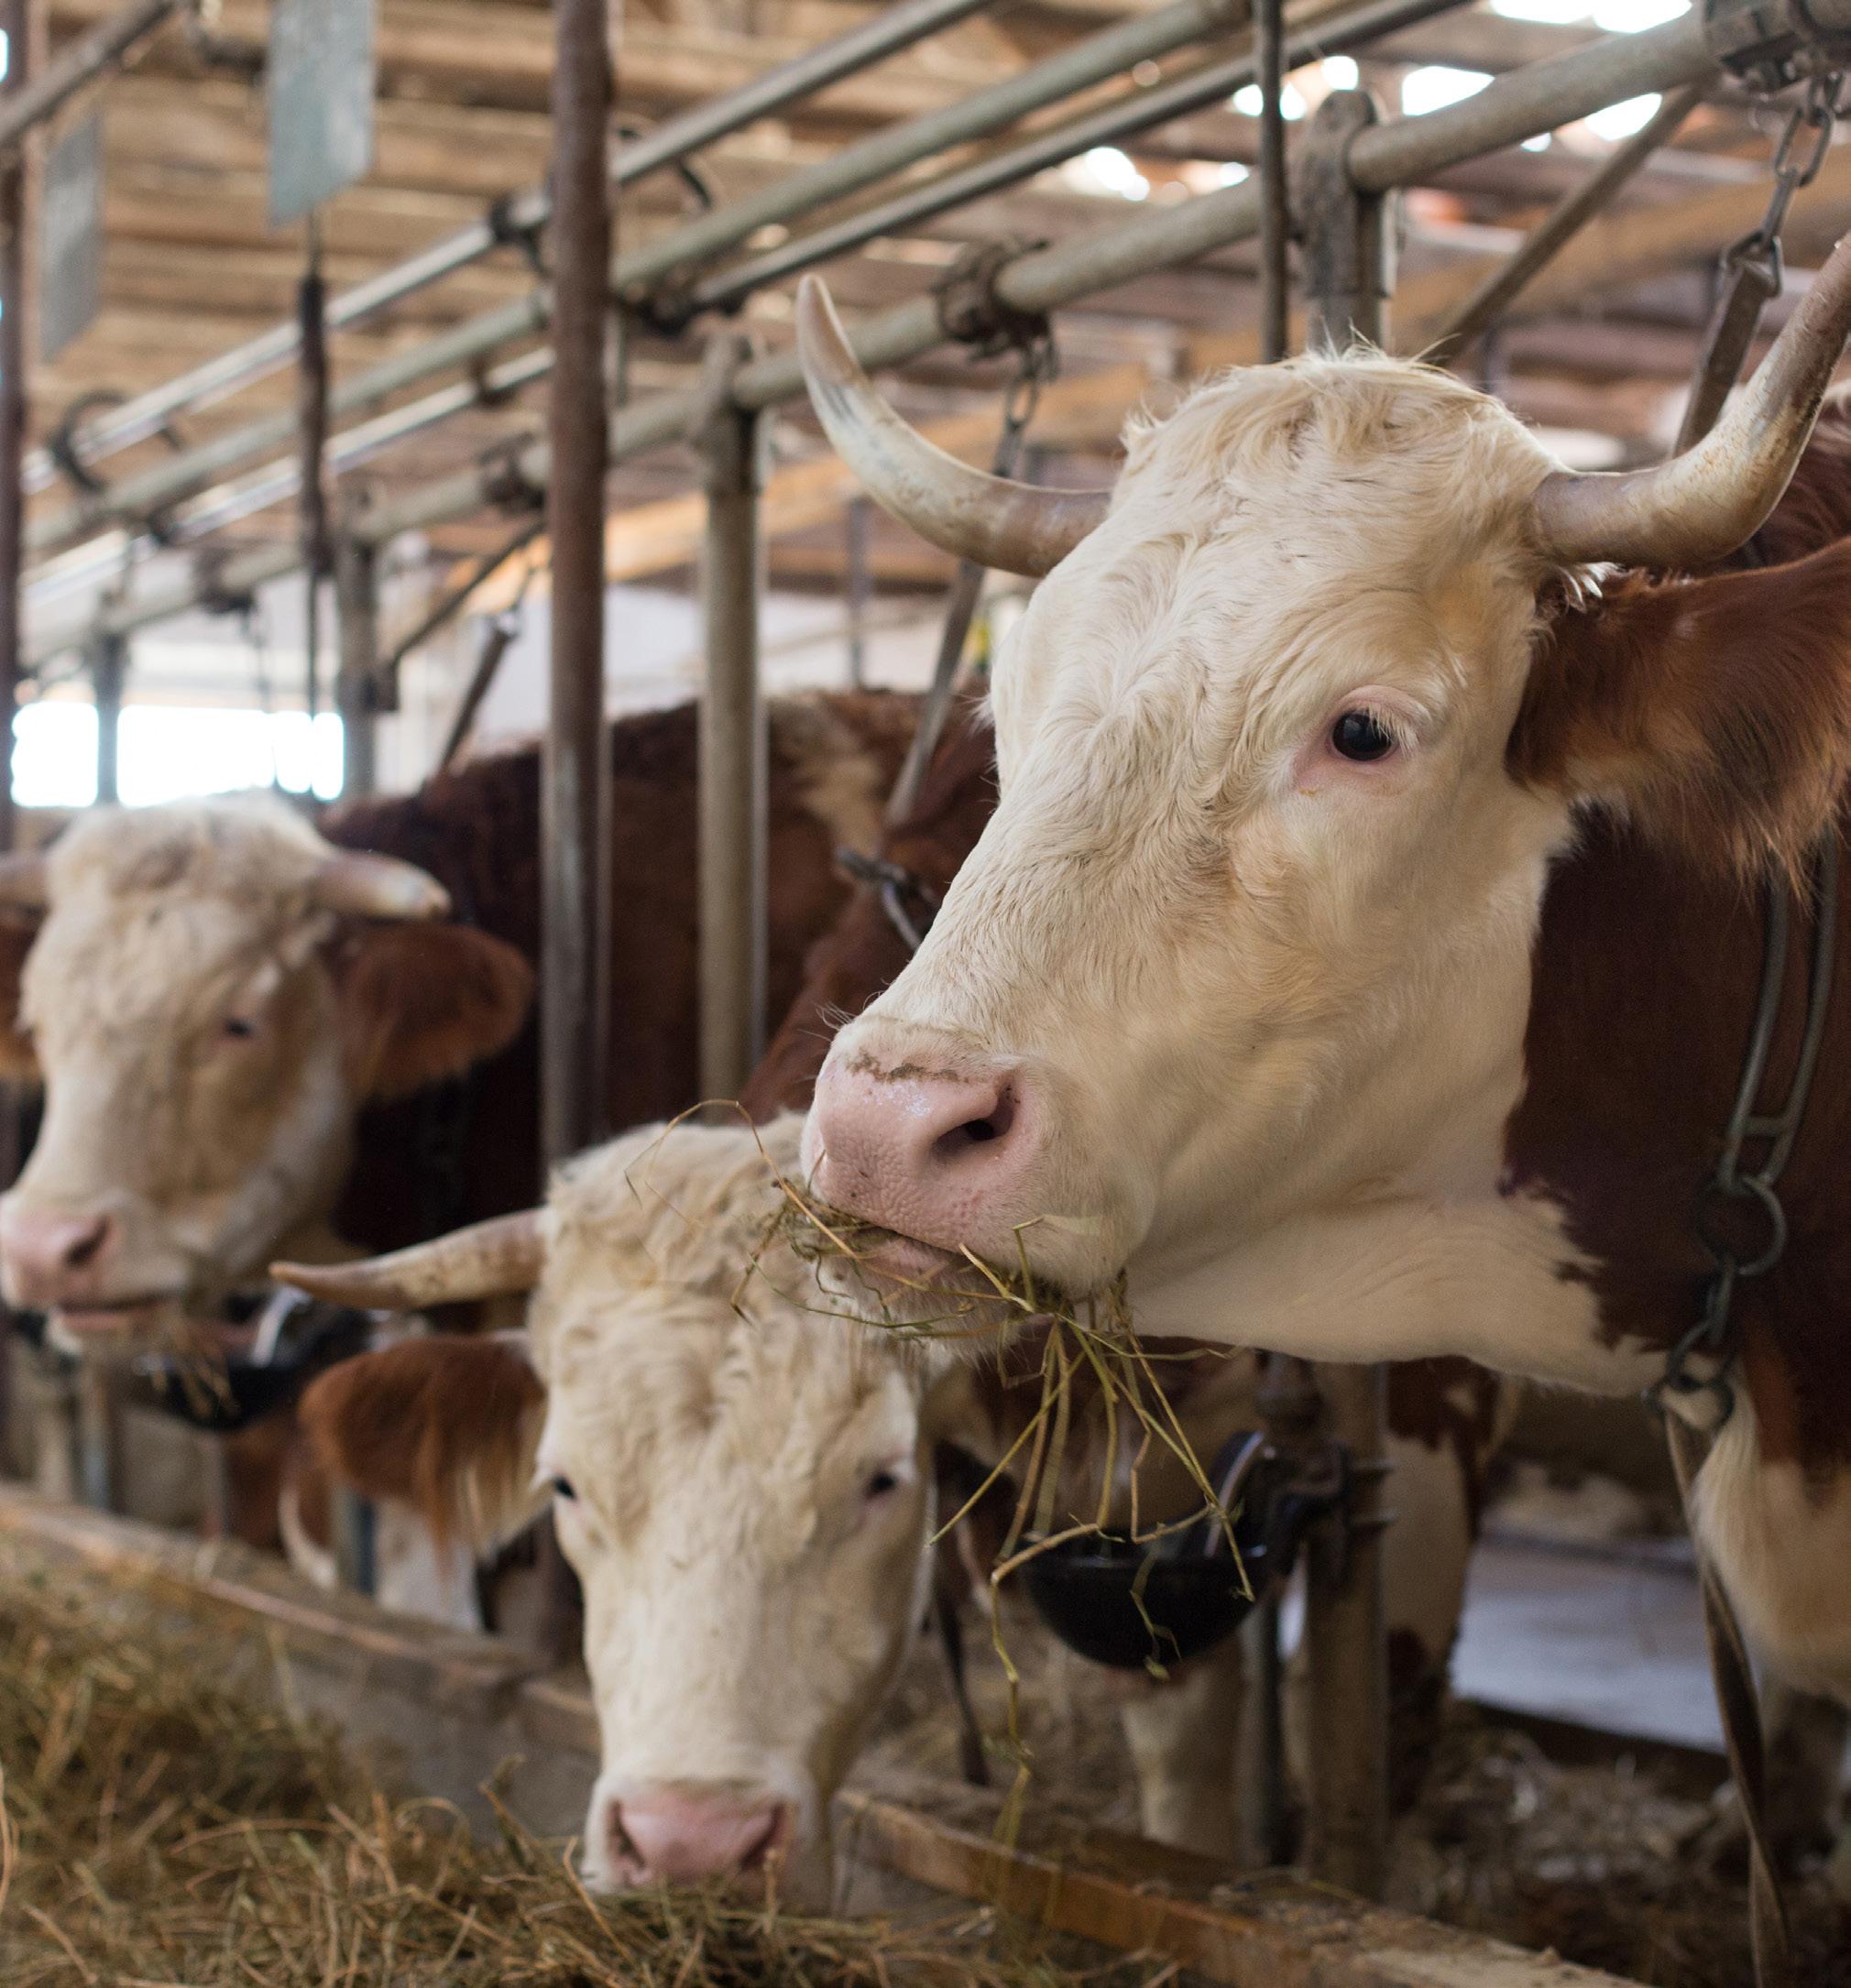

• Production: Robust (≈+6% YTD); ample cream from high butterfat tests off strong milk production.
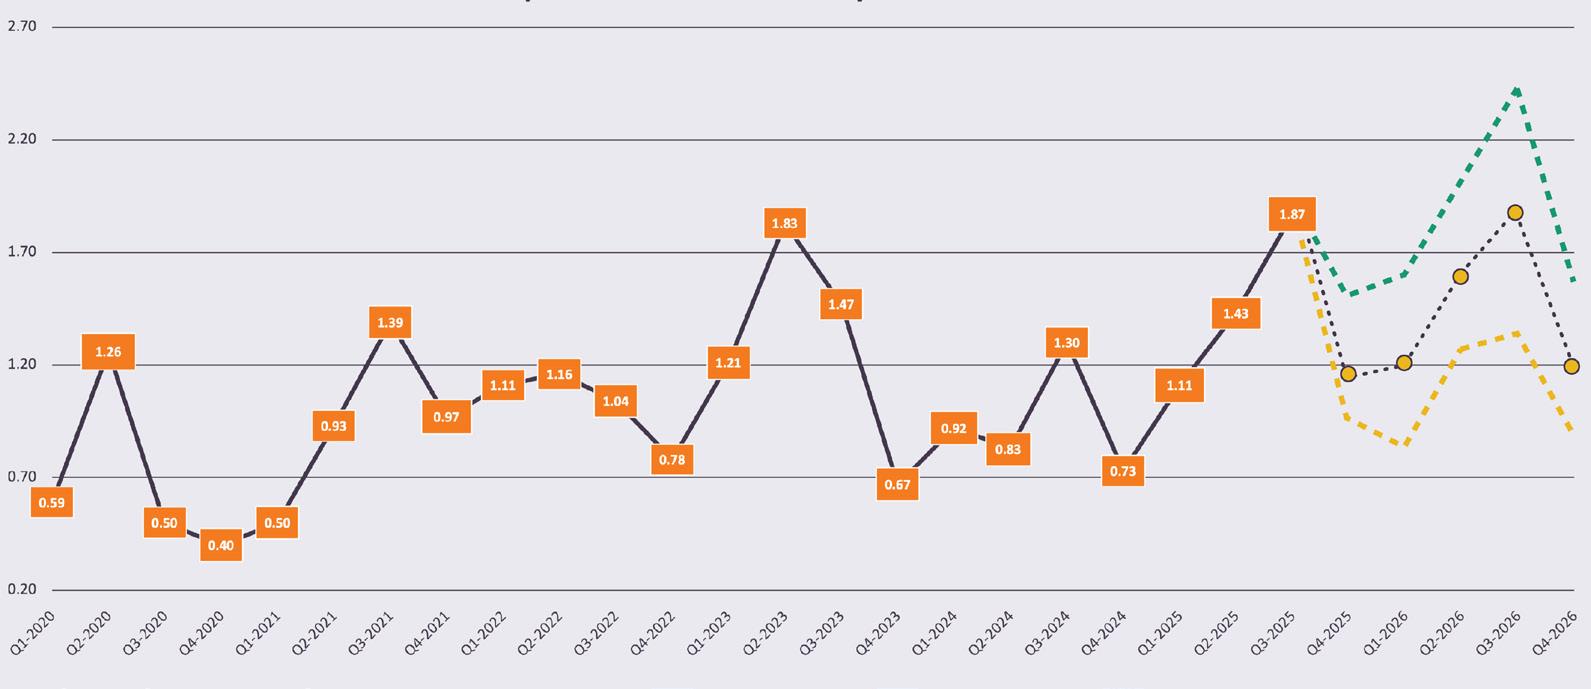
• Trade & price: U.S. butter is a deep discount (~$1.20–$1.25/lb.) compared to other exporters; exports up 125%+ YTD. Spot butter recently at $1.70–$1.75. If exports stay hot while stocks remain below last year, tightness into 2026 becomes a risk.
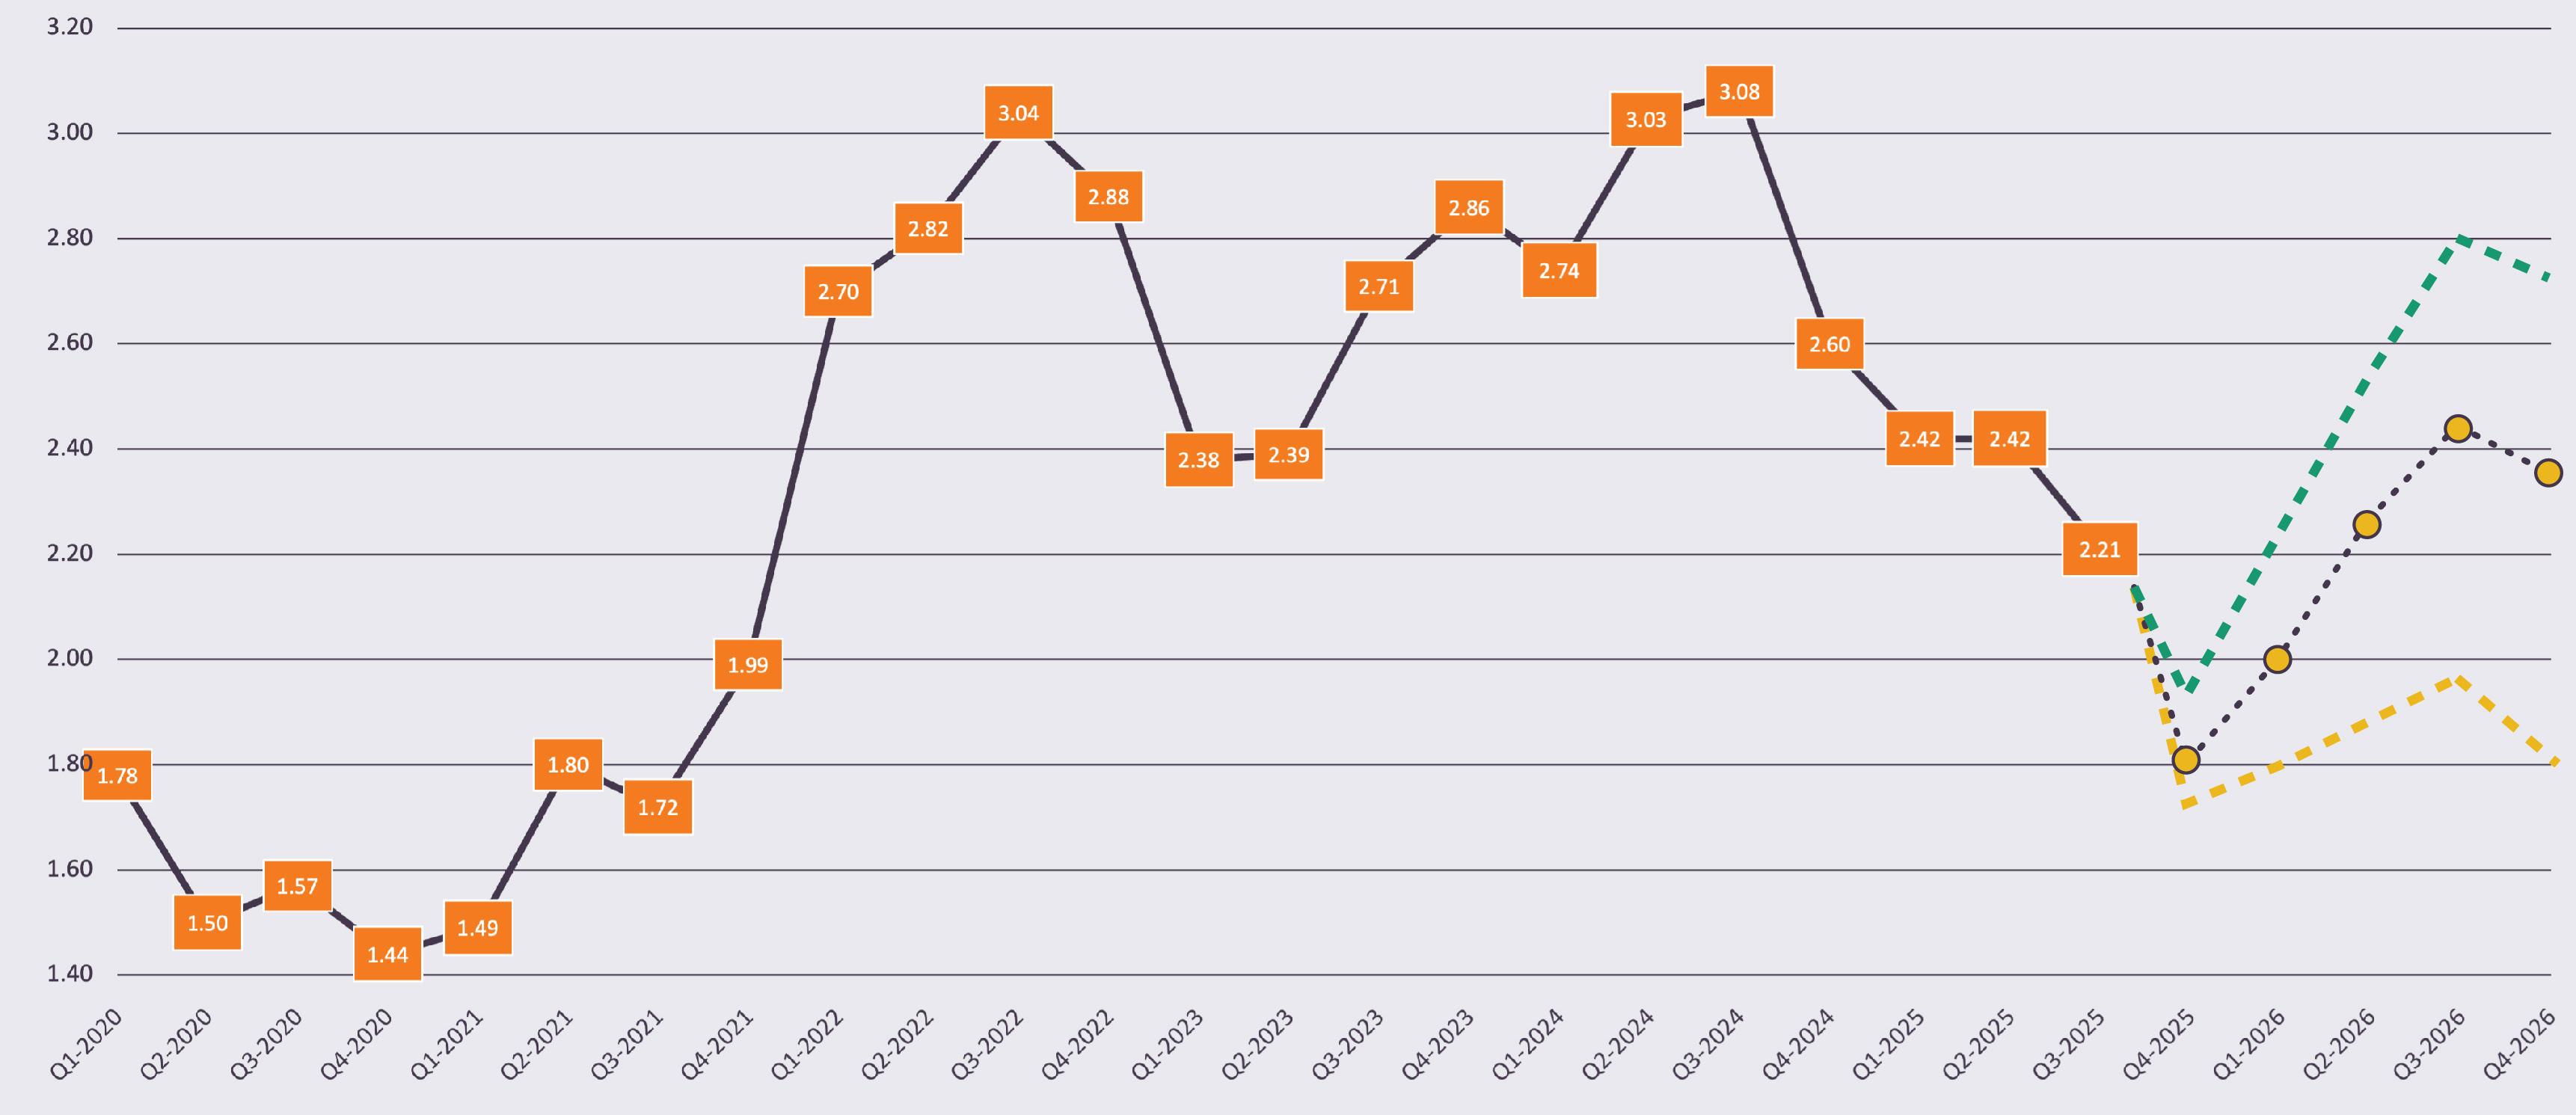
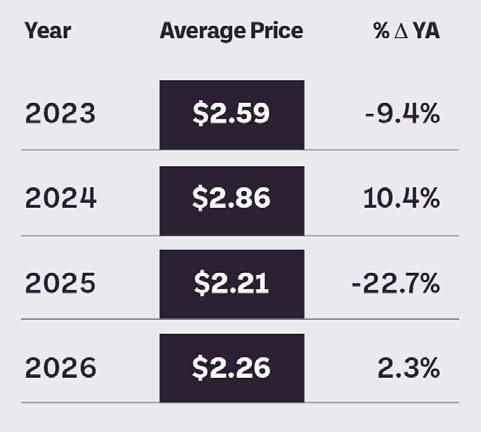
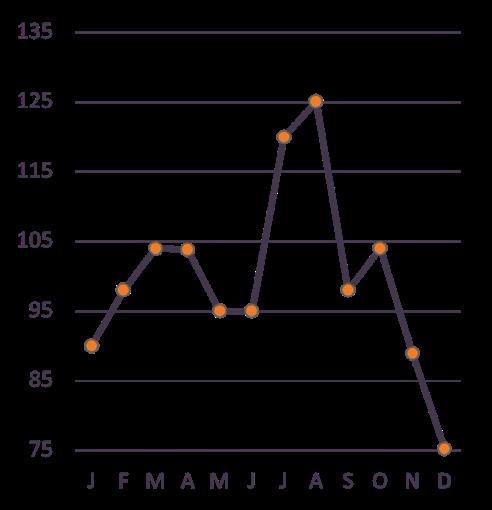

• Production & stocks: Cheese +2.1% YTD (Cheddar +6%+); stocks +1.7% YoY but -0.8% month over month as exports pull product.
• Demand & price: Domestic disappearance -2% YTD (soft), but exports +14% YTD keeping inventories from climbing significantly.
• However, recent spot increases indicate short-term tightness in the market, likely due to export demand and domestic preparation for the holidays.
· This volatility is expected into 2026.
• Pricing for 2026 will need to encourage exports or inventories will build and push pricing lower.
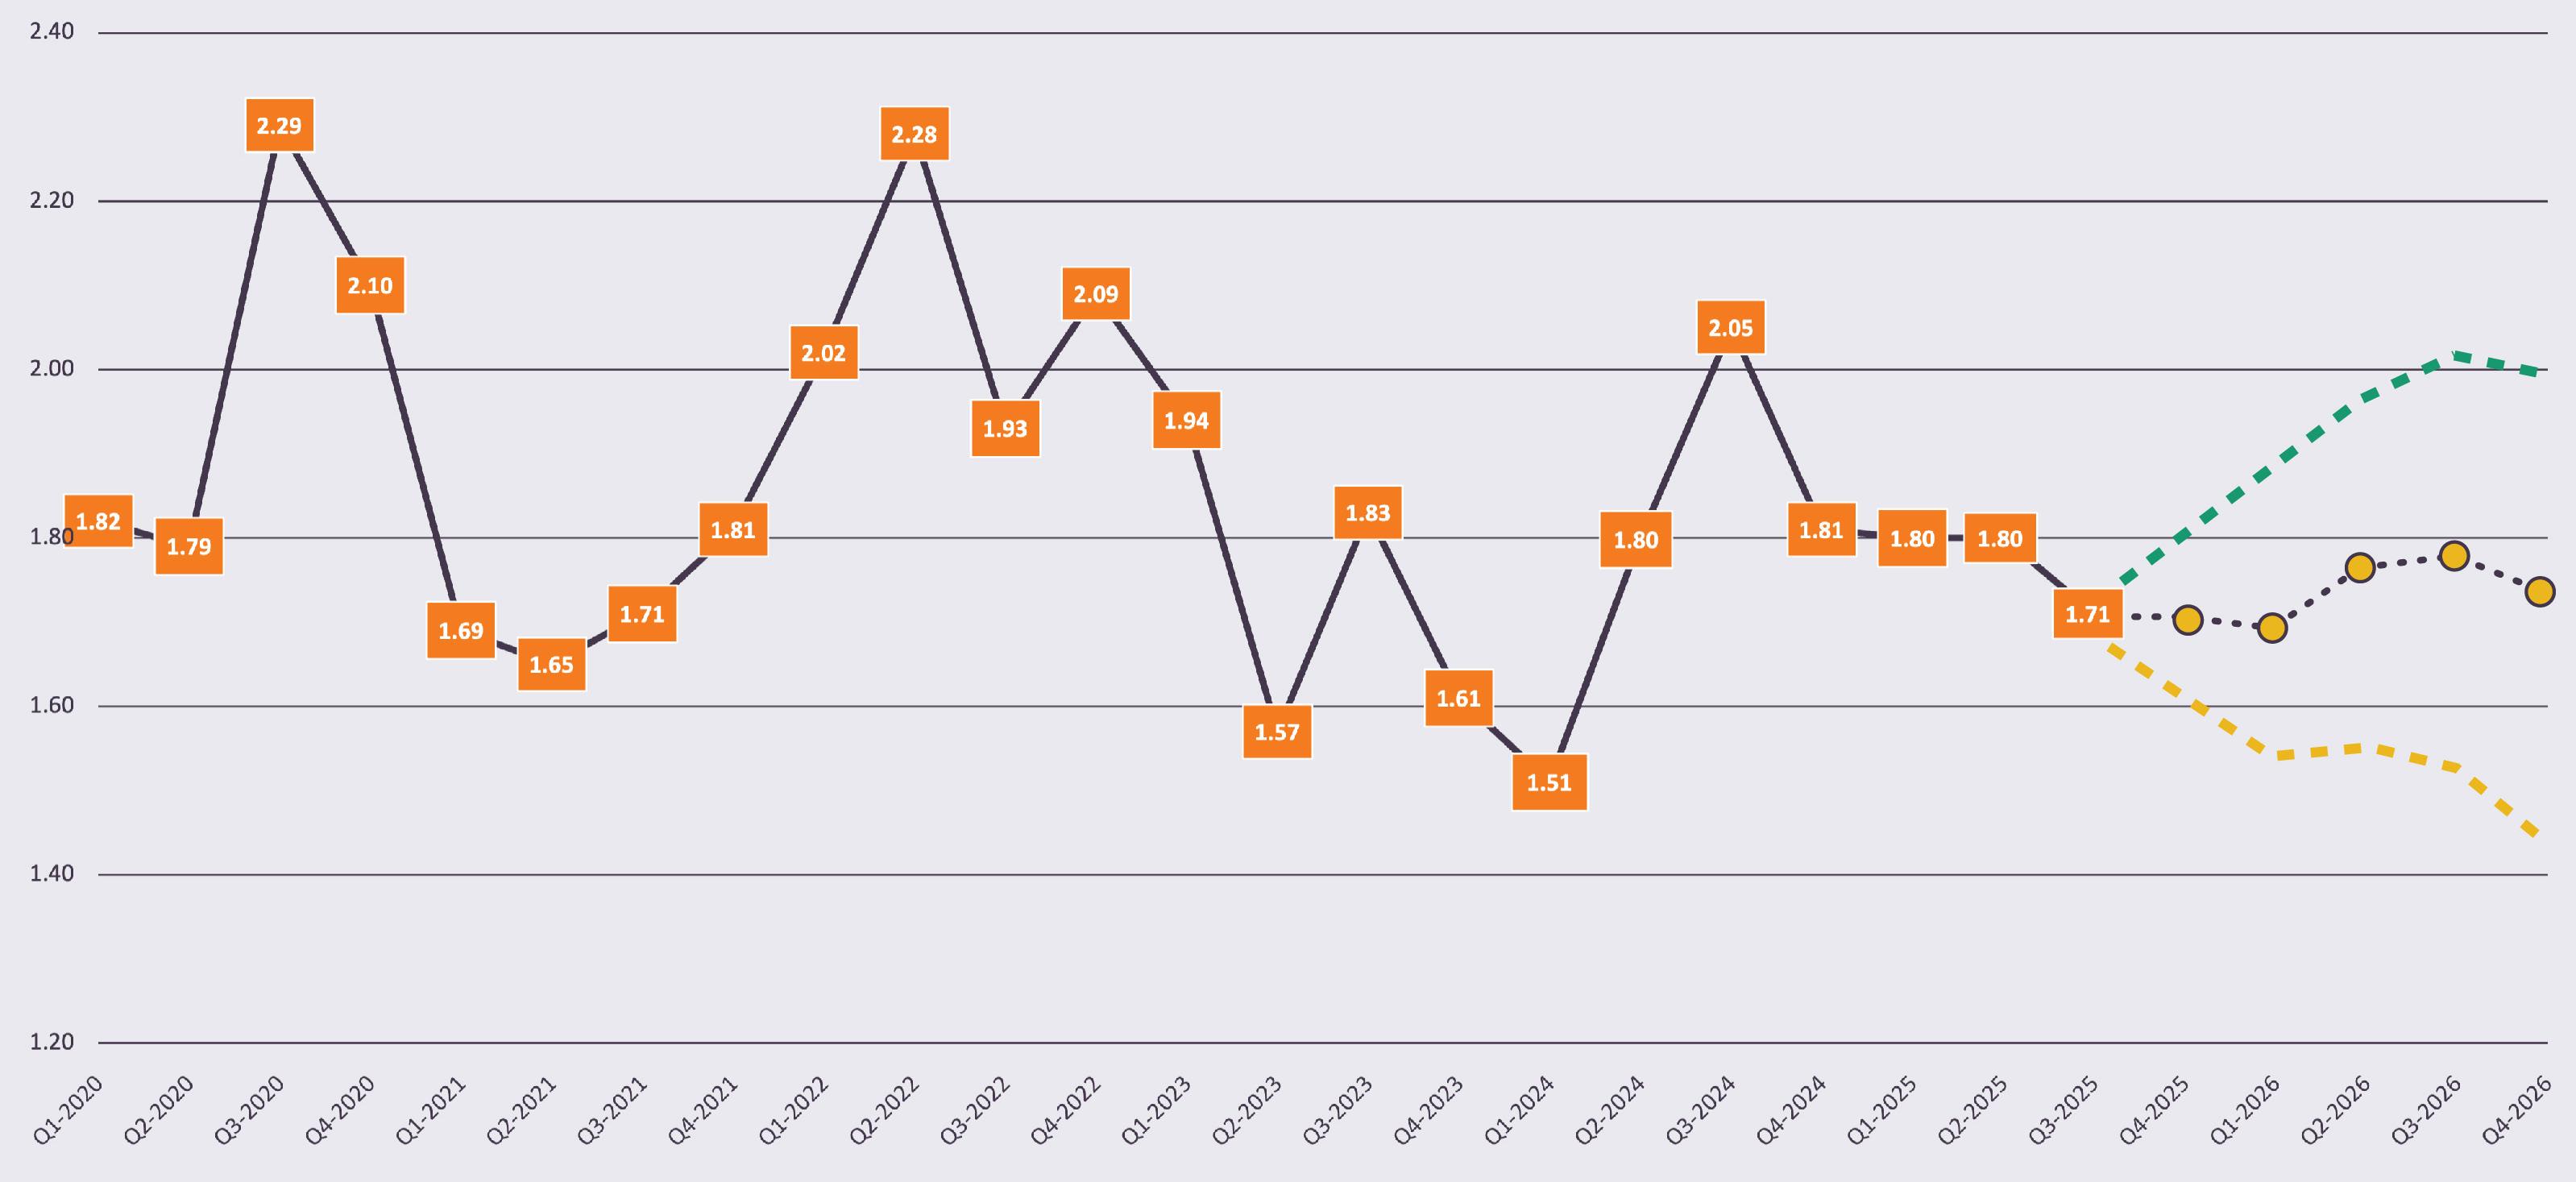
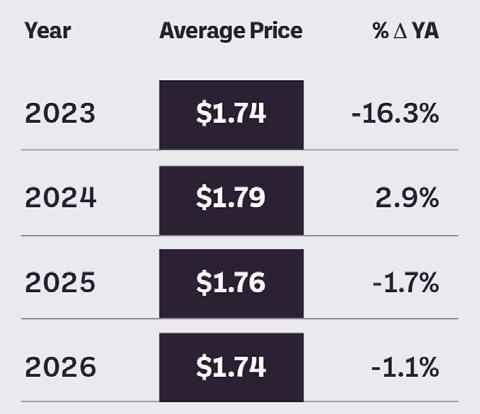
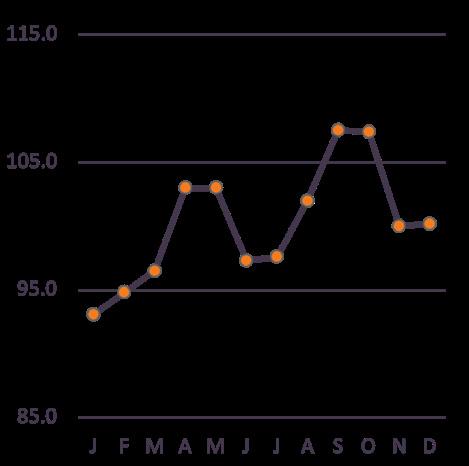

• The U.S. cattle supply is the lowest in decades, with fed slaughter down 5% year over year, cow slaughter down 12%, and Mexican feeder imports down 78% year over year following border closures tied to screwworm.
• Rebuilding and expansion will be slow, with heifer retention limited and regional. Herd lows are expected in 2026; supply tightness likely to persist through 2027.
• Tariffs on Brazilian beef (76.4% effective rate Aug–Dec 2025) are cutting lean beef imports, pushing 90s lean trim prices to record levels.
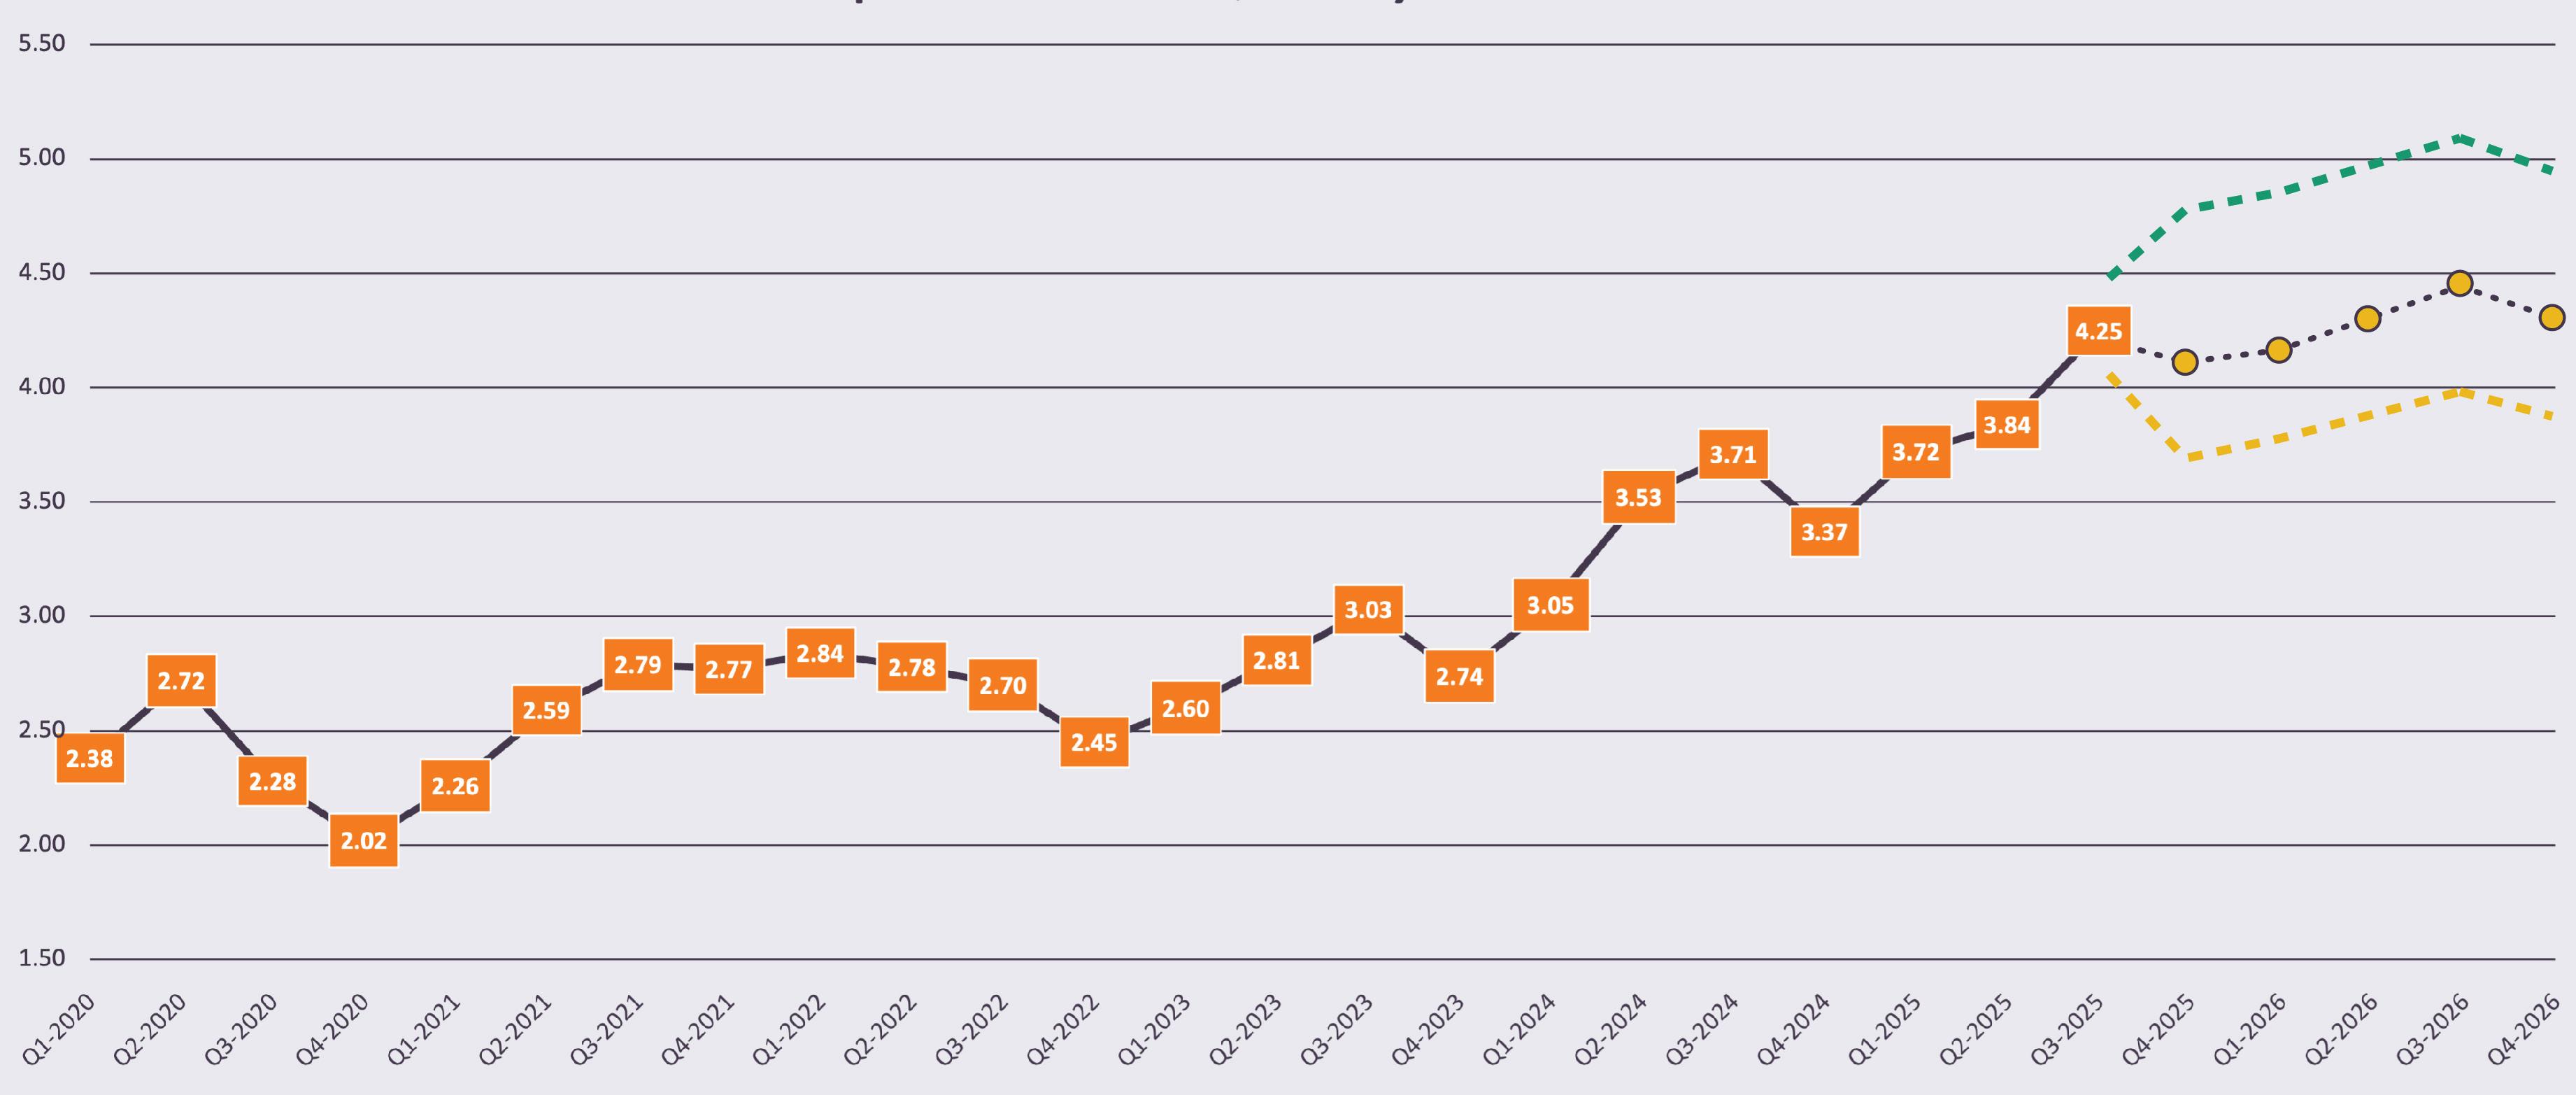
• The number of heifers on feed continues to move lower and is around 37% of all cattle on feed; this is the lowest % since 2020. The heifer % has averaged over 39% for the past 16 quarters. This does not indicate expansion, but it’s moving in the right direction.
• With the southern border closed to cattle imports there is concern for fed beef production moving forward — we will continue to see lower placements and lower COF numbers.
• Alternatively, packers are slowing slaughter rates as packer margins were very low and that is also impacting fed slaughter numbers.
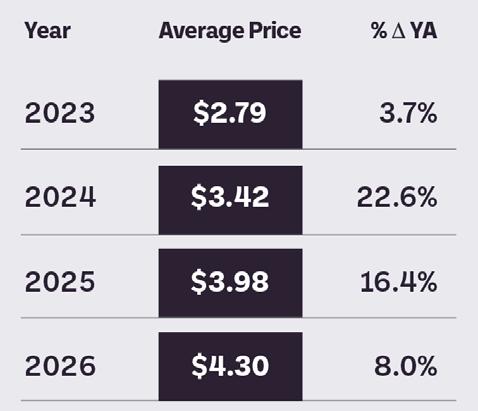
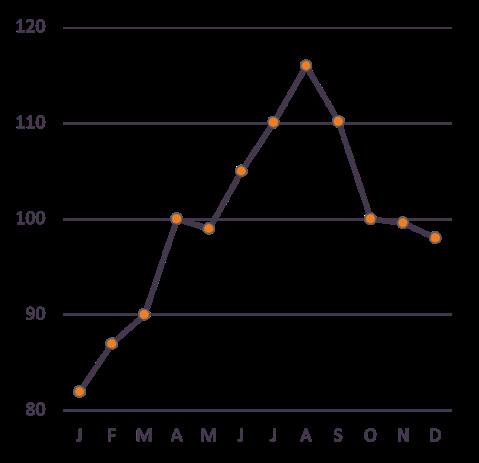
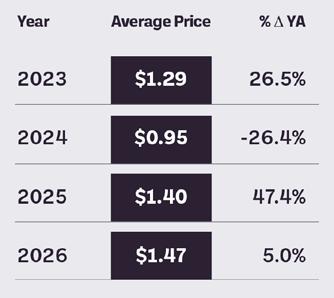
• Outlook into 2026: Despite record prices (retail ground beef +25.6% since Jan 2024), beef demand has remained resilient, as the consumer has come to expect high quality beef. Seasonal price declines have been muted.
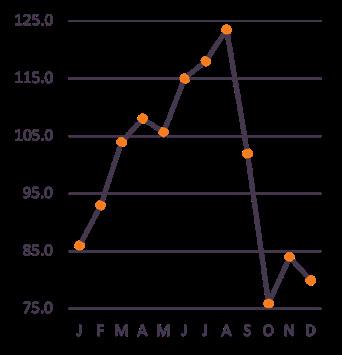
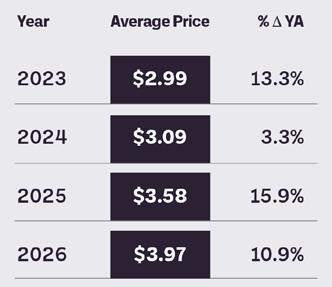
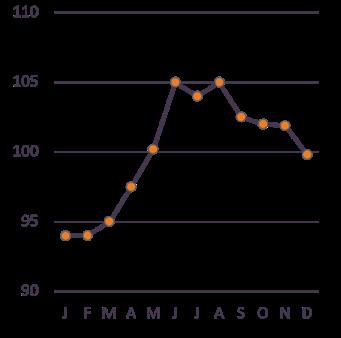
• Production is down 2.2% YTD, with disease impacts and lower weights constraining supplies. The September pig crop was down 2.6% year over year, indicating harvest will remain below last year levels through at least Q1 2026.
• The U.S. breeding herd is not expanding and appears to be contracting. June 2025 estimates were revised from +0.5% to down about 1%, and the September breeding herd was down 1.8%, the lowest since 2015. Although margins are positive and feed costs lower, producers have not moved to expand. Caution around economic conditions appears to be outweighing incentives to retain more sows.
· PRRS and PEDv viruses have also been impactful the last 9–12 months and is likely a cause for lower harvest numbers.
• Productivity: Litter rates remain a bright spot, hitting a record 11.82 pigs per litter, up 0.85% vs. last year, allowing the industry to maintain production with a smaller breeding base once expansion begins.
• Pig Crop & Inventory: Total Hogs and Pigs were down 1.3% as of September 1, 2025.
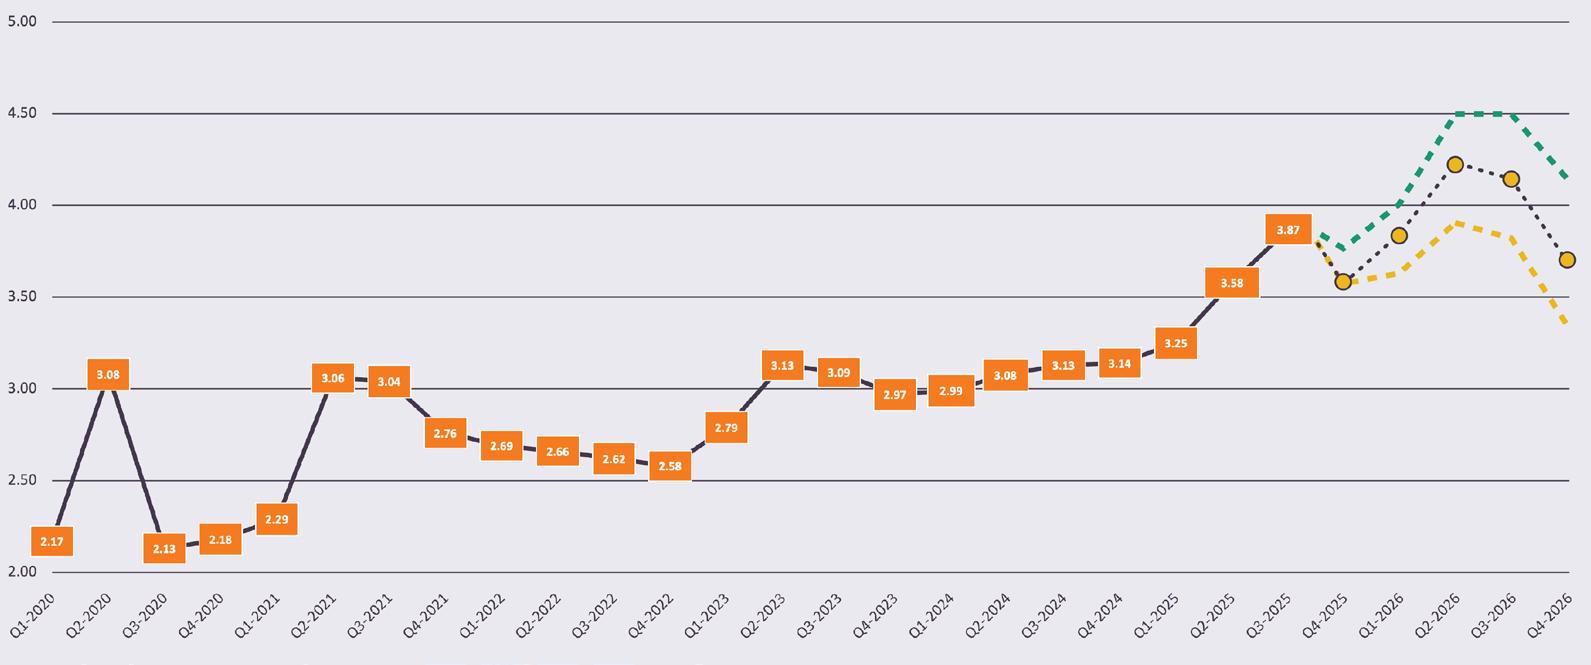
· Sep–Nov 2025 harvest slightly below last year, depending on weights.
· Dec–Feb 2026 harvest materially below last year.
· Lean hog futures rallied on the report, reflecting market expectations for tighter supplies into early 2026.
· Cash hog prices, while moving lower seasonally, are 35% higher than the 5-year average which indicates that supplies remain tight.
• Farrowing: Lower breeding herd numbers weighed on summer farrowings, and Oct–Dec farrowing intentions are only up 0.2%. Even with higher pigs saved per litter, production will stay below last year’s levels.
• Overall, while improved productivity provides some offset, the contraction in the breeding herd and downward pig crop revisions signal a tighter pork supply environment ahead, adding further support to prices heading into late 2025 and early 2026.
• Outlook into 2026: The September Hogs and Pigs report is bullish. Production expectations into 2026 will need to be tempered, as there are no signs of expansion — in fact, the data points to further contraction. Building cold storage stocks will be challenged with lower expected production.
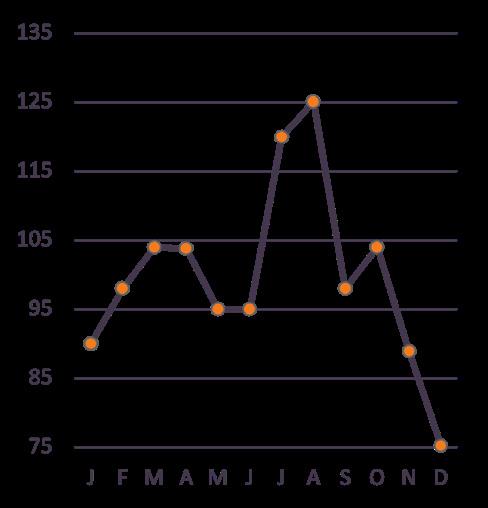
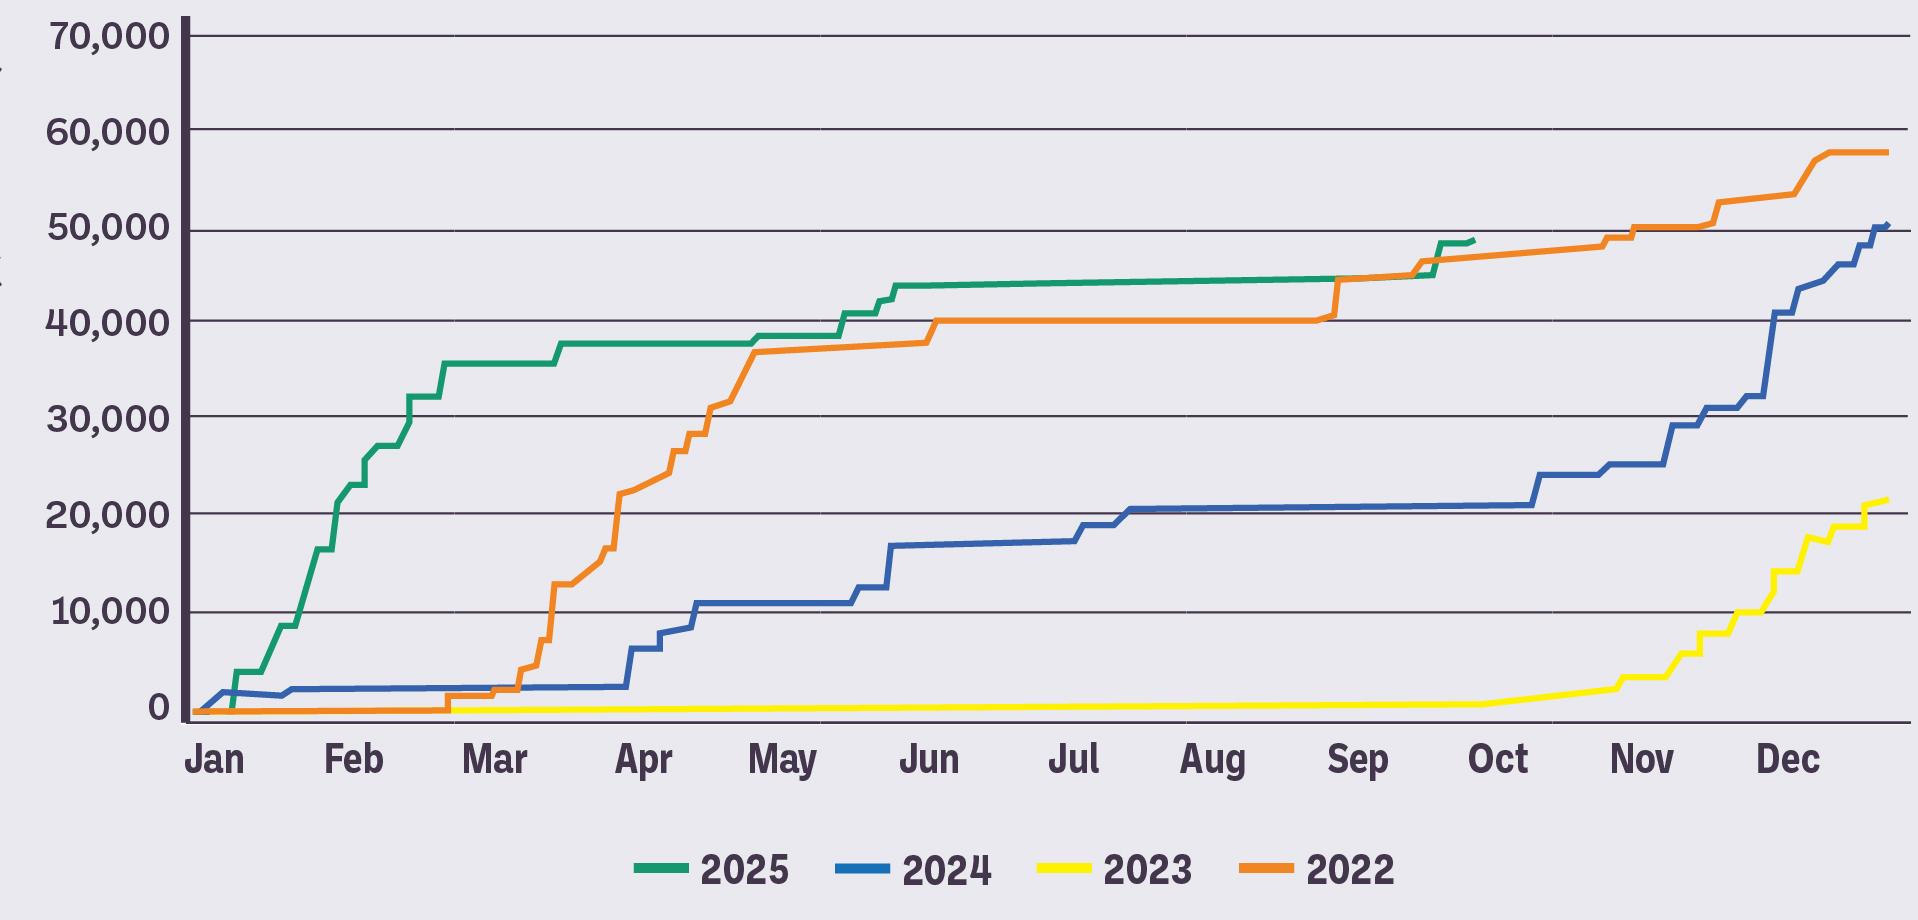
Since the start of this outbreak in Feb 2022, ~175 million commercial birds have been culled due to HPAI. The greater risks are during spring and fall, but there still does not seem to be a very consistent path of infection over the last several years. Egg layers have been hit particularly hard with more than 141.9 million lost since February 2022.
According to the USDA, current efforts to control HPAI are focused on surveillance, flock culling, and biosecurity measures on and around farms.
• Visitor Control: Limiting farm visitors and ensuring they follow strict biosecurity protocols, such as using disposable shoe covers and disinfecting footwear before entering the farm.
• Sanitation: Regularly cleaning and disinfecting equipment, vehicles, and footwear. Using footbaths with disinfectant solutions (e.g., bleach) to clean boots before entering poultry houses.
• Isolation: Keeping poultry away from other animals and wildlife to prevent cross-species transmission. Using fencing and netting to deter wild birds and animals from entering poultry areas.
• Water Management: Avoiding the use of untreated surface water for poultry. Removing standing water and managing ponds to prevent them from becoming breeding grounds for wild birds.
• Health Monitoring: Regularly checking birds for signs of illness, such as coughing, sneezing, or difficulty breathing. Isolating sick birds and reporting any suspected cases to veterinarians or authorities.
• Feed Management: Keeping feed storage areas clean and covered to prevent contamination by wild birds. Inspecting feed for any signs of contamination.
• Education and Training: Providing training for farm workers on biosecurity practices and the importance of maintaining a clean and controlled environment.
Cumulative cull current 2022-2025 outbreak
• Health & supply: No commercial broiler HPAI cases since March 2025; infections have re-emerged in turkeys and layer flocks, but broiler complex remains unaffected.
• Hatchery/placements: Egg sets +1.1% YTD; placements +1.0%.
• Hatchability/livability showing near-term improvement.
• Supply flock (breeder hens) lower, but hens are more productive.
• Weights: Record heavier birds keep lbs. flowing; jumbo production +6.3% YTD; large-bird emphasis supports more breast meat.
• Production outlook: 2025 +1.8%, 2026 +1.5% (margins + heavier weights).
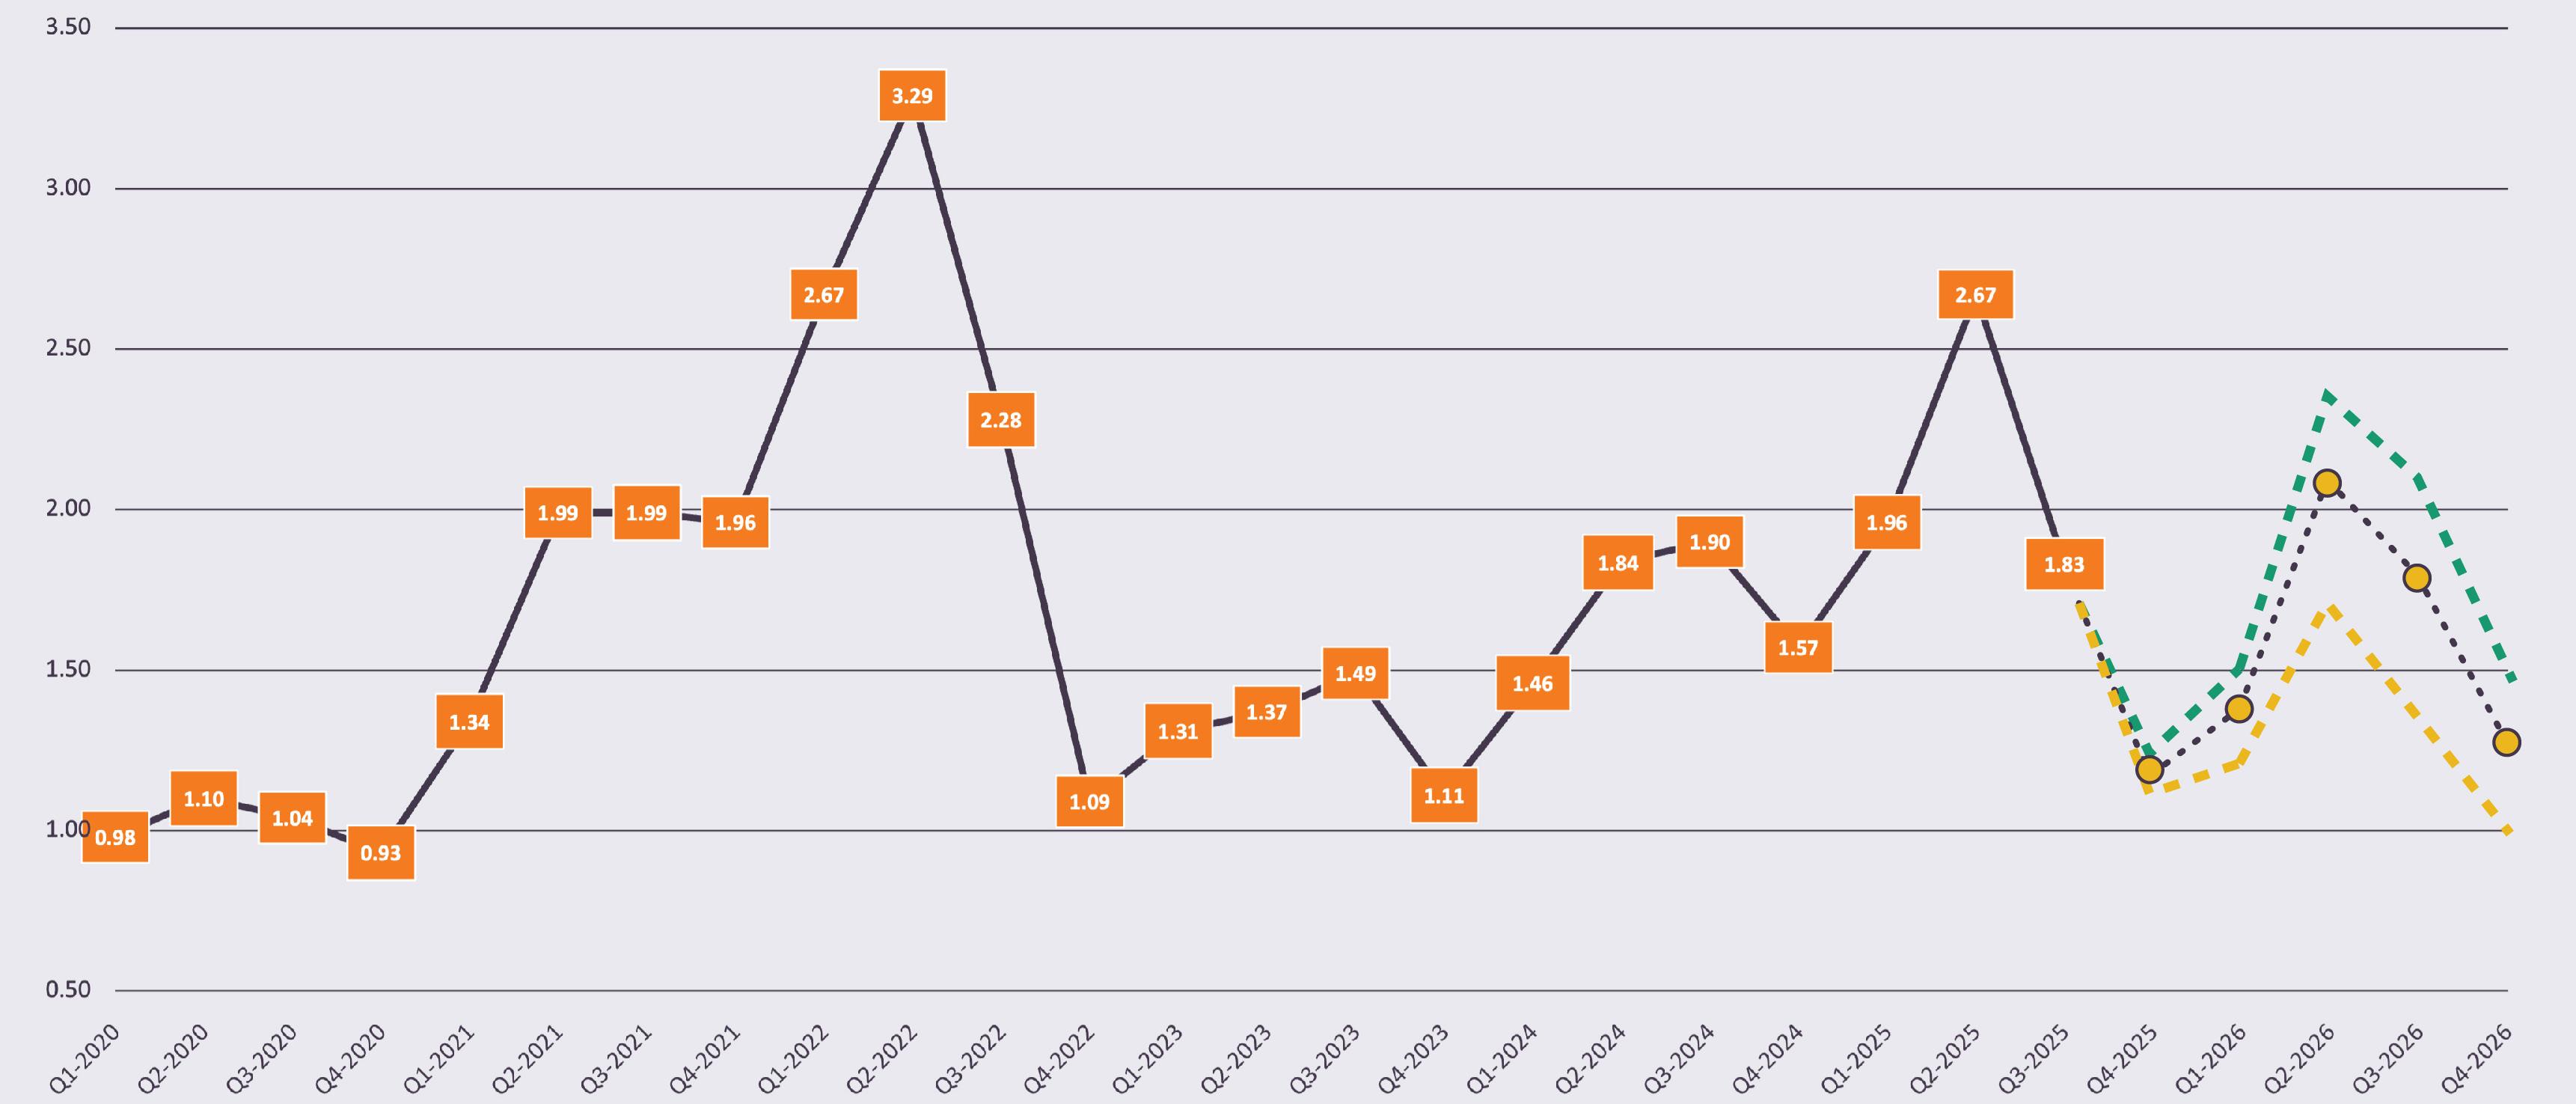
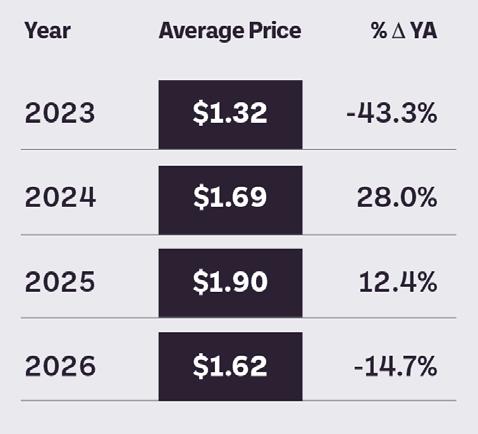
• Outlook into 2026: Expecting prices for 2026 to temper slightly on higher production, however, risks to that are productivity, disease, and demand shifts.
• Disease & Biosecurity
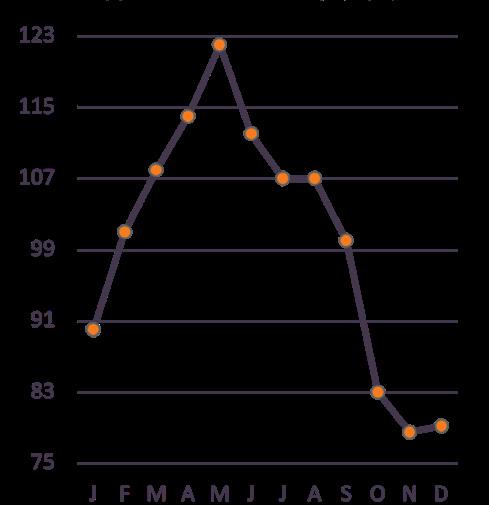
· HPAI has re-accelerated in commercial turkeys after a quiet late spring/summer. 23 flocks in ~35 days (~875k birds) with ~2.6M head lost YTD, reinforcing that HPAI remains the key risk into winter; vaccines are being tested but no timeline.
· Fall migration typically increases the risk.
• Supply Flock, Hatchery & Production
· Supply flock is declining with several hatcheries/ processing closures over the past several years; near-term turkey production is down in 2025, and the decline extends into early 2026 before any possible rebound.
· Margins have improved sharply on higher farm prices and cheaper feed; returns over feed costs hit the highest since early 2023, which could begin to slow contraction if disease pressure allows.
• Cold storage remains light relative to history given constrained production; all consistent with a tight but shifting mix.
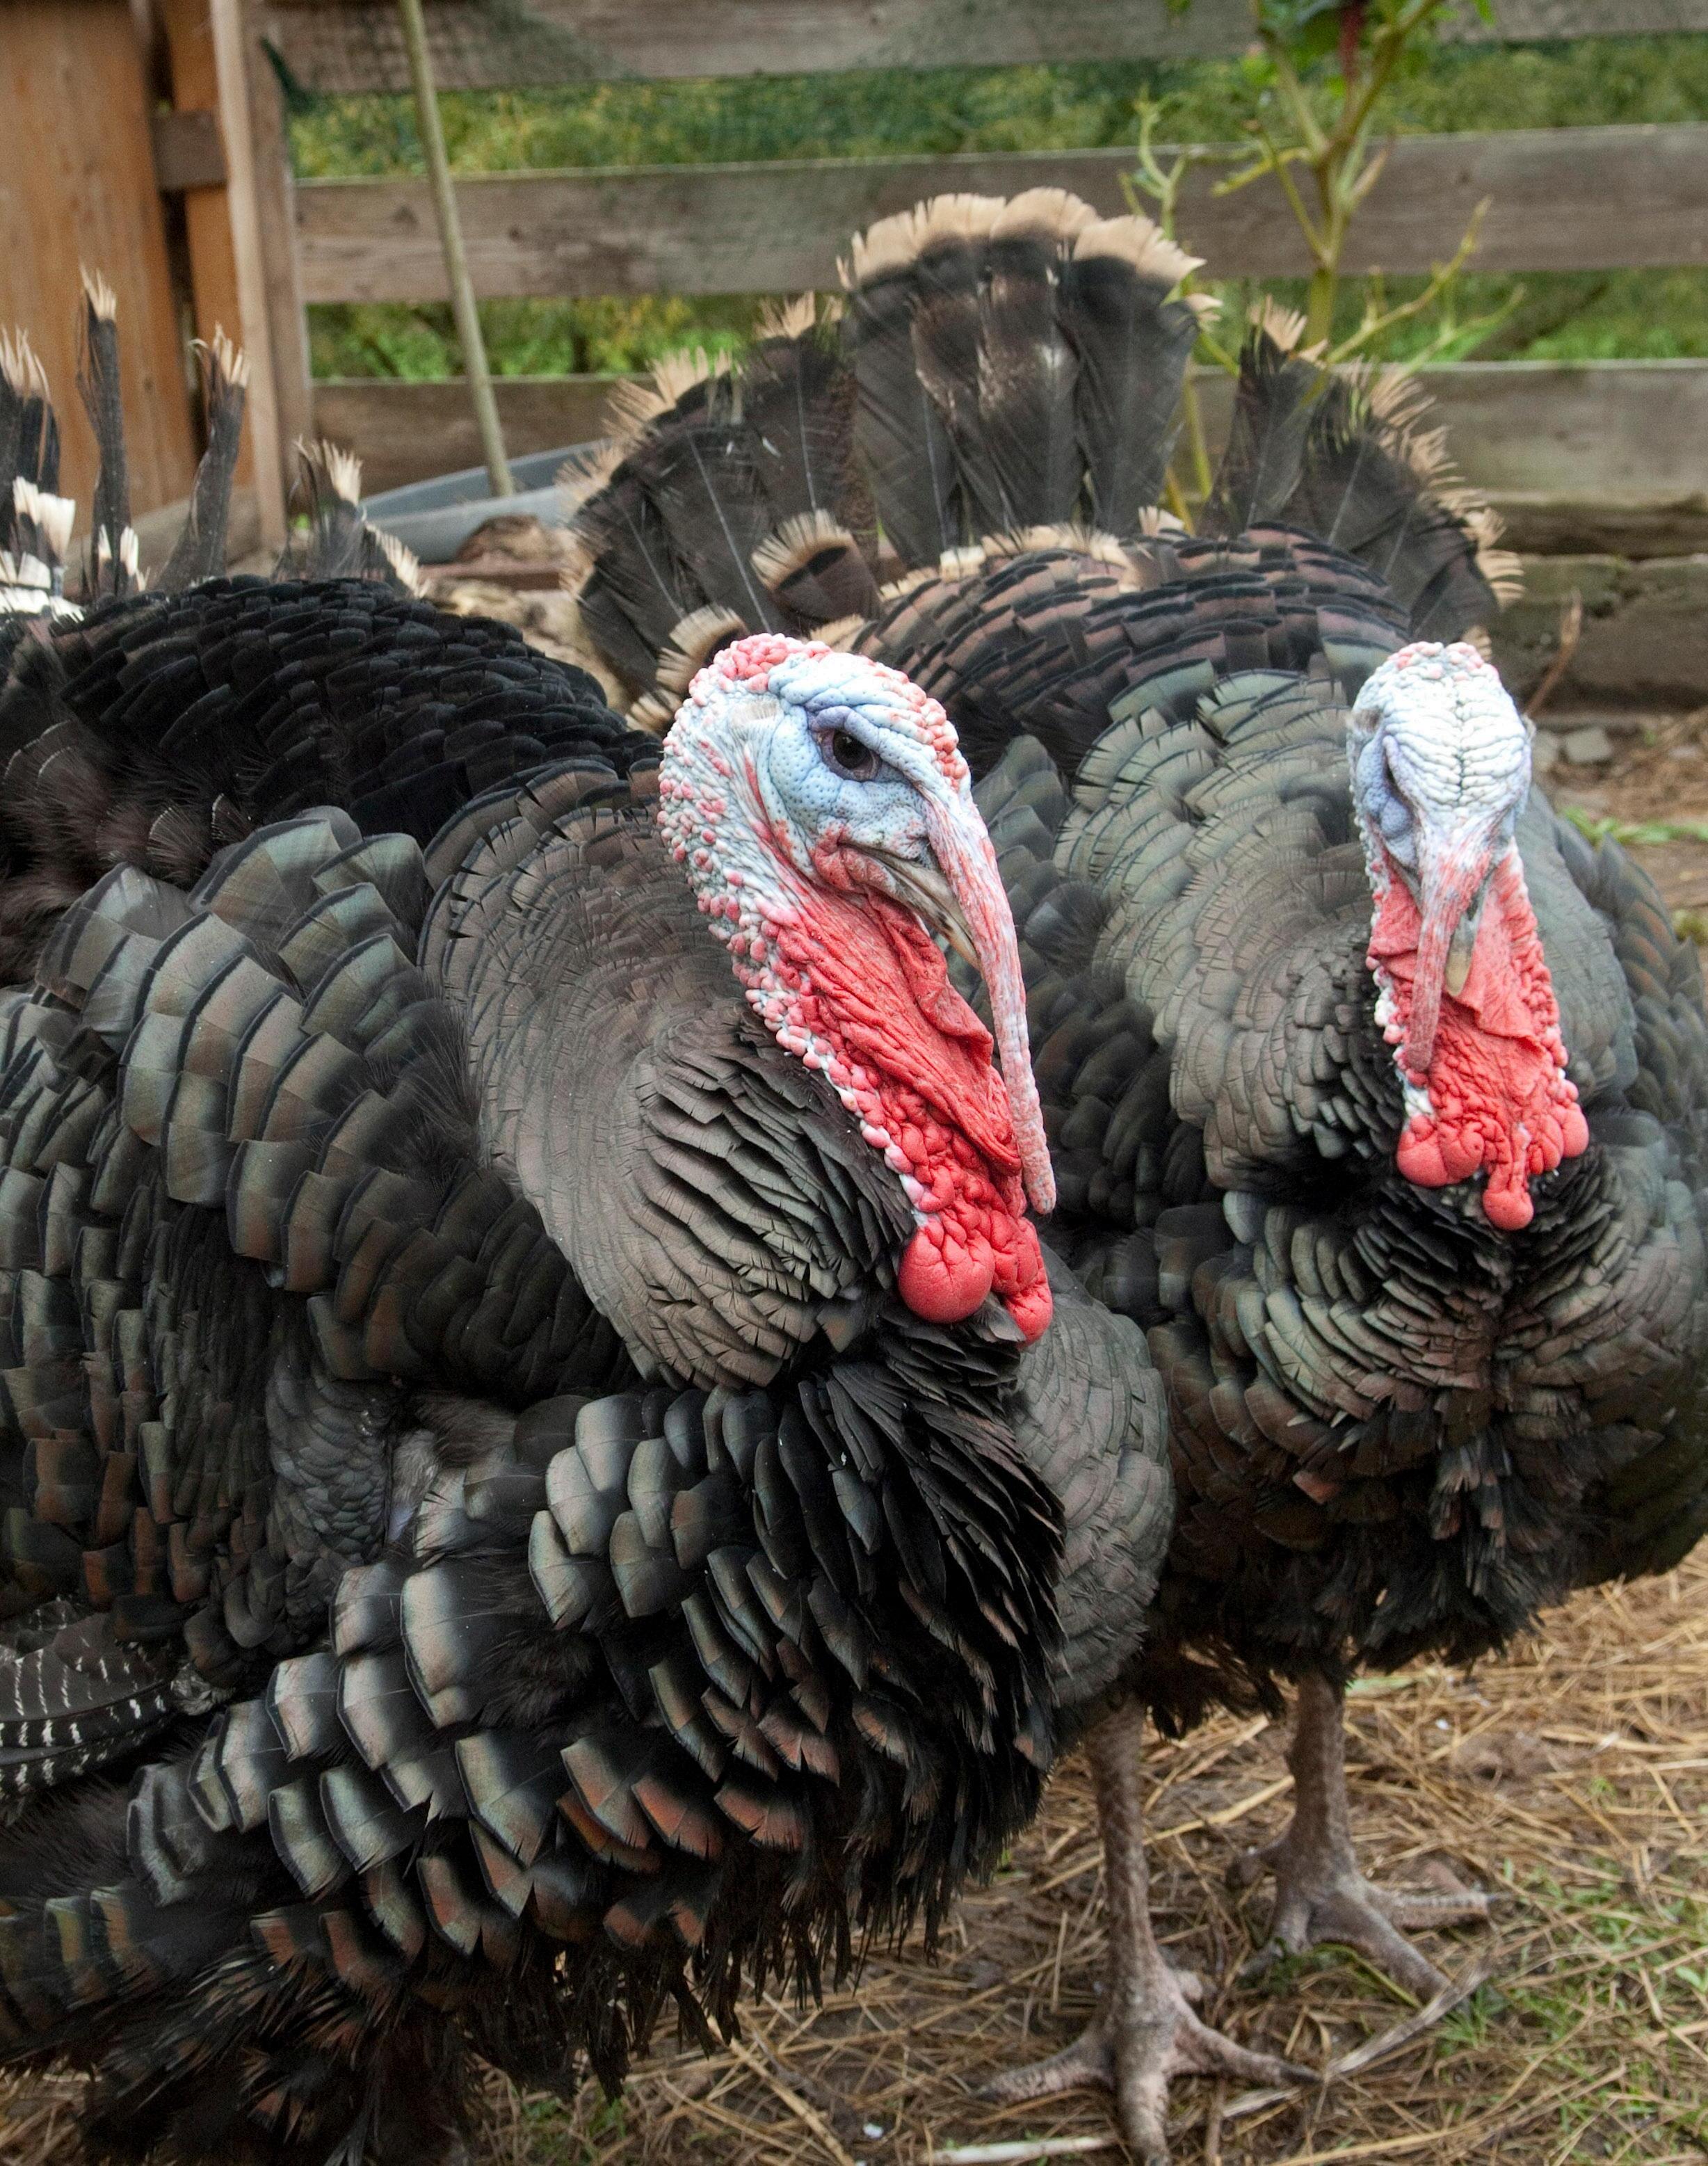
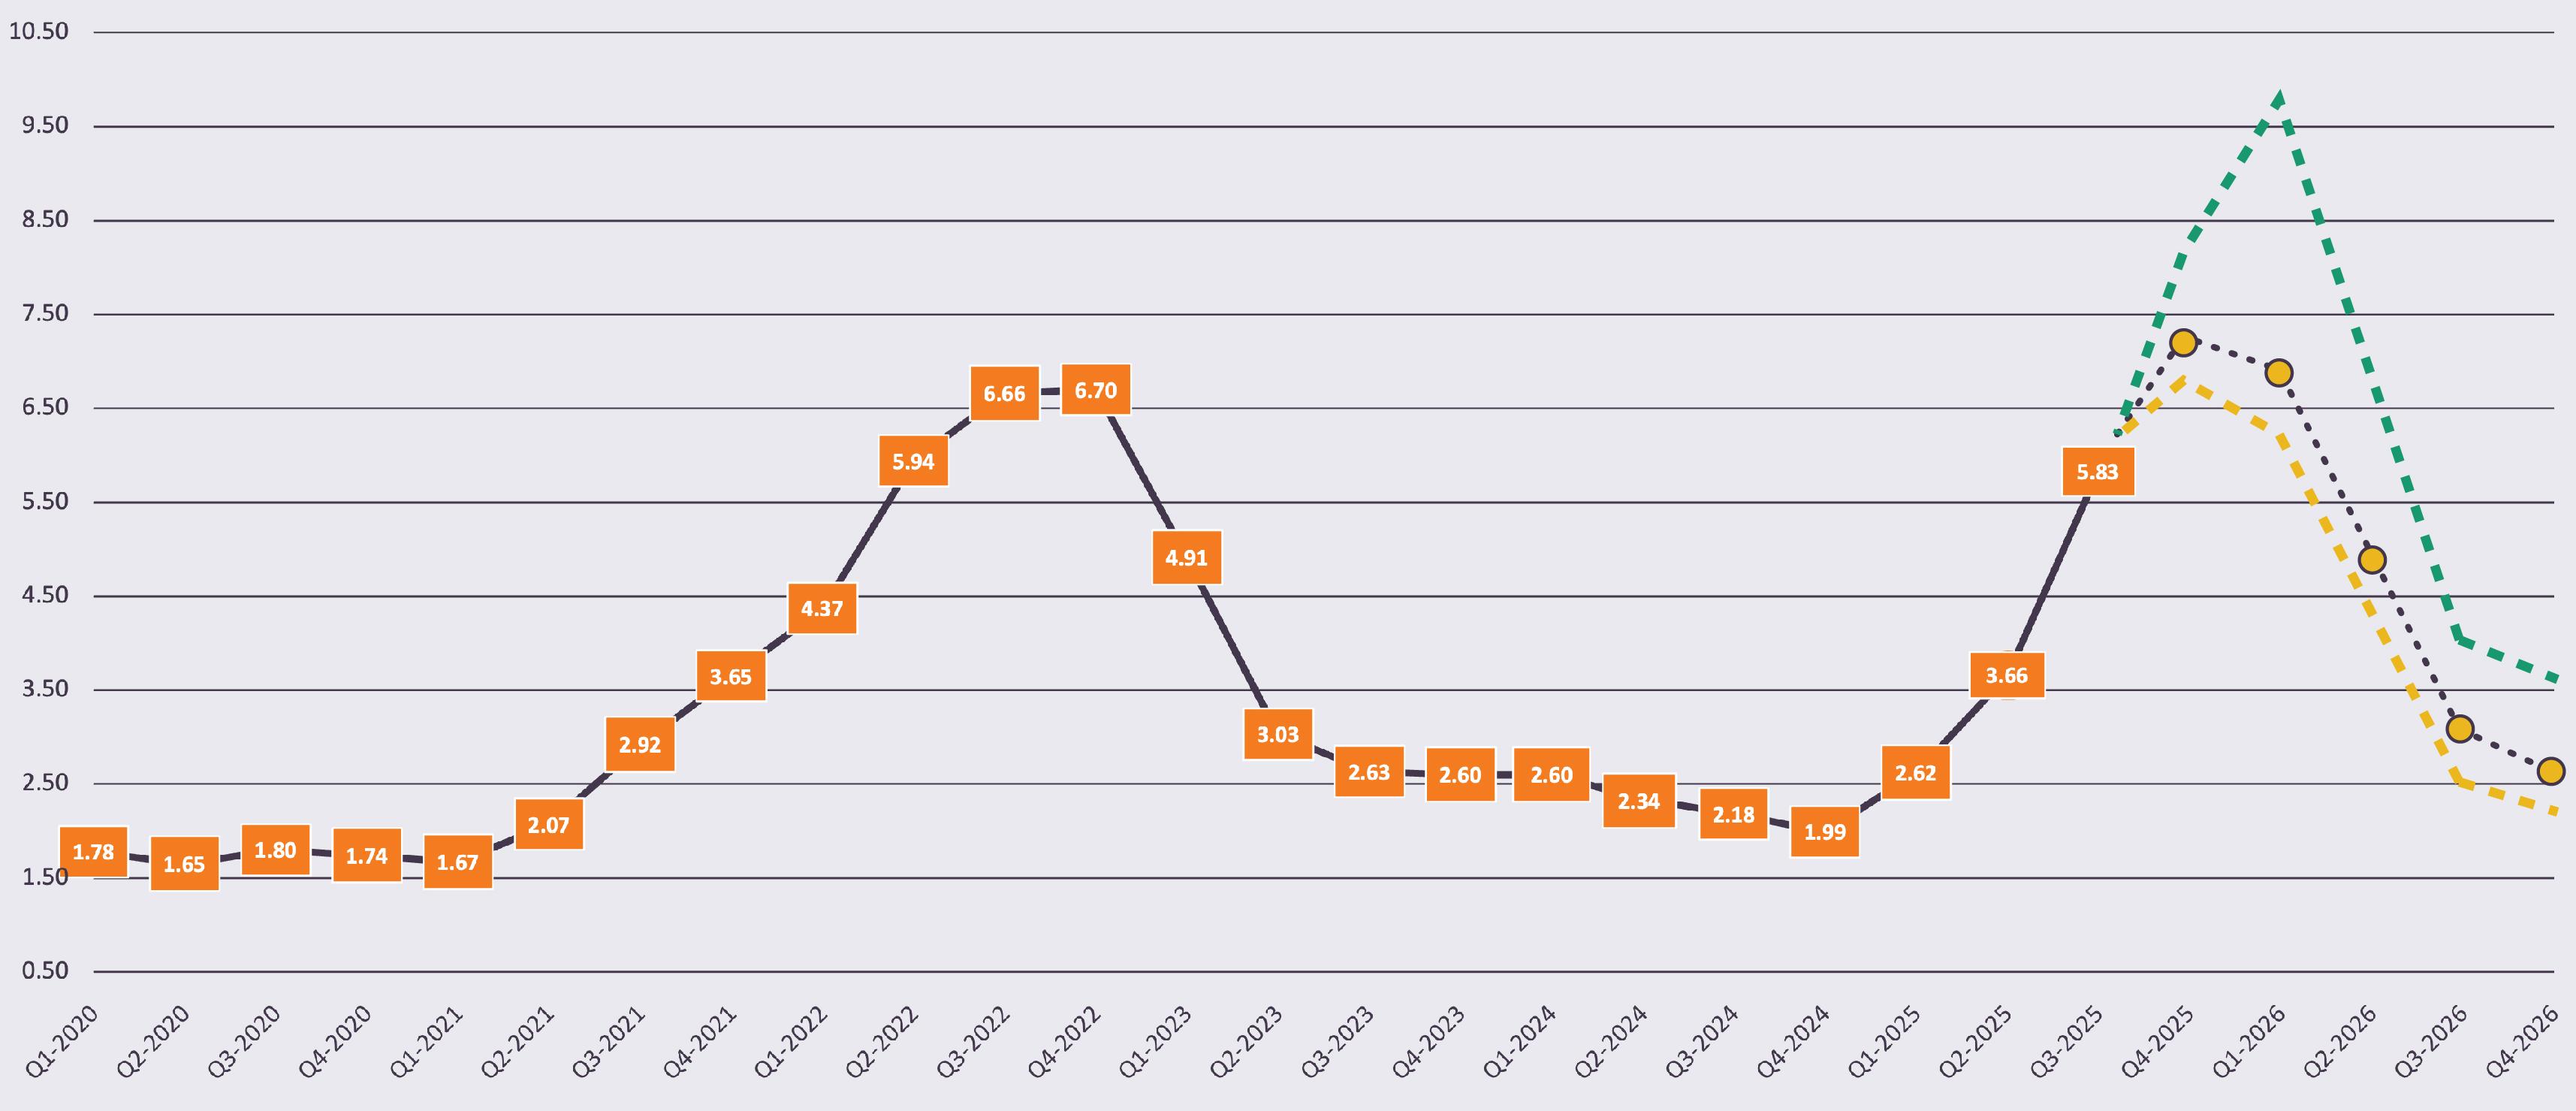
• Farm prices +91–100% year over year; returns over feed costs +405% year over year, reflecting improved producer margins with feed costs well below 2022 highs. Tight supply continues to support rising prices for breast meat and mechanically separated turkey (MST).
• Outlook into 2026:
· Production trough persists into early 2026; any sustained rebound depends on disease outcomes and hatchery stabilization.
· Disease path is the swing factor: HPAI risks climb with migration; AMPV keeps pressure on breeders/egg sets → volatility in poults and 2026 availability.
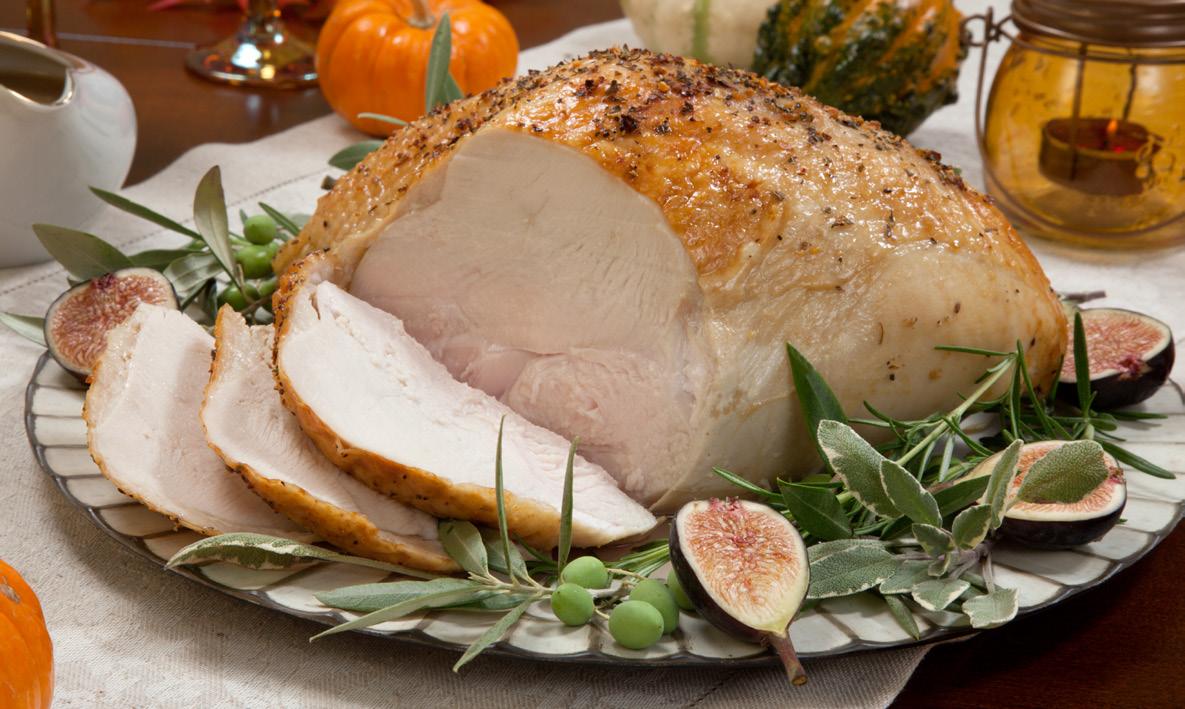
· Low stocks + constrained output + improved but still cautious producer behavior points to elevated pricing into the holidays; a larger softening likely awaits clearer expansion signals and a benign 2025–26 disease season.
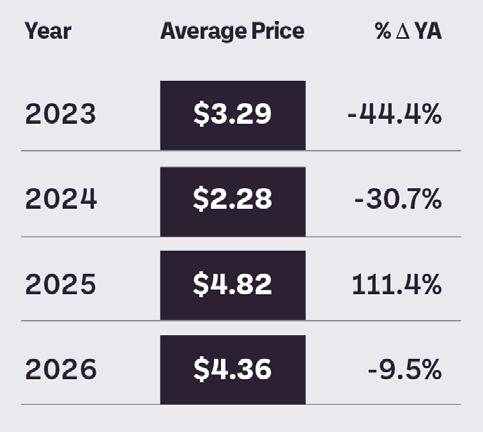
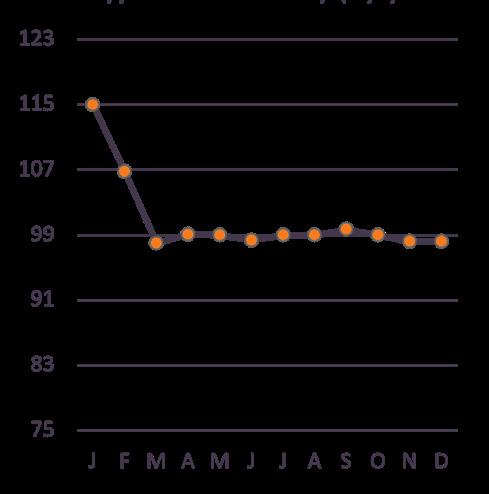

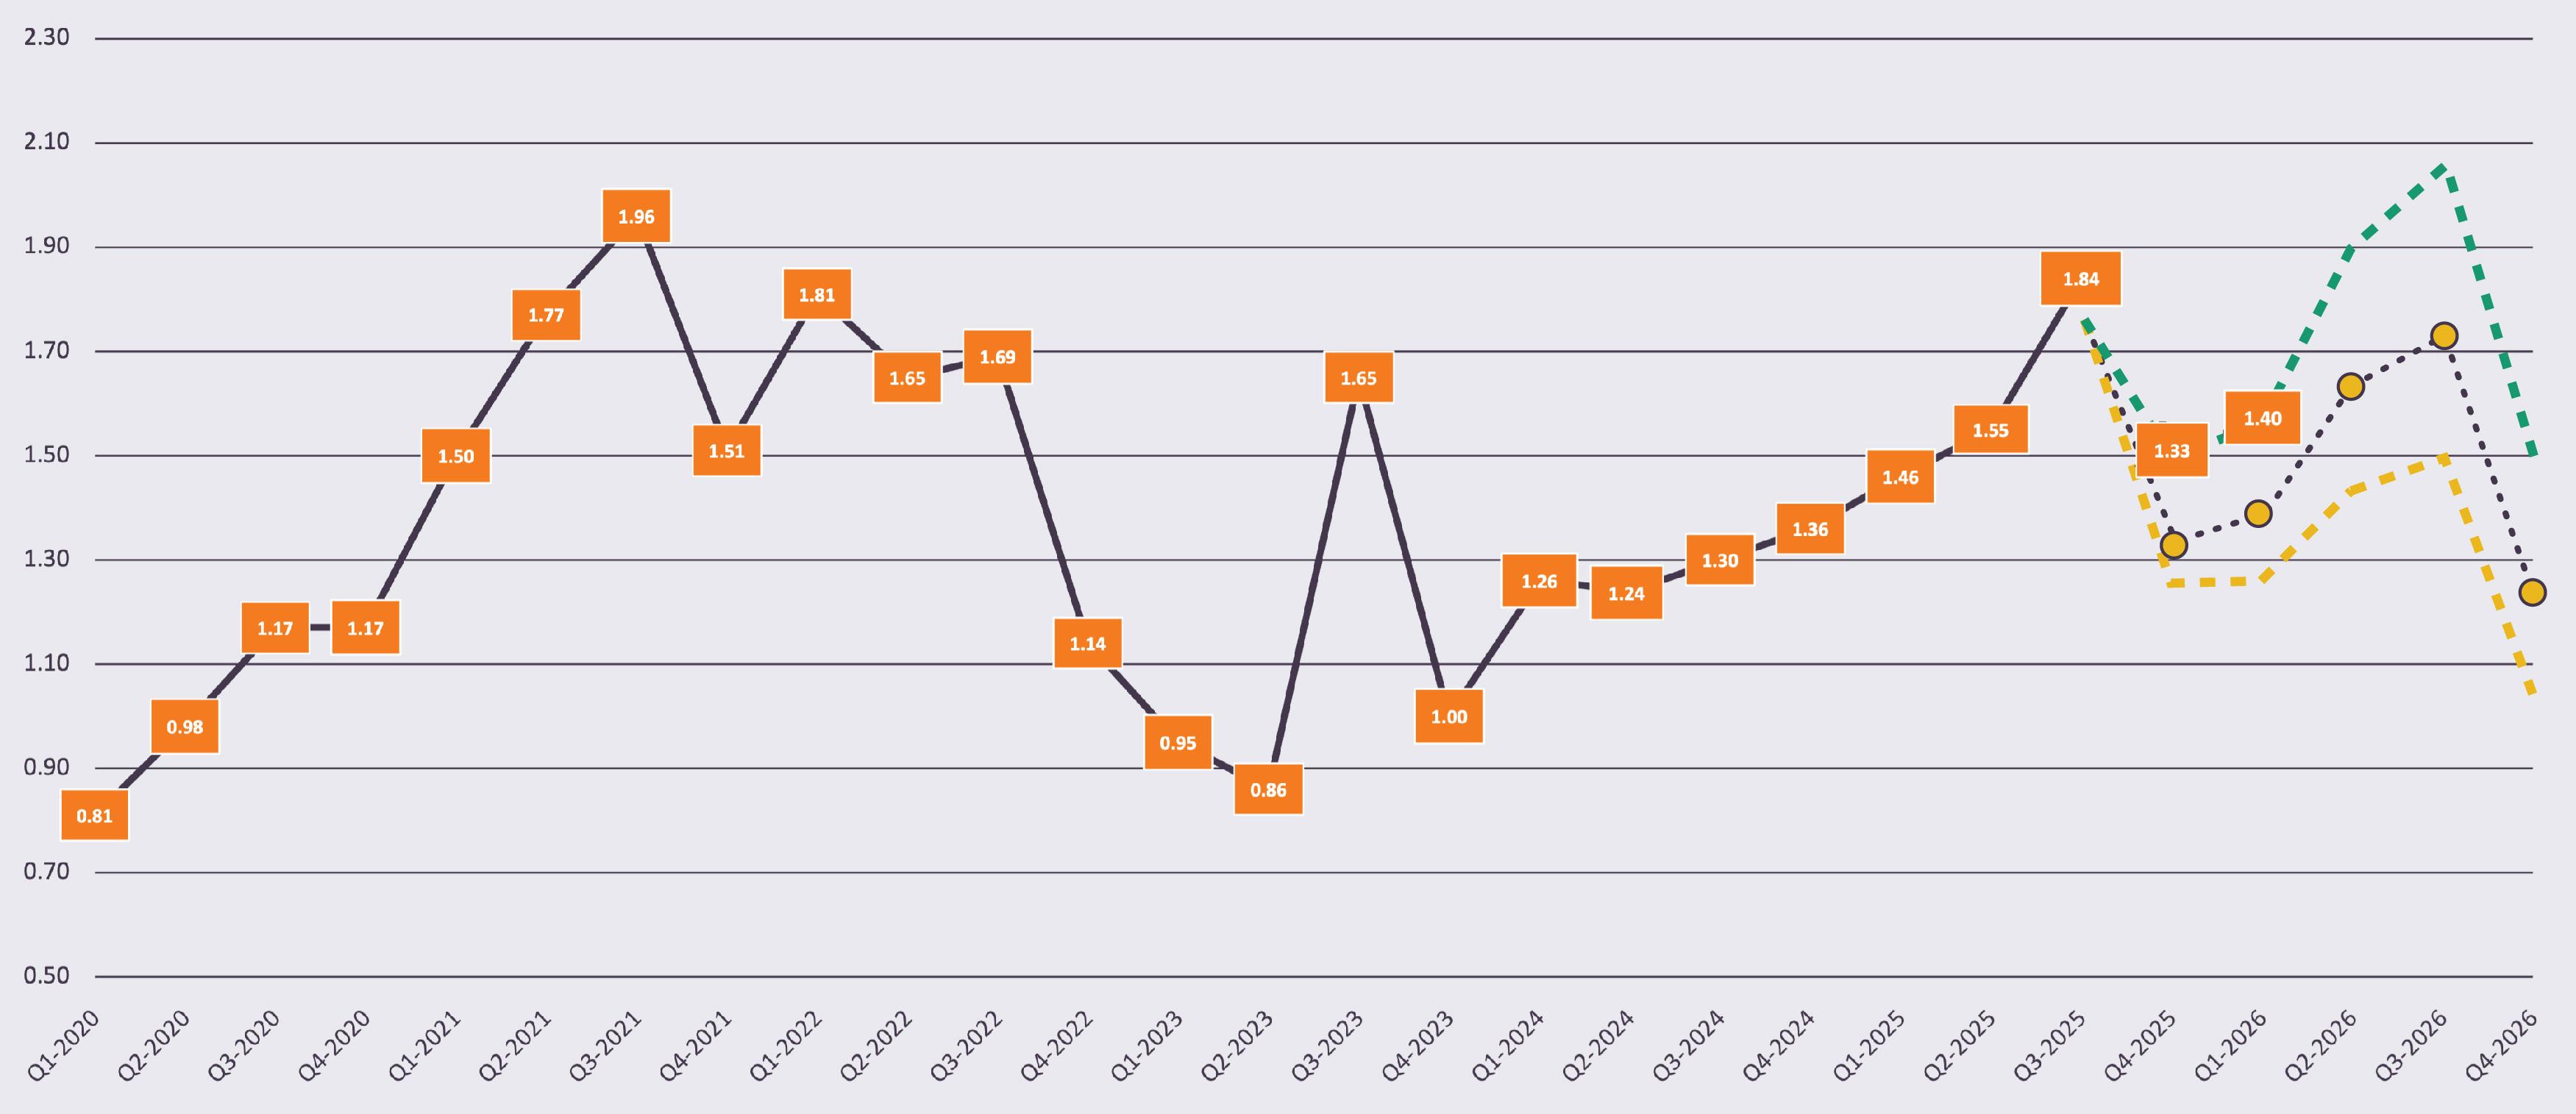
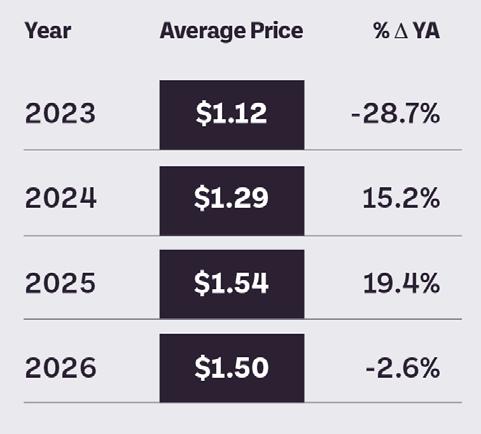
• HPAI has impacted this industry significantly since February 2022 with total losses of more than 141 million layers from February 2022–October 2025.
· 40.2 million in 2024.
· More than 50 million YTD 2025 and started increasing again with 3.5 million lost in the first week of October.
• In the last 7 months about 54.6 million egg laying chickens have been lost to Avian Influenza.
• Flock & Production
· Table egg laying flock down 1.3%, but +5% from spring lows as producers repopulate.
· Still ~14% short of the 350M head needed to meet demand.
• Supply & Inventories
· Overall shell egg inventory is up 30% since late June, has surged 10% higher than the 5-year average.
· Breaking stock up 12% month over month; liquid whole product production +6.2% YTD.
‧ These inventory gains will help into the holidays and 2026, but Avian Influenza remains a risk.
· Cage-free inventory up 50% YoY and 80% vs. 5-year average; conventional vs. cage-free price spread narrowing.
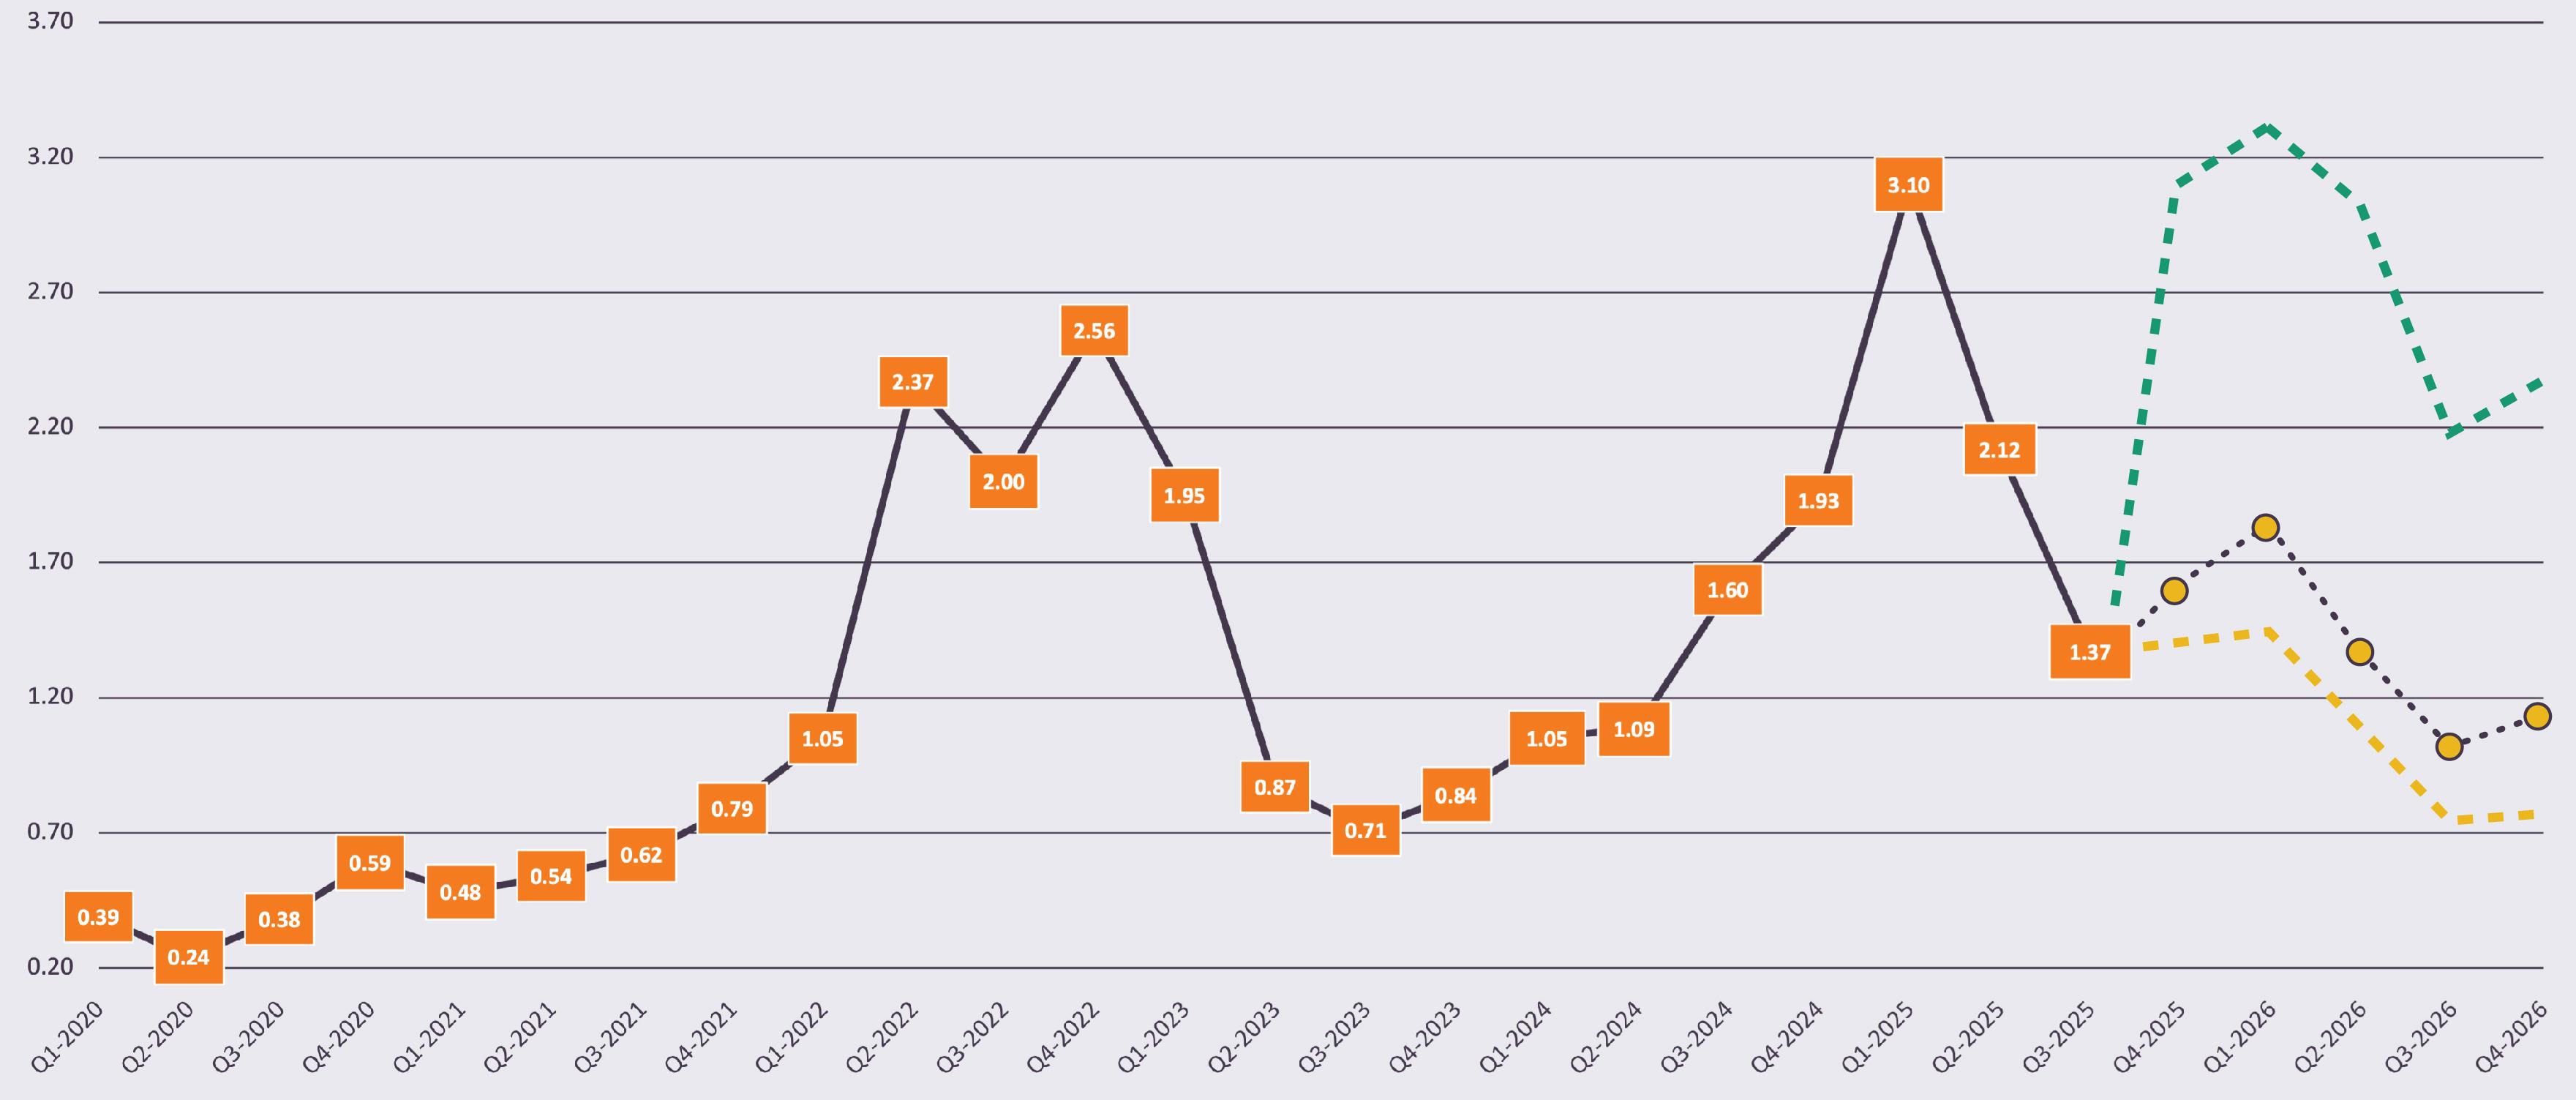
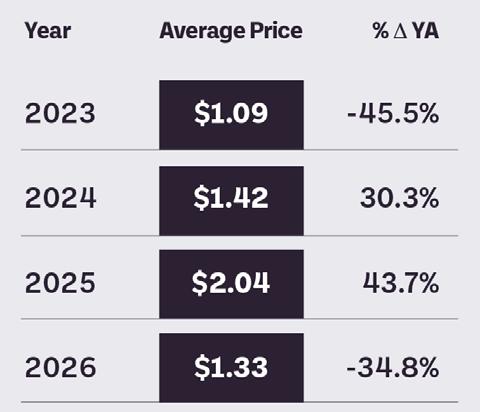
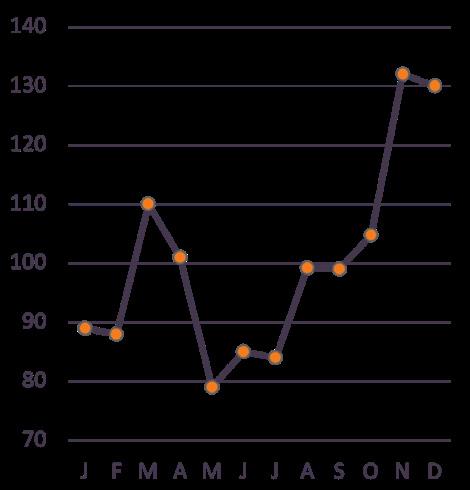
Source: Slade Gorton
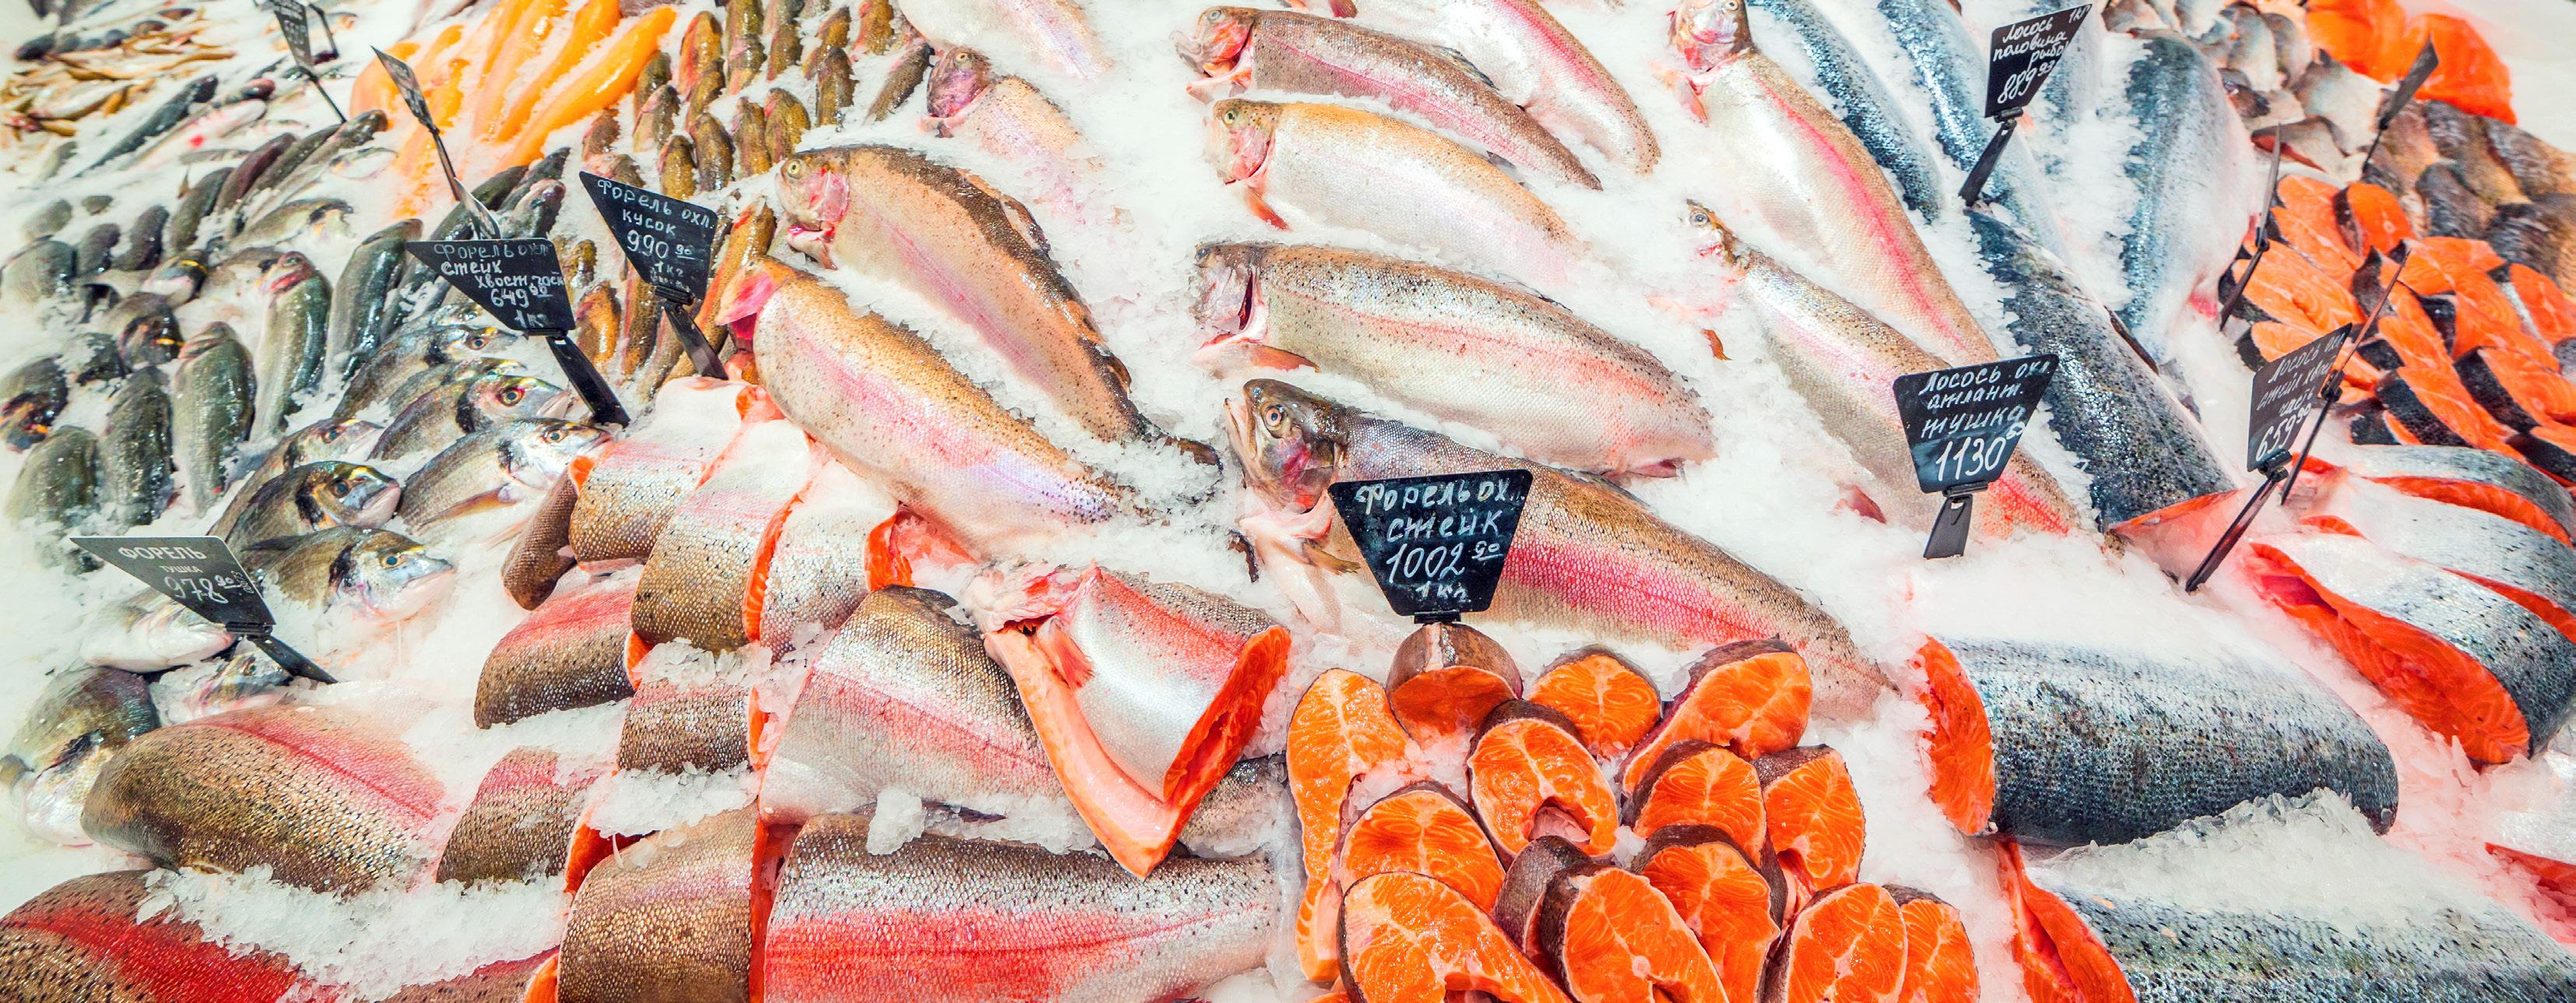
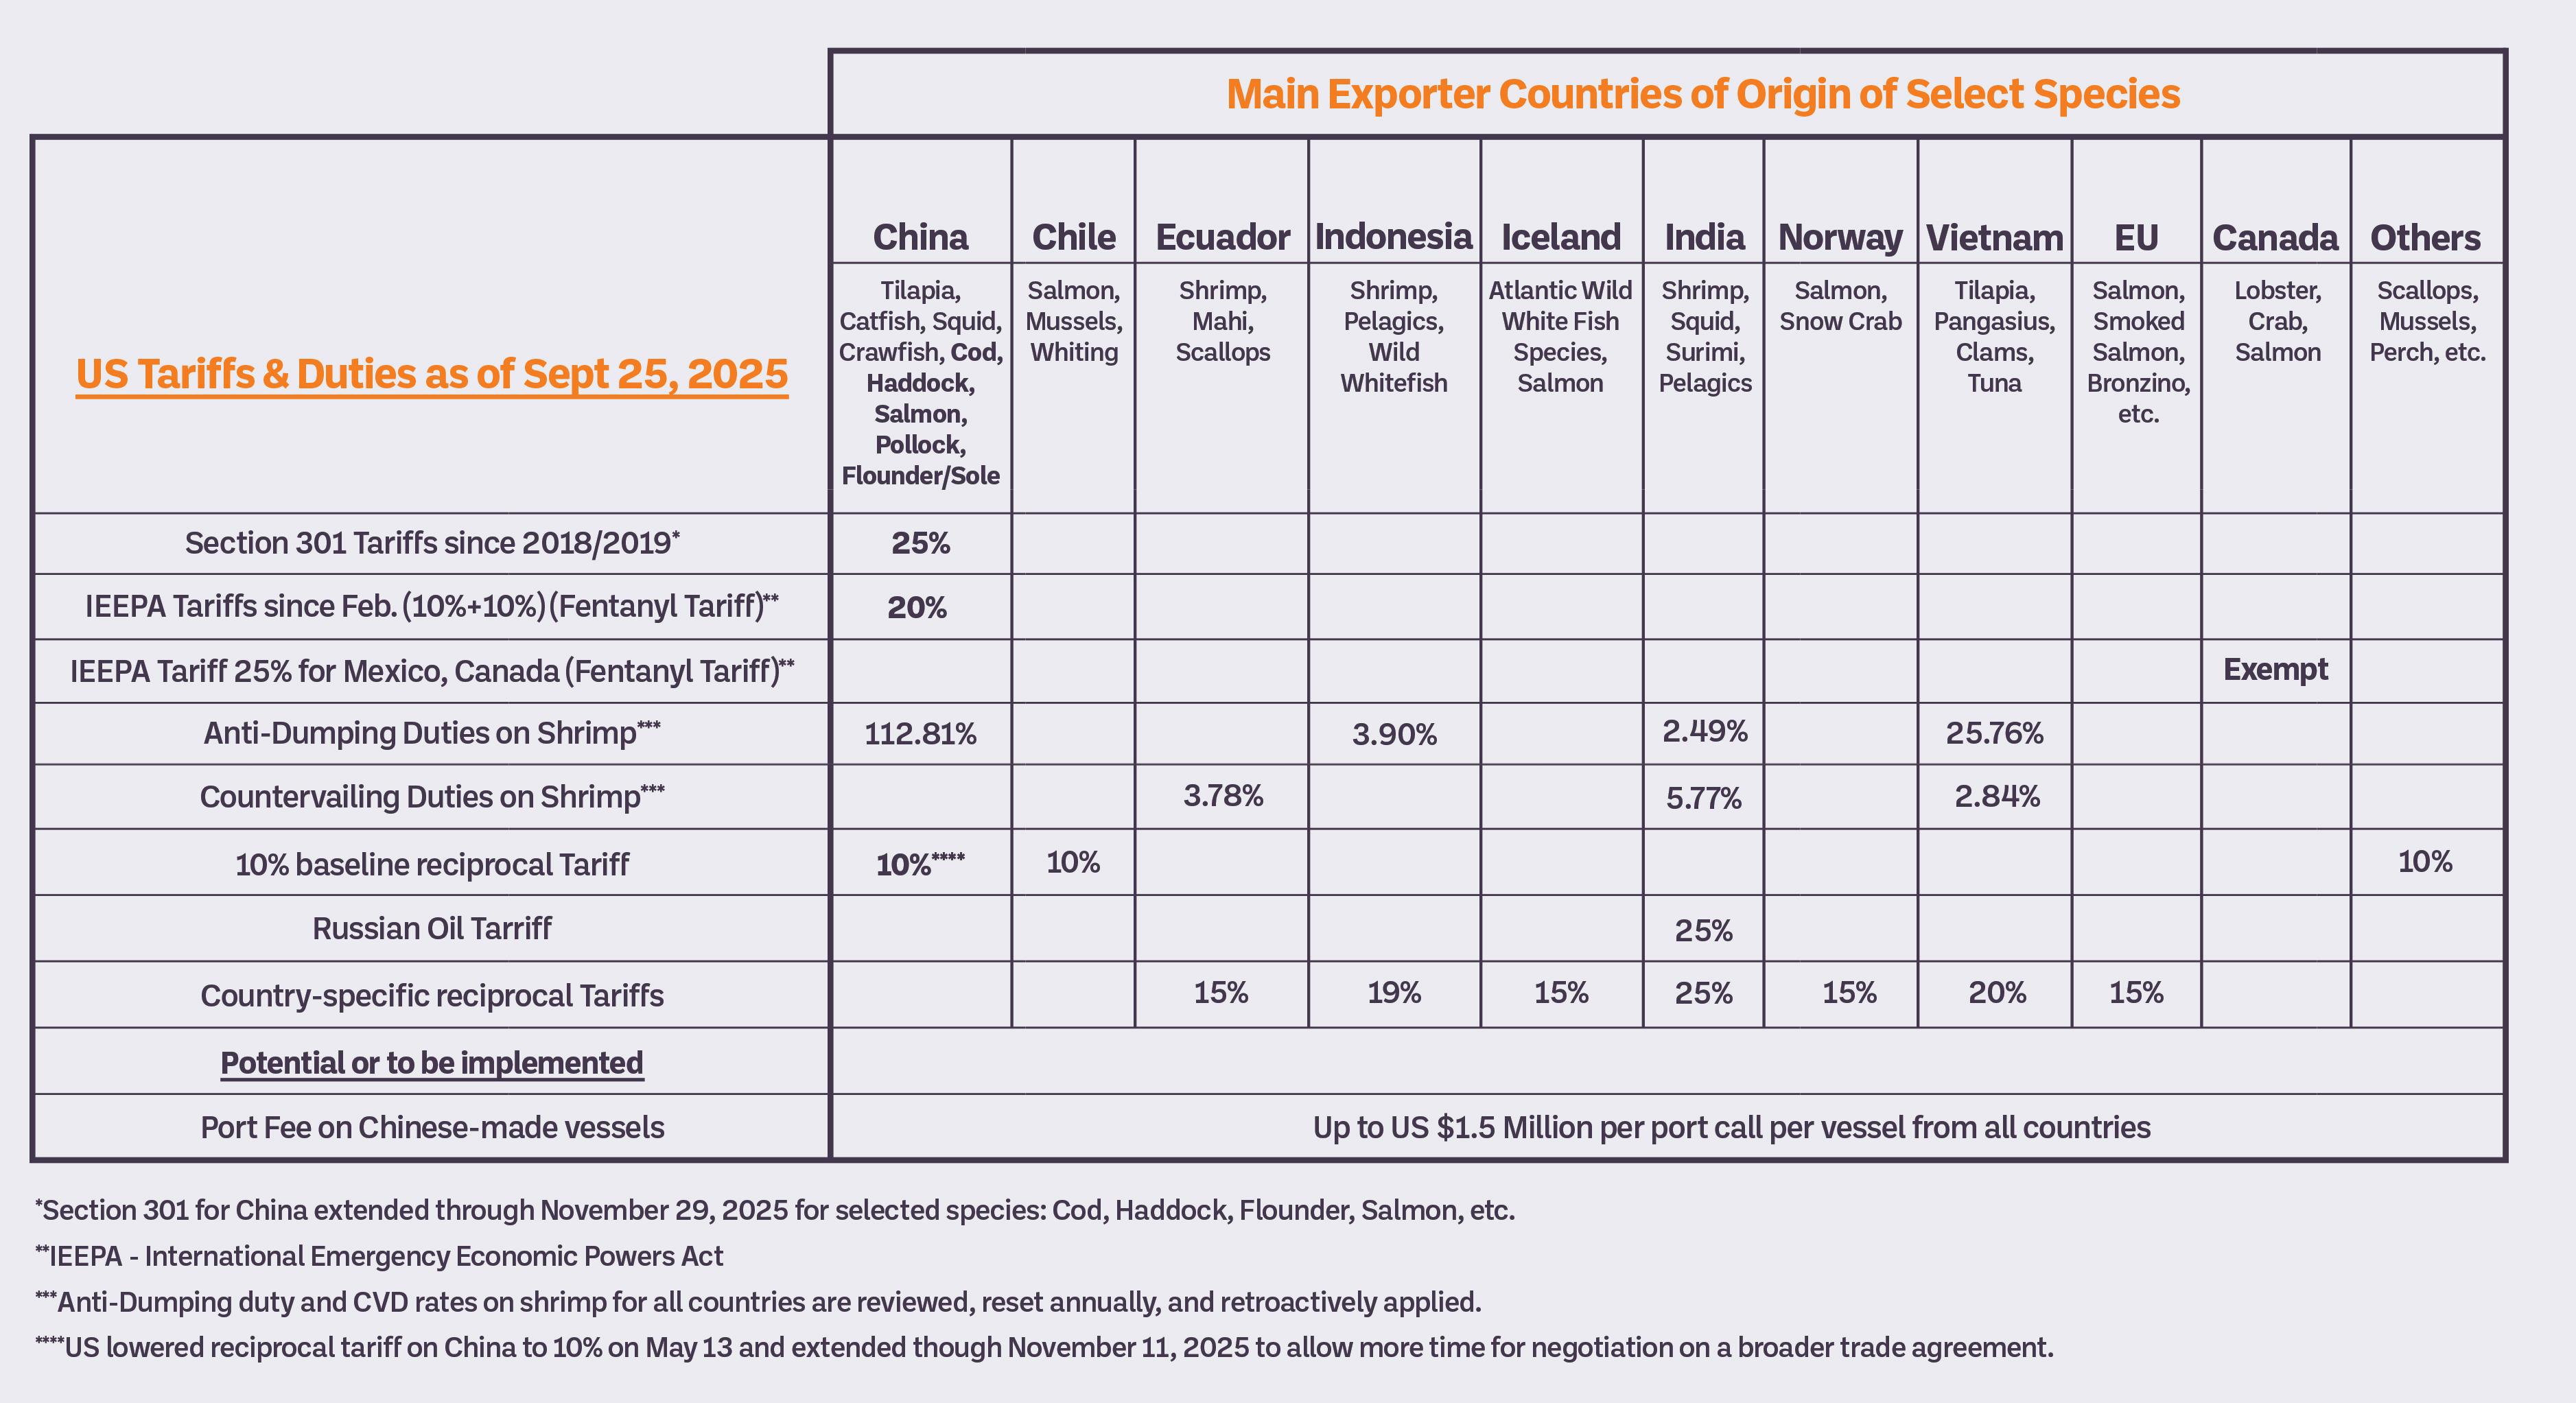
The U.S. seafood market is facing tariff-driven cost pressure, varying supply tightness, and continuing logistics challenges. Demand remains price-sensitive, with volatility risk in the months ahead.
• Cod: Norway quota cuts to the lowest since 1991 and tariffs (China 30%, Vietnam/Indonesia 19–20%) combined with the Russian embargo are severely restricting supply, pushing Atlantic cod prices to record highs. Pacific cod quota rose 18%, but this has not offset the overall shortage.
• Haddock: Imports +4% YTD, but raw material costs rising rapidly. 2025 quota cut by 8% and the Russian supply ban starting in 2026 will offset expected quota recovery, keeping upward pressure on prices.
• Flounder: Imports +14% YTD with stable prices, but large sizes (6 oz+) are scarce. Current 30% tariff could jump to 55% once the temporary exclusion expires in 90 days, posing cost escalation risk.
• Pollock: Imports –13% YTD. Costs spiked in Q2 but stabilized recently. China 30% tariff and Russian bans limit supply, but pollock remains the most cost-competitive whitefish option compared to cod and haddock.
• Outlook into 2026: Cod and haddock will stay costly due to quota cuts, tariffs, and the Russian embargo; flounder stable but exposed to tariff hikes; pollock offers relative stability but cannot offset tightening in other whitefish.
• Shrimp: Imports +17.9% YoY, price/lb. +8%. Pre-tariff surge built lower-cost stocks; additional tariffs (India 50%, Indonesia 19%, Vietnam 20%, Ecuador 15%) could raise replacement costs. Stronger pricing ahead is expected.
• Tilapia: Imports +18% YTD. Raw material prices are soft as overseas packers chase orders but expected to rebound by Q4–Q1. Heavy tariff burden (China 55%, Vietnam 20%, Indonesia 19%) keeps cost pressure high.
• Pangasius: Imports +6% YTD. Prices eased after early 2025 increases, keeping it competitive against tilapia and Chinese whitefish. Demand remains strong, with costs likely to firm again into 2026.
• Salmon: Global supply up +7% YoY on strong European production and larger harvest weights. Prices dipped below breakeven as producers absorbed tariffs (Canada exempt, Chile 10%, EU 15%). Soft prices in 2025 boosted consumption, but zero smolt growth in Norway signals a looming supply shock for 2026–27, expected to push prices strongly upward.
• Outlook into 2026: Tilapia and pangasius show volume growth but remain tariff-sensitive; salmon is soft in 2025 but faces a looming supply shock in 2026–27; shrimp imports surged before steep new tariffs, with prices expected to strengthen as older low-cost stocks clear. A new U.S.–India trade agreement, if favorable, can help relieve pressure on shrimp.
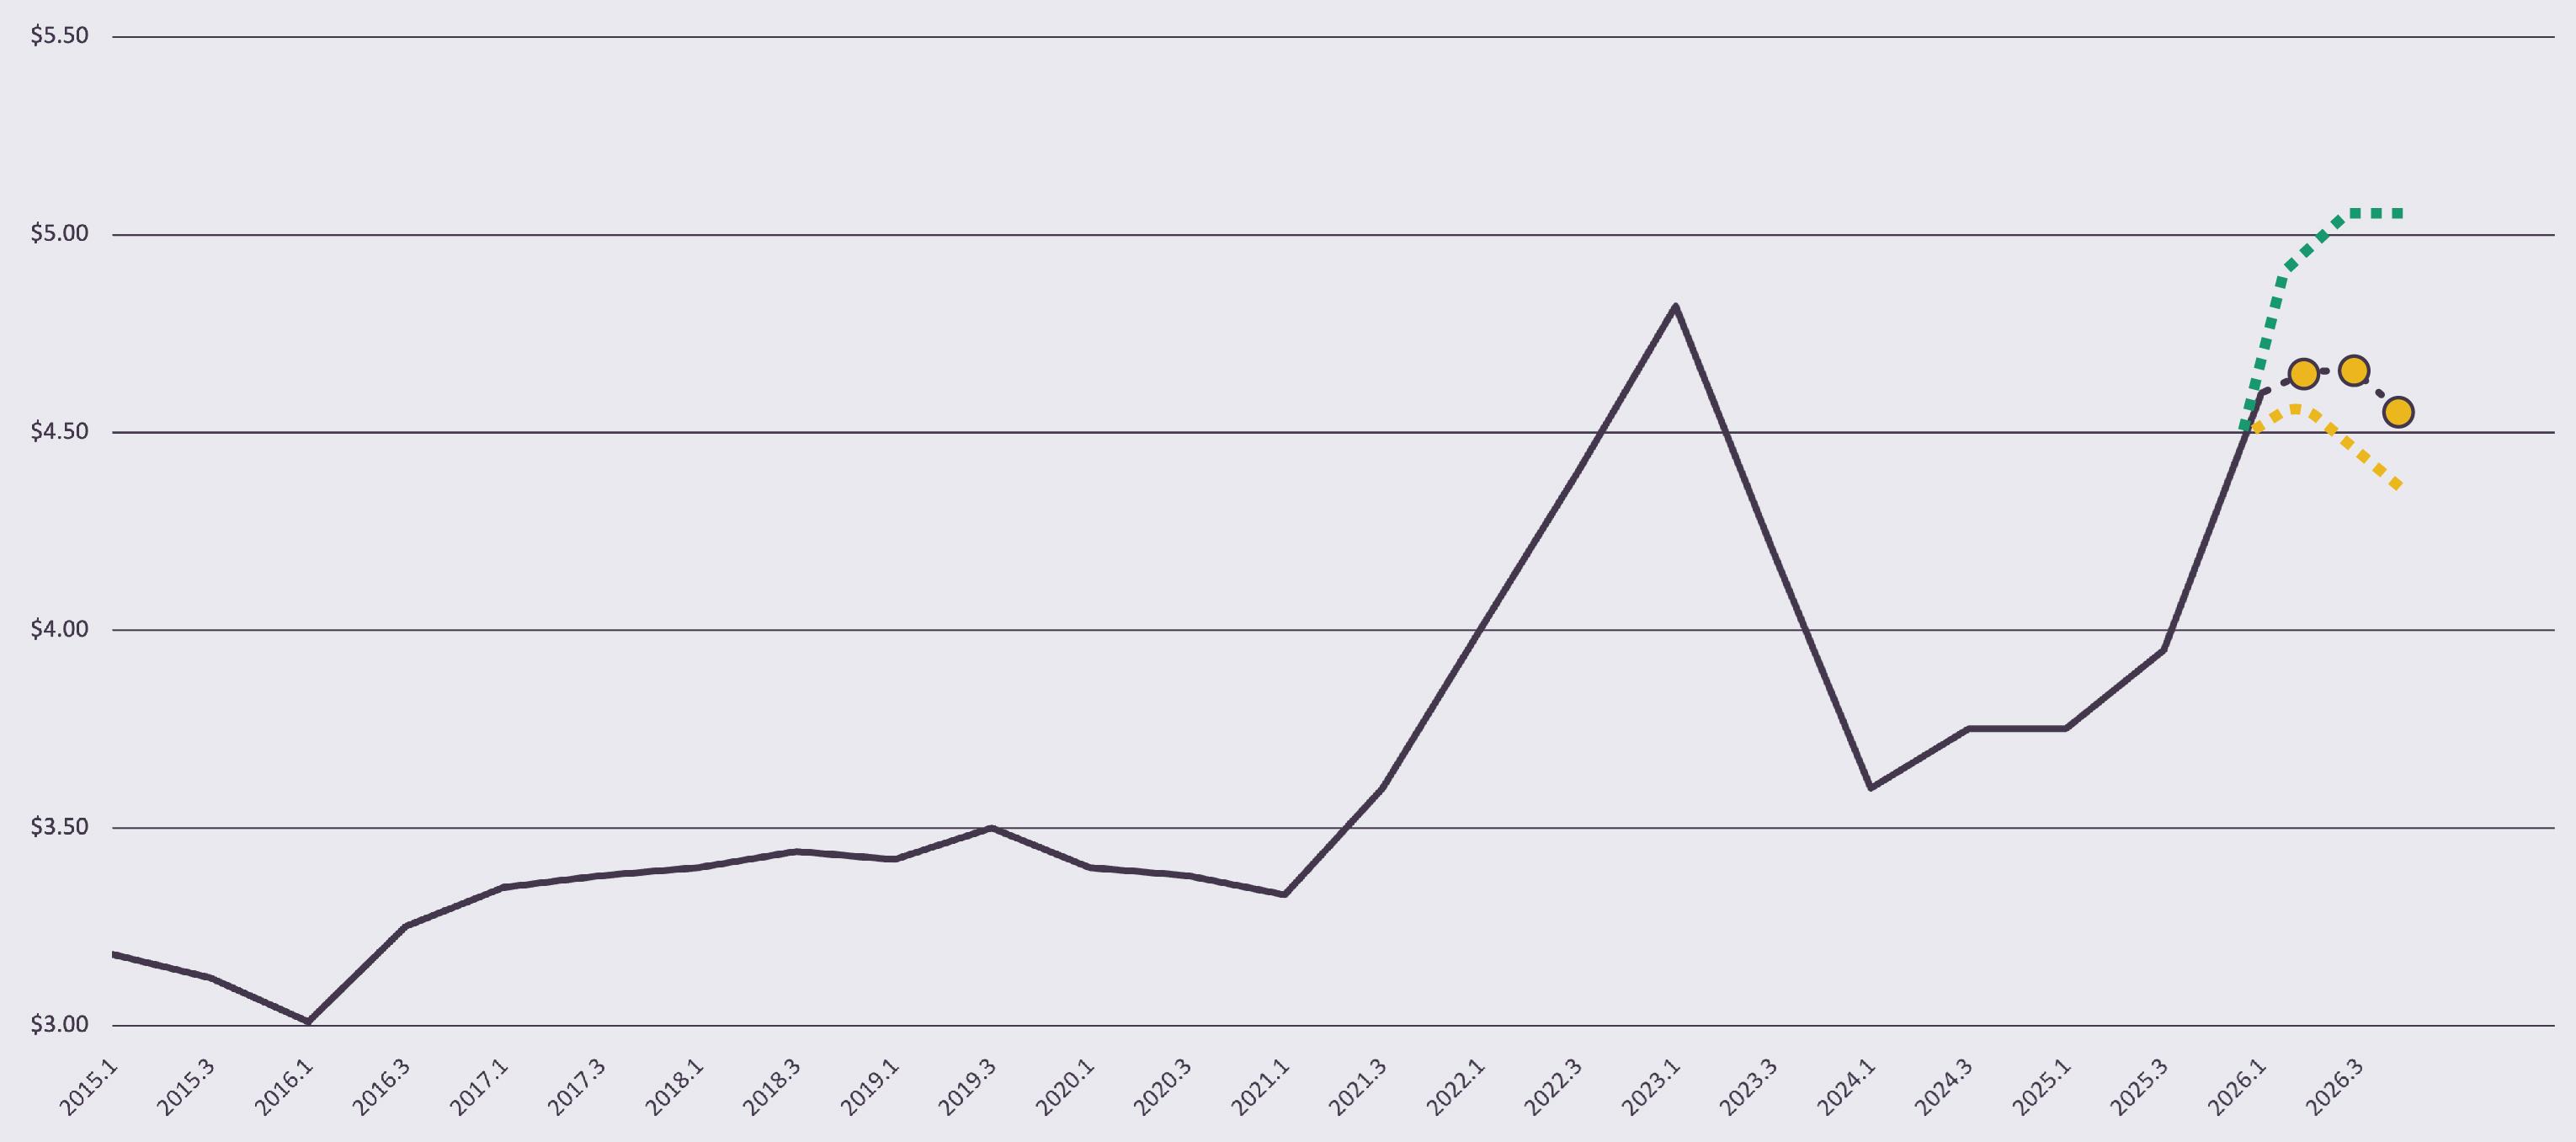
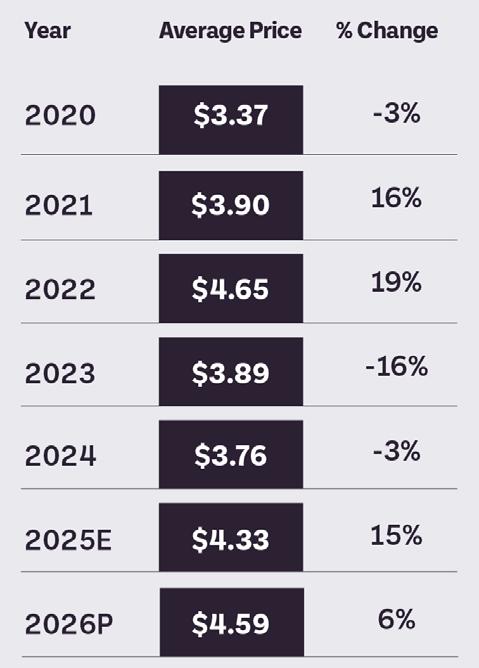
Global trade and geopolitics continue to impact the seafood market, raising costs and injecting uncertainty and volatility into the seafood supply chain.

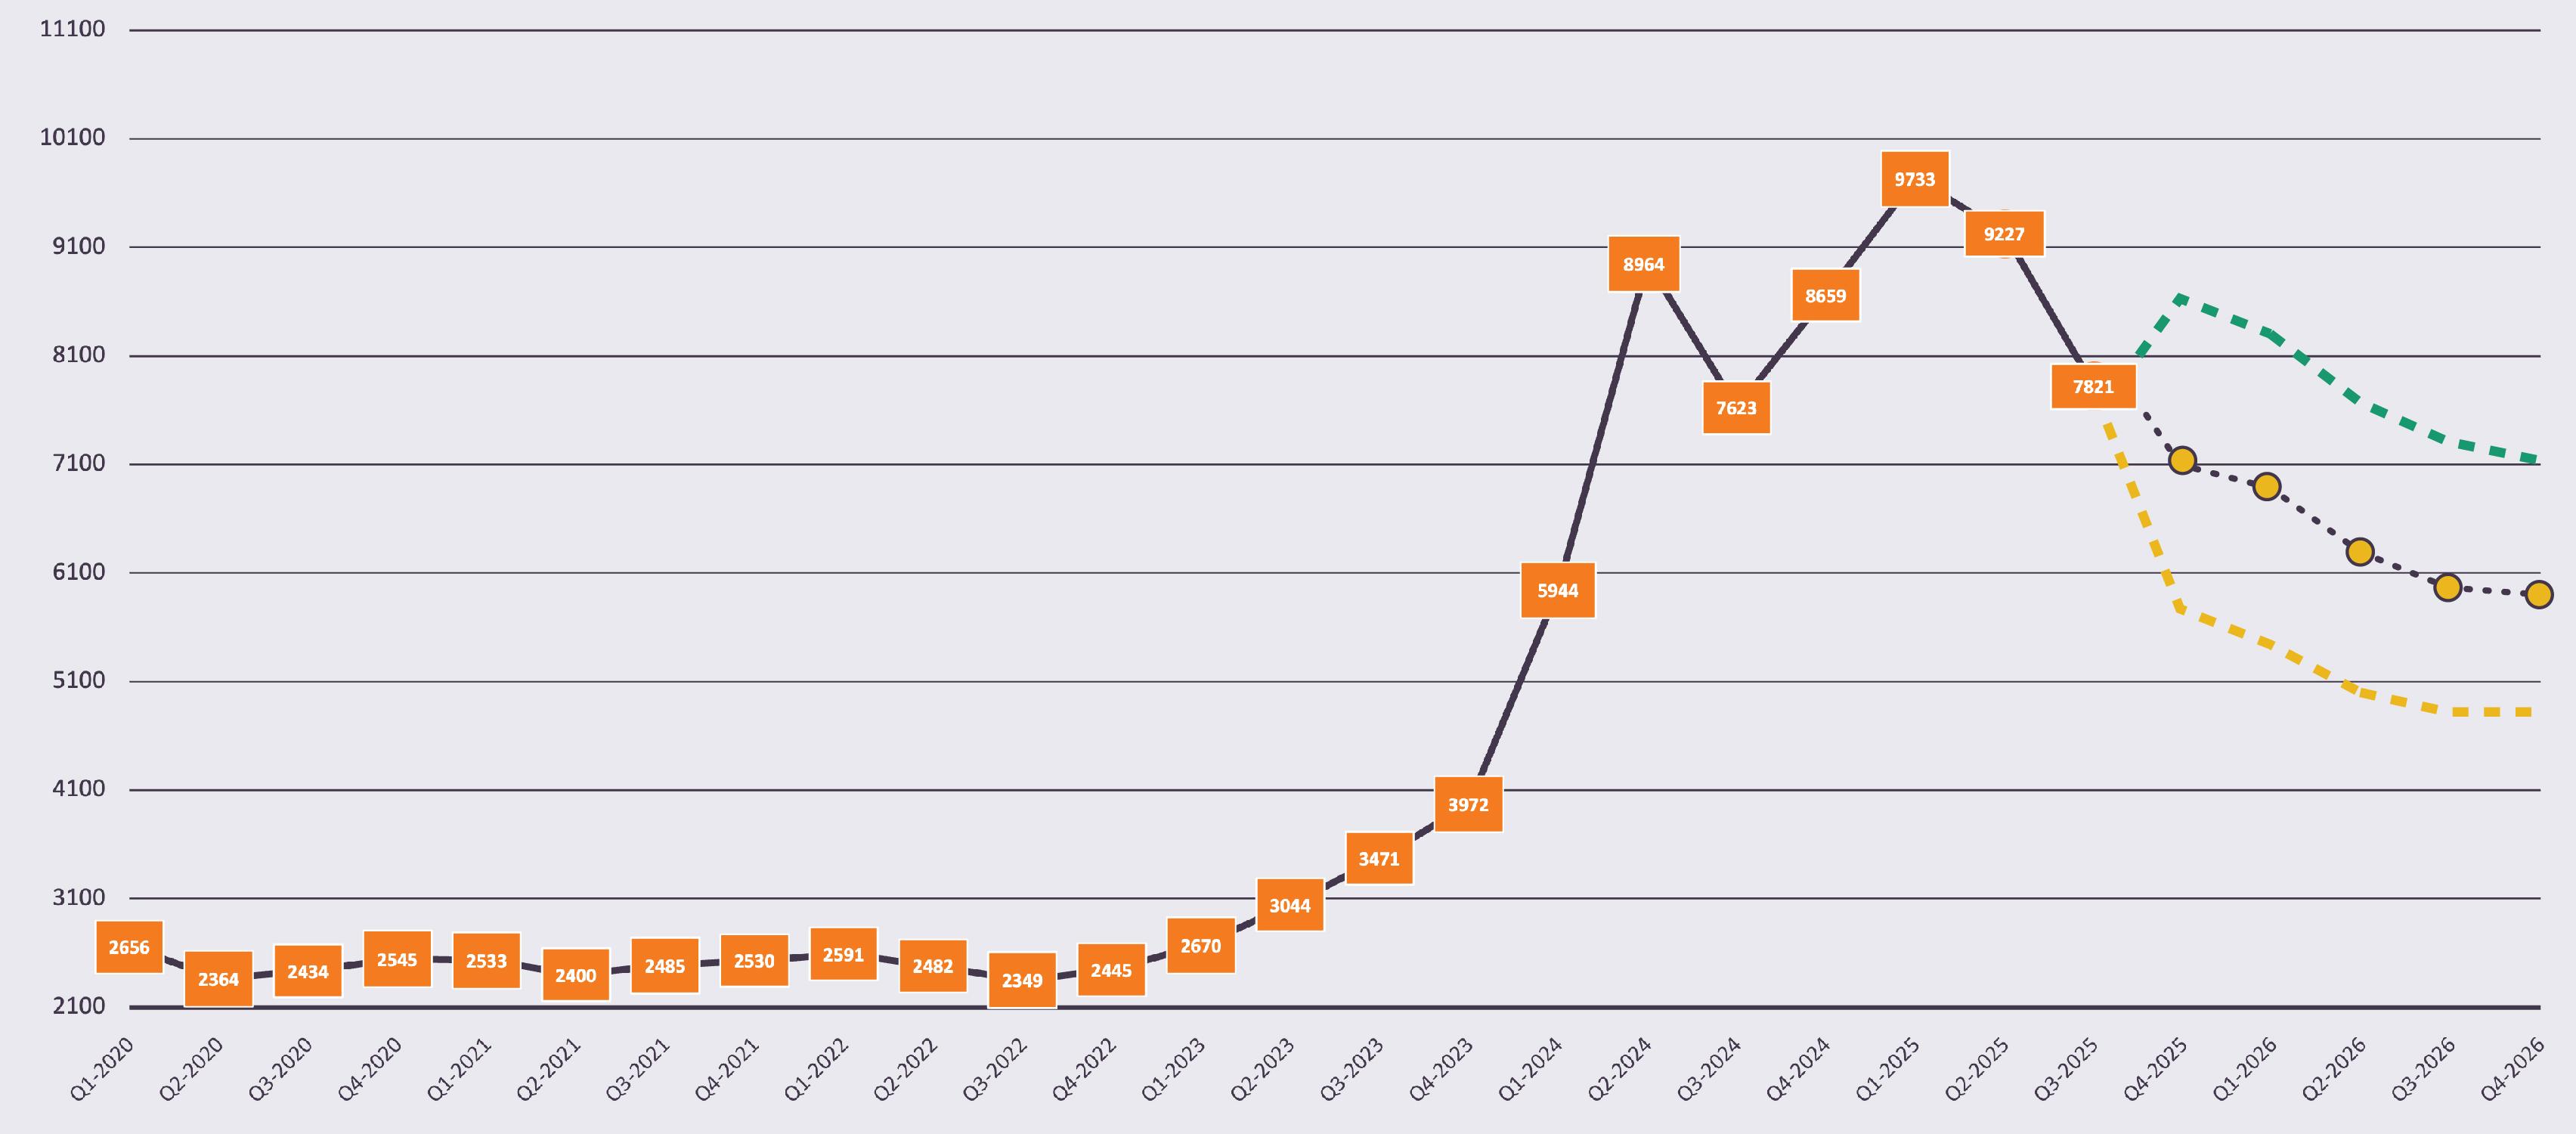
• Cocoa prices have been slowly trending downwards this year; this trend is expected to continue into 2026.
• Production in Ghana and Cote d’Ivoire has been improving slightly due to higher farm gate prices and additional investment in their cocoa sectors. Ecuador production has also increased and is expected to overtake Ghana as the #2 top cocoa producing country.
• Cocoa grindings data indicates that demand is declining as well, with Q2 2025 grindings down 9%.
• A growing surplus is expected for 2025/26 which will lead to downward pressure on prices. While fundamentals are improving, disease and adverse weather remain risks.
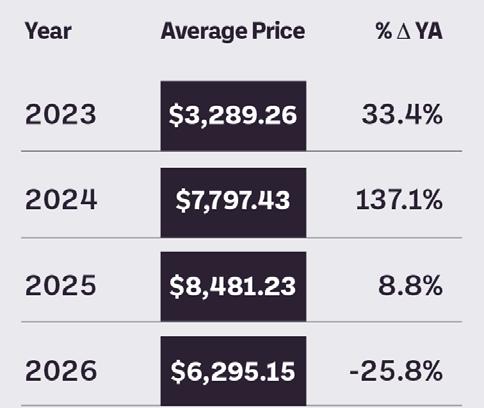
• Outlook into 2026: Prices are expected to decline towards $6,000 throughout 2026.
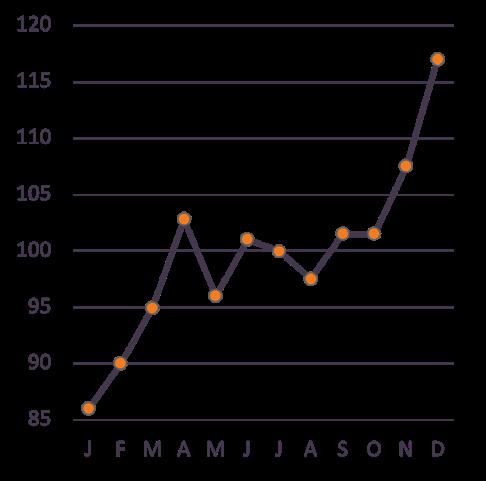
• Tariffs and tight supplies have kept the coffee market very volatile, with prices in December coming in below $3.00 increasing to above $4.00 at the beginning of August through mid-September. Prices have since cooled off slightly, now around $3.75.
• Tight arabica supplies are keeping prices elevated — Brazil’s 2025 Arabica crop harvest is almost complete, and production was down around 10% vs. last year. Brazil’s 2026 crop is looking promising, with early estimates forecasting an 8% increase.
• Robusta production has expanded significantly leading to lower robusta prices and some demand switching from Arabica to Robusta in Brazil, leading to more Arabica available for export. The North American market still strongly prefers Arabica.
• The current 50% tariff on Brazil is leading to changing trade patterns. A potential reduction in this tariff could bring some price relief.
• Outlook for 2026: Prices are expected to remain elevated and volatile, but trend slightly downwards into 2026 with prices expected to range from $3.40 to $3.10 into 2026.
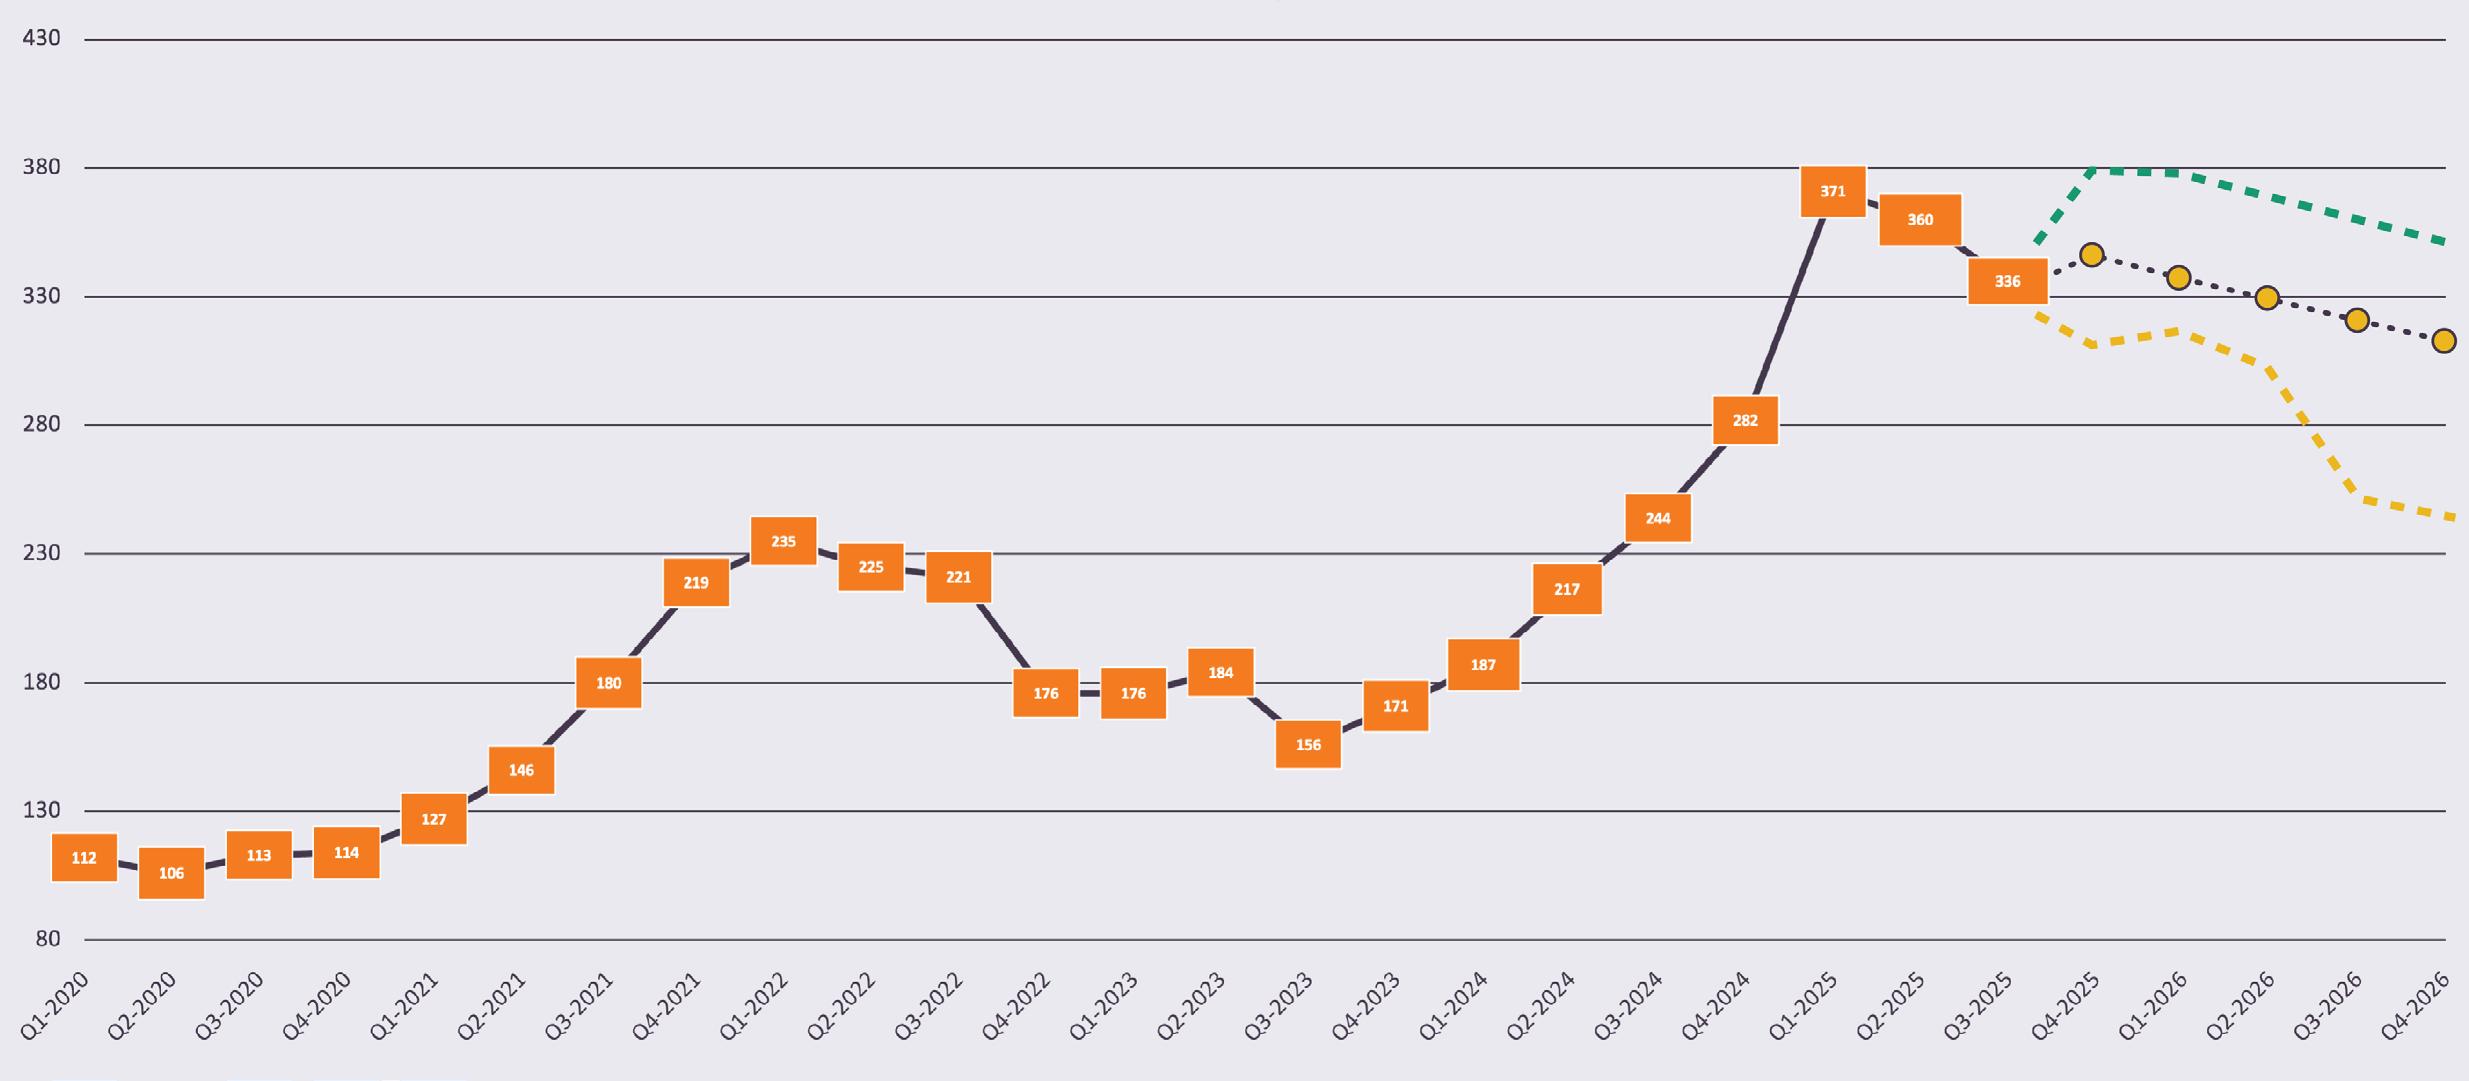
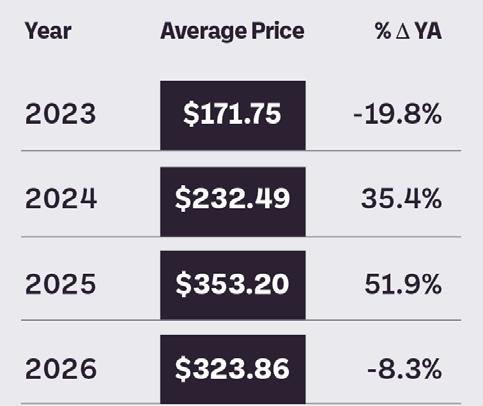
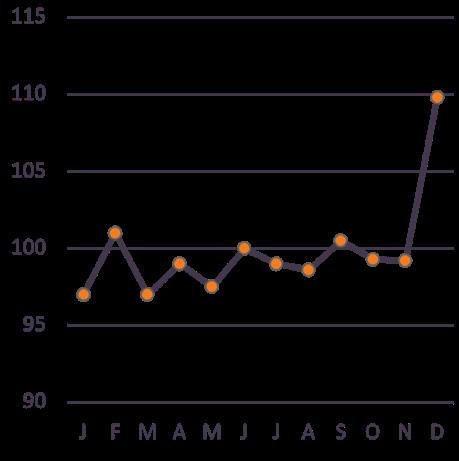

• Sugar prices have declined, with beet sugar prices reaching 40 cents/lb. and refined cane sugar prices at 52 cents/lb.
• Sugar production is expected to increase for FY 2026, for another year of record production.
• Demand is slow, with deliveries expected to decline for the 3rd year in a row.
• Record crop year production and decreasing demand continue to keep prices depressed.
• Beet sugar prices are expected to decline 9%, towards 38 cents/lb., into 2026.
• Outlook for 2026: Tariff pressure and increased cane sugar demand are expected to keep cane sugar prices from declining as much as beet sugar, with those prices expected to decline 5% to around 49 cents/ lb.
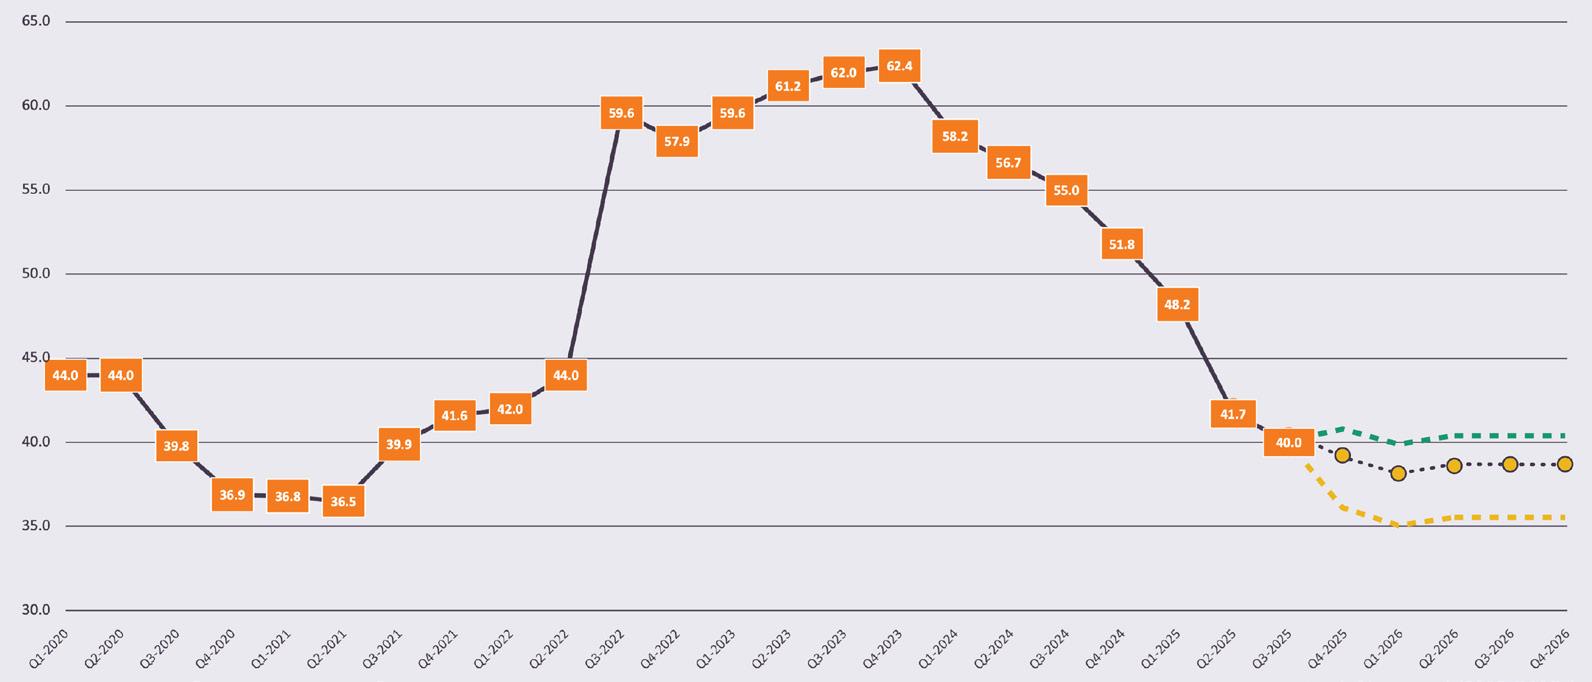
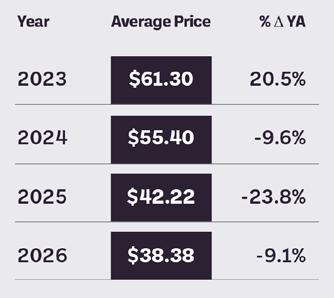
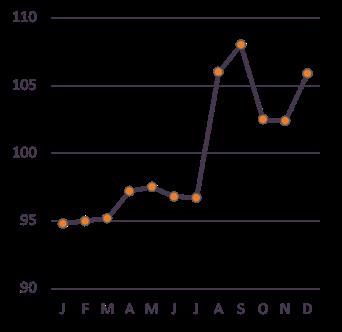
Source: Fresh Concepts

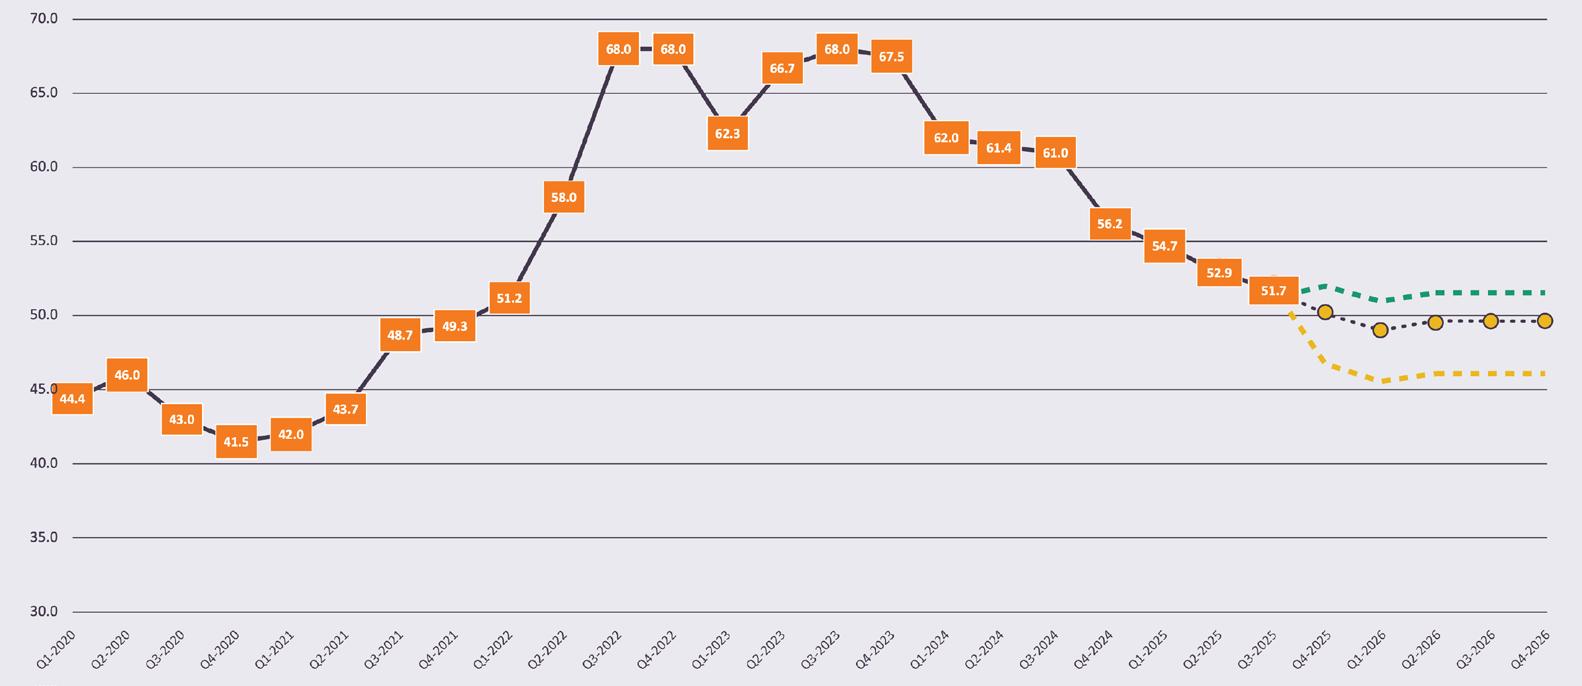
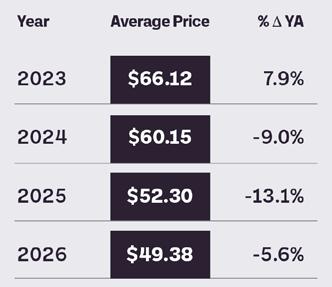
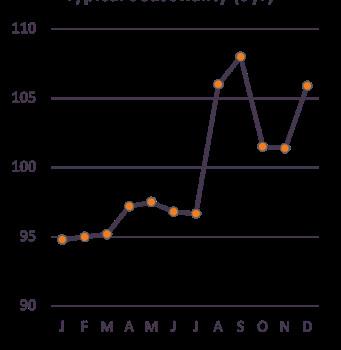
The 2026 avocado market is expected to firm compared to late 2025, with lighter Loca and Aventajada crops supporting higher averages through midyear. California’s smaller alternate-bearing crop will provide less supply between May and August, creating a window for pricing strength. Peru and Colombia will add fruit in the summer months, but their impact remains secondary to Mexico’s dominance.
Demand is expected to stay strong across both retail and foodservice, particularly around holiday and sports-related consumption peaks. Prices are likely to mirror the stronger tone seen in 2024, with seasonal volatility peaking in Q2 and Q3 before easing in Q4.
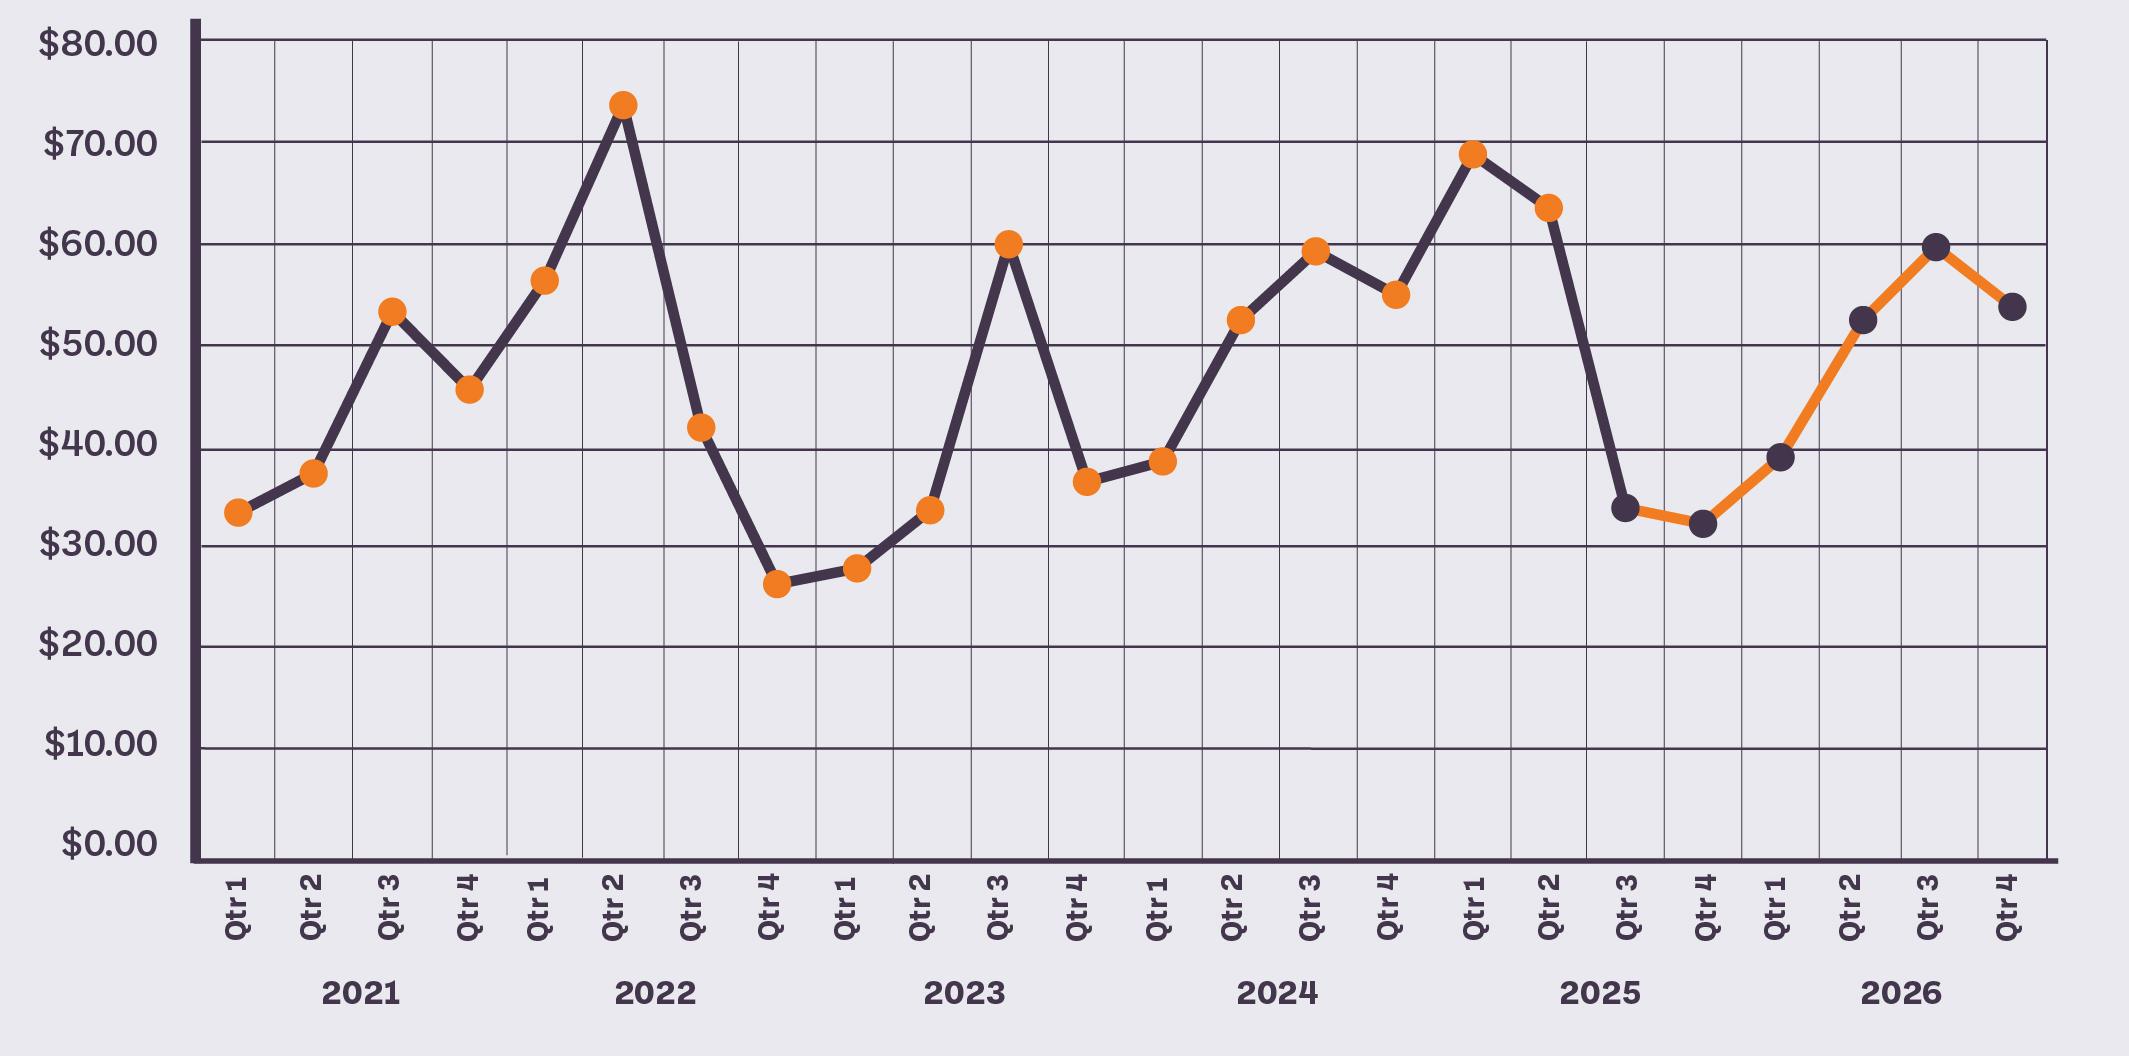
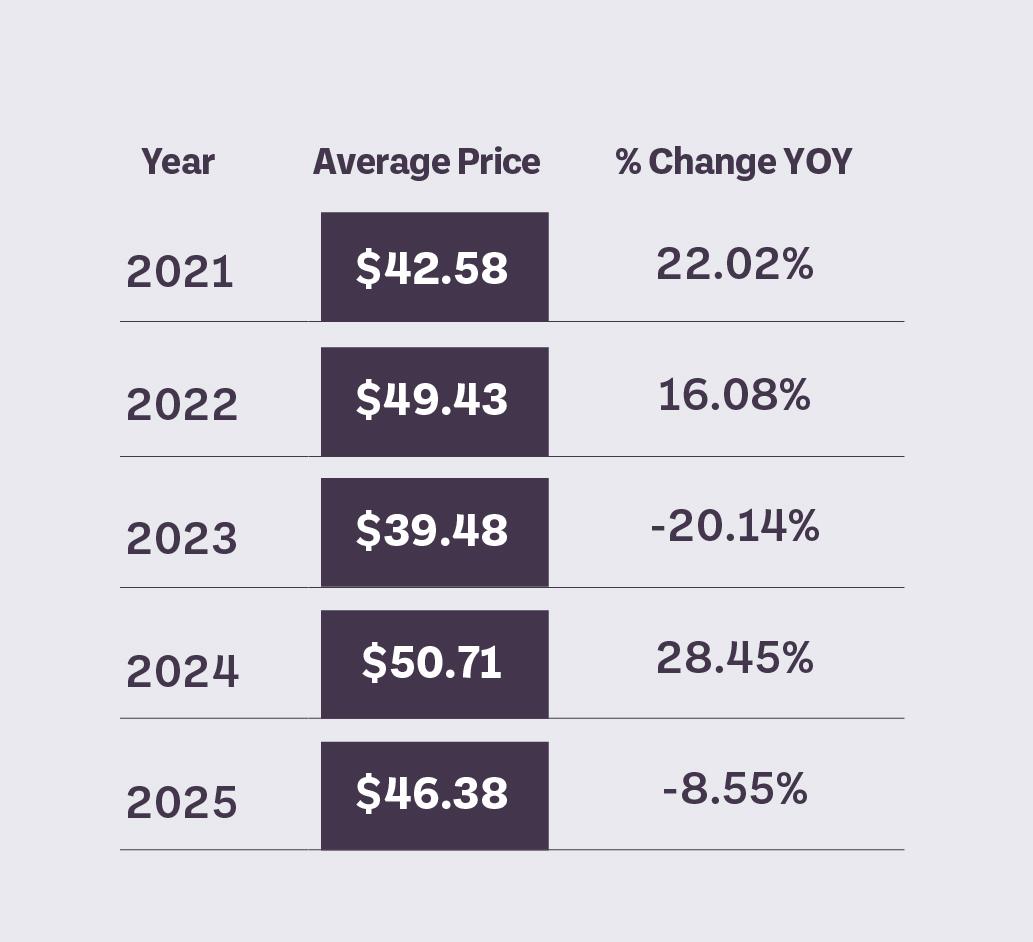
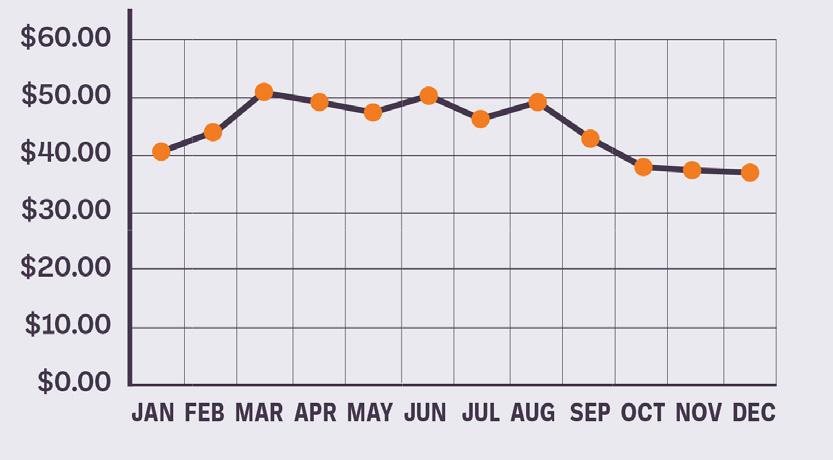

Bell pepper supplies in 2026 should remain broadly adequate, with Mexico and Florida anchoring the winter and spring before Georgia and local deals come in during summer. Pricing will fluctuate around transitions, but fewer winter storm risks under La Niña conditions could allow steadier output in the early season.
Quality differentiation will matter, as fewer premium-grade #1 Large peppers are expected compared to Choice fruit. Demand is projected to be stable, suggesting pricing will hover near historical averages with modest firmness during tighter windows. By Q3, heavy local overlap will soften the market before tightening again into the Q4 transition back to Mexico and California desert regions.
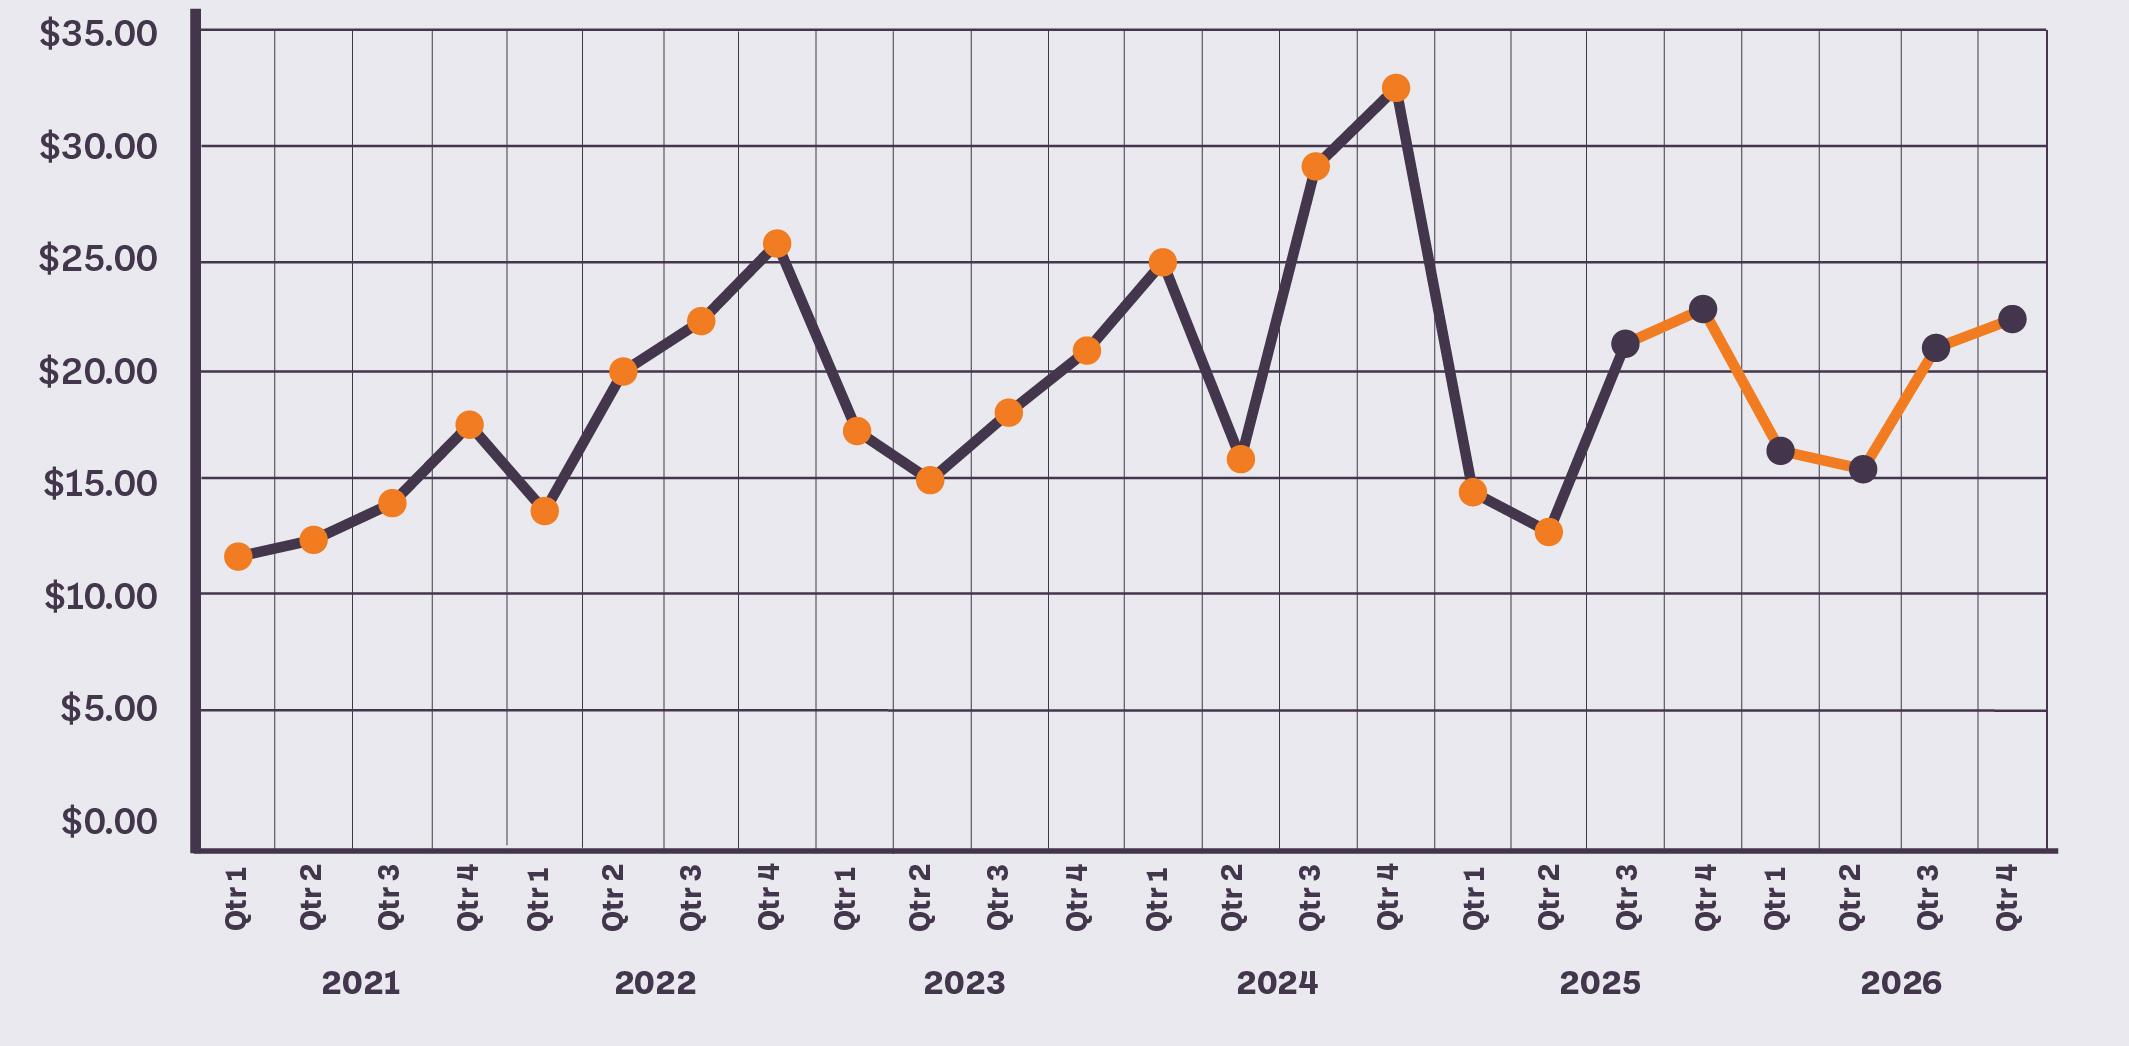
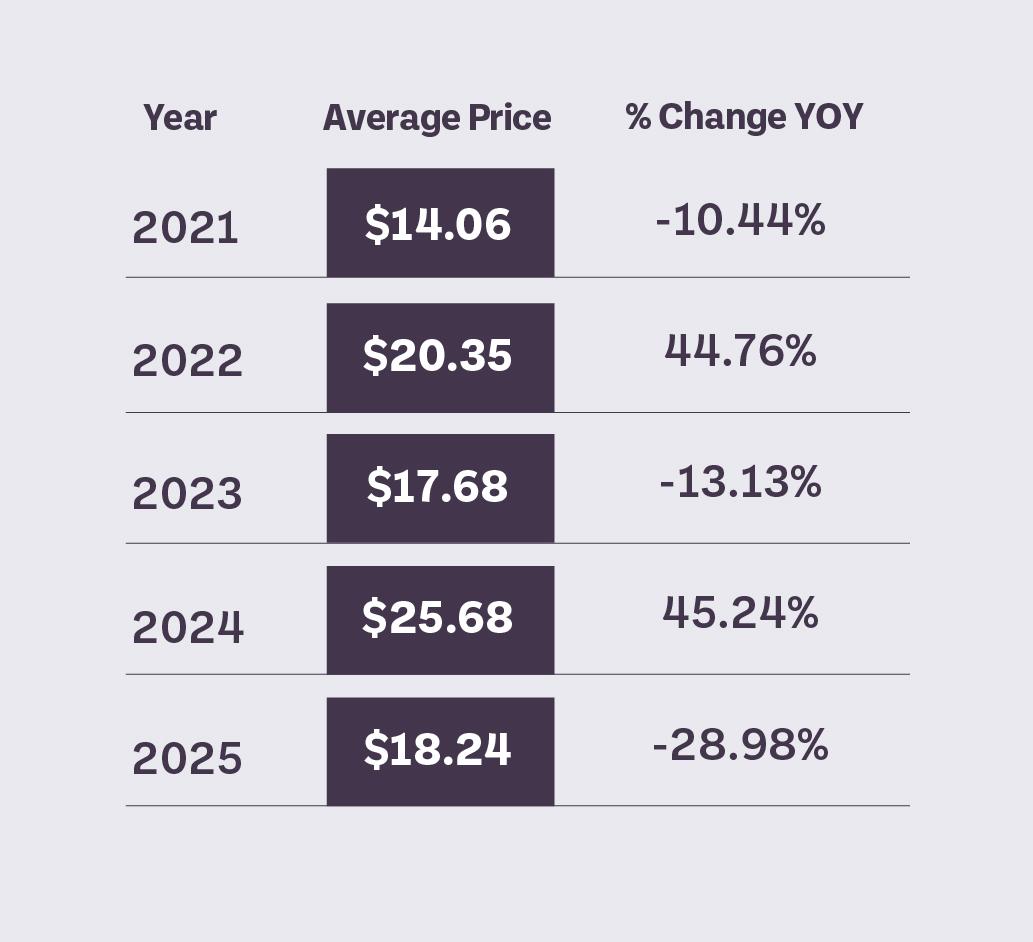
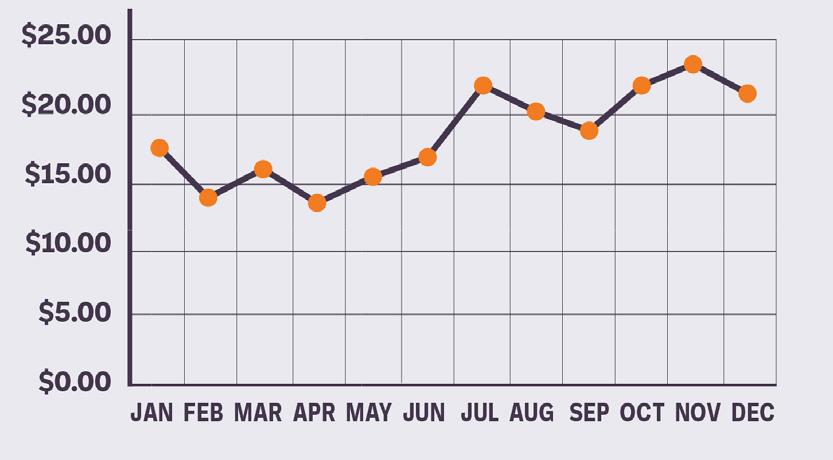
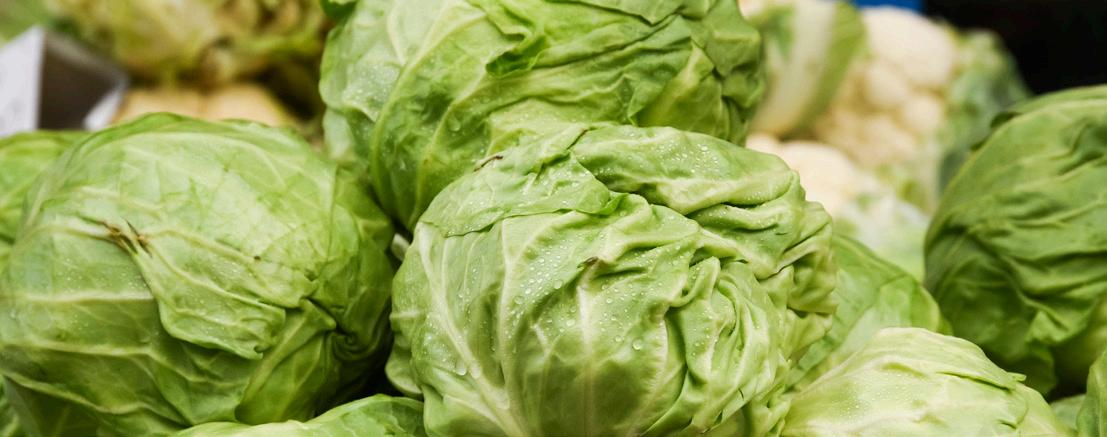
Iceberg lettuce in 2026 is projected to follow its classic seasonal rhythm, with Yuma driving Q1 supplies and a volatile transition into Huron and Salinas in Q2. That spring handoff will be the riskiest period, as heat and wind events could cut weights and shelf life, creating sharp short-term rallies. Summer in Salinas should deliver steadier supplies and lower prices, offering buyers the most favorable window in Q3.
By Q4, as production shifts back to Yuma, the market typically firms again. Overall, the bias is toward stability with only transitional volatility expected, rather than extreme spikes.
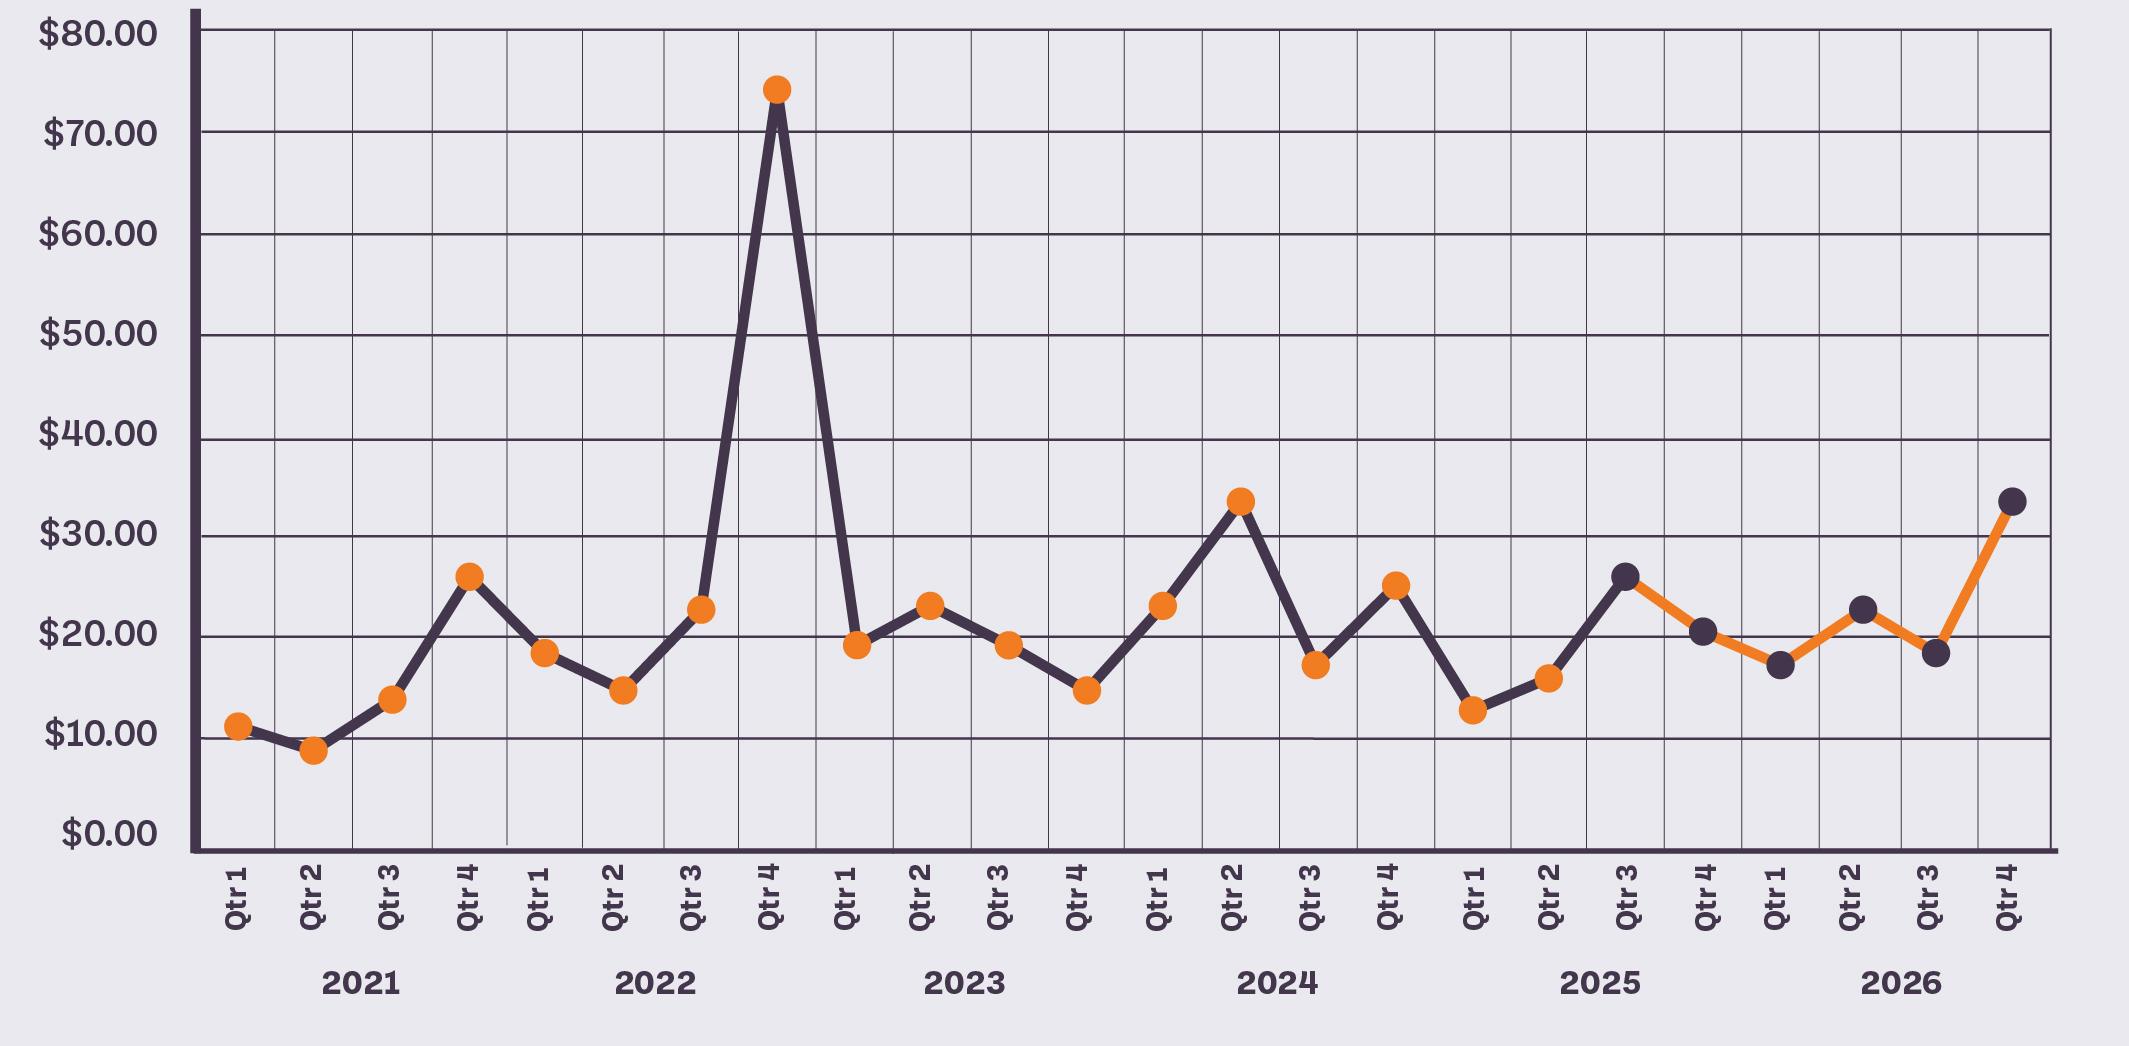
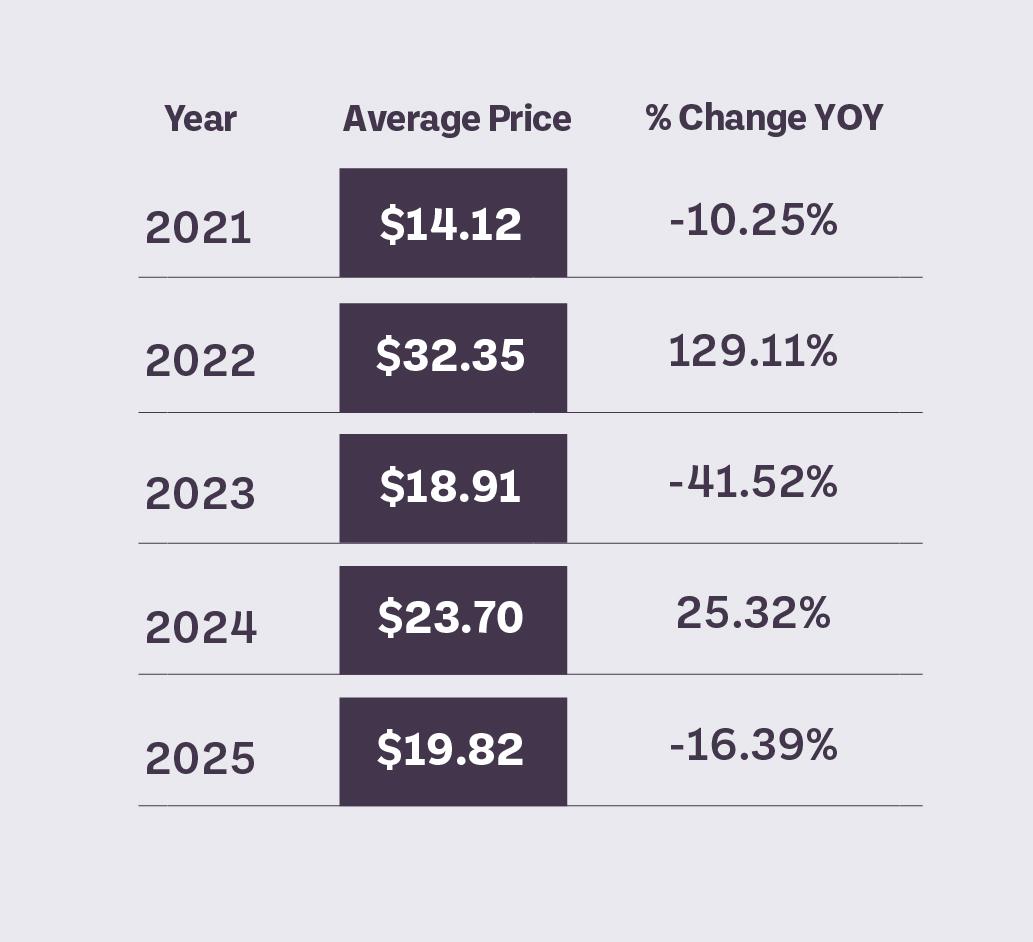
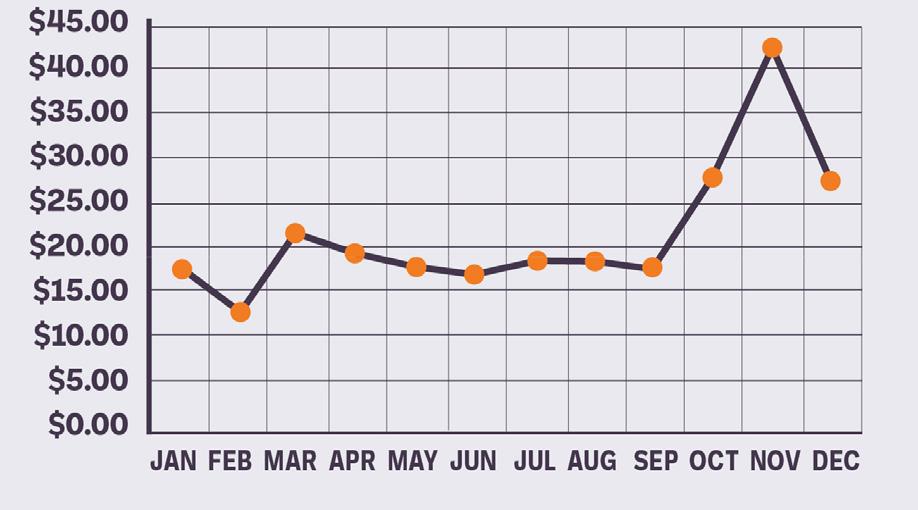

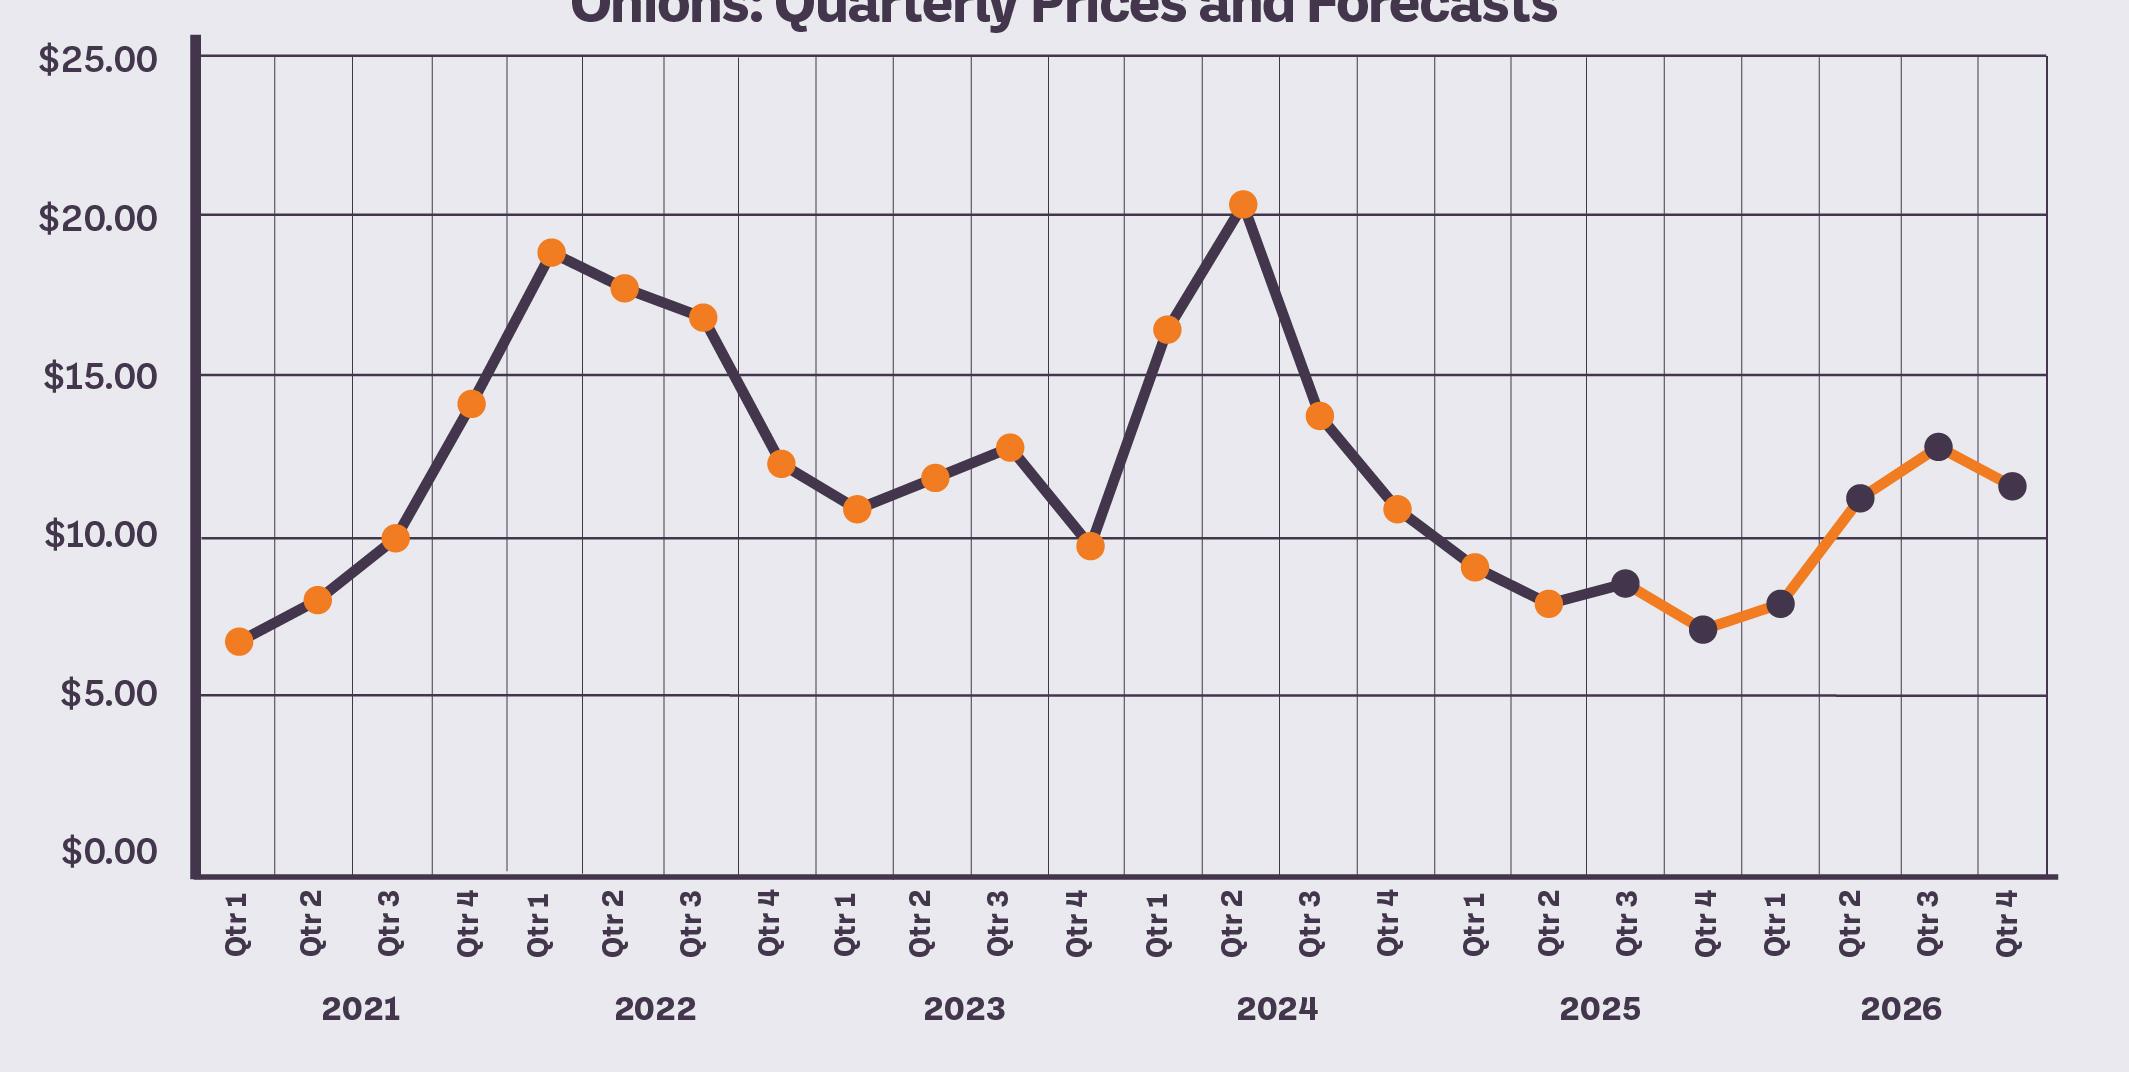
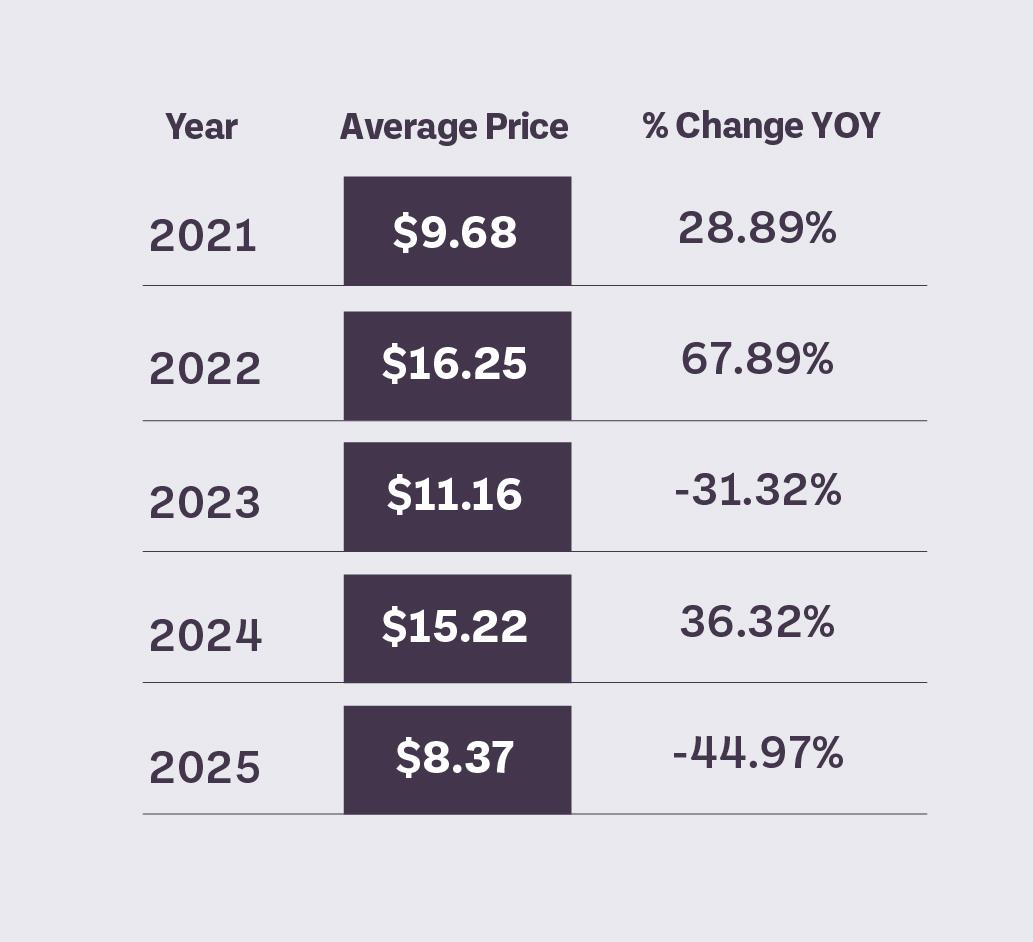
Onions should maintain balance into 2026, anchored by strong storage crops out of the Pacific Northwest and smooth seasonal transitions into California and New Mexico. The market will likely see its most notable volatility in the spring, when storage onions taper and fresh crops come on, as even minor timing mismatches can briefly firm pricing. Summer supplies are expected to be plentiful, keeping Q3 prices in check.
As new PNW onions return in Q4, growers are likely to pace storage movement, supporting a modest firming into year-end. Without significant weather or quality disruptions, the market should stay within historical ranges, avoiding the extreme swings seen in other produce categories.
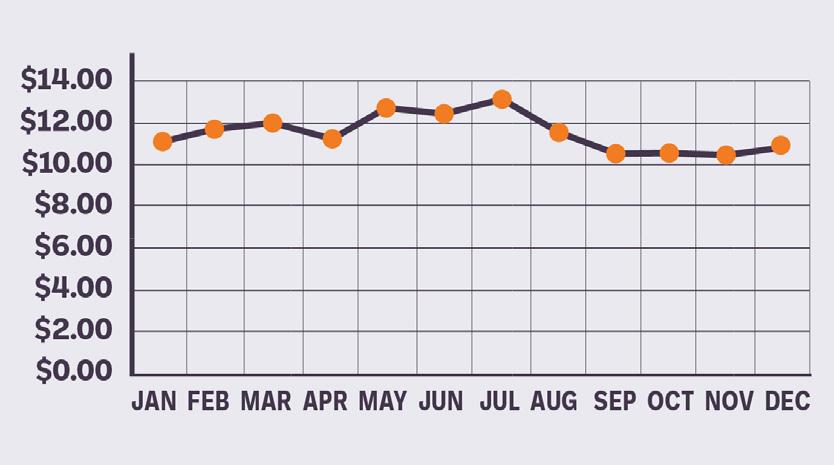
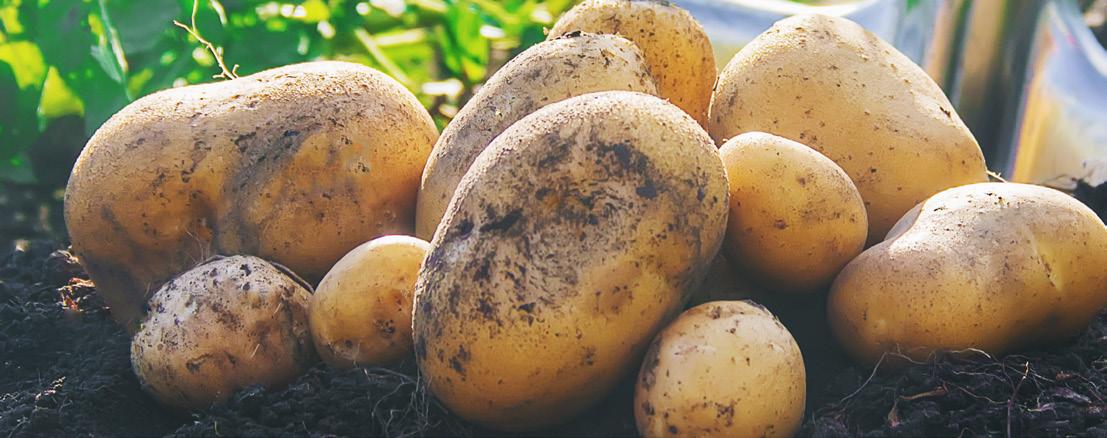
Idaho russet acreage is projected to decline modestly heading into 2026, though favorable growing conditions in the Northwest could still produce solid yields and maintain overall volume. With fewer planted acres, supplies will be somewhat tighter, but high yields could offset much of that reduction depending on weather and harvest outcomes. The fresh russet market is likely to see softer pricing pressure during the fall harvest and early storage season, when availability is at its peak.
Through the year, quality, storage longevity, and shipping demand will determine how quickly supplies move and whether prices firm into late spring and summer. Overall, the 2026 Idaho russet market should be relatively balanced, with prices trending softer in the immediate post-harvest window and gradually firming into Q2 and Q3 before stabilizing again in late 2026.
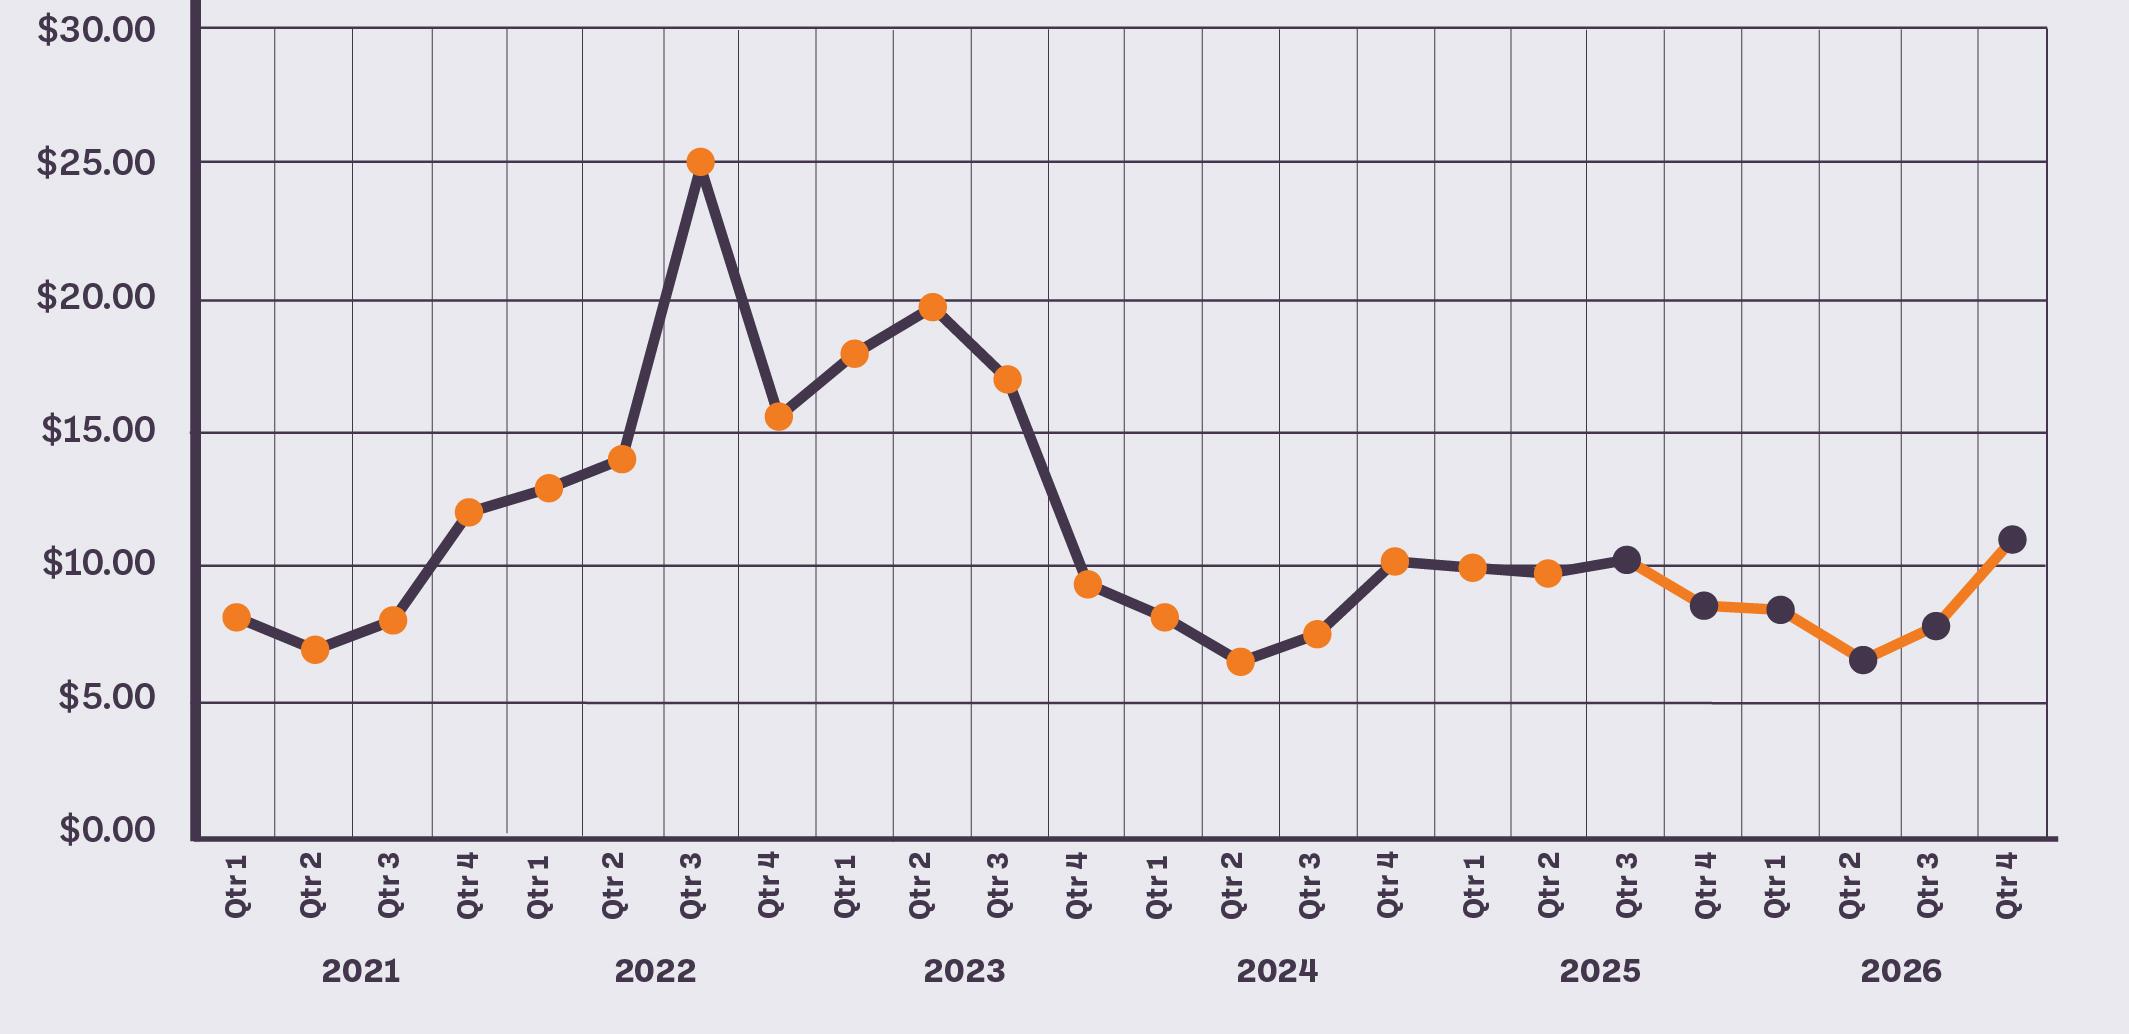
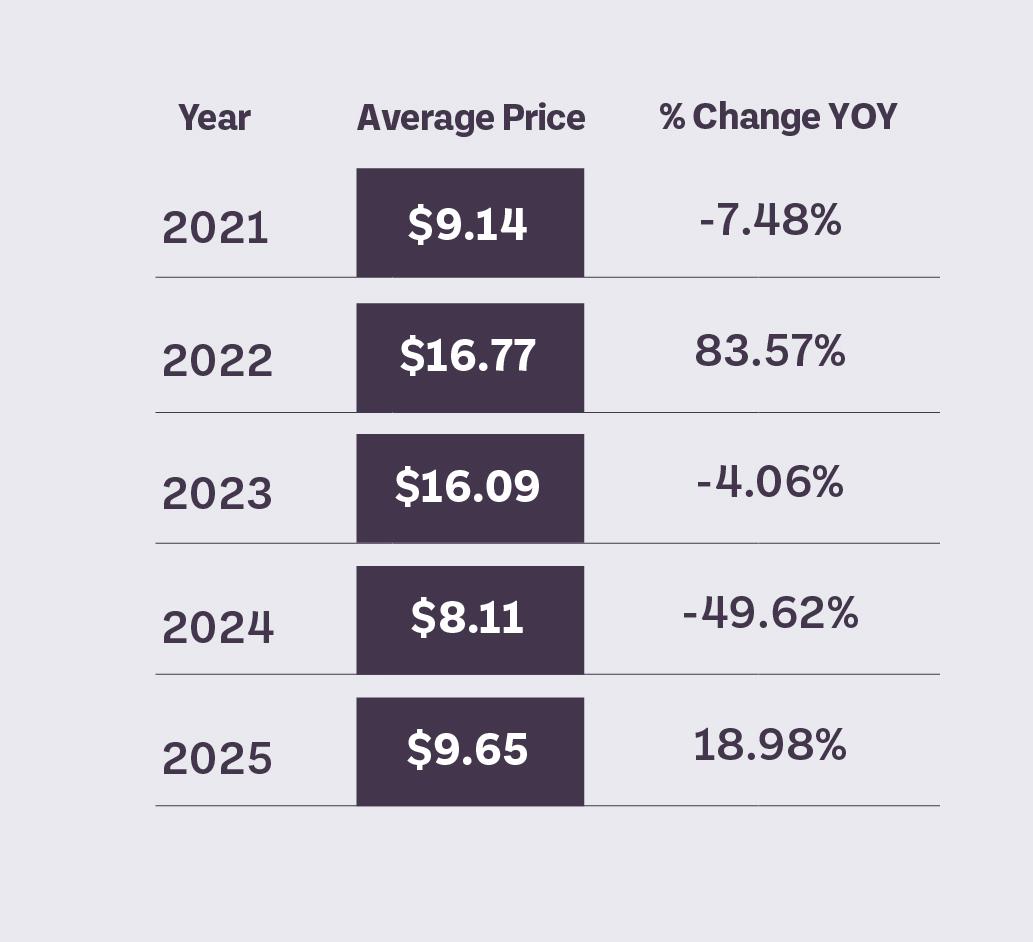
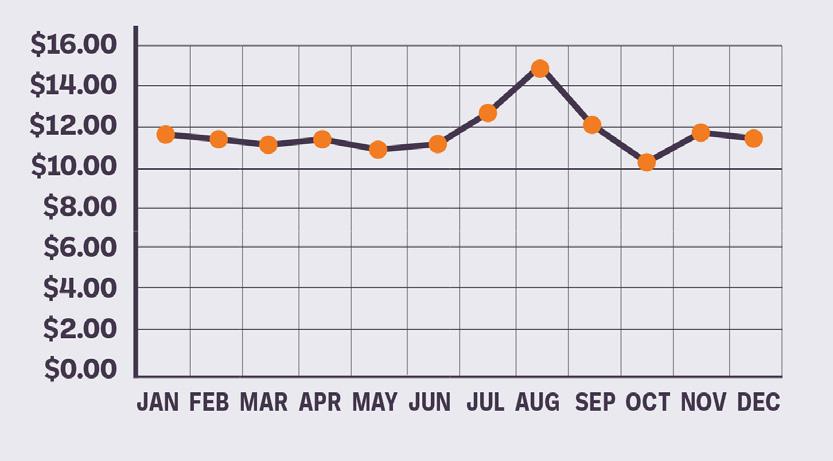

The tomato market in 2026 faces a structurally higher price environment after the end of the US-Mexico Suspension Agreement and the introduction of tariffs on imports. Mexico will remain the dominant supplier but is contending with water shortages that may constrain exportable volume, limiting supply flexibility. Florida and Georgia will provide solid coverage in the spring, and Baja and California will continue to support Western supply, though none can fully replace Mexico’s role.
The higher import cost base will make promotional activity more expensive, reinforcing a firmer floor across all quarters. Seasonal transitions will still bring short bursts of volatility, but the overarching trend is a market that operates at a higher plateau than in recent years.
• U.S. kraft linerboard exports to China have dropped significantly due to tariff pressures.
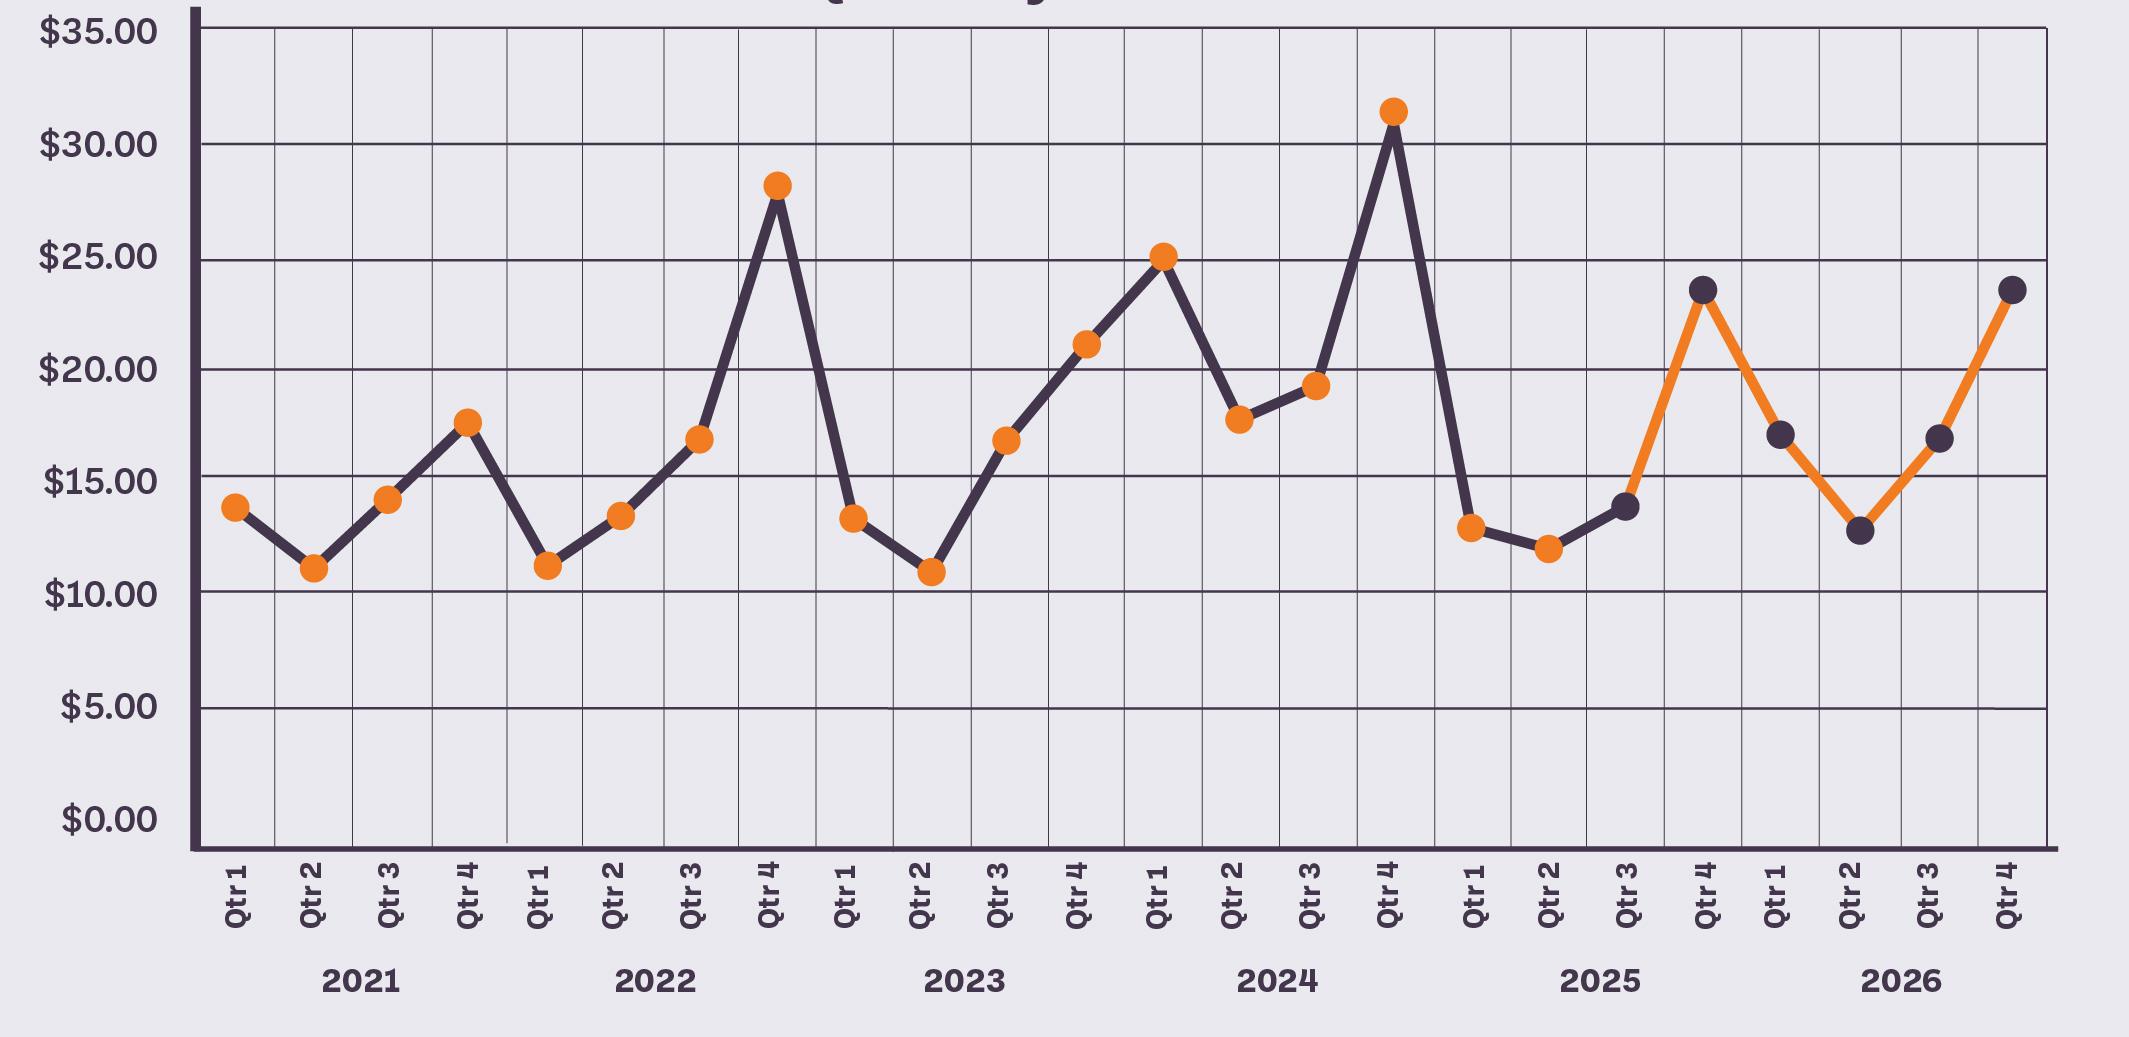
• Exports to China were down 58% YTD according to Fastmarkets; many export destinations have ample supply and high inventory.
• Planned mill closures will reduce linerboard capacity, which may in turn raise prices.
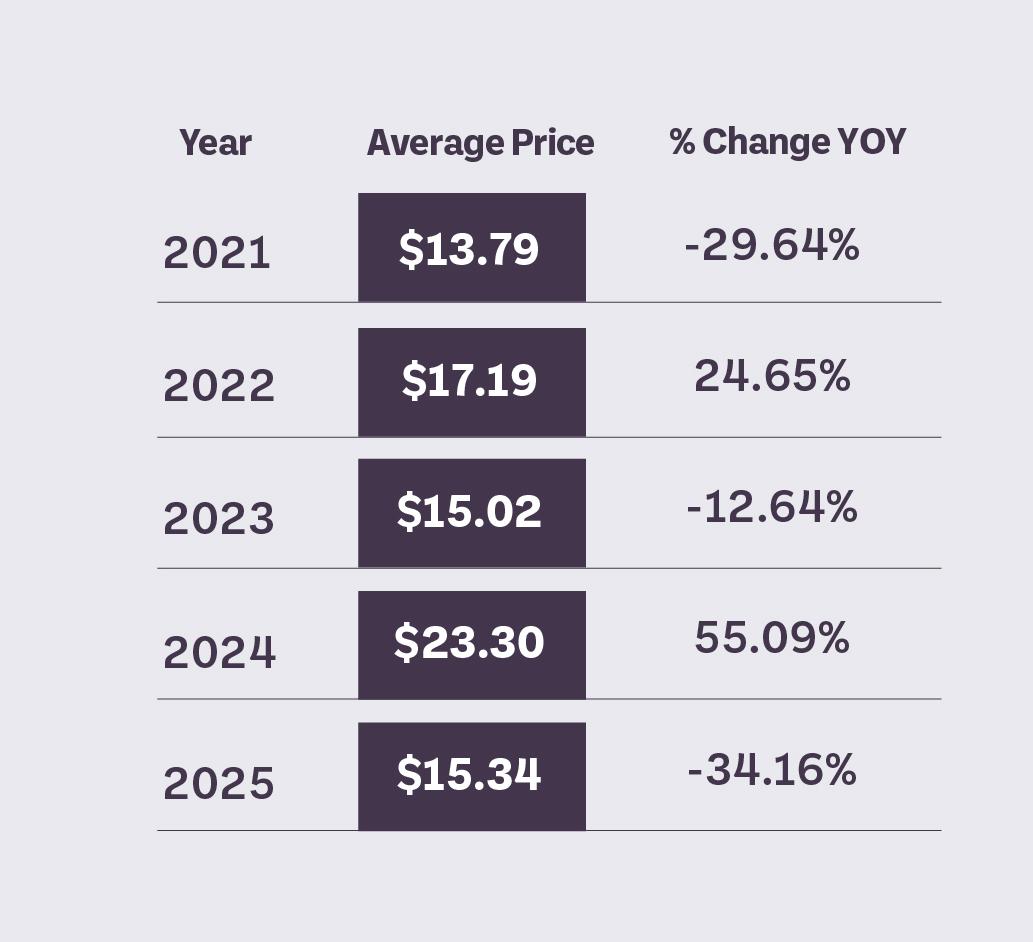
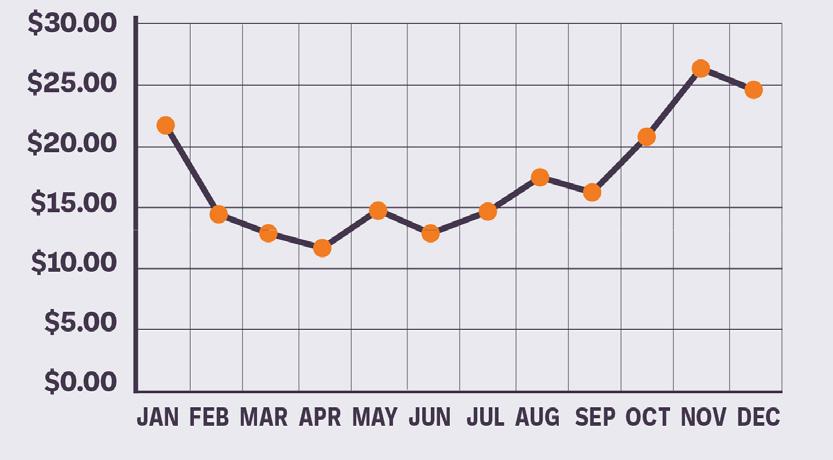
• While projected linerboard price increases may be on the horizon, linerboard prices have remained steady for most of 2025.
• Linerboard and Medium prices are flat.
• Several major U.S. linerboard mills are shutting down — most notably International Paper’s Campti, LA mill and Georgia-Pacific’s Cedar Springs, GA, mill. Combined, these closures account for nearly 5% of the U.S. containerboard capacity.
· These closures may tighten export capacity further but haven’t yet triggered widespread price hikes domestically due to mixed demand signals.
· We will continue to see weak demand for corrugated packaging. Producers have announced downtime and shutdowns to reduce supply.
Smurfit Westrock will close plants in Cedar Rapids, IA, St. Paul, MN, Fortney, TX, Portland, OR, and Bridgeview, IL. International Paper will close the Buena Park, CA plant. Cascades will close the Niagara Falls, NY plant.


• Polypropylene
· Crude Oil and Natural Gas prices will be a factor in these prices.
· Demand is softening.
• Polystyrene
· The feedstock for PS is benzene — this has been volatile this year, and prices have behaved accordingly — some up, some down depending on the month.
• Polyethylene
· Stable with flat demand.
• PET
· Prices have turned downward.
· Demand for beverages was unusually weak over the summer months of 2025; no big shift from cans.
· The current administration has announced that imports of polyethylene terephthalate (PET) and recycled PET (rPET) will be subject to full tariffs. The materials were previously exempt from the heightened tariffs, and the decision has raised “significant concerns” within the Southeast Asian and South Asian rPET markets.
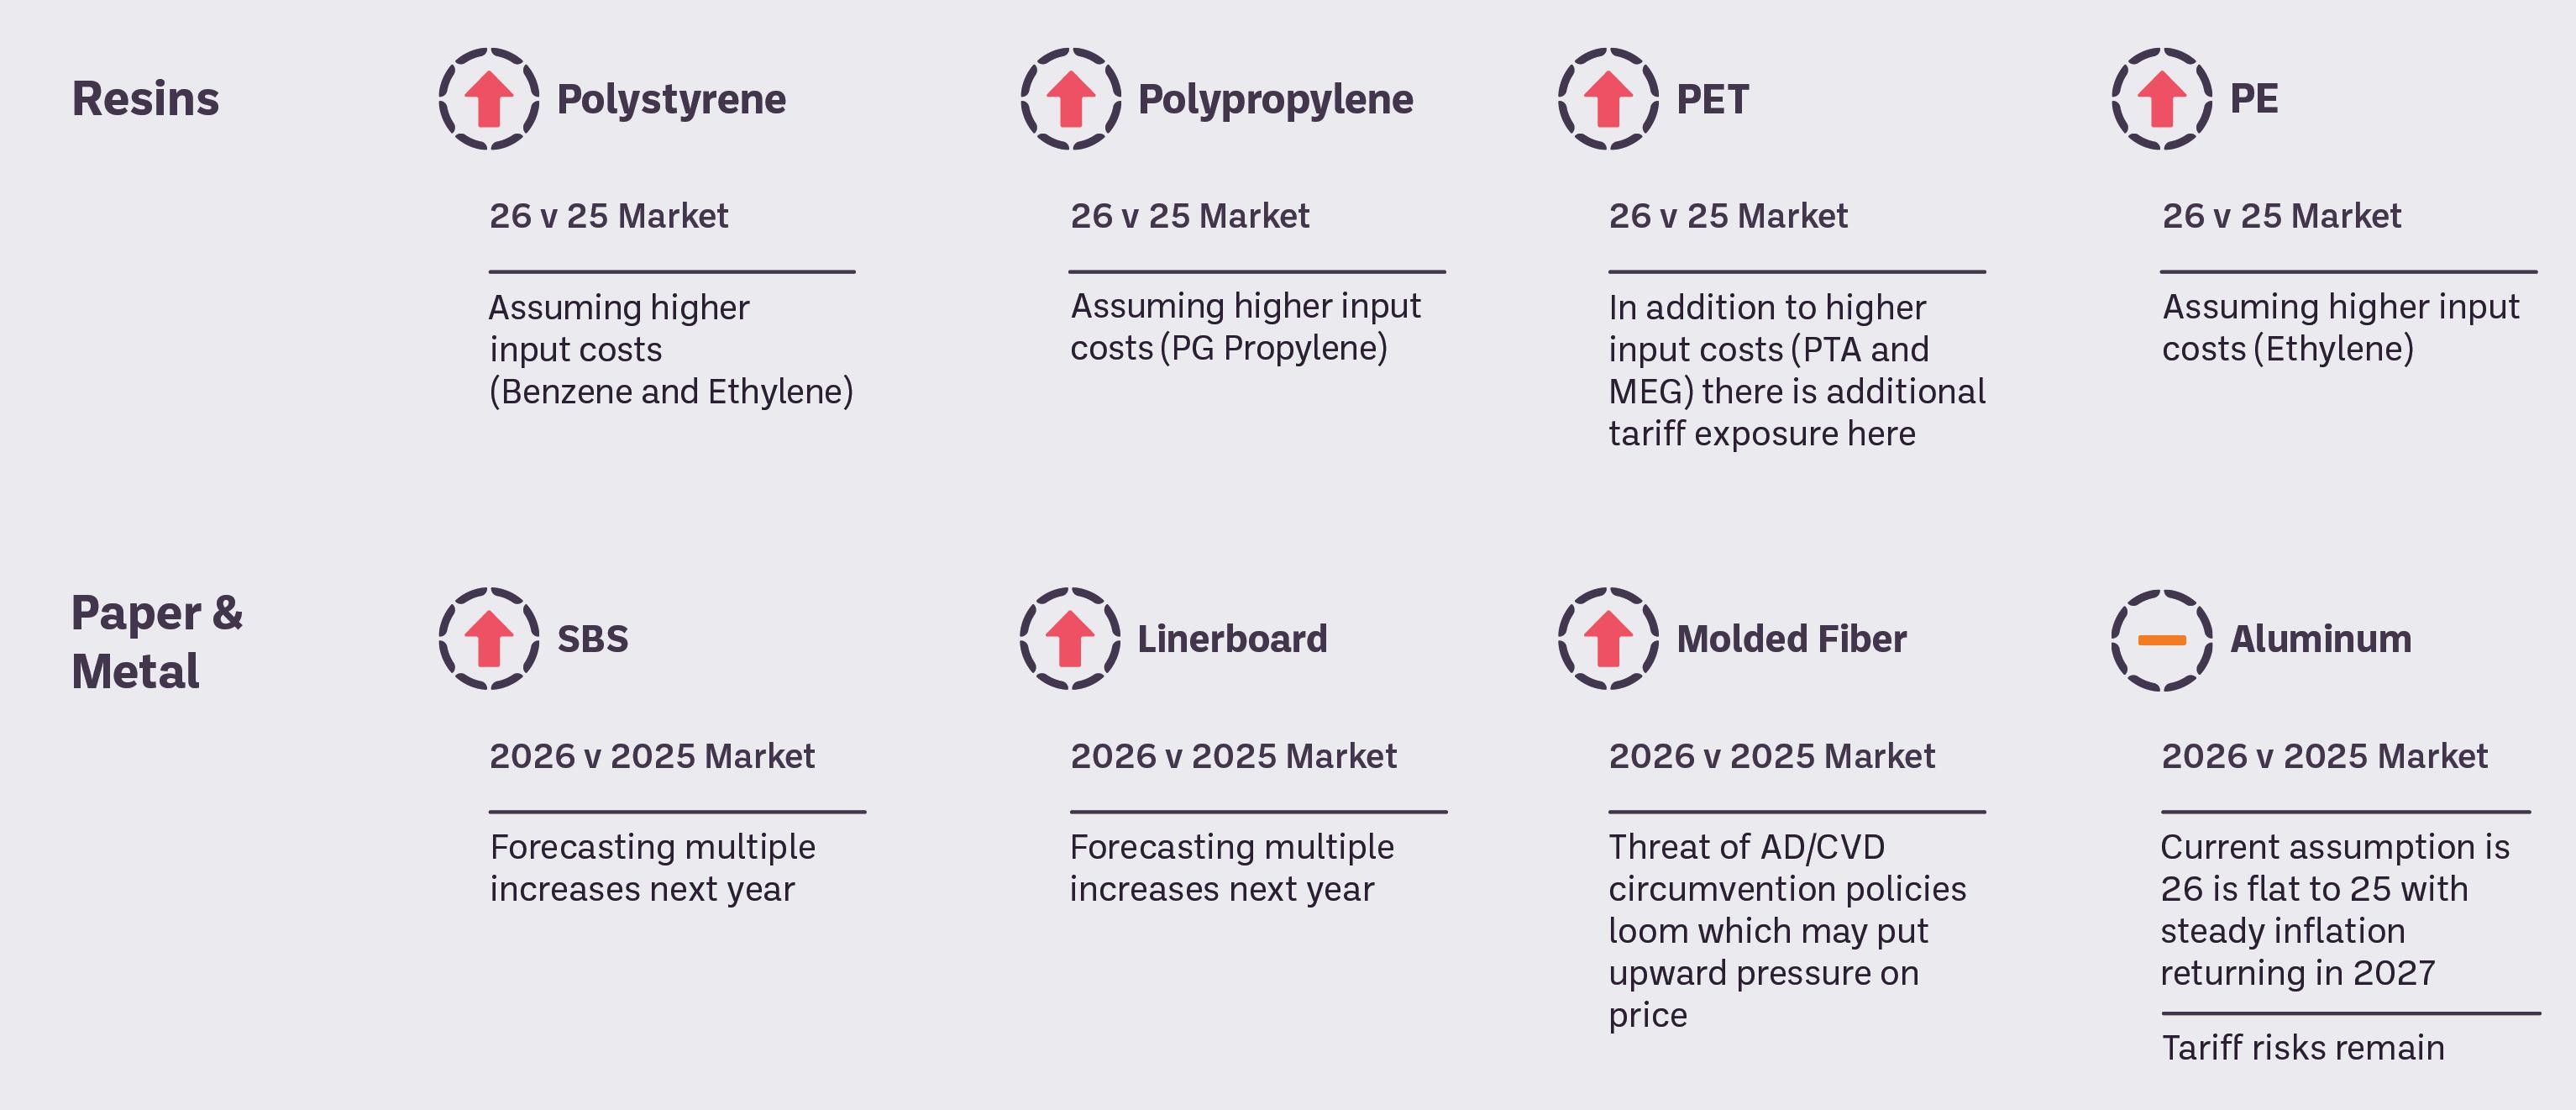
• Outlook into 2026: We will continue to see lower demand for polyethylene and polypropylene resins.
• The International Textile Manufacturers Federation (ITMF) warns that sweeping U.S. tariff hikes are “driving up prices” in the textile and apparel sector.
• Cotton has surged in many markets putting upward pressure on yarn/fabric costs.
• Rising industrial energy costs have increased operating costs in production regions.
• Lead times remain extended in some regions due to raw material delays and port congestion.
• Increased labor costs — areas absorbing the move away from Southeast Asia (such as Central America and Turkey) have seen double digit increases in labor costs.
• Outlook for 2026: Prices expected to rise with the assertion of higher tariffs, continued labor cost increases (particularly in Central America) and a retaliatory response to current tariffs.


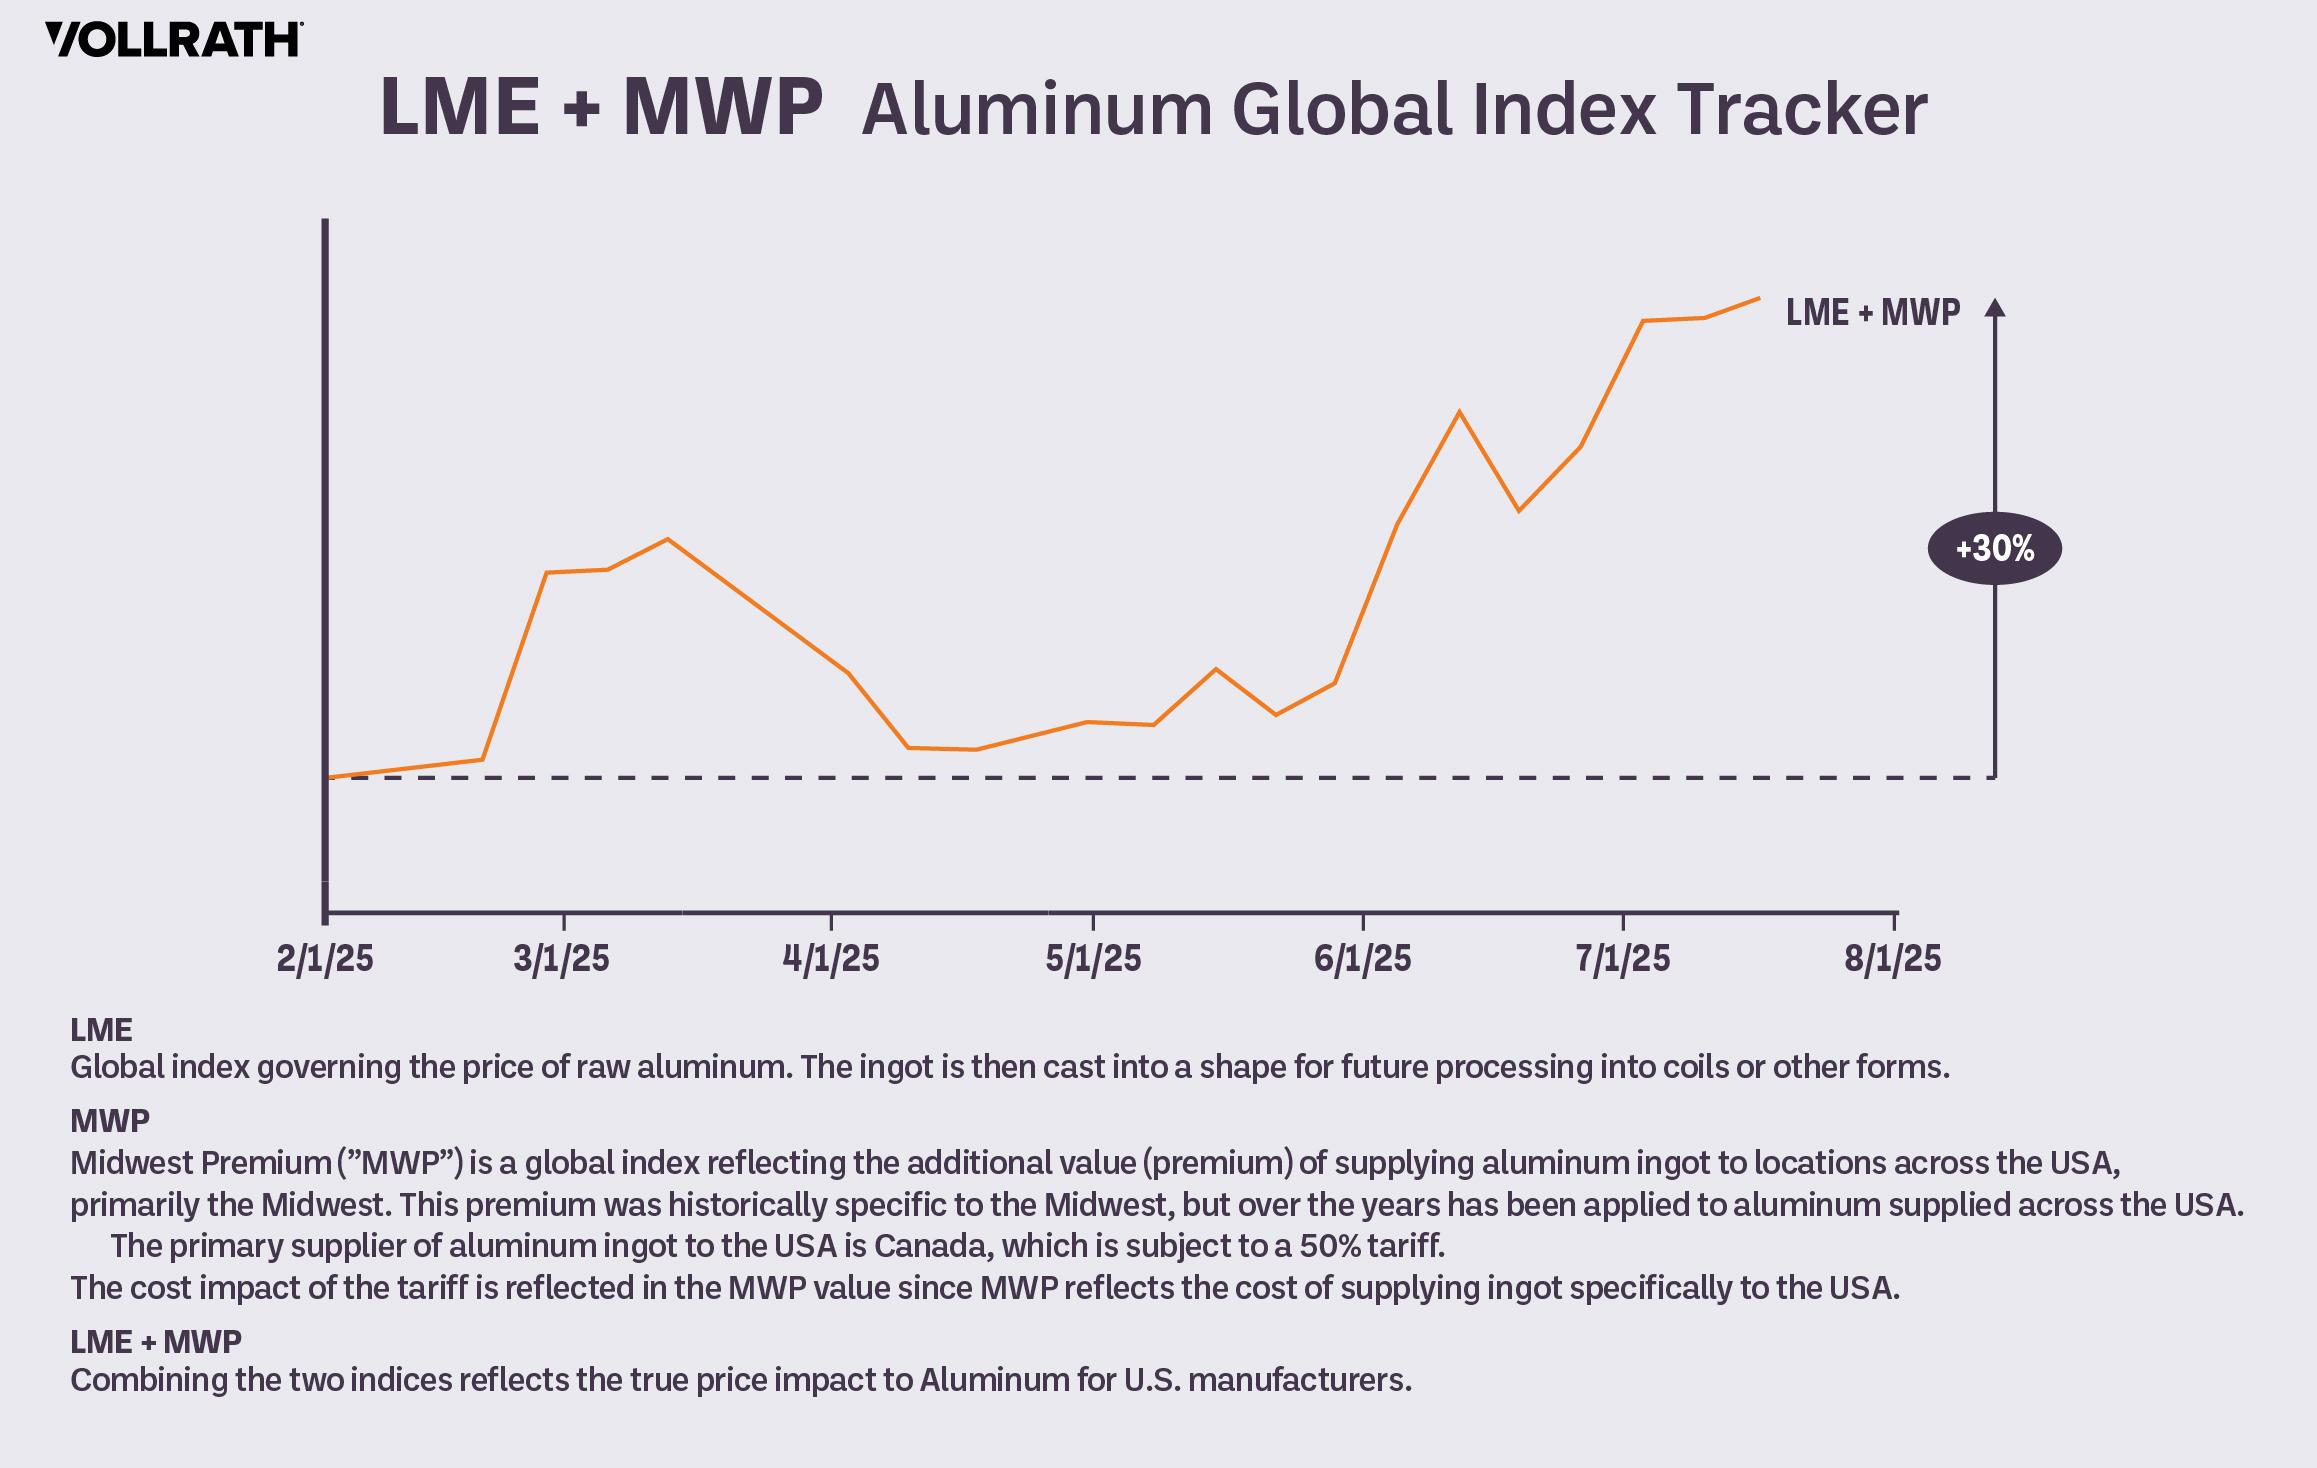
• Aluminum: Prices continue to rise and increased more than 8% in the month of September, driven by MWP or Midwest Premium processing costs. This increase is due to the raw materials transported in/out of Canada today with a 50% tariff impact on aluminum prices.
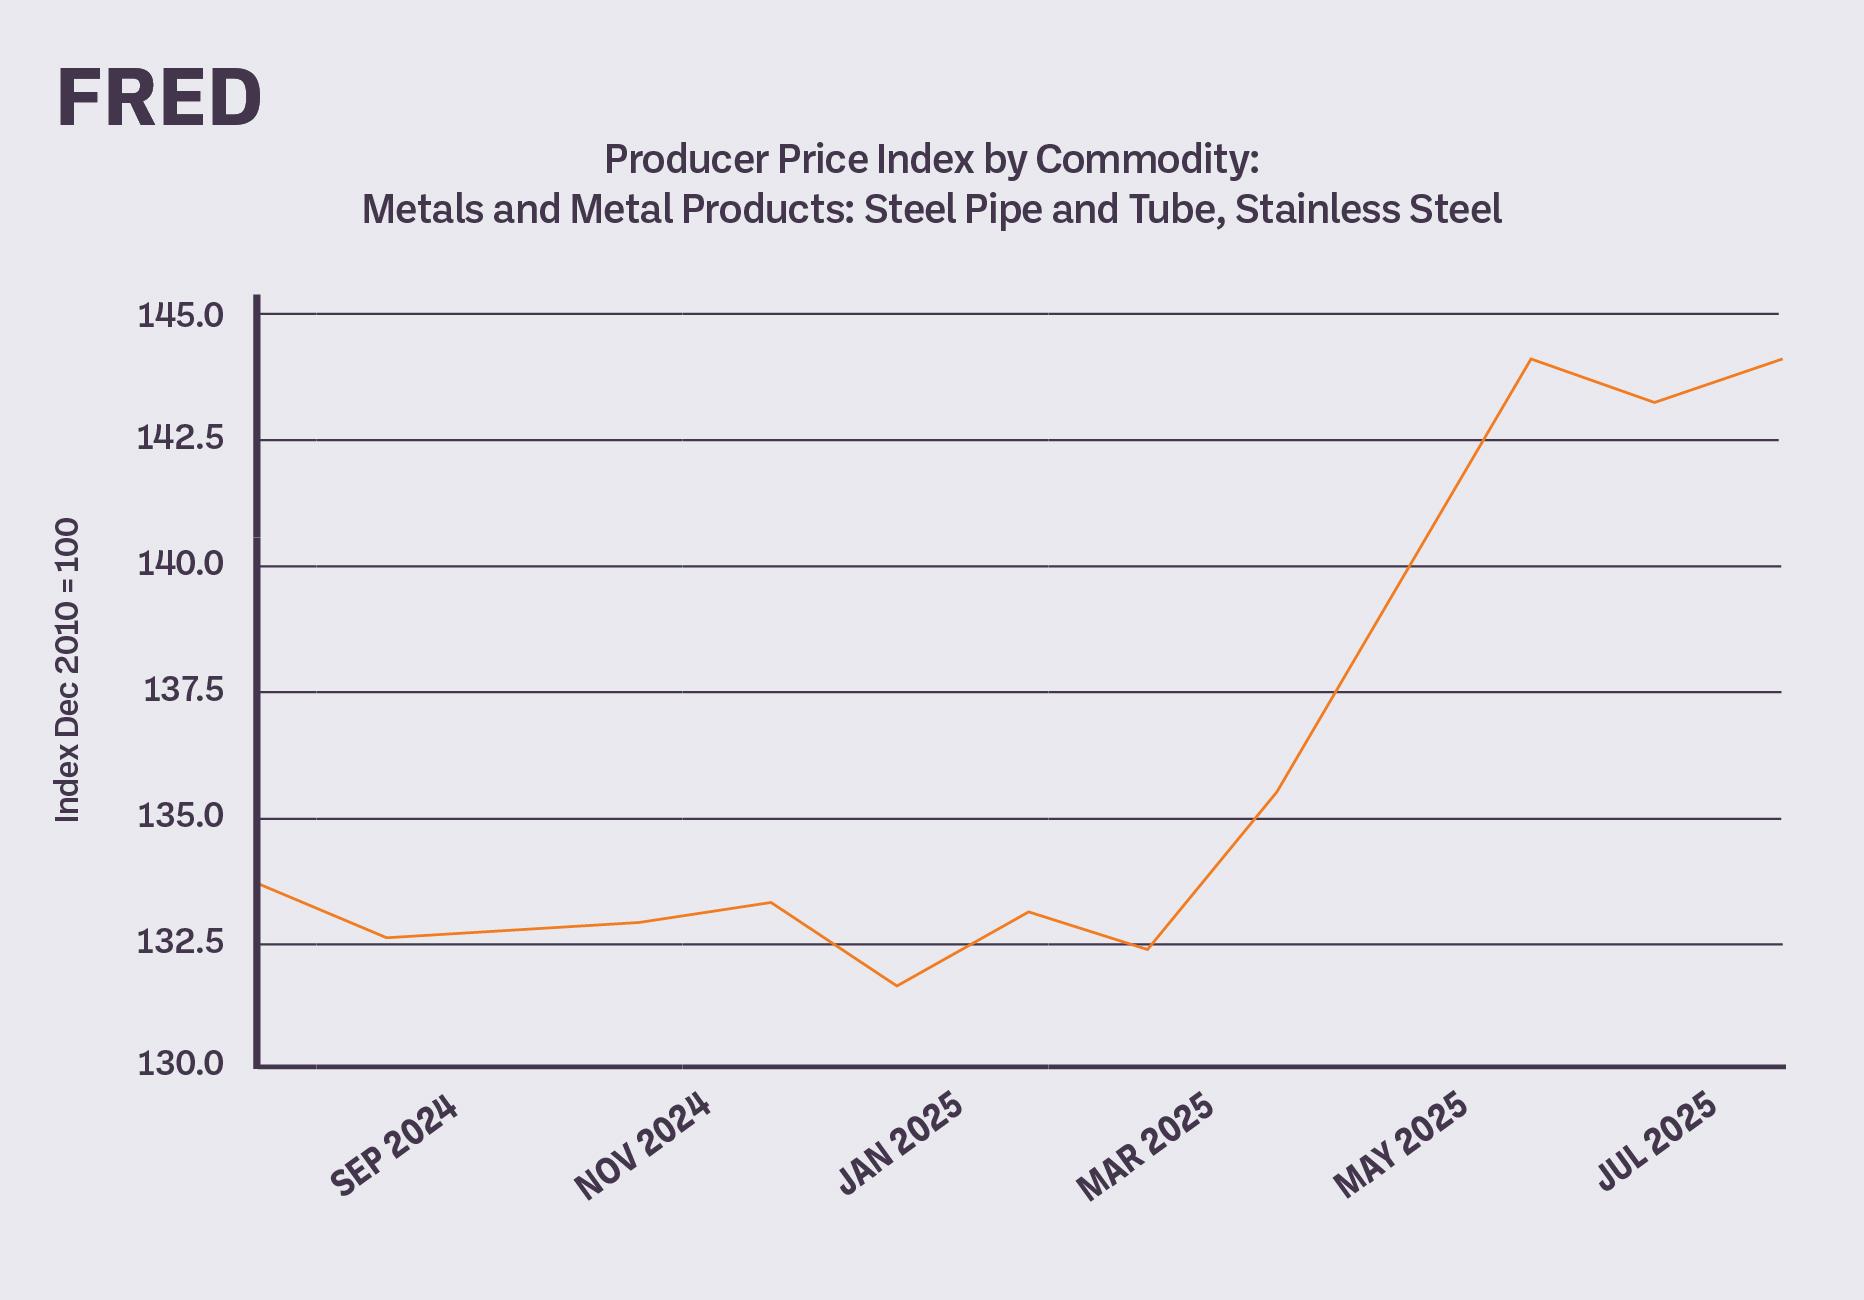
• Stainless Steel: Price remains flat, but manufacturers continue to be cautious about large investments amid high interest rates.
• Market Dynamics: The U.S. market is starting to see more impact due to inventory diminishing from tariffs implemented earlier in 2025. Europe continues to see supply risks and tariffs which impact any regional pricing.
• Tariffs: Equipment is being impacted by tariffs from China for components and transportation costs between Canada and the U.S.
• Outlook for 2026: While aluminum prices are projected to increase in the U.S., the outlook for stainless, if not imported from China, remains more stable.
Source: U.S. Bureau of Labor Statistics/FRED®
Entegra is the procurement partner that helps hospitality-driven businesses shine. With significant savings, digital tools, and strategic services, we make it easier to meet your business goals.
Visit EntegraPS.com for more resources.


Entegra Culinary Consulting
Reimagine your hospitality business’s performance with your strategic partner for culinary excellence and operational success. From margin improvement strategies to recipe menu development, ECC brings you cost, time, and labor-saving strategies to make your business more efficient, profitable, and memorable.
See Entegra Culinary Consulting

Energy solutions
Don't tackle energy price volatility alone. Entegra’s advisors can help you mitigate the ever-rising costs of energy with our comprehensive Energy Management Solutions.
See our energy solutions
Read our energy service guide
Other resources from Entegra
Client exclusive content
• Inflation Reports
• Program and Pricing Updates
• Commodity Reports
Added value content
• The Operational Efficiency Guide
• Bringing Hospitality to Life
• Why join a GPO?