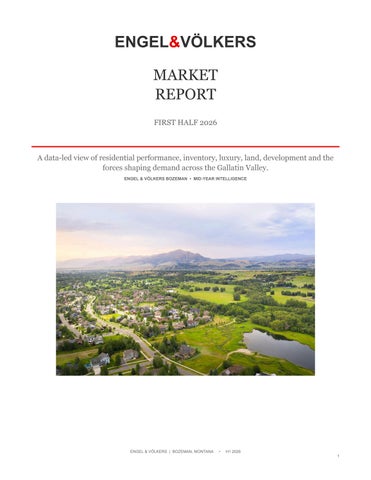
ENGEL&VÖLKERS MARKET REPORT FIRST HALF 2026
A data-led view of residential performance, inventory, luxury, land, development and the forces shaping demand across the Gallatin Valley. ENGEL & VÖLKERS BOZEMAN • MID-YEAR INTELLIGENCE
ENGEL & VÖLKERS | BOZEMAN, MONTANA
•
H1 2026 1
CONTENTS H1 2026 | BOZEMAN MARKET REPORT
A concise guide to the market data, local forces and forward-looking themes covered in this report.
Executive Summary
3
H1 at a Glance
3
Where the Market Is Moving
4
Single-Family Homes
5
Condos & Townhomes
5
Luxury Market
6
Land, Ranch & Open Space
7
Inventory
7
New Construction & Development
8
Growth Policy & Infrastructure
8
Affordability
9
Why Bozeman? Economic & Demand Drivers
10
Connectivity: BZN + MSU
10
What We’re Watching in H2
11
Market Perspective
11
About Engel & Völkers Bozeman
12
Sources & Methodology
13
ENGEL & VÖLKERS | BOZEMAN, MONTANA
•
H1 2026 2
A Market With More Choice… And More Consequence Bozeman entered 2026 with a market that is neither retreating nor racing. Instead, the first half of the year rewarded precision: buyers had more leverage and more inventory to evaluate, while sellers faced a clearer test of pricing, presentation and property quality. The strongest through-line in the data is segmentation. More than half of audited residential closings occurred below $750,000, while active inventory was distributed more heavily into higher price tiers. That gap matters: it suggests demand remains broad, but not equally deep at every price point. Luxury property continues to transact, yet the upper end carries a larger share of available supply than of completed sales. At the same time, Bozeman’s structural demand story remains unusually durable for a market of its size. Population continues to expand, Montana State University anchors employment and research, Bozeman Yellowstone International Airport is adding capacity and connectivity, and large-scale residential and mixed-use development is reshaping the west side and Triangle corridor. The result is a market becoming more complex - not less compelling.
532
$699.5K
56.8%
AUDITED RESIDENTIAL CLOSINGS
H1 MEDIAN SALE PRICE
CLOSINGS UNDER $750K
{Market statistics are drawn from the audited H1 2026 workbook and supporting MLS materials. The report distinguishes transaction data from current-inventory snapshots and outside contextual research.}
H1 (First-Half 2026) At a Glance 302
100
72
SALES UNDER $750K
$750K–$1M SALES
$1M–$1.5M SALES
31
175
39
$2M+ RESIDENTIAL SALES
ACTIVE RESIDENTIAL SNAPSHOT
$2M+ ACTIVE LISTINGS
The center of gravity remains below $1 million. Three out of four audited residential closings - 75.6% - fell below $1 million. The $1 million to $2 million range accounted for another 18.6%, while the $2 million-plus market represented 5.8% of closings. Active inventory tells a different story: 22.3% of the active residential snapshot was priced at $2 million or more. That divergence is one of the clearest signals in the H1 data. Buyers have meaningful choice at the top of the market, while competition for appropriately priced homes remains concentrated in the more attainable tiers.
ENGEL & VÖLKERS | BOZEMAN, MONTANA
•
H1 2026 3
Where The Market is Moving
The sub-$750,000 tier is the market’s volume engine, accounting for 302 audited residential closings. Yet it represented only 37.7% of active residential inventory in the workbook snapshot. By contrast, homes priced at $2 million and above represented 5.8% of closings but 22.3% of active inventory. For sellers, the implication is straightforward: the higher the price point, the more important differentiation becomes. For buyers, greater upper-tier selection can translate into time to compare, negotiate and prioritize property quality rather than simply availability. Source: audited H1 2026 workbook, Price Band Analysis - All Residential. Active inventory is a point-in-time snapshot, not H1 transaction volume.
ENGEL & VÖLKERS | BOZEMAN, MONTANA
•
H1 2026 4
Single-family Homes 329
$865K
27
H1 SALES*
MEDIAN CLOSE PRICE*
MEDIAN DOM*
Single-family housing remains Bozeman’s benchmark ownership product. Supporting MLS statistics for H1 show 329 single-family closings, a median close price of $865,000 and median days on market of 27. The average close price was materially higher at approximately $1.23 million, reflecting the influence of upper-end transactions on the mean.
The monthly series reinforces how uneven a six-month market can be. Reported median pricing ranged from $772,500 in March to $1.0 million in May. Rather than reading any single month as a new trend line, H1 is better understood as a market with meaningful mix effects across location, condition, size and price tier. *Supporting MLS statistics sheet: Sold single-family residential, Jan. 1–June 30, 2026, Gallatin County with report-specific area criteria. April and June are intentionally omitted from the monthly chart because the audited workbook did not contain verified Bozeman SFH values for those months.
Condos & Townhomes 213
$495K
49
H1 SALES*
MEDIAN CLOSE PRICE*
MEDIAN DOM*
Attached housing remains a critical entry and lifestyle segment. Supporting MLS statistics show a $495,000 median close price for H1 condo and townhome sales - roughly $370,000 below the single-family median in the corresponding supporting dataset. The tradeoff is time. Median days on market registered 49 days for condos and townhomes versus 27 days for single-family homes in the supporting H1 statistics. That does not imply weak demand across the category; it does reinforce that attached product is highly sensitive to price, dues, location, condition and competing new construction.
BUYER LENS
SELLER LENS
Attached housing can provide a lower purchase-price entry point into the Bozeman market, but total monthly carrying cost - including HOA dues - matters more than headline price alone.
Condition, fee structure and direct competition should shape pricing strategy. In a market with more choice, “similar” units can separate quickly based on presentation and total cost.
*Supporting MLS statistics sheet: Sold condominium and townhouse residential, Jan. 1–June 30, 2026, Gallatin County with report-specific area criteria.
ENGEL & VÖLKERS | BOZEMAN, MONTANA
•
H1 2026 5
Luxury: Active, Selective, Well Supplied
The audited price-band data recorded 31 residential closings at $2 million or above during H1: 15 between $2 million and $3 million, 11 between $3 million and $5 million, and five above $5 million. In the active snapshot, 39 listings sat above $2 million. The upper end is therefore not a single market. The $2 million to $3 million tier showed the shortest median marketing time in the price-band analysis at 15 days among H1 closings, while the $5 million-plus tier recorded a 121-day median. Scarcity, architecture, acreage, views, proximity and finish quality all become increasingly property-specific as price rises.
“Luxury demand exists. Uniform luxury demand does not.” Source: audited H1 2026 workbook, Price Band Analysis - All Residential.
ENGEL & VÖLKERS | BOZEMAN, MONTANA
•
H1 2026 6
Land, Ranch & Open Space In Southwest Montana, land is not simply another property type. It is part of the region’s identity - and one of the structural constraints shaping future supply. Supporting H1 MLS statistics recorded 65 land sales in the report’s selected market area, with a median close price of $325,000 and median marketing time of 111 days. The range was exceptionally wide, underscoring why land statistics require more context than residential medians: acreage, entitlements, water, access, topography, utilities and development potential can make superficially similar parcels fundamentally different assets. For the broader Bozeman story, open land also intersects directly with growth. Development pressure is strongest where infrastructure, transportation and entitlement pathways can support new housing. At the same time, conservation, agricultural use and the valley’s open-space character remain central to the lifestyle proposition that drives demand in the first place.
VALUE DRIVERS
DUE DILIGENCE
Water rights • access • entitlements • utilities • views • agricultural utility • proximity to services • subdivision potential
Zoning • well/septic feasibility • easements • covenants • flood/hazard exposure • road access • development approvals
Source: supporting H1 2026 MLS statistics sheet for land; contextual framing reflects project research on growth, development and open space.
Inventory Changes the Conversation 175
$975K
125
ACTIVE RESIDENTIAL*
MEDIAN ACTIVE LIST PRICE**
MEDIAN ACTIVE DOM**
More inventory is not the same as oversupply. It does, however, change behavior. Buyers can compare more deliberately, inspect conditions more critically and resist aspirational pricing. Sellers have to compete not only with recent closed sales, but with the best alternatives currently available. The active-residential snapshot used in the audited workbook contained 175 listings. A closely timed supporting CMA showed a median active list price of $975,000 and median days on market of 125. These are point-in-time measures and should not be compared one-for-one with closed-sale DOM, but they illustrate the widening gap between what has sold and what is still seeking a buyer. In practical terms, 2026 is a market where pricing strategy matters earlier. The first two weeks of exposure carry more information because buyers have alternatives - and can recognize value quickly. *Audited workbook active residential snapshot. **Supporting CMA active residential snapshot dated Sept. 14, 2026; used as contextual inventory evidence, not as an H1 closing metric.
ENGEL & VÖLKERS | BOZEMAN, MONTANA
•
H1 2026 7
The Next Bozeman is Already Under Construction Development is increasingly defining where Bozeman's next cycle of housing and commercial activity will occur. The west side and Triangle corridor continue to absorb major master-planned growth, while northwest Bozeman and the Baxter Lane corridor are adding new residential communities and south-side projects are creating smaller, highly location-specific opportunities. PROJECT
LOCATION
SCALE / PRODUCT
H1 2026 CONTEXT
Northwest Crossing
West Bozeman
700+ residences; 150,000+ sq. ft. commercial
Multi-phase
West Post
Triangle / west of Bozeman
253-acre mixed-use community
Residential + commercial underway
The Reserve at Heritage Park
Northwest Bozeman / Baxter Lane corridor
35 single-family homes on 20 acres; 5.44 acres open space + trails
Preliminary plat approved; development underway
Meadow Bridge
South Bozeman
45 entitled homesites; single-family only
Final plat approved / homesites marketed
The significance is not simply unit count. These projects are creating new neighborhood centers, commercial nodes and infrastructure demands. Northwest Crossing pairs more than 700 residences with over 150,000 square feet of commercial space. West Post is a 253-acre mixed-use anchor in the Triangle. The Reserve at Heritage Park adds 35 planned single-family homes across 20 acres in northwest Bozeman, with 5.44 acres dedicated to open space and trails. Meadow Bridge adds 45 fully entitled single-family homesites on Bozeman's south side. Sources: Northwest Crossing project materials; West Post project materials; Gallatin County subdivision records and project materials for The Reserve at Heritage Park; City of Bozeman Meadow Bridge final-plat memorandum and project marketing materials.
Growth Policy is Market Policy Zoning, infrastructure and entitlement rules influence not only what gets built - but the cost, timing and location of future supply. Bozeman adopted an updated Community Plan in late 2025 and continued implementation of a major Unified Development Code update into 2026. The policy direction is clear: accommodate growth more efficiently, expand housing options, support infill and align development with infrastructure capacity. For real estate, the impact is practical. Changes to allowable housing types, density, parking, design standards and review pathways can alter site feasibility and land value. At the same time, public infrastructure remains a gating factor. In 2026, city transportation projects include reconstruction and intersection work on growth corridors such as North 27th Avenue and Oak Street/Ferguson Avenue.
“The market is expanding geographically, but infrastructure determines how quickly that expansion becomes usable inventory.” Sources: City of Bozeman 2025 Community Plan; Engage Bozeman Development Code Update; City Transportation & Engineering capital project materials.
ENGEL & VÖLKERS | BOZEMAN, MONTANA
•
H1 2026 8
The Affordability Equation Price × Income × Financing × Supply Affordability belongs in a serious Bozeman market report because it is now a structural market variable, not a side issue. The City’s 2025 Community Plan calls the availability of affordable housing - both rental and ownership - one of Bozeman’s most serious problems. It also notes that permitted construction exceeded 9,300 dwellings by September 2025, with much of that production in apartment-style housing. The H1 market data shows why the issue persists on the ownership side. Even with 56.8% of audited residential closings below $750,000, the overall H1 median sale price was approximately $699,500. Financing costs, construction inputs and land prices compound the gap between what can be built and what local incomes can comfortably support. This tension has two simultaneous effects: it sustains demand for smaller-format and attached housing, and it pushes some buyers outward in search of value. It also raises the importance of housing production, entitlement efficiency and infrastructure investment in the long-term health of the market.
$699.5K
9,300+
56.8%
H1 MEDIAN SALE PRICE
DWELLINGS PERMITTED BY SEPT. 2025
H1 SALES UNDER $750K
Sources: audited H1 2026 workbook; City of Bozeman 2025 Community Plan.
ENGEL & VÖLKERS | BOZEMAN, MONTANA
•
H1 2026 9
Why Bozeman? Economic & demand drivers
17,165
$288.7M
2.81M
MSU FALL 2025 ENROLLMENT
MSU FY25 RESEARCH
BZN 2025 PASSENGERS
Bozeman’s demand base is broader than lifestyle migration alone. The city’s 2025 population estimate reached 58,814 - 9.7% above the 2020 estimate base - while Gallatin County reached 128,740, up 8.2%. Montana State University adds a 17,165-student population and a research enterprise that spent $288.7 million in FY2025. BZN handled a record 2.81 million passengers in 2025 and entered 2026 with additional routes and a major terminal expansion underway. Layered onto those anchors are tourism, outdoor recreation, entrepreneurship and a growing service economy. Together they create year-round housing demand from students, employees, business owners, retirees, second-home users and relocating households - groups with very different budgets and property preferences. Sources: U.S. Census Bureau Vintage 2025 estimates; Montana State University; Bozeman Yellowstone International Airport.
Connectivity Changes the Scale of the Market Bozeman Yellowstone International Airport is now infrastructure of national significance for Southwest Montana’s real estate market. In 2025, BZN served 2,809,419 passengers, up 6.3% from 2024. Its summer 2026 schedule included 27 seasonal destinations served by eight major airlines, with new service to Austin, Long Beach and Phoenix Sky Harbor. The airport’s $190 million East Terminal Expansion was progressing through 2026, alongside runway and navigation improvements. That connectivity compresses the perceived distance between Bozeman and major feeder markets, supporting tourism, business travel, second-home use and relocation. Montana State University provides a different kind of connectivity: talent, research and institutional stability. Fall 2025 enrollment was 17,165, while FY2025 research expenditures reached a record $288.7 million. Those numbers matter to housing because the university supports a continuous flow of students, faculty, staff, researchers, employers and spin-off activity.
“BZN expands Bozeman’s reach. MSU deepens its economic base.” Sources: Bozeman Yellowstone International Airport 2025 year-end report and Summer 2026 schedule; Montana State University At-a-Glance and FY2025 research reporting.
ENGEL & VÖLKERS | BOZEMAN, MONTANA
•
H1 2026 10
What We’re Watching in H2 The second half of 2026 will be less about a single headline number and more about how several market forces interact.
1 PRICE DISCIPLINE
2 LUXURY ABSORPTION
Will sellers adjust quickly enough to the larger set of alternatives buyers can now see? Watch reductions, concessions and the gap between original list and sale price.
The $2M+ market holds a larger share of active inventory than of H1 closings. Watch whether premium supply is absorbed or carries forward.
3 NEW SUPPLY
4 AFFORDABILITY
Entitled lots and master-planned communities will add options, but delivery timing, infrastructure and construction costs will determine how quickly planned supply becomes occupied housing.
The ownership market remains expensive relative to local incomes. Watch financing conditions, attached-housing demand and the pace of attainable ownership production.
5 CONNECTIVITY
6 POLICY + INFRASTRUCTURE
BZN capacity and route growth continue to strengthen access to Southwest Montana, while MSU remains a stabilizing employment and demand anchor.
Implementation of updated land-use policy and major transportation projects will influence where the next wave of growth can move efficiently.
A More Mature Market Rewards Better Decisions H1 2026 did not produce a simple “up” or “down” story. It produced a more useful one: Bozeman is becoming a market of distinct segments, with different levels of liquidity, inventory and negotiating power across price points and property types. The broad demand foundation remains intact. The population is growing. MSU continues to expand its research footprint. BZN is handling record passenger volume and adding capacity. Development is delivering new neighborhoods and commercial nodes. Yet those same forces are colliding with affordability constraints, infrastructure needs and a more discerning buyer pool. For buyers, opportunity increasingly comes from choice. For sellers, performance increasingly comes from precision. That is the defining feature of Bozeman’s mid-2026 market: not less demand, but more differentiation. In a market like this, local knowledge and property-specific strategy matter more - not less.
ENGEL & VÖLKERS | BOZEMAN, MONTANA
•
H1 2026 11
About Engel & Völkers Bozeman LOCAL EXPERTISE. GLOBAL PERSPECTIVE.
Engel & Völkers Bozeman serves buyers and sellers across the Gallatin Valley with a distinctly local understanding of the market and the reach of an international real estate brand. Our advisors work across single-family homes, condominiums and townhomes, new construction, land, luxury and investment property, bringing property-specific strategy to a market where location, price point and product type increasingly behave differently. Our Bozeman shop is part of Engel & Völkers Big Sky Country, a five-shop network spanning Bozeman, Big Sky, Livingston, Ennis and Butte. Together, these offices connect clients to the full spectrum of Southwest Montana real estate, from university-centered Bozeman and resort property in Big Sky to ranch, recreation and river communities throughout the region. BOZEMAN
BIG SKY
LIVINGSTON
Residential | New Construction | Land
Luxury | Resort | Ski
Yellowstone River | Paradise Valley
ENNIS
BUTTE
BIG SKY COUNTRY
Ranch | Recreation | Madison Valley
Historic | Residential | Investment
Five Shops | One Connected Network
WHAT THAT MEANS IN THIS MARKET
As Bozeman becomes more segmented, broad market averages tell only part of the story. Engel & Völkers advisors pair local market intelligence with tailored positioning, global brand exposure and a network built to reach buyers both inside and outside Montana. The goal is not simply more exposure. It is the right strategy for the property, the price point and the client.
ENGEL & VÖLKERS BOZEMAN
Local market intelligence. Global reach. A distinctly Montana perspective.
ENGEL & VÖLKERS | BOZEMAN, MONTANA
•
H1 2026 12
Sources & Methodology SECTION-BY-SECTION SOURCE INDEX
EXECUTIVE SUMMARY + H1 AT A GLANCE Bozeman Market Report H1 2026 audited workbook: Executive Summary / Analysis outputs, Raw Closed Sales and Price Band Analysis - All Residential. Supporting Big Sky Country MLS H1 2026 sold statistics and CMA materials. WHERE THE MARKET IS MOVING Audited workbook: Price Band Analysis - All Residential; active residential inventory snapshot used for closed-sales-versus-inventory comparison. Active inventory is point-in-time, not H1 transaction volume. SINGLE-FAMILY HOMES Supporting Big Sky Country MLS sold single-family residential statistics for Jan. 1-June 30, 2026, using the report-specific Gallatin County / Bozeman-area criteria; workbook monthly SFH inputs where available. April and June monthly SFH points were not supplied and were not reconstructed. CONDOS & TOWNHOMES Supporting Big Sky Country MLS sold condominium and townhouse statistics for Jan. 1-June 30, 2026, using the report-specific market criteria; workbook monthly Condo / Townhome inputs. LUXURY MARKET Audited workbook: Price Band Analysis - All Residential and luxury analysis derived from Raw Closed Sales; active residential inventory snapshot for $2M+ listing share. LAND, RANCH & OPEN SPACE Supporting Big Sky Country MLS H1 land statistics; Gallatin County Open Lands Program for conservation context; Montana DNRC exempt-well / HB 681 guidance for 2026 water-right process context; project research intentionally avoids treating mixed land records as a pure ranch-sales series. INVENTORY Audited workbook active residential snapshot and supporting active CMA materials prepared in September 2026. These measures are used only as current inventory context and are not presented as a reconstructed June 30 snapshot. NEW CONSTRUCTION & DEVELOPMENT Project and public materials for Northwest Crossing, West Post and Meadow Bridge; City of Bozeman final-plat / development materials; supporting project research on major housing and commercial pipeline activity. GROWTH POLICY & INFRASTRUCTURE City of Bozeman 2025 Community Plan; Engage Bozeman Development Code Update / Unified Development Code materials; City Transportation & Engineering capital project and Capital Improvement Plan materials. AFFORDABILITY Audited H1 2026 workbook for sale-price distribution and median pricing; City of Bozeman 2025 Community Plan and local housing planning materials for affordability context. WHY BOZEMAN? ECONOMIC & DEMAND DRIVERS U.S. Census Bureau Vintage 2025 / QuickFacts for Bozeman and Gallatin County population; Montana State University At-a-Glance and research reporting; Bozeman Yellowstone International Airport traffic and schedule reporting; supporting project research on tourism, outdoor economy, employment and business growth. CONNECTIVITY: BZN + MSU Bozeman Yellowstone International Airport 2025 year-end passenger reporting and Summer 2026 flight schedule; airport expansion materials; Montana State University Fall 2025 enrollment and FY2025 research expenditure reporting. H2 WATCHLIST + MARKET PERSPECTIVE Synthesis of the audited workbook, supporting MLS statistics, active inventory snapshot and the public research sources listed above. Forward-looking statements are market themes to monitor, not forecasts or guarantees.
ENGEL & VÖLKERS | BOZEMAN, MONTANA
•
H1 2026 13
Primary References DATA FILES + RESEARCH REFERENCES Primary market workbook Bozeman_Market_Report_Data_Collection_H1_2026_UPDATED / final audited H1 2026 workbook. Core report metrics include 532 audited residential closings, $503.84M residential dollar volume, approximately $699.5K median sale price and price-band / inventory analysis. Supporting MLS materials Big Sky Country MLS comparative market analyses and statistics supplied for the project, including H1 sold residential, property-type statistics, land, and active inventory materials. Search criteria and report dates should be read with each source file. U.S. Census Bureau Vintage 2025 Population Estimates / QuickFacts: Bozeman city, Montana and Gallatin County, Montana. Used for 2025 population estimates and change from the 2020 estimate base. Montana State University MSU At-a-Glance / Academic Catalog: Fall 2025 enrollment. Office of Sponsored Programs Annual Research Review and FY2025 reporting: total research expenditures. Bozeman Yellowstone International Airport 2025 year-end passenger reporting; Summer 2026 Flight Schedule; airport expansion / capital project materials. Used for passenger volume, nonstop connectivity and terminal expansion context. City of Bozeman 2025 Community Plan; Community Housing planning materials; Development Code Update / Unified Development Code resources; Transportation & Engineering capital projects; Capital Improvement Plan; Meadow Bridge final-plat memorandum and related public development records. Gallatin County Open Lands Program / Open Lands Board materials. Used for conservation easement and protected-acreage context. Montana DNRC Water Rights: Exempt Well Updates and House Bill 681 / Notice of Intent guidance effective Jan. 1, 2026. Northwest Crossing Official project overview and residential / commercial program materials. Used for master-planned development scale and mixed-use context. West Post Official master-planned community overview and development program materials. Used for west-side growth and development context. Meadow Bridge Project marketing / homesite materials plus City of Bozeman public development records. Used for entitled homesite and development context. Prior Engel & Völkers reports Bozeman Market Report Q1-Q2 2025 and Bozeman Market Report 2025 End of Year. Used as editorial and brand continuity references, including the Big Sky Country shop overview. Current H1 2026 statistics were not carried forward from those reports. READING THE NUMBERS Closed-sale statistics describe transactions completed during Jan. 1-June 30, 2026. Active inventory is a point-in-time snapshot and should not be interpreted as H1 transaction volume. Median figures are preferred where available because they reduce the influence of unusually high or low transactions. Data may vary among MLS reports when property types, geography, status dates or extraction dates differ. This report is intended for general market information and is not an appraisal, valuation opinion, tax, legal or investment advice. MLS and public-source data are deemed reliable but may be revised. Development plans, schedules, routes and project details are subject to change. ENGEL & VÖLKERS | BOZEMAN, MONTANA
•
H1 2026 14