

Understanding Our Visitors
A Closer Look
January–December 2025
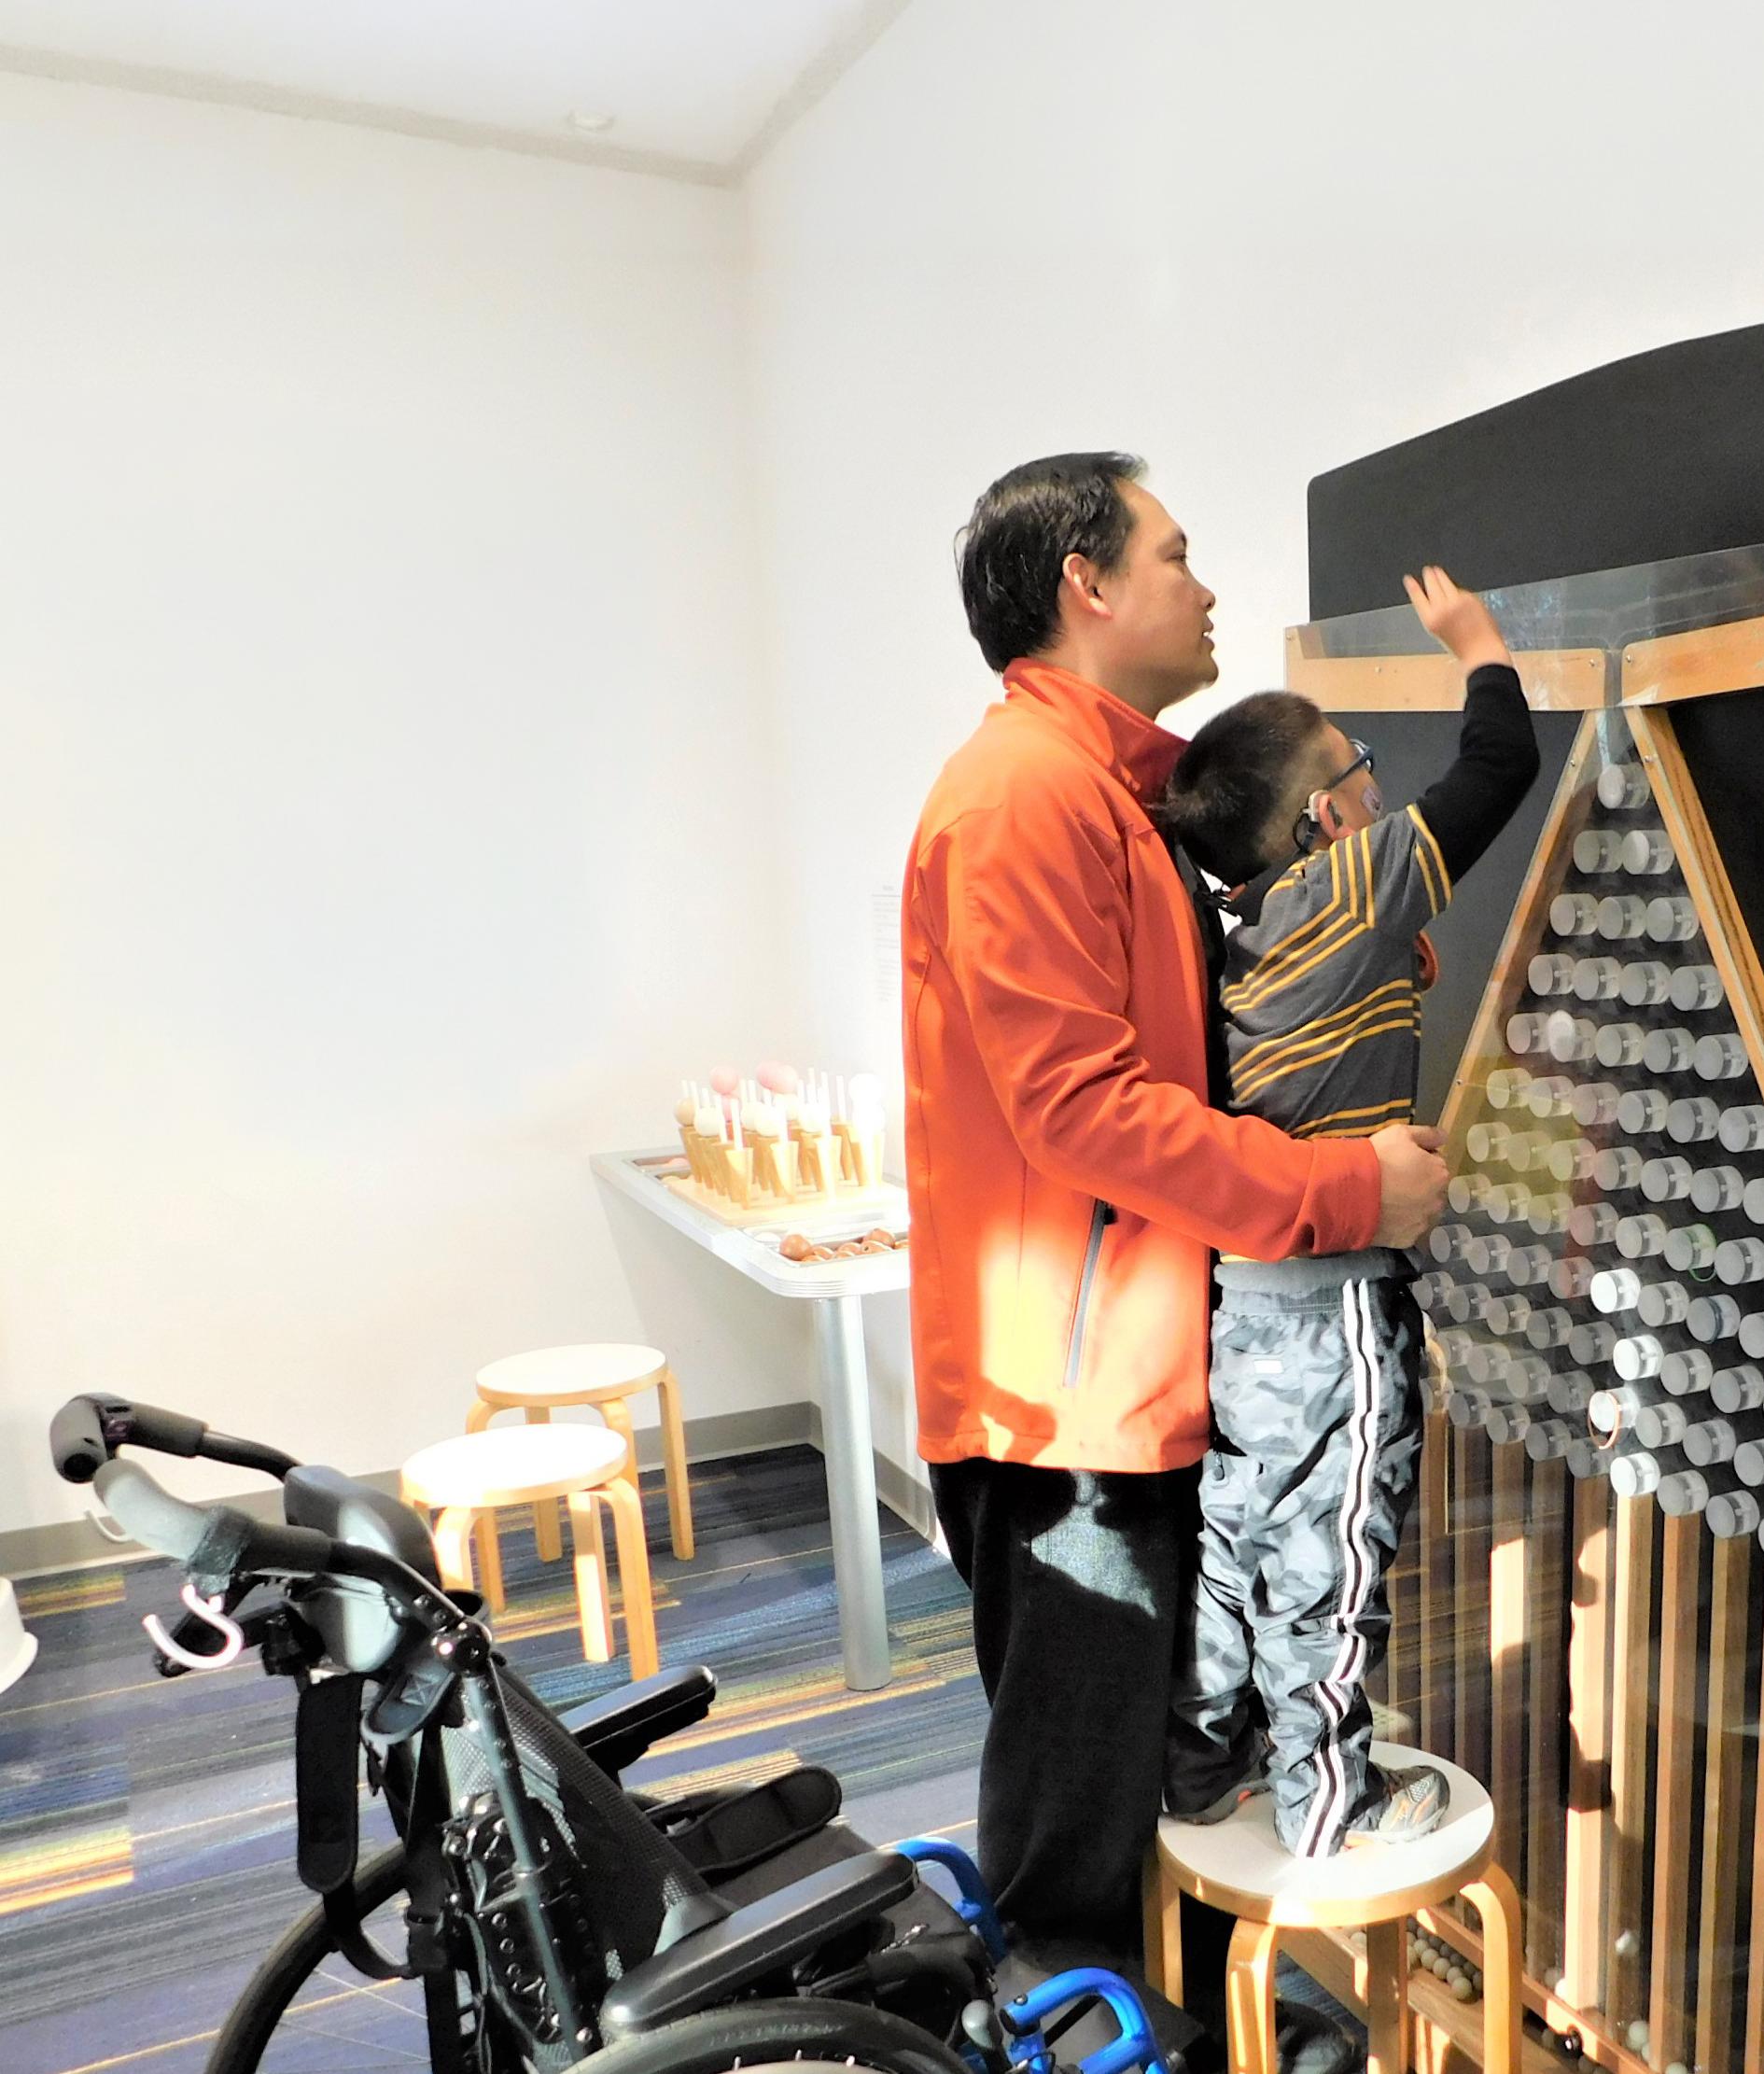
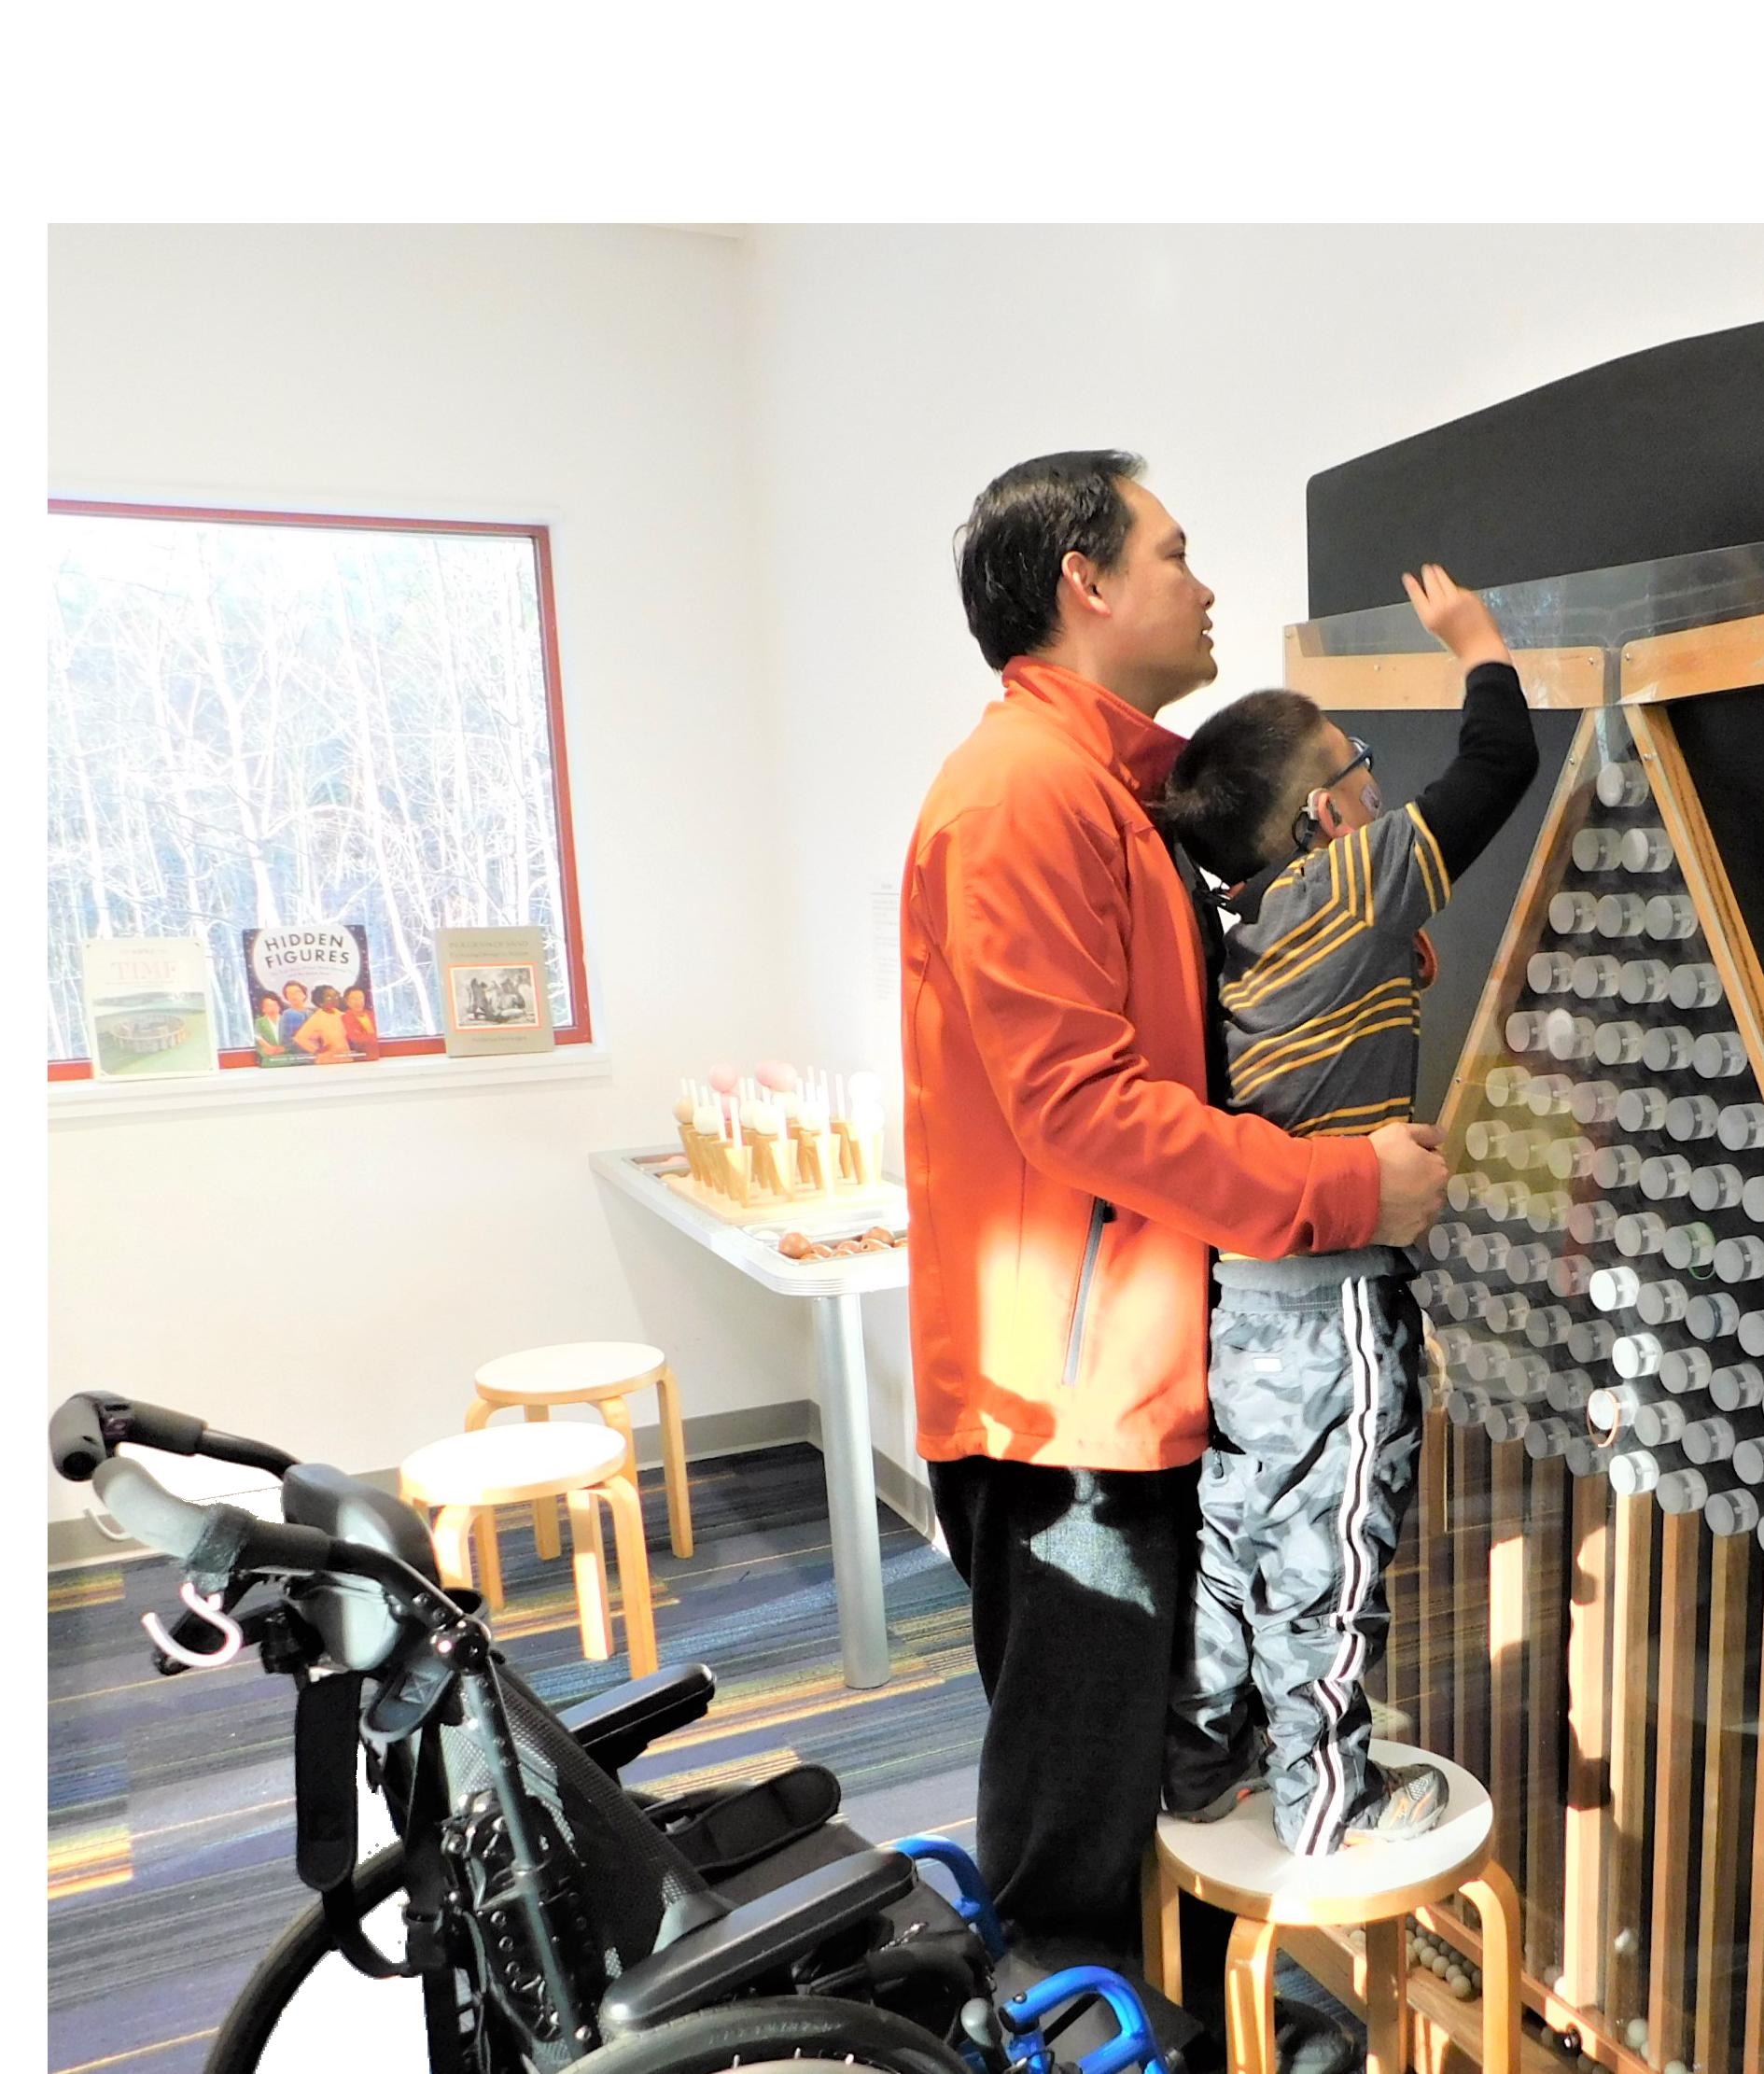
Suggested Citation
Auster, R., Anderson, A., Pennington, M., Bledsoe, K. L., Garibay, C., Cohn, S., & Wilson, G. (2026). Understanding our visitors: A closer look. Collaboration for Ongoing Visitor Experience Studies. understandingvisitors.org
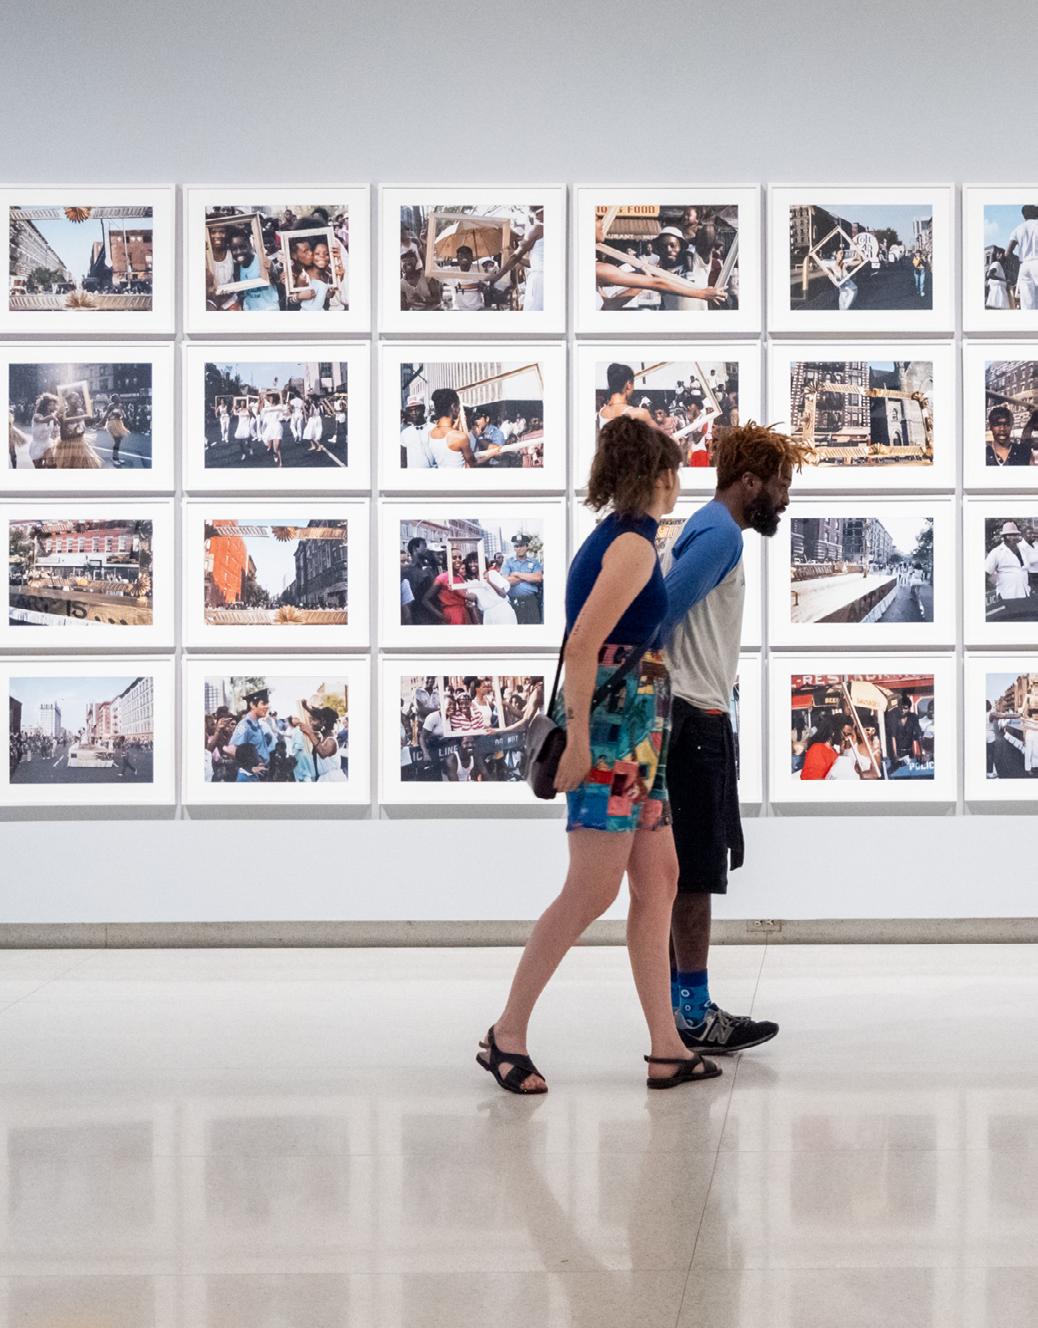
Photo by Kameron Herndon, courtesy Walker Art Center, Minneapolis.
ABOUT COVES
The Collaboration for Ongoing Visitor Experience Studies (COVES) unites museums of all types to systematically collect, analyze, and report on visitor experience data. We represent a collaborative museum community seeking to better understand and improve our visitors’ experiences. Our members learn about their visitors and we share aggregate data about who visits a particular museum, why they visit, what they experience during their visit, and how they react to different aspects of their experience. Participating members vary in size and represent art museums, children’s museums, history museums, natural history museums, and science centers across the United States.
COVES collects, analyzes, and reports data about museum visitors.
Who are our visitors?
How do they react?
MUSEUM VISITORS
Why do they visit?
What do they experience?
Participating intitutions can make evidencebased decisions.
Aggregate data (shown in this report) can inform the museum field as a whole.
We believe that by better understanding visitors’ experiences we can improve experiences overall and encourage repeat visitation across different organizations. In this report we explore how those experiences might differ based on a visitors’ demographic identity or background, so that we may consider how we might serve diverse segments of our audiences.
We present data collected by our member museums to provide insight about broad trends in museum visitors. Because the data were collected using a common method and survey instrument, they can be combined—or aggregated—together. Our analyses are exploratory, and are more suggestive of trends to be aware of rather than declarative in nature. Since the data presented in this report do not typify any particular institution, we encourage readers to look at their own audience data using a similar approach.
The results that in this report have been selected because:
They represent a distinct story between comparison groups
They are areas of interest for our community of member museums AND
COVES METHODS
About the data in this report
ɠ Surveys collected from January 1 to December 31, 2025
ɠ Represents 46,761 surveys across 99 sites
ɠ For data to be included in this report, institutions needed to collect at least 100 surveys, with less than 33% of the sample collected through their unique QR code
Data collection protocol
To support aggregation and comparability, all COVES institutions collect data in-person using the same protocol to collect onsite, electronic exit surveys.
Groups are chosen using a systematic, random sampling approach.
Data collectors approach general visitor groups (i.e., not school field trips) at the museum exit and ask them to complete the survey.
ONSITE SURVEY
Respondents take the survey using an electronic tablet.
GENERAL PUBLIC ONLY
No school, camp, or tour groups are included in the sample.
DATA COLLECTION IS ONGOING
Surveys are collected during every month of the year, on weekdays and weekends.
To account for differences in sample sizes across institutions and avoid over-representing large institutions, statistical weights were applied to the data prior to analysis.
The weighted aggregate sample size used throughout this report is 28,783.
One adult in their group completes the survey on a tablet at the end of their visit.
If they are more comfortable using their own device (e.g., for personalized accessibility features), the individual may scan a QR code instead of using the offered tablet.
BILINGUAL
Visitors may complete the survey in either English or Spanish.
5:07 min | sec 53%
AVERAGE RESPONSE RATE ACROSS SITES
AVERAGE SURVEY DURATION
ABOUT THIS REPORT
How do museum visitors’ experiences vary when we consider different demographic characteristics?
In previous COVES Aggregate Reports, we have attempted to synthesize a great deal of data to inform conversations about who museums are serving, while identifying patterns and disaggregating by organizational characteristics (e.g., museum size or type). In other words, we have intentionally chosen an inside-out investigation, highlighting ways that museums support various types of audiences. This year’s report takes a closer look at visitors and their unique identities, employing an outside-in investigation: how do different visitors perceive our museums and the experiences offered? To some, these approaches may feel interchangeable, but as you’ll see in the coming pages, the focus here is on individual characteristics to make sense of where we stand as a field at this moment in time
Most museums, regardless of location or affiliation, purport to be “for everyone” —it’s in mission statements, on websites, and engrained in collective beliefs that our aim is to be a cornerstone of the community. However, valid questions remain as to whether we are achieving this goal, as decades of research suggest that museums engage primarily an overly-educated (Coffee, 2008), nonrepresentative public (Jennings & Jones-Rizzi, 2017), with systems that may reinforce exclusionary practices despite claims of inclusion (Dawson, 2014; DeWitt & Archer, 2017). Our very own COVES data continue to reinforce the notion that across the U.S., museum visitor demographics are incredibly similar to those observed in the mid-1990s in terms of (high) educational attainment and household incomes, with only modest shifts amidst a diversifying American public in terms of race/ ethnicity and LGBTQ+ identity (Lussenhop & Auster, 2025). In short, if the museum field does not evolve as rapidly as our audiences, then we will find ourselves struggling to keep up.
So, why does this all matter? Simply put: the world is changing, in many regards more rapidly than ever before. Museums have long been revered for sharing knowledge and culture while supporting opportunities for learning (Feinstein & Meshoulam, 2013), capable of promoting positive personal outcomes (Price & Applebaum, 2021). However, there exists a palpable tension between preserving/sharing and gatekeeping/obfuscating, as trust in public institutions continues to falter (Milkoreit & Smith, 2024).
As you read this report, ask yourself this: what do museums provide, and for whom?

Jessica Woods for the Discovery Museum
CONSIDERATIONS
Choices in our presentation of data
Across the 99 organizations and more than 100,000 individual visitors represented in the pages that follow, there were countless ways to combine and separate the data, and limitless decisions regarding what to include and how to present findings. Our decision was to highlight the individual survey respondents and the demographic attributes they identified, while focusing on perceptions of experience across these groups. As we reference throughout the report, individual identities are complex, intersectional, and fluid over a lifetime, and our isolation of individual demographic variables is in many ways reductive. However, the way our data are structured and the lenses that we apply allow others to draw important conclusions about representation and experiences in museums.
Limitations in our research
While COVES employs systematic random sampling of visitors across participating sites, we acknowledge that the subset of museums included in this report is neither random nor representative of the museum field as a whole. In previous reports, we have demonstrated differences between the characteristics and experiences of visitors to museums of varying sizes and types, while exploring variations in seasonality and group composition, among others. Due to the extremely large samples to which we have access, any data that you perceive to be “different” between subgroups is virtually guaranteed to be statistically significant; lacking credible research hypotheses, however, the significance of the data is more in the interpretation and practicality of its application rather than in citable p-values. On a related note, beware Aggregation Bias as well as Simpson’s Paradox. When combining many groups of data—in our case, the collected samples of all member sites—patterns that may exist at the subgroup level may disappear entirely when aggregated, and in rare cases, may paradoxically reverse due to trends in dominant groups. It is also worth explicitly calling out that visitors to our museums who do not feel comfortable responding to surveys in either English or Spanish are systematically excluded from our sample.
Suggestions for the future
The data presented in this report cannot and will never answer all questions, achieve all goals, or solve all problems. We strive to present a clear picture of a robust data set representing diverse organizations and their visitors, but we can use COVES to do more, and we can find complementary and supplemental sources of data to inform future work. What else would you like to see in future reports, or to guide future practices?
As you read this report, we encourage you to consider the following:
ɠ These data are neither definitive nor prescriptive, as data reported in aggregate highlight commonalities while minimizing differences.
ɠ Our goal is to encourage you to reflect on your own organizational practices and ways of understanding visitors —particularly through a lens of equity.
ɠ We can do more collectively than we can individually, and learning with others is a powerful way of maximizing our capacities to enact change.
ɠ Question text and response options influence how visitors respond. See the COVES instrument to learn more about the survey bit.ly/COVES_Survey
The COVES protocol involves selecting one adult from a visitor group to be the primary respondent. The survey asks for some information that describes the entire visiting group and some from the primary respondent only.
We acknowledge that no visitor can be reduced to a single demographic, and that the intersectional nature of identity and experience mean that variation exists within each demographic group. We present each of these demographics to broadly understand patterns in who visits, and explore select demographic characteristics in the pages that follow.
GROUP DEMOGRAPHICS
DEMOGRAPHICS AVERAGE GROUP SIZE
n=27,934 (adults) | n=27,099 (children)
ADULT AGE AND GENDER
n=49,560 (age) | n=44,804 (gender)
n=27,934 (adults) | n=27,099 (children)
CHILD AGE AND GENDER
DEMOGRAPHICS COMPARED TO CENSUS
To understand visitor demographics within the context of the United States, we include comparisons between COVES aggregate data and national census data. Because the COVES survey allows respondents to select Prefer not to say as a response option and census surveys do not, these responses have been removed from the data below to provide direct comparisons. Individual museums can use census data to look at how their visitors compare to their own region or neighborhood.
Less
$25–49.9K
$50–74.9K
$75–99.9K
$100–149.9K
$150–199.9K
GROUP DISABILITY
n=26,019
Asian / Asian American
Black / African American
American Indian / Alaska Native
Native Hawaiian / Pacific Islander
Multiple races
Self-describe Yes
*In reality, race and ethnicity are two different concepts: race is about perceived appearance, whereas ethnicity is about culture. We refer to them collectively throughout this report because of our data and the U.S. Census categorizations.
**Similarly, the LGBTQ+ acronym represents communities of diverse individuals in terms of both their sexual and gender expression. The measurement of and reference to a singular term is reductive in terms of identity.
COVES aggregate data
National census data
MOTIVATIONS
Visitors may have several reasons for deciding to come to a museum. The COVES survey asks them to select the two most important reasons for visiting that day. Options differ between Science+ and Art museums, based on insights from research and professional experience. Art museum motivations are topically grouped to reflect prior research into visitor behaviors (Phelan et al., 2017).
SCIENCE+ MOTIVATIONS (TOP 6) n=9,344
To spend time together as a group or family
For fun/entertainment for group members
For an educational experience for group members
Something to do while visiting the area
For fun/entertainment for myself
For an educational experience for myself
44+30+17+16+16+11
Social enjoyment
Learning & pursuing interests
Popularity
Relaxation & recuperation
Social learning
Social contacts
Learn more about response options on the COVES Instrument Explained: bit.ly/COVES_Survey
38+37+30+23+11+8
PATTERNS OF VISITATION
7+17+39+22+9+4+1+1
*Responses only requested of visitors attending multiple times in the last year
OER,
NPS, AND EXPERIENCE
Overall Experience Rating is a holistic measure of the quality of an experience, asking visitors to select between poor, fair, good, excellent, and outstanding. Net Promoter Score is an industry standard (Reichheld & Markey, 2011), measuring an individual's willingness to recommend the institution to others on a scale from 0–10.
RATINGS
The charts on the left display the aggregate data, while the charts on the right show the institutional median and range.
Overall Experience Rating (OER)
Net Promoter Score (NPS)
Experience Ratings
n varies
Average rating, on a scale from 0 to 10 where 10 is the highest.
These box and whisker plots show the distributions of institutional values for each rating. The shaded box displays the middle 50% (the interquartile range), while the "whiskers" show the minimum and maximum. The dark line is the median value.
EXPLORING LGBTQ+
Most museums aspire to be for everyone, but LGBTQ+ visitors may not feel as welcome in the museum. Although disclosing LGBTQ+ identities was criminalized less than a century ago in the United States, LGBTQ+ identification is on the rise, especially amongst younger generations (Jones, 2025). Despite this shift, discrimination against members of the LGBTQ+ community remains common (Smith & Norris, 2025). As a result, it’s critical to understand the experiences that our LGBTQ+ visitors are having.
The COVES survey asks respondents whether or not they identify as LGBTQ+. At the aggregate level we see that 17% of visitors indicate that they are part of the LGBTQ+ community. They are more likely to be part of adult-only groups, have a disability, and be younger than non-LGBT+ visitors. They are slightly less likely to recommend the museum they visited to others, but slightly more likely to say they had an outstanding experience.
n=20,894
n=23,467
n=22,619
n=23,062
The data presented in these comparison groups exclude visitors who selected Not sure or Prefer not to say (8% of full sample).
Explore your data:
ɠ Are these patterns similar for your own visitors?
ɠ What do you offer (programming, representation, etc.) to welcome LGBTQ+ visitors at your museum?
EXPLORING DISABILITY
Although many museums are working to be more accessible for visitors with disabilities, such as using Universal Design guidelines, much work remains to be done. Exciting accommodation approaches are available, including 3-D printed replicas and augmented reality experiences (Carrizosa et al., 2020). How effective are these measures for promoting feelings of inclusion amongst disabled visitors? Understanding the accessibility of your museum is a complex topic worthy of its own independent study, but COVES can provide a helpful initial step of understanding the experiences that visitors with disabilities are having at your institution.
The COVES survey asks respondents whether or not anyone in their group has a permanent or temporary disability, recognizing that any disability may impact how a visitor interacts with the space. A follow-up question asks them to share the type of disability, so museums can consider the supports they offer to best serve their audience. At the aggregate level we see that 12% of visitors indicate that they or someone in their group has a disability, with mobility being the most frequently selected disability type. They were likely to recommend the museum they visited at similar rates to those without a disability, but were slightly more likely to rate their overall experience as outstanding. Respondent ages and household income are very similar, with visitors with disabilities a little more likely to have lower household incomes than those who do not.
OVERALL EXPERIENCE RATING
n=24,095
n=24,102
n=21,392
n=24,135
The data presented in these comparison groups exclude visitors who selected Prefer not to say (7% of full sample).
Respondents that preferred to self-describe most commonly mentioned
Explore your data:
ɠ Are these patterns similar for your own visitors?
ɠ What accommodations (e.g. audio labels, closed captions, exhibit height) are available at your organization?
ɠ What kinds of relationships do you have with local advocacy groups?
EXPLORING GENDER
Do experiences for men, women, and people identifying with another gender differ during their museum visit? Although most museums aim to provide equivalent experiences to visitors of different genders, these groups may differ in how they feel about their experiences.
In our exploration of gender identity for museum visitors, we highlight demographics and experiences for the survey respondent. Here we see that nearly two-thirds of these respondents identify as women. Women are much more likely to recommend the museum they visited than men or those who identify with another gender. Men and women report similar rates of membership, age ranges, levels of education, and household income. Visitors identifying with another gender are less likely to be members, are younger, and have lower income. Notably, visitors that identify with another gender notably overlap with those who identify as LGBTQ+ - we encourage you to also consider the data on the Exploring LGBTQ+ pages.
We encourage you to look at these data at your own organization!
ɠ Is the distribution of gender similar for adults and children?
ɠ How does gender overlap with other identities?
n=24,966
These comparisons omit visitors who selected Prefer not to say (4% of full sample), while combining those who identified as Non-binary and Prefer to self-describe into "Another Gender".
Not say/Not sure
EXPLORING SOCIOECONOMIC STATUS $
Museums strive to be accessible to all visitors, often offering free or discounted admission programs to make visits more affordable. Socioeconomic status is a complex concept, typically defined as a composite of one’s income, education level, and career, and associated with a variety of health and other life outcomes (Baker, 2025). In the COVES data set, income and education level are strongly associated, and we discuss them together here as a correlate for socioeconomic status.
Household income can be a sensitive topic. On the COVES survey, this question has a high rate of respondents who select Prefer not to say (23%), limiting our ability to discuss the full picture of socioeconomic status in our visitors. Lower income and lower education visitors are slightly more likely to rate their visit as Outstanding than their higher income and higher education counterparts.
n=16,915
n=19,173
n=21,994
Lower Income—Less than $75K (35%)
Higher Income—More than $75K (65%)
Lower Education—Less than college (16%)
Higher Education—college or higher (84%)
Comparing Income and Education
As compared to the census, museum visitors with household incomes under $75K are underrepresented in relation to the general public, informing the collapsed categories in this report. Most college students are between the ages of 18-22, so respondents under the age of 25 are excluded from the collapsed education categories.
Comparing education and income, we observe that almost two-thirds of all visitors (those aged 25 or older providing valid responses) are identified as higher education/higher income. Surprisingly, the corresponding diagonal cell—lower income/lower education—is relatively low at just 9% of all visitors. One clear conclusion is that, regardless of their household income level, museum visitors tend to be well-educated.
Explore your data:
ɠ What are your organization’s goals around access? What does it look like to achieve these goals?
ɠ What complementary sources (e.g., access programs) can you explore alongside these data?
ɠ How do income and education overlap with other identity variables?
EXPLORING RACE AND
ETHNICITY
Over the years, the United States has grown more diverse, and museums often aspire to represent the racial and ethnic diversity of their local communities (Farrell & Medvedeva, 2010). Museums of all kinds have long been White-centric institutions (Teslow, 2013), and most museums continue to serve majority White audiences. However, there are important cultural differences to consider for visitors of different ethnic backgrounds. For example, Asian/Asian American visitors typically select more moderate scores when rating experiences—and not just in the museum (Liao et al., 2020). Multiracial identity is also on the rise in the United States (Reginald, 2024), with a wide range of associated, highly complex cultural backgrounds. While the COVES survey cannot completely capture the nuance of racial and ethnic identity, these data can provide a starting point for understanding the racial and ethnic backgrounds that are served or not served effectively by museums.
Multiple races/ethnicities
CATEGORIES SELECTED
NUMBER OF SELECTIONS
Investigating patterns within the selections of multiple race/ethnic identity category visitors is important in unpacking exactly what we mean when we say “Multiple races.” Here we see that, of the 11% of visitors who select multiple categories, the majority still identify at least in part as White, with other racial and ethnic influences on their identities. Additionally, we observe that the bulk of visitors who select multiple race/ethnic identities select only two.
Explore your data:
ɠ Do your visitors represent your local community?
White (64%)
Hispanic / Latino/a/x (8%)
Asian / Asian American (7%)
Black / African American (6%)
Multiple races (11%)
n=24,530
These comparisons omit visitors who identify solely as American Indian/Alaska Native, Middle Eastern/North African, Native Hawaiian/ Pacific Islander, and self-described due to low sample sizes, as well as those who selected Prefer not to say (6% of full sample).
OVERALL EXPERIENCE RATING
n=24,538
n=21,750
EXPLORING RACE AND ETHNICITY
White (64%)
Hispanic / Latino/a/x (8%)
Asian / Asian American (7%)
Black / African American (6%)
Multiple races (11%)
EDUCATION
n=23,925 BACHELOR'S DEGREE OR HIGHER
Comparing COVES data to U.S. Census Bureau data on educational attainment by race/ethnicity, museum visitors over-represent those who are well-educated.
Less than college College degree
Graduate degree
Prefer not to say
Regardless of the racial/ethnic identity of museum visitors, each and every group shows a demonstrable trend toward having higher education than the average community member. As educational attainment is highly correlated with many other demographic characteristics explored in this report, the key takeaway is that museums tend to attract visitors and groups who are well-educated and value education, regardless of other demographic characteristic or factor of identity we are able to measure through the COVES survey. Ironically, as institutions of informal education, museums may be subtly reinforcing the hierarchies and barriers imposed by formal education systems.
FINAL THOUGHTS
Throughout this report, we have highlighted the perspectives of museum visitors through several lenses of individual identity in effort to better understand how their experiences may differ. After exploring the data collected by our COVES members, we can confidently say that museum visitors:
ɠ Continue to be predominantly White, while representing a larger proportion of visitors identifying with multiple racial/ethnic groups and as LGBTQ+ when compared to census (p. 9)
ɠ Overwhelmingly have positive experiences in and at museums (p. 11)
ɠ Are disproportionately well-educated, regardless of their racial/ethnic identity, signaling a troubling trend of cultural organizations reaching only those visitors who are already inclined to seek out opportunities for further education (p. 23)
In analyzing our data in these ways, our primary intention has been to promote the use of disaggregation to encourage conversations around equitable experiences. We ask you to consider, what do museums provide, and for whom? Our hope is that your answers are ambitious and detailed, with a clear path forward. We strongly encourage you to mine your existing visitor experience data in ways similar to those in this report, and more importantly, to have conversations with others in your organization about data use. Let us leverage visitor experience data as we propel inights toward action!
For our part, we will strive to improve access to COVES—engaging more organizations to ensure wider representation, strengthening our collaboration in terms of museum size, type, and location—while expanding supports to deepen insights into visitor experiences through data. As we seek to move forward, we optimistically submit that museums serve as beacons for all people, regardless of their demographics, and it is our collective responsibility to use data to amplify visitor voices and improve museum experiences in meaningful ways. Through intentionality and collaborative action, we can make positive changes across our field.



Ryan Auster, PhD Manager of COVES & Learning Metrics Museum of Science, Boston
Allison Anderson Senior Research & Evaluation Associate Museum of Science, Boston

Katrina L. Bledsoe, PhD Partner Strategic Learning Partners for Innovation
Cecilia Garibay, PhD President Garibay Group


Mallory Pennington Research & Evaluation Associate Museum of Science, Boston
REFERENCES
Baker, E. H. (2025). Socioeconomic Status, Definition. In The Wiley Blackwell Encyclopedia of Health, Illness, Behavior, and Society (pp. 1-4). John Wiley & Sons, Ltd.
Carrizosa, H. G., Sheehy, K., Rix, J., Seale, J., & Hayhoe, S. (2020). Designing technologies for museums: accessibility and participation issues. Journal of Enabling Technologies, 14(1), 31-39. doi: 10.1108/JET-082019-0038
Coffee, K. (2008). Cultural inclusion, exclusion and the formative roles of museums. Museum Management and Curatorship, 23(3): 261-279. https://doi.org/10.1080/09647770802234078.
Dawson, E. (2014). “Not designed for us”: How science museums and science centers socially exclude low-income minority ethnic groups. Science Education, 98(6): 981-1008. https://doi.org/10.1002/sce.21133 .
DeWitt, J., & Archer, L. (2017). Participation in informal learning experiences: the rich get richer? International Journal of Science Education, Part B, 7(4): 356-373. https://doi.org/10.1080/21548455.2017.1360531
Farrell, B., & Medvedeva, M. (2010). Demographic Transformation and the Future of Museums. American Association of Museums. doi: 10.6082/uchicago.1272
Feinstein, N.W., & Meshoulam, D. (2013), Science for what public? Addressing equity in American science museums and science centers. Journal of Research in Science Teaching, 51(3): 368-394. https://doi.org/10.1002/tea.21130
Jennings, G., & Jones-Rizzi, J. (2017). Museums, White Privilege, and Diversity: A Systemic Perspective. Dimensions, special edition
Liao, L., Chung, S., Altamirano, J., Garcia, L., Fassiotto, M., Maldonado, B., et al. (2020). The association between Asian patient race/ethnicity and lower satisfaction scores. BMC Health Services Research, 20(678). https://doi.org/10.1186/s12913-020-05534-6
Lussenhop, A., & Auster, R. (2025). Understanding Museum Visitors Today: Reflecting on 1990s Era Visitor Research Using New Data from a Collaborative Visitor Experience Study. Visitor Studies, 28(1): 8-18. https://doi.org/10.1080/10645578.2024.2443347
Milkoreit, M., & Smith, E.K. (2024). Rapidly diverging public trust in science in the United States. Public Understanding of Science, 34(5): 616-627. https://doi.org/10.1177/09636625241302970
Phelan, S., Bauer, J., & Lewalter, D. (2017). Visit motivations: Development of a short scale for comparison across sites. Museum Management and Curatorship. doi: 10.1080/09647775.2017.1389617.
Price, C.A., & Applebaum, L. (2021). Measuring a Sense of Belonging at Museums and Cultural Centers. Curator, 65(1): 135-160. https://doi.org/10.1111/cura.12454
Reginald, D. G. (2024). Multiracial identity. EBSCO. https://doi.org/10.1111/cura.12034
Reichheld, F., & Markey, R. (2011). The Ultimate Question 2.0: How net promoter companies thrive in a customer-driven world. Boston, MA: Harvard Business Review Press.
Smith, C., & Norris, H. (2025). The LGBTQI+ Community Reported High Rates of Discrimination in 2024. Center for American Progress. https://www.americanprogress.org/article/the-lgbtqi-communityreported-high-rates-of-discrimination-in-2024/
Teslow, T. (2013). A Troubled Legacy: Making and Unmaking Race in the Museum. Museums & Social Issues, 2(1), 11-44. https://doi.org/10.1179/msi.2007.2.1.11
Data used to compare visitors to census benchmarks were drawn from the following sources:
Erickson, W., Lee, C., & von Schrader, S. (2025). Disability Statistics from the American Community Survey (ACS). Ithaca, NY: Cornell University Yang-Tan Institute (YTI). www.disabilitystatistics.org.
Jones, J. (2025). LGBTQ+ Identification in U.S. Rises to 9.3%. Gallup Poll Social Series. https://news.gallup.com/poll/656708/lgbtqidentification-rises.aspx.
U.S. Census Bureau (2024). American Community Survey 1-Year Estimates Data Profiles. U.S. Department of Commerce. https://data.census.gov/.
PARTICIPATING INSTITUTIONS
28 science+ and 71 art museums are included in this report
Museum types
28 Science+, including:
ɠ Children's
ɠ History
ɠ Maritime
ɠ Natural history
ɠ Science Museum size (annual attendance)
ɠ 14 Very small (<75,000)
ɠ 44 Small (75,000-125,000)
ɠ 26 Medium (125,000-450,000)
ɠ 15 Large (>450,000)
71 Art museums, including:
ɠ Academic art
ɠ American art
ɠ Asian art
ɠ Contemporary art
ɠ Encyclopedic art

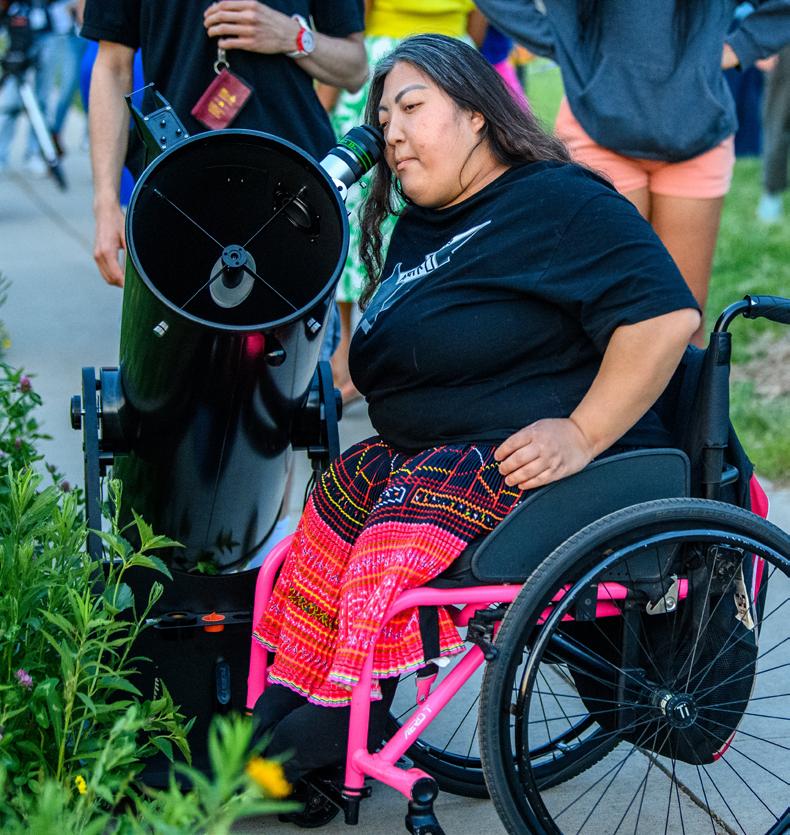
Public Engagement, Learning & Impact, Free Thursday Night, July 18, 2024. Minneapolis Sculpture Garden. Photo by Kameron Herndon, courtesy Walker Art Center, Minneapolis.
GET INVOLVED IN COVES
Join COVES to learn from your visitors and contribute to the robust aggregate data set that informs our field! If you are interested in this report, we know that you are interested in understanding visitors. And if you are interested in learning about your visitors and think that COVES is right for you, we want you to be involved. Currently, we have museums that engage their visitors in a variety of topics or experiences, including art museums, children’s museums, history museums, natural history museums, science centers, maritime museums, and other speciality museums—and we hope to have even more types of cultural institutions involved. Don’t see your institution type represented? Talk to us—we’d love to figure out what that means for participation!
LEARN MORE
If you are interested in joining our collaboration or just want to learn more, please contact us at info@understandingvisitors.org, or visit our website at understandingvisitors.org.

Photo by Joe Szurszewski for the Bell Museum
Photo by Cummer Museum of Art & Gardens
Photo by Amy Snyder for the Exploratorium
Photo © Barnes Foundation