Disclaimer
CSE: ICG | FRA: JI0 | OTC Pink: ICGSF PRIVATE & CONFIDENTIAL Q3, 2026 First Six Assays Reported
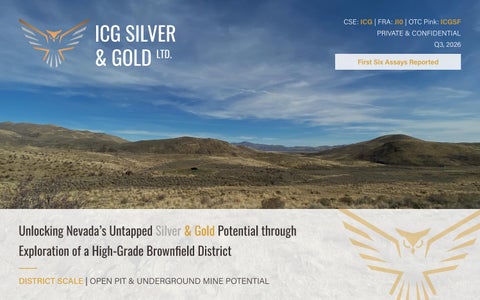
Unlocking Nevada’s Untapped Silver & Gold Potential through Exploration of a High-Grade Brownfield District DISTRICT SCALE | OPEN PIT & UNDERGROUND MINE POTENTIAL CSE: ICG | FRA:JI0 | OTC Pink: ICGSF
Disclaimer This corporate presentation, its contents and any related oral presentations are confidential and the property of ICG Silver & Gold (“ICG” or the “Company”) for informational purposes only. It is information in a summary form and does not purport to be complete, and may not contain certain information about the Company, including important disclosures and risk factors associated with an investment in the Company. The contents of this Presentation have not been approved or disapproved by any securities commission or regulatory authority in Canada, the United States or any other jurisdiction. This presentation does not, and it is not intended to, provide any financial, legal, accounting, or tax advice, and must not be relied upon by you in that regard. The presentation should not be used, or relied upon by you, as a substitute for your independent research or consultation with your own financial, legal or tax advisors. There are significant risks associated with an investment in the Company. No representation or warranty express or implied is made as to, and no reliance should be placed on, the fairness, accuracy, completeness or correctness of the information or any opinions contained herein and nothing in this presentation is, or shall be relied upon as, a promise or representation by the Company. This Presentation does not constitute an offer to sell or a solicitation of an offer to buy any security in Canada, the United States or any other jurisdiction. The contents of this presentation were approved by the Company on September 18th, 2026. This presentation includes market, industry and economic data which was obtained from various publicly available sources and other sources believed by the Company to be true. Although the Company believes it to be reliable, the Company has not independently verified any of the data from third party sources referred to in this presentation, or analyzed or verified the underlying reports relied upon or referred to by such sources, or ascertained the underlying economic and other assumptions relied upon by such sources. The accuracy and completeness of the market, industry and economic data used in this presentation are not guaranteed and the Company does not make any representation as to the accuracy or completeness of such information. The Company does not undertake or agree to update this presentation or to correct any inaccuracies in, or omissions from, this presentation that may become apparent. No person has been authorized to give any information or make any representation other than those contained in this presentation and, if given and/or made, such information or representation must not be relied upon as having been so authorized. The information and opinions contained in this presentation are provided as at the date of this presentation. The securities of the Company have not been and will not be registered under the United States Securities Act of 1933, as amended, or any state securities laws and may not be offered or sold within the United States, unless an exemption from such registration is available, information concerning the assets and operations of the Company included in this presentation has been prepared in accordance with Canadian standards and is not comparable in all respects to similar information for United States companies. Cautionary Note Regarding Forward-Looking Information This news release contains “forward-looking information” within the meaning of applicable Canadian securities legislation. Forward-looking information is often identified by words such as “plans”, “expects”, “anticipates”, “believes”, “intends”, “estimates”, “projects”, “potential”, “continue”, “could”, “should”, “may”, “will”, “would” or similar expressions, or statements that certain actions, events or results “may”, “could”, “would”, “might” or “will” be taken, occur or be achieved. Forward-looking information in this news release includes, without limitation, statements regarding: the anticipated inaugural mineral resource estimate for the Tuscarora District and its expected timing in Q1 2027; the expected publication of assay results from the remaining holes of the 2026 Phase 1 Drill Program; the Company’s plans for continued exploration and follow-up drilling at the Tuscarora District, including at the Battle Mountain target; the Company’s plans to incorporate Phase 1 results into its three-dimensional geological and structural models and resource-evaluation work; the potential for the Tuscarora District to host additional zones of high-grade mineralization; and the Company’s ability to obtain required permits and adequate financing to fund its planned exploration activities. Such forward-looking information is based on the beliefs, estimates and opinions of the Company’s management as of the date hereof and is subject to known and unknown risks, uncertainties and other factors that may cause actual results to differ materially, including: the uncertainty inherent in mineral exploration and development; the Company’s limited operating history as a public company; the risk that drill results may not be representative of the broader mineralized system; the risk that geological interpretations and structural models may prove inaccurate; the risk that a mineral resource estimate may not be defined within the anticipated timeframe or at all; fluctuations in gold and silver prices; the inability to obtain required regulatory approvals or permits, including from the Bureau of Land Management; the Company’s dependence on the Tuscarora District as its sole material mineral property; title risks; the ability to obtain adequate financing on acceptable terms; reliance on key personnel; and general economic, market or business conditions. The foregoing list is not exhaustive. Additional risks and uncertainties are described in the Company’s public disclosure documents filed on SEDAR+ at www.sedarplus.ca. There can be no assurance that forward-looking information will prove to be accurate. Readers should not place undue reliance on forward-looking information. The forward-looking information contained in this news release is made as of the date hereof and, except as required by applicable securities laws, the Company undertakes no obligation to update or revise any forward-looking information. Technical Information Technical Information The technical information contained in this presentation was reviewed and approved by Steve L. McMillin, P.Geo, Independent Consultant, an independent Qualified Person (QP), as defined under National Instrument 43-101 – Standards of Disclosure for Mineral Projects. All historic production, drill or sample figures quoted herein are based on historical data and reports obtained and prepared by previous operators. The Company has not completed the work necessary to verify results at this time and there is no assurance as to the accuracy or completeness of included information. The Company considers this historical data to be relevant as the Company will use this data as a guide to plan future exploration programs. The Company considers the data to be reliable for these purposes, however, the Company’s future exploration work will include verification of the data through check assay validation of historical assay values; validation of drilling data; validation of geological modeling; and more detailed relogging and inspection of drill core. The historical figures have not been verified by a Qualified Person and should not be relied upon for any other purpose. Readers are cautioned that mineralization at nearby projects described in this presentation are not necessarily indicative of the mineralization on the Company’s projects. A 43-101 compliant Technical Report, titled “NI-43-101 Technical Report – Tuscarora Project, Elko County, Nevada, USA” dated January 7, 2026 is available on the Company’s website at www.icgsilverandgold.com
ICG SILVER & GOLD LTD.
CSE: ICG | FRA:JI0 | OTC Pink: ICGSF
2
September 30, 2026 – Major Update – Six Phase 1 Assays Reported
ICG SILVER & GOLD DELIVERS HIGH-GRADE GOLD INTERCEPTS IN 2026 DRILLING 24.3 m at 10.14 g/t gold
Hole T26RC-04
Including
12.1 m at 20.00 g/t gold and 4.6 m at 51.84 g/t gold
Summary of Phase 1 Drill Program 3,049 meters
12 holes, 4 targets
6 received in total
3 from each of Silica and Battle Mountain, 6 holes pending assay
Kings Vein Hole: T26RC-7
East Pediment Holes: T26RC-8 T26RC-9 T26RC-10
Reverse Circulation
all drill holes completed using this method
T26RC-11 T26RC-12
Battle Mountain Holes: T26RC-4 T26RC-5 T26RC-6 Silica Holes:
Work completed by Major Drilling
T26RC-1 T26RC-2 T26RC-3
All six holes received to date intersected gold and or silver mineralization ICG SILVER & GOLD LTD.
CSE: ICG | FRA:JI0 | OTC Pink: ICGSF
4
Battle Mountain Plan View 1
Plan View showing current and historical drilling on the Battle Mountain target. Source 1: As of September 28, 2026, strictly companies that reported assays publicly and to MinerDeck, Press Releases sourced from corporate websites, for less than $1 billion CAD in market cap. Market cap sourced on September 23, 2026 from ceo.ca and Yahoo! Finance.
ICG SILVER & GOLD LTD.
CSE: ICG | FRA:JI0 | OTC Pink: ICGSF
5
Battle Mountain - T26RC-04 - 24.3 Meters of 10.14 g/t Gold Intercept is a top-3 drill hole on a grams x meters basis in Nevada since the beginning of 20251 Summary of Assays Received to Date
Drill Hole ID
From (m)
To (m)
Interval (m) Au (g/t)
T26RC-1
73.2
76.2
3.1
0.24
Ag (g/t) 2.5
Including
73.2
74.7
1.5
0.40
2.6
T26RC-2
111.3
112.8
1.5
0.24
2.9
and
184.4
185.9
1.5
0.39
2.1
T26RC-3
140.2
143.3
3.1
0.21
10.3
Including
140.2
141.7
1.5
0.28
14.6
T26RC-4
117.3
147.8
30.5
0.98
3.5
Including
123.4
129.5
6.1
1.75
7.0
Including
125.0
126.5
1.5
5.13
14.8
Including
140.2
141.7
1.5
8.57
3.4
Including
138.7
143.3
4.6
2.95
2.9
and
181.4
205.7
24.3
10.14
3.4
Including
181.4
193.5
12.1
20.00
4.7
Including
182.9
192.0
9.1
26.58
5.8
Including
182.9
190.5
7.6
31.68
6.7
Including
182.9
187.5
4.6
51.84
10.2
Including
182.9
184.4
1.5
137.00
25.7
and
227.1
228.6
1.5
0.20
22.8
T26RC-5
115.8
121.9
6.1
0.07
10.5
Including
115.8
117.4
1.5
0.03
18.4
Including
118.9
120.4
1.5
0.10
20.1
and
131.1
132.6
1.5
0.23
15.8
and
224.0
239.3
15.2
0.73
2.2
Including
224.0
231.7
7.6
1.27
1.3
Including
224.0
230.1
6.1
1.52
1.4
Including
224.0
227.1
3.1
2.30
1.8
Including
224.0
225.6
1.5
3.20
2.3
T26RC-6
1117.4
118.9
1.5
0.36
0.4
and
128.0
131.1
3.1
0.20
0.6
Open and untested at depth, potential structural intersection.
Source 1: As of September 28, 2026, strictly companies that reported assays publicly and to MinerDeck, Press Releases sourced from corporate websites, for less than $1 billion CAD in market cap. Market cap sourced on September 23, 2026 from ceo.ca and Yahoo! Finance. Note: Sufficient work has not been completed to determine true widths for the intervals reported. All intervals are reported as depth of sample.
ICG SILVER & GOLD LTD.
CSE: ICG | FRA:JI0 | OTC Pink: ICGSF
6
Project Highlights
Source 1: https://www.hecla.com/exploration/nevada-usa Source 2: https://www.firstmajestic.com/projects/exploration-development/jerritt-canyon/ Source 3: Technical Report NI 43-101 on the Goldstrike Mine, Eureka and Elko Counties, State of Nevada, USA
All the ingredients of successful exploration assets Top ranked mining jurisdiction of Nevada
Opportunity for open pit and underground mining
JERRITT CANYON First Majestic Silver Corp. ~9.8M oz of gold production 40+ years2
MIDAS Historical production of 2.2M oz gold and 27M oz silver at ~0.5 oz/ton AuEq1
11 total targets across district, in 3 primary zones
GOLDSTRIKE Over 40M oz of production since 1987. Operated by Barrick as part of JV with Newmont. Barrick’s largest and most productive operation.3
Exceptional infrastructure access
Contiguous, very large and expandable land package
Significant work completed historically in the surrounding area, including past-production of 7.6M ounces of silver and >500k ounces of gold4 Source 4: 43-101 Compliant Technical Report, April 3, 2020 – section 1.3, summary of local area production.
ICG SILVER & GOLD LTD.
CSE: ICG | FRA:JI0 | OTC Pink: ICGSF
7
Geological Modeling & Historical Work VRIFY Presents – Bringing the District to Life
~50k oz Au & 250k oz Ag
All major clues help de-risk further exploration in the best mining jurisdiction in the world
Past production from nearby open pit (Dexter)
5,000 samples
80% property coverage
130 line-km of geophysics 80% property coverage
40,000m of drilling
200 m
in historical database
(Excluding recently completed 3,000m RC drill program)
Long Section View Looking West Source: 43-101 Compliant Technical Report, January 7, 2026 – all historical data verified by QP, Steve McMillin
Value of historical database $25-$30m, which far exceeds our current market cap. ICG SILVER & GOLD LTD.
CSE: ICG | FRA:JI0 | OTC Pink: ICGSF
8
Project Development Timeline Basis for First MRE on Project in its History – Optimal Point in “Lassonde” Curve The Lassonde Curve: The Lifecycle of Mineral Discovery Phase 1 Drilling – July & August 2026 Assays from Phase 1 Drilling – September to November 2026 First Mineral Resource – Q1 2027 Phase 2 Drill Program – TBD Based on Results
Build value and a platform for further resource growth and continued development. ICG SILVER & GOLD LTD.
Source: https://www.visualcapitalist.com/visualizing-the-life-cycle-of-a-mineral-discovery/
CSE: ICG | FRA:JI0 | OTC Pink: ICGSF
9
Investment Highlights Advanced brownfield exploration, epithermal and Carlin-type mineralization, with two over-lapping systems on a 10,100 acre, district scale land package.
Drill intercepts at South Navajo Target (2016):
Over 5,000 samples, 130 line-km of geophysics, and 40,000m of historical drilling incorporated into geological model.
Drill intercepts at East Pediment Target:
4.57m of 127.08 g/t gold, including 1.52m of 368.31 g/t gold.1
1.5m of 367 g/t Ag (1997) and 1.5m of 52 g/t Au (2016).2
Drill intercepts at Battle Mountain Target (1988):
Expert team and technical advisory board, with over 160 years of geology and Nevada-based mineral exploration experience.
1.6m of 13.6 g/t Au and 17.8 g/t Ag and 8.7 g/t Au and 41.1 g/t Ag.3
Tight capital structure, with over 25% held by management, insiders and significant shareholders.
District scale opportunity with a total of 11 drillready targets, results pending for 4 targets.
Source 1: 43-101 Compliant Technical Report, April 3, 2020 – table of significant historical drilling intersections. Select
Source 2: 43-101 Compliant Technical Report, January 7, 2026 – total drilling from 1996 to 2022.
figures included here.
Total spend sourced from American Pacific Mining September 30, 2025 Financial Statements. Source 3: 43-101 Compliant Technical Report, January 7, 2026
ICG SILVER & GOLD LTD.
CSE: ICG | FRA:JI0 | OTC Pink: ICGSF
10
Management & Board 30+ years of combined experience in growth-stage capital markets, resource development, and US resource exploration
STEVEN SIRBOVAN President, CEO, Director
Growth-stage capital markets professional with 13+ years of experience in IB, PE & IR 8+ years at Ventum Financial, working exclusively with companies in the high-growth, < $100 million market cap segment Most recently served as Director of Investment Banking and co-led the Origination IB group Led public and private financings, M&A transactions, and other corporate advisory mandates Participated in 100+ transactions totaling ~$500M in aggregate value 8+ years at Echelon Capital Markets (now Ventum Financial) Prior to Echelon, he was a Junior Investment Analyst, Private Equity, at Waterton Global Resource Management, a private equity firm dedicated to the metals and mining industry, where he assisted the Investment Origination team evaluating projects across Nevada and Arizona
ICG SILVER & GOLD LTD.
JEFF SWINOGA Executive Chair
KORBON MCCALL
VP Exploration
CPA, MBA, and senior mining executive with over 25 years of experience in capital markets, project development and mine construction
Exploration Geologist with extensive experience in mineral exploration and project development across the Western US
Served as an Officer and Director of Finance at Barrick Gold for seven years
Currently serves as Senior Project Geologist for Canter Resources Corp. and American Pacific Mining Corp.
Formerly President, CEO and Director of Exploits Discovery Corp., and has previously held senior roles including at First Mining Gold, Torex Gold, North American Palladium, Hudbay Minerals and is on the Board of Directors of Radisson Mining and Mountain Province Diamonds
President & Founder of McCall Geosciences, LLC, providing geological services for early-to-advanced stage exploration ventures
Served as the National Mining and Metals Co-Leader at Ernst & Young Canada
Graduate of the University of Idaho with a Bachelor of Science (Geology), and a Graduate of the University of Louisiana at Lafayette with a Masters in Business Administration
Board member of the Prospectors & Developers Association of Canada (PDAC), one of the largest mining associations in the world with over 8,000 members, where he chairs the Audit Committee
CSE: ICG | FRA:JI0 | OTC Pink: ICGSF
11
Management & Board Eight decades of combined capital markets, resource development, and US resource exploration expertise
WILL AVERY CFO
9 years as a partner with MNP LLP, a prominent Canadian accounting firm, in an almost 20-year career, holding numerous leadership positions, overseeing 100+ staff and partners Serviced companies pursuing public listings in both Canada and the U.S., including those registering for dual listings Provided expertise in U.S. GAAP and IFRS across a variety of industries and to varying sized companies, including companies with market capitalizations more than $1B Began advising small and mid-market companies in 2023
GARY BASCHUK
Independent Director
Gary Baschuk has over 40 years of industry experience as an Investment Banker/ Mining Analyst/Geologist Gary’s analytical focus has been on small to mid-sized exploration, development and production precious metals companies Industrial experience, all with Barrick Gold, ranged from early-stage exploration across northern Ontario, Manitoba and Quebec plus development and production on two Mines – Holt-McDermott in northern Ontario and Rodeo/Griffin (part of the Meikle Mine at the Goldstrike Mine Complex) in Nevada In addition, on behalf of Barrick, Gary managed an exploration company in Spain Gary holds a BSc, Geology Specialist Degree from the University of Toronto and is a Fellow of the Geological Association of Canada and a member of the Prospectors and Developers Association of Canada
ICG SILVER & GOLD LTD.
CSE: ICG | FRA:JI0 | OTC Pink: ICGSF
ERIK SLOANE
Independent Director
A senior executive in the Canadian ETF industry, leading a team of sales professionals as they partner with investment platforms, wealth management advisors, and institutional managers to harness the power of ETFs in their portfolios With nearly 20 years of capital markets experience building trusted Canadian and international equities stock exchanges, he’s held various senior management responsibilities across technology, operations, product and sales teams delivering complex integrations and implementation programs Previously the Chief Revenue Officer at Cboe Canada (formerly, the NEO Exchange) and Global Head of Corporate Listings at Cboe Global Markets where he was responsible for building the company listings sales team, alongside planning, strategy and execution supporting the launch of corporate listings businesses in Canada, the US, UK and EU markets Graduate of Queen’s University in Kingston, Ontario, with a Bachelor of Arts, Honours degree in Economics
12
Technical Advisory Board 125 years of collective Western US exploration and development experience
ERIC SADERHOLM
Senior Technical Advisor
BORDEN PUTNAM Committee Member
CHARLES SULFRIAN Committee Member
Senior professional geologist with over 40 years of experience in mineral exploration, project development, and mining operations across North and South America
Professional geologist with over 50 years of experience spanning mineral exploration, project development, and natural resource finance
Exploration geologist and mining executive with more than 35 years of experience discovering, evaluating, and developing precious and base metal deposits across North America
Co-founder and Managing Director of Exploration at American Pacific Mining Corp., where he has been instrumental in advancing multiple projects in the Western United States
Brings a unique combination of technical expertise and financial analysis, bridging operational geology and investment evaluation
Certified Professional Geologist (AIPG) and Qualified Person as defined under NI 43-101
For the past 17 years, has operated as an independent mining consultant, providing technical due diligence for mining project finance, primarily on the private debt side, including geological assessments, risk evaluation, and economic analysis
President of ZyMin Corporation, a geological consulting firm he has led for over 20 years, providing exploration management, project evaluation, and property acquisition services across the western US
Spent over a decade with Newmont Mining Corporation in senior technical roles, including Carlin Trend Exploration Manager, Regional Geologist, and Chief Geologist at the Phoenix Mine, Lone Tree Complex, and Mule Canyon Mine Led exploration programs, resource development, and minesite geology in some of the world’s most prolific gold districts
Spent 12 years as a Partner and Principal Resources Analyst within hedge funds, conducting asset-level due diligence and DCF/NPV modelling across mining and oil and gas investments
Contributed to numerous world-class deposits and operations, including Bingham Canyon, Carlin, Midas, Gold Quarry, Twin Creeks, and Yanacocha, helping add millions of ounces of gold to reserve bases
Earlier career included Vice President and Chief Geologist at MRDI, plus senior roles at Newmont Mining Corporation and AMAX Exploration; while at Newmont, led the discovery of the Pinon (South Bullion) gold deposit along the southern Carlin Trend
Held executive roles in the junior mining sector, including Vice President of Project Development at U.S. Gold Corp. and President of Western Pacific Resources
Registered Professional Geologist and Senior Fellow of the Society of Economic Geologists
ICG SILVER & GOLD LTD.
Vice President of Exploration at Terraco Gold Corp., leading project evaluation and acquisition efforts and contributing to strategic transactions, including royalty and streaming deals totaling approximately US$1 billion Exploration Manager for Riley Gold Corp., overseeing exploration programs in Nevada, and earlier a regional geologist with Western States Minerals across Nevada, Utah, and Arizona Chief Geologist at the Goldstrike Mine, contributing to the discovery and development of the Post-Betze gold deposits, with earlier operational experience as Chief Chemist and Recovery Supervisor there Held senior positions with Barrick Gold, including District Geologist at Barrick Resources Corp. and General Supervisor of Drilling and Senior Geologist at Barrick Goldstrike Mines
CSE: ICG | FRA:JI0 | OTC Pink: ICGSF
13
Tuscarora Mining District
Source 1: 43-101 Compliant Technical Report, January 7, 2026 – section 1.3. Source 2: 43-101 Compliant Technical Report, January 7, 2026 – total drilling from 1996 to 2022.
10,100+ Acre land package
Source 3: 43-101 Compliant Technical Report, January 7, 2026 – September 15, 2021 American Pacific Mining Press Release, Eric Saderholm, Table 9-5 and Figure 9-20. Source 4: 43-101 Compliant Technical Report, April 3, 2020 – table of significant historical drilling intersections. Select figures included here. Source 5: 43-101 Compliant Technical Report, January 7, 2026 – Modoc significant assays. Select figures included here.
The Tuscarora volcanic field, Nevada’s largest Eocene magmatic center (39.9–39.3 Ma), coincides with peak Carlin Trend gold mineralization (40–37 Ma). It represents the most intense gold event in the Basin and Range Province, with historic production exceeding 500,000 oz gold and 7.6 Moz silver.1
Modern Exploration Work Completed to Date2
Dexter Pit
Other Previous Owners: Chevron, Horizon Gold, Terraco Gold, Newcrest Resources, Franco Nevada, Golden Predator, among others. 2016 – Novo Resources drill program (10 holes; 1,405m) 2018 – American Pacific drill program (16 holes; 3,100m) 2019 – American Pacific JV drill program (7 holes; 2,300m) 2021 – American Pacific rock sampling program (135 samples) 2022 – American Pacific drill program (33 holes; 5,500m) 2023 – Rock sampling program, CSAMT groundwork 2026 – ICG drill program (12 holes, 3,000m)
Exploration Highlights Rock chip samples up to 21,032 g/t gold and 37,820 g/t silver3
ICG SILVER & GOLD LTD.
Novo Resources drill intercepts as high as 4.57m of 127.08 g/t gold, including 1.52m of 368.31 g/t gold and 1.52m of 52.37 g/t gold4 CSE: ICG | FRA:JI0 | OTC Pink: ICGSF
American Pacific drilled South Navajo target, results as high as 13.72m of 1.74 g/t gold, including 3.44 g/t gold over 12.2m5 14
Large Project – Huge Potential Systematic exploration to District scale opportunity Central Zone highest confidence gold and silver potential, large amount of historical drilling, sampling and CSAMT
East Zone higher silver potential, some historical drilling, good amount of sampling and CSAMT
West Zone higher gold potential, elements of Carlin-style host rock at surface, least understood but massive upside
ICG SILVER & GOLD LTD.
CSE: ICG | FRA:JI0 | OTC Pink: ICGSF
15
Historical Drill Highlights NOVO DRILLING PROGRAM1
AMERICAN PACIFIC DRILLING PROGRAMS2
(2016)
(2018-2022)
South Navajo
South Navajo
South Navajo (Continued)
4.6m of 127.08 g/t Au including: 1.5m of 368.31 g/t Au
9.1m of 5.88 g/t Au
13.7m of 2.48 g/t Au
Including: 3m of 13.42 g/t Au
including: 1.5m of 12.13 g/t Au
1.5m of 51.06 g/t Au
1.5m of 10.30 g/t Au
13.7m of 1.74 g/t Au
1.5m of 27.61 g/t Au
18.2m of 1.03 g/t Au
12.2m of 3.44 g/t Au including: 1.5m of 18.4 g/t Au
1.5m of 18.40 g/t Au
3.1m of 16.06 g/t Au including: 1.5m of 27.20 g/t Au 1.5m of 13.55 g/t Au 3.1m of 13.42 g/t Au
Including: 1.1m of 9.22 g/t Au
13.7m of 1.74 g/t Au Including: 12.2m of 3.44 g/t Au 6.1m of 2.06 g/t Au 7.6m of 2.47 g/t Au
Modoc 94.9m of 0.38 g/t Au Including: 4.6m of 1.08 g/t Au
3m of 10.73 g/t Au Including: 1.5m of 27.20 g/t Au
64.0m of 0.13 g/t Au and 11 g/t Ag Including: 1.5m of 0.58 g/t Au and 2.50 g/t Ag
1.5m of 52.37 g/t Au
4.5m of 6.51 g/t Au Including: 1.5m of 15.90 g/t Au and 1.5m of 10.95 g/t Au
6.1m of 1.81 g/t Au and 11.00 g/t Ag Including: 1.5m of 6.89 g/t Au and 29.00 g/t Ag
1.5m of 4.14 g/t Au
1.5m of 9.16 g/t Au
30.5m of 0.14 g/t Au and 4 g/t Ag Including: 3.1m of 0.42 g/t au and 13.00 g/t Ag
East Pediment
Source 1: 43-101 Compliant Technical Report, April 3, 2020 – table of significant historical drilling intersections. Source 2: 43-101 Compliant Technical Report, January 7, 2026 – Section 10.2 and 10.3, summary of 2018 and 2022 drill programs.
ICG SILVER & GOLD LTD.
CSE: ICG | FRA:JI0 | OTC Pink: ICGSF
*Au (Gold) - Ag (Silver)
16
Central and East Zone Rock Chip Sample Program Highlights¹ 2021 Modoc Target
Argentina Target
Grand Prize Target
2,850 g/t Au & 1,460 g/t Ag
21,032 g/t Au & 37,820 g/t Ag
150.50 g/t Au & 2,380 g/t Ag
391 g/t Au & >10,000 g/t Ag
121 g/t Au & 118 g/t Ag
19.45 g/t Au & >10,000 g/t Ag
98.50 g/t Au & 54 g/t Ag
3.32 g/t Au & 432 g/t Ag
85.90 g/t Au & 78 g/t Ag 51.70 g/t Au & 139 g/t Ag 44.10 g/t Au & 88 g/t Ag 30.30 g/t Au & 412 g/t Ag
Young American Target 116.50 g/t Au & 743 g/t Ag 10.20 g/t Au & 473 g/t Ag 9.38 g/t Au 1,850 g/t Ag 1.87 g/t Au & 945 g/t Ag
882 g/t Au & >10,000 g/t Ag 24.60 g/t Au & 3,610 g/t Ag 18.70 g/t Au & 4,010 g/t Ag 7.36 g/t Au & 1,609 g/t Ag 6.60 g/t Au & 4,680 g/t Ag
Unnamed Target 1 32.70 g/t Au & 29 g/t Ag 2.27 g/t Au & 8 g/t Ag
Unnamed Target 2 11.50 g/t Au & 14 g/t Ag 2.98 g/t Ag & 20 g/t Ag
*Au (Gold) - Ag (Silver)
ICG SILVER & GOLD LTD.
Source 1: 43-101 Compliant Technical Report, January 7, 2026 – Select 2021 high-grade samples, Table 9-5 and Figure 9-20.
CSE: ICG | FRA:JI0 | OTC Pink: ICGSF
17
East Zone Silver Potential Silver profile – multiple samples over 1,000 g/t Ag Up to 150:1 PPM Ag:Au
Historical drilling has typically focused on south-end of the Central Zone Silver dominant targets of the East Zone have significant potential due to confluence of samples, historical drilling, and CSAMT
Up to 15:1 PPM Ag:Au
Source: 43-101 Compliant Technical Report, January 7, 2026.
ICG SILVER & GOLD LTD.
CSE: ICG | FRA:JI0 | OTC Pink: ICGSF
18
Potential Multiple Mineralized Systems and 2026 Targets Likely two mineralized systems intersecting resulting in a high-grade Silver zone, and high-grade Gold zone Up to 150:1 PPM Ag:Au
By leveraging modern structural understanding, new geophysical interpretation, and a refined geological model to improve targeting, we aim to understand how the higher-grade zones relate to lower bulk-tonnage targets and thereby demonstrate district-scale silver-gold opportunities.
Up to 15:1 PPM Ag:Au
Source – 43-101 Compliant Technical Report, January 7, 2026.
ICG SILVER & GOLD LTD.
CSE: ICG | FRA:JI0 | OTC Pink: ICGSF
19
Central and East Zone CSAMT Highlights Central Zone Cross Section TUSCARORA CSAMT LINE 11-1
SPLAYS OF THE KING’S VEIN - UNTESTED TARGET
MODOC KING’S VEIN
PINTO
NAVAJO
SW
NE
East Zone Cross Section TUSCARORA CSAMT LINE 11-2
INTERSECTION EAST PEDIMENT AND GRAND PRIZE - UNTESTED TARGETS
ALLUVIUM GRAND PRIZE NW
ICG SILVER & GOLD LTD.
EAST PEDIMENT
EXTENSION FAULT SE
CSE: ICG | FRA:JI0 | OTC Pink: ICGSF
20
Expansion Potential of West Zone
May look to incorporate into Phase 2 program Emphasizes district scale potential of the project Adds another interesting dimension to the project that represents exceptional upside
Source: Internal models and interpretations, sample data from 43-101 Compliant Technical Report, January 7, 2026.
ICG SILVER & GOLD LTD.
CSE: ICG | FRA:JI0 | OTC Pink: ICGSF
21
CSAMT and Surface Samples in-Agreement on Near-Surface Anomalies
Flower-type formation reinforces theory of multiple overlapping systems present, being fed from a source at depth
ICG SILVER & GOLD LTD.
Paleozoic assemblage pushing towards surface on Western-edge
CSE: ICG | FRA:JI0 | OTC Pink: ICGSF
22
Valuation Against Nevada Peers Potential for valuation re-rate through continued exploration & initial resource Market Capitalization (CAD millions)
$160M
As of September 17, 2026
$97M
$100
$74M
$80 $60
$61M
ICG has enough cash to achieve initial resource
$40
$35M $23M
$20
$14M
$0
Company Name
ICG Silver & Gold
Prince Silver
Main Project Name1
Tuscarora District Silver/Gold
Western Exploration
Westward Gold
Prince Silver
Aura
Silver/Gold
Gold/Silver
Adv. Exploration
Adv. Exploration
Total Resources
Pre-resource
Shares O/S, Basic3
43M
Commodity Stage2
A2 Gold
Scorpio Gold
Lahontan Gold
Toiyabe Hills Project
Eastside
Manhattan District
Santa Fe Mine
Gold
Gold/Silver
Gold
Gold/Silver
Resource + PEA
Adv. Exploration
Resource
Resource
Pre-Feasibility
Pre-resource
1.5M oz AuEq, 1.4-2.6 g/t AuEq
Pre-resource
1.4m oz Au at 0.49-0.55 g/t Au
740k oz Au at 1.26 g/t Au
1.9M oz AuEq, <1 g/t AuEq
59M
63M
242M
135M
384M
432M
Source 1, 2: All sourced from Corporate websites and investor presentations, sourced on September 17, 2026
Lahontan Gold – 43-101 Compliant Technical Report with December 10, 2024 effective date for Santa Fe Project
Source 3: Shares O/S Basic sourced from ceo.ca on September 17, 2026
Scorpio Gold – 43-101 Compliant Technical Report with June 4, 2025 effective date for Manhattan Property
Western Exploration – 43-101 Compliant Technical Report with June 17, 2025 effective date for the Aura Gold-Silver Project
A2 Gold – 43-101 Compliant Technical Report with effective date of July 30, 2021 for the Eastside and Castle Property
ICG SILVER & GOLD LTD.
CSE: ICG | FRA:JI0 | OTC Pink: ICGSF
23
Share Capitalization & Roadmap Share Price Performance Chart
Share Capital Summary
Total
Weighted Strike
Current Basic Shares Outstanding
43,180,120
-
Warrants & Options
10,193,482
$0.50
1,161,827
-
54,535,429
-
APM Warrants Fully Diluted Shares Outstanding1
Q1 2026
Q2 & Q3 2026
Since Go public date (March 31st, 2026)
Q4 2026
Q1 2027
Acquire additional ground
Phase 1 exploration program
Announce Phase 1 assay results
Announce initial
Interpret CSAMT, complete modeling
Updated district-scale geological modeling
Announce Phase 2 Exploration plans
resource estimate
Add experience to Board
Acquired TJ prospect on West Zone
Announce plan for initial resource estimate
Complete go-public financing Confirm phase 1 exploration plan and budget Complete public listing
(1) 3,400,000 RSU’s granted to Officers and Directors in accordance with long-term incentive policy, vesting 1/3rd after each anniversary from date grant
ICG SILVER & GOLD LTD.
CSE: ICG | FRA:JI0 | OTC Pink: ICGSF
24
Investment Highlights Advanced brownfield exploration, epithermal and Carlin-type mineralization, with two over-lapping systems on a 10,100 acre, district scale land package.
Drill intercepts at South Navajo Target (2016):
Over 5,000 samples, 130 line-km of geophysics, and 40,000m of historical drilling incorporated into geological model.
Drill intercepts at East Pediment Target:
4.57m of 127.08 g/t gold, including 1.52m of 368.31 g/t gold.1
1.5m of 367 g/t Ag (1997) and 1.5m of 52 g/t Au (2016).2
Drill intercepts at Battle Mountain Target (1988):
Expert team and technical advisory board, with over 160 years of geology and Nevada-based mineral exploration experience.
1.6m of 13.6 g/t Au and 17.8 g/t Ag and 8.7 g/t Au and 41.1 g/t Ag.3
Tight capital structure, with over 25% held by management, insiders and significant shareholders.
District scale opportunity with a total of 11 drillready targets, results pending for 4 targets.
Source 1: 43-101 Compliant Technical Report, April 3, 2020 – table of significant historical drilling intersections. Select
Source 2: 43-101 Compliant Technical Report, January 7, 2026 – total drilling from 1996 to 2022.
figures included here.
Total spend sourced from American Pacific Mining September 30, 2025 Financial Statements. Source 3: 43-101 Compliant Technical Report, January 7, 2026
ICG SILVER & GOLD LTD.
CSE: ICG | FRA:JI0 | OTC Pink: ICGSF
25
Disclaimer Thank You.
Contact: Steven Sirbovan info@icgsilverandgold.com +1 (604) 908-1695
PRIVATE & CONFIDENTIAL CSE: ICG | FRA: JI0 | OTC Pink: ICGSF
82 Richmond Street East, Toronto, ON, M5C 1P1 ICG SILVER & GOLD LTD.
CSE: ICG | FRA:JI0 | OTC Pink: ICGSF
26
2026 Exploration Preparation Plan
Tuscarora District APM CSAMT Lines New ICG CSAMT Lines
CSAMT Survey Extend and refine existing geophysical targets identified in historical campaigns, provide complete subsurface coverage across the entire project area to aid future drill targeting
Technical Report Update Incorporate new data, refined interpretations, and expanded exploration models to support next-phase exploration planning
Phase-1 Drilling
Integrated Field Program
Commence in Q2
Surface Sampling Incorporate new data, refined interpretations, and expanded exploration models to support next-phase exploration planning
Claim Staking Expand property package through targeted staking of prospective ground contiguous with existing claims
Geological Mapping Detailed structural and lithological mapping to enhance the geological model and guide drill-target prioritization
Delineate Targets Both existing high-priority zones and newly identified prospects based on ongoing data integration, geophysical modeling, and land acquisitions to ensure comprehensive coverage and target ranking for upcoming drill campaigns
3D Modeling Complete a compilation of lithology, structure/vein, geophysics, drilling and geochemistry ICG SILVER & GOLD LTD.
CSE: ICG | FRA:JI0 | OTC Pink: ICGSF
27
CSAMT Geophysics 130+ line-km of CSAMT Geophysics completed on the project since 2000
Source: 43-101 Compliant Technical Report, January 7, 2026 – Figure 9-6.
ICG SILVER & GOLD LTD.
CSE: ICG | FRA:JI0 | OTC Pink: ICGSF
28
Why Silver? Why Now? The monetary & industrial metal hybrid
Silver has a large industrial component (electronics, solar panels, EVs, 5G, etc), unlike gold (which is mostly investment/monetary demand)
Historic Gold and Silver Spot Prices $140
$4,500
$120
$4,000 $3,500
$100
$3,000
$80
$2,500 $2,000
$60
$1,500
$40
$1,000
$20
$500 $0
2016
2017
2018
2019
Gold (COMEX: ^GC) - Day Close Price
For investors, the silver trade typically lags the gold trade – and this cycle, it could be even more meaningful given growth demand side of the equation
ICG SILVER & GOLD LTD.
Silver Price, USD
Because the industrial demand is somewhat decoupled from purely “investment” demand, silver may benefit both from “growth demand” (tech/ industrial) and “safehaven/inflation hedge” demand
$5,000
Gold Price, USD
As the world shifts toward renewables and electrification, silver usage is expected to increase. For example: solar photovoltaic cells often require silver due to its excellent conductivity and reflectivity
CSE: ICG | FRA:JI0 | OTC Pink: ICGSF
2020
2021
2022
2023
2024
Silver(COMEX: ^SI) - Day Close Price
2025
2026
$0
Gold/Silver Ratio
Mining Focus; sourced on January 16, 2026. Capital IQ The Great Silver Bull by Peter Krauth, 2022
29
Why Gold? Why Now? Gold mining production volumes in the USA are at 15-year lows, while non-US aligned states are producing at 15-year highs1
Global Gold Production (Tonnes)
Total Gold Production in USA (Tonnes) 250
33% decline since 2017
3,500 3,000
61.7%
2,500 2,000
54.9%
1,500 1,000 500 0
45.1% 38.3%
Tonnes of Gold Produced per Year
Tonnes of Gold Produced per Year
4,000
200
150
100
50
2010 2011 2012 2013 2014 2015 2016 2017 2018 2019 2020 2021 2022 2023 2024
North America, South America, Europe, Australia Total
Africa, Asia, Commonwealth of Independent States Total
0
2010 2011 2012 2013 2014 2015 2016 2017 2018 2019 2020 2021 2022
Mining Focus; sourced on September 25, 2025
ICG SILVER & GOLD LTD.
CSE: ICG | FRA:JI0 | OTC Pink: ICGSF
30
Why Nevada? Why Now?
Recent M&A activity in Nevada
ICG is positioning for the M&A phase of the cycle as cash-rich majors look down-cap to secure future ounces
Augusta Gold Acquisition by AngloGold Ashanti2 Deal Overview: AngloGold Ashanti acquired Augusta Gold Corp. (TSX: G) for C$1.70/share in cash, valuing the company at ~C$197M EV (C$152M equity + C$45M debt) Assets: Augusta’s Reward and Bullfrog gold projects in the Beatty District, Nevada Premium: 28% premium to last close and 37% to 20-day VWAP prior to anouncement (July 15, 2025)
Nevada is the #1 mining jurisdiction in the world1
Contact Gold Acquisition by Orla Mining3 Deal Overview: Orla Mining acquired Contact Gold for C$10.9M (US$8.1M) in an all-share deal, with Contact shareholders receiving 0.0063 Orla shares (~C$0.03/ share) and owning ~0.7% post-closing Assets: Contact’s Pony Creek (Carlin Trend) and Green Springs (Cortez Trend) projects in Nevada Premium: 77% premium to Contact’s 20-day VWAP as of February 23, 2024
A perfect environment for gold & silver exploration to grow and advance.
Timberline Resources acquired by McEwen Mining4
The Trump Administration favourable to domestic resource development Exploration successes are rewarded by the market with share appreciation Junior market is still undervalued lending to opportunities to acquire new undervalued assets and grow the portfolio Majors are looking downcap to explore cos exploration companies for JV partnerships and direct investment to secure future ounces and backfill their mine plans ICG SILVER & GOLD LTD.
Deal Overview: McEwen Mining agreed to acquire Timberline Resources for US$18.8M (C$25.9M) in an all-share merger, with Timberline shareholders receiving 0.01 McEwen share per Timberline share (~$0.102/share) Assets: Timberline’s Eureka and Windfall gold projects in Nevada, expanding McEwen’s U.S. development pipeline Premium: 132% Premium to Timberline’s 20-day VWAP on the OTCQB as of April 17, 2024 Source 1: Fraser Institute, 2025 Global Rankings Source 2: Agusta Gold Source 3: Contact Gold Source 4: Timberline Resources
CSE: ICG | FRA:JI0 | OTC Pink: ICGSF
31