2 minute read
RESULTS NOTABLE FINDINGS


The goals of this self-assessment aimed to measure participant perceptions of the frequency with which they use an Inclusive Lens.
Section A
Advertisement
·The majority of the 22 responses demonstrate frequent use of an Inclusion Lens to both observe and respond effectively to group dynamics.
·More than 75% of respondents intentionally notice/track privilege and marginalize group memberships during meetings.
·Approximately 41% of respondents perceive that they “sometimes” respond effectively when they notice stereotypic and/or exclusionary comments and behaviors in meetings, while approximately 36% of respondents perceive that they “almost always” do so.
·Over 85% of participants perceive that they are aware of how people may experience and interpret comments and nonverbal behaviors differently based on their cultural perspective, and their experiences in their multiple privileged and marginalized groups.
Section B
·The majority of the 22 respondents demonstrate a strong frequency of inclusivity and engaging others effectively.
·Over 77% of participants encourage group members to participate and engage them in the process.
·Approximately 90% of respondents selected either “almost always” or “always” use effective listening and communication techniques, including clarifying, paraphrasing, open-ended questions, etc.
·More than 77% of respondents perceive that they demonstrate empathy effectively.
Section C
In this section, responses demonstrated the most variation throughout the entire survey.
·Respectively 41% of respondents either “sometimes” or “almost always” recognize possible unintended negative differential impact across group memberships given a specific policy, practice, or program.
·31% of participants “almost always” track current utilization of programs and services within my area by group membership, while approximately 23% selected “sometimes”; there was an equal distribution of responses (approx. 18%) between “almost rarely” and “always”, while almost 10% perceived that they “rarely” do so.
·A 36% majority “sometimes” continually gather data about the impact, perceptions, and experiences of the programs, services, climate, etc, by group membership.
·A 31% majority “sometimes” use these data to continually evaluate and revise current programs, services, practices, procedures, facilities, etc., to ensure inclusion for the full breadth of students, staff, and faculty you served through our area.
·Most respondents (36%) “rarely” create process maps of current programs, services, policies, procedures, norms unwritten rules, etc , to identify when they currently create inclusion as well as areas needing greater equity, while approximately 31% “sometimes” do so
·50% of participants “sometimes” identify the discretionary points where unintended bias could result in differential treatment and experiences in planning and decision-making processes, hiring and development practices, programs, and services, policies, procedures, etc
·Respectively, almost 32% of respondents “rarely” or “almost always” continually research national/international trends and promising practices from peer institutions and other campus departments
·Over 90% of respondents perceive that they are “almost always” and “always” aware of their biases, assumptions, and stereotypes for the full range of privileged and marginalized groups.
·Similarly 90% of participants “almost always” and “always” understand how their various privileged and marginalized group memberships impact how they are perceived and experienced by others
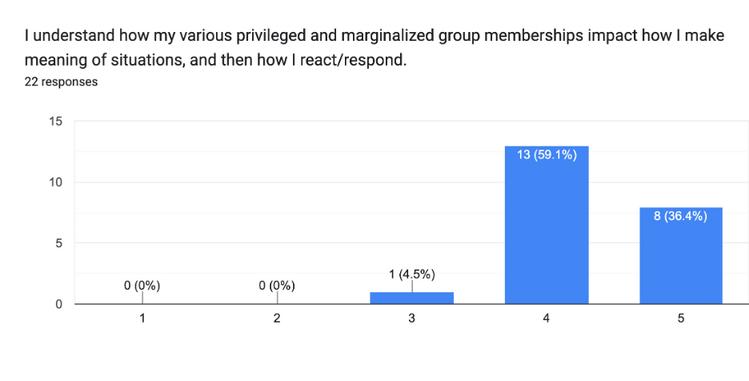
·While, over 95% of respondents “almost always” and “always” understand how their various privileged and marginalized group memberships impact how they make meaning of situations, and then how they react/respond.

