
44 minute read
SUBWATERSHED CONCERNS AND ISSUES

EXECUTIVE SUMMARY
The 2018 Basin Summary Report for the Guadalupe River Basin and LavacaGuadalupe Coastal Basin summarizes the monitoring, watershed protection activities, and water quality conditions of the watersheds in the respective basins. Historical data was reviewed for possible trends that would indicate degrading or improving water quality conditions. Section 26.0135 of the Texas Water Code dictates the information found in this report.
Advertisement
BASIN DESCRIPTION
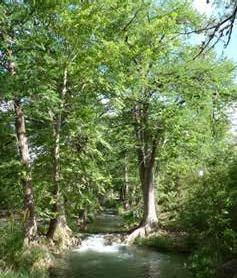
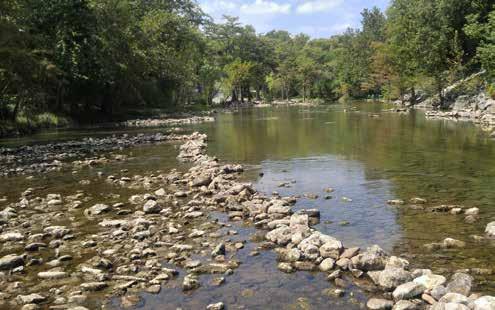
The Guadalupe River Basin varies from the steep, limestone Hill Country that is prone to flash flooding, to the flat, rolling terrain of the lower basin. Turbulent flows of the upper watershed streams result in substrates primarily composed of bedrock and large gravel and the streams are shallow and swift. The tributaries of the middle and lower Guadalupe River have sandy substrates. The lower basin substrates are silty, and the streams carry logs and debris from upstream, often collecting in log jams at the lower end of the river. The middle portion of the river basin consists of waterbodies that referred to as lakes but are really run-ofriver impoundments. In four out of five years, these lakes respond like rivers with short residence times, rather than true lakes or reservoirs with long residence times and stratification. The Guadalupe basin has two primary reservoirs, Canyon Lake and Coleto Creek Reservoir. Canyon Lake will stratify in most years, with one “turnover” that occurs in the fall. Coleto Creek Reservoir is used as cooling water for a power plant, which creates excellent habitat for aquatic vegetation and fish.
The Guadalupe River Basin is home to several endangered species. The Texas Wild Rice and the fountain darter are found in the Comal and San Marcos Springs and Rivers along with other species unique to springs and underground caves. Water quality, quantity and consistency of spring flow are critical to their habitat. The whooping crane that winters in the Aransas National Wildlife Refuge along San Antonio Bay is making a comeback. Freshwater inflows, or the lack of inflows due to diversions of water upstream, can affect the habitat and biology of this species, often considered the poster child for protection of endangered species. The Senate Bill 3 stakeholder process has recommended instream flows for the Guadalupe River and inflows into the bays and estuaries in the lower basin. The Texas Commission on Environmental Quality (TCEQ) considered these recommendations when setting the environmental flow requirements for the river. An ongoing Texas Instream Flow Program Study (Senate Bill 2) is also being conducted on the Lower Guadalupe River by the Texas Water Development Board (TWDB), Texas Parks and Wildlife Department (TPWD), TCEQ and Guadalupe-Blanco River Authority (GBRA) in order to scientifically assess how much water should flow in this portion of the river in order to maintain a healthy and sound ecological environment.
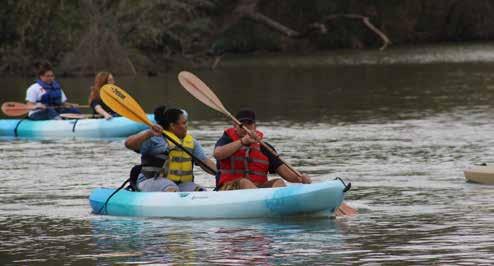
The land use of the basin includes Hill Country ranches primarily used for hunting; farms and ranches, raising row crops, cattle, goats and poultry; and, urbanized areas around the growing cities of Kerrville, Boerne, New Braunfels, Seguin, San Marcos, Lockhart, Luling, Gonzales, Cuero, Victoria, and Port Lavaca. The highest population growth is occurring along the major thoroughfares, US 281, IH 35 and SH 130, located in the central portion of the basin. Most of the industrial facilities are located in the lower basin, near the Victoria Barge Canal and ports along the coast. Recreation is an important “industry” in the upper to mid basin and reservoirs, utilizing the clear water and flows for swimming, tubing, canoeing/kayaking and fishing. Numerous summer camps can also be found on the banks of the upper Guadalupe River. Utilization of surface water for cooling occurs at power plants in Victoria and Goliad counties.
WATERSHED CONCERNS
The watershed segment summaries found in this report include discussions on stakeholders concerns. Those concerns may vary somewhat from watershed to watershed, but most have common issues. Stakeholders are concerned about the impact of human activities on water quality and how those activities will influence both the recreational and aesthetic value of the watershed. The human activities range from recreational pressure to waste discharges and disposal, or lack thereof, to urban development. Recreational activities produce trash that, if not disposed of properly, floats downstream and becomes a nuisance. The wastewater discharges that exist throughout the river basin range in level of treatment and in permitted volume. The permits are issued to municipalities for domestic waste treatment, to industries for their waste streams, and to power plants that use surface water for cooling. The level of waste treatment is improving in many of the newly-developing areas, to include nutrient removal. Reuse of wastewater is a beneficial use because it turns the treated wastewater effluent into a resource. This helps conserve water resources, but an unintended consequence of reuse is the reduction in return flows to the river which can be a factor in water quality and quantity of the river, bay and estuary. Septic tanks that are improperly installed, maintained or are failing can be a source of pollution by contributing bacteria and nutrients to the watershed. Additionally, control of illegal dumping at stream crossings is a high priority to stakeholders.
Impacts from urban development are concerns up and down the basin. The impervious cover associated with new houses and roads increases rainfall runoff. This runoff can be a source of “nonpoint source pollution” (pollution not associated with a permitted discharge pipe). The pollutants that might be captured and bio-degraded by soils,
are readily washed over cement and pavement, directly into the surface water. Additionally, impervious cover reduces groundwater recharge and in turn, reduces the base flow of the streams.
In Kerr County, the stakeholders are concerned about dense stands of ashe juniper and its propensity to intercept rainwater and prevent it from reaching the soil surface. This reduces groundwater recharge which is critical to the base flow of the river in Kerr County. The Eagle Ford Shale underlies much of South Texas, including DeWitt and Gonzales counties, which are located in the heart of the Guadalupe River Basin. The Eagle Ford Shale play is a hydrocarbon-producing geologic formation capable of producing both natural gas and oil. Hydraulic fracturing is a process to stimulate wells and recover natural gas and oil from unconventional reserves trapped underground. Landowners in these counties are concerned with the impact that the hydraulic fracturing may have on their groundwater, as well as the potential for pollution from activities entering the surface water in the runoff or from spills. In Goliad County, the stakeholders are also concerned about impacts from oil and gas production, and most recently, the in-situ mining for uranium.
MONITORING WATER QUALITY
Most sampling locations have been routinely monitored for a number of years and provide an excellent historical perspective of water quality. Only consistently collected long-term data is used for the trend analysis presented in this document. Monitoring entities include the Texas Commission on Environmental Quality, the GuadalupeBlanco River Authority, the Upper Guadalupe River Authority, the Wimberley Valley Watershed Association and the US Geological Survey. The Hays County Development Services Department initiated a monitoring program within their jurisdiction in 2012. Funding for the Hays County program was discontinued in 2013 and has been diverted to other projects.
TRENDS IN WATER QUALITY
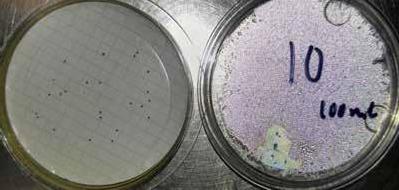
Water quality in most locations does not appear to be degrading. The historical data confirmed the impairments or concerns that were listed in the 2014 Texas Integrated Report. The concentrations of E. coli continue to be of concern at most locations throughout the basin, but significant changes over time were not found in most locations. Concentrations of chloride and sulfate anions were increasing and dissolved oxygen was decreasing at several locations throughout the basin. The changes in concentrations of these parameters closely correlates with changes in streamflow, which is often associated with rainfall runoff, or lack thereof. The drought conditions in the basin from 2009-11, impacted the water quality as many parameters such as dissolved solids became more concentrated during base flow. The hottest, driest, one year period of record in the state occurred between 2010 and 2011.
The Upper Guadalupe River in Kerr County remains listed as impaired due to bacteria in a small section in Kerrville. A total maximum daily load (TMDL) study was completed in 2007 and in 2011. The Upper Guadalupe River Authority partnered with the City of Kerrville, Kerr County, and the Texas Department of Transportation to implement the Bacteria Reduction Plan for the Upper Guadalupe River and contributing tributaries. The plan includes strategies to address the primary sources of bacteria pollution that have been identified in this section of the Guadalupe River including bird nesting on bridges, large flocks of domestic waterfowl congregating in the lakes, faulty septic systems, and pollution from general urban runoff. These efforts have resulted in improved water quality and the removal of two assessment units from the state list of impaired water bodies in 2012 and 2014. The Quinlan Creek and Town Creek tributaries have been recently incorporated into a TMDL to address bacteria impairments. Other segments in the Upper Guadalupe River basin are have concerns for depressed dissolved oxygen and biological habitat.
Canyon Reservoir remains listed as impaired due to a fish consumption
CONTINUED ON PAGE 6
advisory for mercury in fish tissue of the striped bass and long-nosed gar.
The Dry Comal Creek has been listed for contact recreation impairments due to bacteria concentrations above the contact recreation standard since 2010. This creek is a tributary of the highly recreated Comal River. Stakeholders are concerned that bacteria loading from the Dry Comal may have an impact on the Comal River. The City of New Braunfels has formed a stakeholder group and initiated a watershed protection plan with the TCEQ in order to address this issue in both watersheds.
Ammonia nitrogen concentrations are a concern on Plum Creek, especially at the upper site that is downstream of the discharges of the cities of Kyle and Buda and other smaller wastewater plants. The magnitude of the concentrations added to the concern. Sources of the ammonia nitrogen could be the wastewater effluent
that dominates the flow at this location, but septic tanks and fertilizer may also be sources. Plum Creek is impaired for contact recreation due to elevated bacteria concentrations and concerns for nitrate nitrogen and total phosphorus.
Peach, Sandies and Elm Creeks are in various stages of total maximum daily load (TMDL) development for excessive bacteria and depressed dissolved oxygen concentrations. The Peach Creek TMDL has been completed but no implementation plan has been initiated. The TMDL found that the impairment was most likely coming from non-point sources, such as failing septic tanks, livestock and wildlife. Sandies and Elm Creeks have completed the majority of the data collection, but models have not been developed that would establish the sources of the impairments or the recommended total maximum daily loads. Stakeholders in these watersheds have expressed concern that an inappropriate amount of emphasis is being placed on the necessity of the stream to meet bacteria standards for contact recreation because of the low potential for exposure to bacteria by swimmers immersed in water in these small tributaries. TCEQ has developed a process to assess the attainability of the recreational standards on these small creeks. A Recreational Use Attainability Analysis (RUAA) can be performed on waterbodies to evaluate and determine which category of recreational use is appropriate (e.g. primary, secondary one or two) based on historical and existing stream usage. Stakeholders and the TCEQ determined that the most appropriate strategy for addressing the impairments in Sandies and Elm Creeks were aquatic life and contact recreational use attainability analyses. These analyses are being conducted by the TCEQ to determine appropriate water quality standards.
Overall, the quality of the Guadalupe River and its tributaries is good. The involvement of stakeholders and the ongoing water quality protection efforts in the basin indicate the extensive commitment to maintaining the health of the Guadalupe basin.
INTRODUCTION
The Basin Summary report is designed to provide a comprehensive review of water quality data with a detailed discussion of data analysis findings for the Guadalupe River and Lavaca Coastal Basin. The report serves to develop a greater understanding of water quality conditions, as well as changes and trends in the river basin. It also serves to enhance the ability to make decisions regarding water quality issues. The report is completed every five years. In addition to the water quality data review, the report contains highlights of events, monitoring activities, and identifies issues and concerns in the Guadalupe River Basin and Lavaca Coastal Basin under the Clean Rivers Program (CRP) as well as opportunities for the public to have input into the program. The CRP is managed by the Texas Commission on Environmental Quality and funded entirely by fees assessed to wastewater and water rights permit holders. The Guadalupe-Blanco River Authority (GBRA), together with the Upper Guadalupe River Authority (UGRA), carry out the water quality management efforts in these basins under contract with the Texas Commission on Environmental Quality (TCEQ).
OBJECTIVES AND GOALS OF THE CLEAN RIVERS PROGRAM
The Texas Legislature passed the Clean Rivers Act in 1991 which requires water quality assessments for each river basin in Texas. In accordance with the Act, the TCEQ administers the Clean Rivers Program in partnership with river authorities, municipal water authorities, councils of governments and other regional entities. The goal of the program is to maintain and improve water quality within each river basin through these partnerships.
The TCEQ, GBRA and UGRA gather data from the Guadalupe River, its subwatersheds and coastal basins in a watershed management approach in order to identify and evaluate water quality issues, establish priorities for corrective action, work to implement those actions, and adapt to changing priorities. Examination of long-term data allows comparison between current and historical water quality data, and statistical analysis can indicate any trends in improvement or deterioration of water quality parameters.
COORDINATION AND COOPERATION WITH OTHER ENTITIES IN THE BASIN
GBRA and UGRA coordinate with other entities interested in monitoring in the Guadalupe River Basin. Those entities include the TCEQ, United States Geologic Survey (USGS), Texas Parks and Wildlife Department (TPWD), Texas State Soil and Water Conservation Board (TSSWCB), the Wimberley Valley Watershed Association (WVWA) and Texas Stream Team. Annually, all cooperators monitoring in the basin meet to coordinate their activities. This coordination minimizes duplication, focuses monitoring and resources where needed and helps prevent voids in coverage across the basin.
The WVWA is an important partner in the Guadalupe River basin. This entity has determined that managing water resources is of paramount importance for the continued health and welfare of the local citizens and economy. WVWA funds the Blanco River – Cypress Creek Water Quality Monitoring Program. The purpose of the program is to be proactive in protecting the Wimberley area water resources. The objectives of the monitoring program are to detect and describe spatial and temporal changes, determine impacts of point and nonpoint sources, and assess compliance with established water quality standards for Cypress Creek and the Blanco River. The monitoring program is conducted under the Guadalupe River Basin Clean Rivers Program Quality Assurance Project Plan (QAPP). By following the strict quality control guidelines spelled out in the QAPP, the data can be contributed to the TCEQ Surface Water Quality Database for use in stream assessments.
The Guadalupe River Basin Clean Rivers Program supports Texas Stream Team monitoring groups in the basin. GBRA supplies replacement chemicals and provides training for monitoring and quality assurance to the volunteer monitors in the basin. Currently there are groups monitoring on the Guadalupe River and Geronimo Creek near Seguin, Cypress Creek in Wimberley, the San Marcos River, the Blanco River and tributaries, the Comal River and Canyon Reservoir, and Plum Creek and its tributaries.
Another example of the role that CRP plays in the basin is the contribution of quality-assured data used in the watershed planning efforts going on in the river basin. The water quality data collected by the Clean Rivers Program is used by TCEQ to assess streams to determine if they are meeting the stream standards for their designated uses. Secondly, the data is used to determine the need and extent that watersheds could benefit from watershed protection plans. There are four watershed protection plans in various stages of development in the Guadalupe River Basin.
The Plum Creek Watershed Protection Plan (PCWPP) was accepted by the U. S. Environmental Protection Agency in 2008. The PCWPP was the result of a stakeholder driven process and provided the foundation for ecological restoration of Plum Creek and its tributaries. Plum Creek is located in Hays and Caldwell counties in one of the most rapidly growing areas in the state. Based on routine water quality sampling, TCEQ listed portions of Plum Creek for high E. coli bacteria in 2004. The elevated bacteria concentrations indicated that the creek no longer supported the designated use for contact recreation. Additional segments of the creek were identified as having high nutrient concentrations. The Plum Creek Watershed Partnership developed a watershed protection plan. Based on the pollutant sources in the watershed, the plan detailed both the management measures and the timeline that will help meet the goal of restoring the water quality of the stream. GBRA continues to monitor three routine sites on the main stem as a part of the Clean Rivers Program. The data generated for these sites can be used to assess the success of the implementation of the management measures identified in the plan.
The Geronimo and Alligator Creeks Watershed Partnership’s Watershed Protection Plan accepted by the USEPA in 2012. Like the Plum Creek plan, the Geronimo and Alligator Creek Watershed Protection Plan can be used to restore the environmental health of the creeks. Geronimo Creek and its tributary, Alligator Creek, are located in Comal and Guadalupe Counties in an area like many in the basin transitioning from a rural to urban landscape. The Watershed Protection Plan outlined a series of implementation measures that will reduce nonpoint source pollutant loading from urban storm water sources, such as pet waste, and from wildlife and nondomestic animals such as feral hogs. The plan recommends the development of water quality management plans on the agricultural operations in the watershed. GBRA continues to monitor monthly at the CRP station that originally identified the bacterial impairment of the stream and continues to monitor the site to provide data to assess the effectiveness of implementation measures.
The Cypress Creek Watershed Protection Plan was developed by stakeholders under the facilitation of the Meadows Center for Water and the Environment at Texas State University. The plan was accepted by the EPA in 2016. The goal of the plan is to protect and preserve the water quality of Cypress Creek that flows through the city of Wimberley for present and future generations. Based on routine monitoring that is conducted by the Clean Rivers Program and by the WVWA, Cypress Creek is still attaining its designated uses and has not been identified as an impaired water body. The Cypress Creek Project is proactive, working to preserve the water quality, rather than restore it from an impaired condition. The plan is focused upon preserving springs flows and reducing non-point source pollution.
CONTINUED ON PAGE 8
The project is financed by grants from the Texas Commission on Environmental Quality through the Environmental Protection Agency Region VI.
Two other watershed protection plans are under development in the Guadalupe River Basin. The Meadows Center for Water and the Environment has been developing a watershed protection plan for the Upper San Marcos River. No current impairments or concerns exist in this watershed. The City of New Braunfels is facilitating the development of a plan for the Dry Comal Creek and Comal River to reduce bacteria loading in these watersheds.
OVERVIEW OF THE GUADALUPE RIVER BASIN
The Guadalupe River Basin is located in south central Texas, with the headwaters in the Hill Country. The river is 432 miles long and flows southeastward through a drainage area of 6,061 square miles. The land mass that makes up the basin is divided into two distinct regions by the Balcones Escarpment. The northern region consists of the Edwards Plateau of the Great Plains Province. The area has variable topography, with rolling hills divided by limestone-walled valleys. The southern region is referred to as the Gulf Coastal Plains area and consists of gently sloping prairie. The basin’s principle tributaries are the North and South Fork of the Guadalupe River, Johnson Creek, the Comal River, the Blanco River, the San Marcos River, Geronimo Creek, Plum Creek, Peach Creek, Sandies Creek and Coleto Creek. The springs that feed the Comal and San Marcos Rivers have an average monthly discharge of 382 cubic feet per second and 187 cubic feet per second respectively. The Comal River is more subject to drought conditions and has ceased to flow during the severe drought of the 1950’s. The San Marcos River is much more environmentally stable.
The geology of the area consists primarily of sedimentary material that was deposited during the latter Mesozoic era from approximately 100 million years ago to 65 million years ago and the current Cenozoic Era. The principle geologic structures in the basin are the Balcones and Luling fault zones. The Balcones Fault Zone consists of a series of semi-parallel faults, about 14.9 miles, extending from Hays County southwestward to Bexar County. The Luling Fault Zone extends from Caldwell County to Medina County and is 9.9 to 19.8 miles southeast of the Balcones Fault Zone. The displacement varies from less than three feet to a combined displacement of over 1500 feet. The Trinity group of limestones and Edwards limestone covers the Edwards Plateau.
The Guadalupe River Basin and Lavaca-Guadalupe Coastal Basin are located within four ecoregions. The delineation of ecoregions is based on geographic conditions that cause or reflect differences in ecosystem patterns. These conditions include geology, physiography, vegetation, climate, soils, land use, wildlife and hydrology. The basin lies within the Edwards Plateau (Ecoregion 30), the Texas Blackland Prairie (Ecoregion 32), East Central Texas Plains (Ecoregion 33) and the Western Gulf Coastal Plain (Ecoregion 34). In the technical section of this report, specific information on the land use, climate, soil, and key factors that impact water quality are described on the sub-watersheds of the basin.
The Edwards Plateau Ecoregion is characterized by springfed perennial streams and is predominantly rangeland. The Texas Blackland Prairie Ecoregion has timber along the stream, including oak, pecan, cypress, cedar elm and mesquite. In its native state, it was largely a grassy plain, but most of the area has been cultivated and only small areas of meadowland remain. The East Central Texas Plains Ecoregion is characterized by subtropical dryland vegetation made up of small trees, shrubs, cacti, weeds and grasses. Principal plants include mesquite, live oak, post oak, blackbrush acacia, and huisache. Long-continued grazing has contributed to the dense cover of brush. The gulf coast and marshes of the Western Gulf Coastal Plains are divided into two subunits: marsh and salt grasses at the tidewater and bluestems and tall grasses more inland. Oaks, elms and other hardwoods grow along the streams. The area is abundant with fertile farmland.
The climate of the region is mild and normal temperatures seldom fall below 32oF in the winter. The basin averages 32 inches of rainfall per year, when considering rainfall data in 2017. The rainfall amounts vary with season, with the minimum occurring in the winter and the maximum in the late spring and early fall. The cool season begins in November and extends through March. According to the latest USGS Water-Data Report from 2013, the annual average runoff in the northern part of the river basin is 161,400 acre-feet per year, 1,476,000 acre-feet per year in the middle portion, and 1,396,000 acre-feet in the lower basin. These discharge volumes represent the amount of water reaching the stream, in the form of runoff, annually at the cities of Comfort, Gonzales and Victoria respectively.
The main stream impoundments located in the river basin include UGRA Lake; Flat Rock Lake; Canyon Reservoir; Lakes Dunlap, McQueeney, Placid, Meadow, Gonzales and Wood; Green Lake and Coleto Creek Reservoir. Canyon Reservoir, built in the 1960s, is the largest impoundment in the river basin and has 8,230 surface acres at the 909 feet above mean sea level conservation storage capacity. It is a multipurpose reservoir designed to serve flood control and water supply functions. It is also used for recreation. UGRA Lake, Flat Rock Lake and Lakes Dunlap, McQueeney, Placid, Meadow, Gonzales and Wood are run-of-river impoundments, used for water supply and hydroelectric power generation.
As populations in the basin grow, the potential for associated anthropogenic
impacts increase. Along with urbanization comes increases in impervious cover, larger volumes of wastewater discharged to the stream and greater demands on water supplies, reducing the base flow of the river. The population of the counties in the basin was estimated to be 673,944 in 2010, with the heaviest concentrations in Victoria, Comal, Hays, Kendall and Guadalupe Counties. The fastest growing counties in the region are located in the Guadalupe River Basin: Hays, Comal, Guadalupe, Kendall and Caldwell Counties. These counties are experiencing explosive growth as the populations of the cities of San Antonio and Austin spill over to the communities in the river basin. Additionally, other significant changes have occurred in the watershed that have caused the population and the landscape to change. The oil and gas exploration in DeWitt and Gonzales Counties has caused the population and construction activities to rise in these counties. According to the University of Texas at San Antonio (UTSA) Center for Community and Business Research the increased revenue from the Eagle Ford Shale will lead to the creation of approximately 117,000 fulltime jobs by 2021. State Highway 130, the tollway that gives traffic an alternative to Interstate Highway 35, connecting Austin and San Antonio, is predicted to see a large amount of commercial and residential growth over the next ten years.
Agriculture, in the form of crops and livestock production, is the primary industry in the basin, with the manufacture of steel, gravel, plastics and chemicals contributing to the economy of the basin as well. Oil and gas production can be found in all counties but especially in the mid-Basin. The Eagle Ford Shale Play, located in DeWitt and Gonzales counties, has become one of the richest oil and gas deposits in Texas because of the exploration technology called hydraulic fracturing or “fracking.” Fracking is the process to stimulate wells and recover natural gas and oil by creating fractures that extend from a well bore into formations and allow the product to be extracted more easily.
SUMMARY OF WATER QUALITY CHARACTERISTICS
The water quality of the Guadalupe River is highly influenced by the ground water that makes up its baseflow. The largest contribution to the baseflow is the Edwards Aquifer, with additional volume from the Cow Creek, Trinity, Leona, Carrizo, and Gulf Coast Aquifers. Each aquifer is unique in its water quality, discharge points and volume. The headwaters of the Guadalupe are located in Kerr County, and originate from springs in the North and South Forks. The discharge of the Edwards Aquifer at the Comal Springs and San Marcos Springs form two small, crystal clear lakes, which support aquatic vegetation and wildlife, including the fountain darter and Texas Wild Rice, two endangered species. Springs that come from the Leona formation, which is high in nitrate-nitrogen, are suspect to be a partial source of the nutrient concern and dissolved solids in Plum and Geronimo Creek.
The Guadalupe River flows through Kerr and Kendall counties and into Canyon Reservoir, the largest reservoir in the basin, located in Comal County. Canyon Lake impounds water for water supply, flood control, and recreation. The water exits the reservoir through a bottom penstock and is used for hydroelectric generation. A more complete description of the releases from the reservoir is given in the technical section. In most years, the lake stratifies in the late summer months and, after the first strong cold front of the winter, usually in October, the lake will experience a lake “turnover”. During times of lake stratification, the bottom release from the reservoir is low in temperature and dissolved oxygen. The water is aerated as it leaves either the hydroelectric plant or penstock. The cold water conditions of Canyon Reservoir’s bottom release have been utilized by TPWD and Trout Unlimited for a put and take trout sport fishery.
Downstream of Canyon Reservoir, the Guadalupe River flows over bedrock substrate and through swift water runs. The river is shallow, with few pools until it nears the city of New Braunfels, where it confluences with the Comal River and enters the first of six hydroelectric impoundments. The flow through the impoundments is diverted through turbines to generate hydroelectric power. These impoundments are nutrientrich, with nitrogen and phosphorus contributions from wastewater discharges and organic sediments. The impoundments exhibit the water quality conditions of a flowing stream in years of high flow. In years of medium to high flows, the impoundments have low chlorophyll concentrations and no stratification. In years of low flow conditions, the impoundments provide the residence time needed for the assimilation of nutrients that promote higher chlorophyll production. During periods of low flow the impoundments also exhibit weak thermal stratification. Historically, these impoundments have been subject to infestations of non-native aquatic vegetation and algal blooms during periods of normal and low flow conditions.
From Kerr County to Refugio County, the Guadalupe River receives treated wastewater discharges. The cities of Kerrville, Boerne, Buda, New Braunfels, Kyle, San Marcos, Lockhart, Luling, Seguin, Gonzales, Cuero, and Victoria, along with other small wastewater treatment plants, discharge treated wastewater, Most of these plants provide at least secondary treatment of the wastewater to reduce total suspended solids (TSS) dissolved organic material. In several locations, the Guadalupe River or one of its tributaries is used for cooling water. In the upper part of the watershed, a power plant diverts flow from the Guadalupe River to mix with treated wastewater and use as cooling
CONTINUED ON PAGE 10
water. This is a zero discharge facility and no water is returned to the stream. Near the city of Victoria, a portion of the flow in the Guadalupe River is diverted to serve as once-through cooling water for a power plant, and then returned to the stream. The Coleto Creek Reservoir also serves as cooling water for the power plant located in Goliad County. In these last two locations, the water is returned warmer than the receiving stream. Coleto Creek Reservoir was designed to hold the water long enough to dissipate the heat. The warm water conditions are conducive for the growth of aquatic vegetation. The volume and temperature of the release from the power plant near Victoria is regulated by a discharge permit that is protective of the receiving stream.
At the lower end of the basin, the Guadalupe River confluences with the San Antonio River. The Guadalupe River Diversion Canal and Fabridam are located below the confluence with the San Antonio River. The fabridam is made up of two large inflatable bags that are used to prevent salt water intrusion from the bay during times of low river flows. A canal system diverts fresh water for irrigation and municipal water supply.
WATER QUALITY MONITORING
The Guadalupe-Blanco River Authority and the Upper Guadalupe River Authority have been monitoring under the Clean Rivers Program since 1996. Prior to the partnership with TCEQ in the CRP, both entities had routine monitoring programs. Other entities contributing data to the historical database include the Texas Commission on Environmental Quality’s Surface Water Quality Monitoring, the Texas State Soil and Water Conservation Board (TSSWCB) and the United States Geological Survey (USGS).
These monitoring programs collect and analyze data under an approved Quality Assurance Project Plan (QAPP). The QAPP is used to plan, organize and define the quality assurance process for the program. Quality assurance is the integrated system of management activities that ensures that data generated is of the type and quality needed for its uses. Those uses include planning, assessment and water quality management. Elements of the program that are controlled by the QAPP include measurement performance specifications, appropriate methods, field and laboratory quality control, data management, and verification and validation of the data. Additionally, oversight of the laboratory quality system and process of corrective actions are described in the QAPP. The current QAPP is available for review on the GBRA CRP webpage.
Table 1 is the summary of water quality sampling currently being performed in the basin. The sections in this report are divided by sub-watershed or segment and will discuss the historical trends observed in the data review and factors that may be impacting water quality within each sub-watershed.
The Texas State Soil and Water Conservation Board is funding water quality monitoring programs on Plum Creek and Geronimo and Alligator Creeks in support of the implementation of the watershed protection plan developed on these creeks. These plans were developed using data collected by the Clean Rivers Program and the TCEQ’s Surface Water Quality Monitoring program and in the case of the Geronimo Creek plan, with additional monitoring done in advance of the plan development. Using the existing monitoring of the three sites on Plum Creek and one site on the Geronimo Creek by TCEQ and GBRA’s CRP as match, TSSWCB has funded additional monitoring in these watersheds with Clean Water Act Section 319(h) funds. GBRA, under an EPA-approved QAPP, is performing both routine and targeted monitoring and monitoring springs and storm water within the watersheds. The data are submitted to the TCEQ and may be included in the biennial assessments.
These monitoring programs are done under a Quality Assurance Project Plan (QAPP). The QAPP is used to plan, organize and define the quality assurance process for the program. Quality assurance is the integrated system of management activities that ensures that data generated is of the type and quality needed for its uses. Those uses include planning, assessment and water quality management. Elements of the program that are controlled by the QAPP include measurement performance specifications, appropriate methods, field and laboratory quality control, data management, and verification and validation of the data. Additionally, oversight of the laboratory quality system and process of corrective actions are described in the QAPP. The current QAPP is available for review on the GBRA CRP webpage.
In compliance with sections 305(b) and 303(d) of the Federal Clean Water Act, the TCEQ evaluates water bodies in the state and identifies those that do not meet the uses and criteria defined in the Texas Surface Water Quality Standards. EPA has established guidance that directs TCEQ to document and submit the assessment results to EPA biennially, in even numbered years. The 2014 Texas Integrated Report for Clean Water Act Sections 305(b) and 303(d) summarizes the condition of the state’s surface waters, including concerns for public health, fitness for use by aquatic species and other wildlife, and specific pollutants and their possible sources (TCEQ, 2013). It describes the status of water quality in all surface water bodies in the state that were evaluated for the assessment period. The data used in the assessment comes from various sources, including the Guadalupe River Basin CRP partners, TCEQ’s Surface Water Quality Monitoring program and other contributors. Given the regulatory implications associated with the use of the water quality data, the data used in the assessment process must be collected using consistent and scientifically rigorous sampling and laboratory methods. Data collected under an accepted quality assurance project plan that describes the integrated system of management activities ensures that data generated is of the type and quality needed for its uses is assessed. The 2014 Guidance for Assessing and Reporting Surface Water Quality in Texas dictates which data will be evaluated in the biennial Texas Integrated Report. Data that are not collected under a TCEQ-approved quality assurance plan, if submitted, must be accompanied by documentation of quality assurance for evaluation by TCEQ water quality staff. Data without appropriate quality assurance documentation will be considered as anecdotal evidence to support or refute assessment results, but will not be used in statistical evaluations. On July 1, 2008 requirements regarding laboratory accreditation went into effect. Data analyzed after that must comply with the National Environmental Laboratory Accreditation Conference (NELAC) standard to be used to generate the Integrated Report (See 30 TAC, Chapter 25). Both the GBRA and UGRA laboratories are accredited by the Texas Environmental Laboratory Accreditation Program administered by the TCEQ.
The quality of the water described in the assessment report is a snapshot of conditions during the specific time period considered in the assessment. The 2014 assessment covers the period of record from 12/1/2005 to 11/30/2012. Assessors have the option of including more recently collected data than 12/01/2012, if available. The TCEQ assessment process has been developed by TCEQ staff through a stakeholder process. River authorities and CRP partners are invited to participate in the development and review of the assessment guidance.
Water quality standards are comprised
of two parts, designated uses and the associated criteria for stream conditions necessary to support that use. The uses of a water body include aquatic life use, providing a suitable environment for fish and other aquatic organisms; and contact recreation use, providing water that is safe for swimming and other recreational activities. The criteria for each use may be described numerically or expressed in terms of desirable conditions. Uses and criteria are assigned to a segment. A segment is a water body or a portion of a water body with a specific location, defined dimensions, and designated or presumed uses. If the criteria of a segment are not met, then the segment is designated as impaired. If nonattainment of the criterion is imminent, then the segment is designated as having a concern.
After assessments are completed, water bodies are designated as impaired if the stream does not meet the numeric stream standard or as a concern if the conditions match those scenarios described above. Overall, the quality of the Guadalupe River Basin is good. According to the 2014 Texas Integrated Report for Clean Water Act Sections 305(b) and 303(d), nine waterbodies in the Guadalupe River Basin were found to be impaired for recreational use, aquatic life use, or fish consumption use (Table 2). Eighteen waterbodies were found to have at least one concern for general use, aquatic life use, or recreational uses. The most common impairments and concerns
CONTINUED ON PAGE 12
in the basin were for bacteria, depressed dissolved oxygen, and nitrate nitrogen concentrations.
PUBLIC PARTNERSHIPS
The GBRA sustains a number of communication mechanisms to support the CRP in the Guadalupe Basin, striving to maintain active communication with the public to pursue the goals of public involvement and education in water quality issues. GBRA develops opportunities for direct public participation to ensure that community concerns are addressed. These include quarterly GBRA River Run, website updates, issuing press releases regarding various water topics, and providing presentations to the public.
THE GUADALUPE RIVER BASIN STEERING COMMITTEE
A major communication vehicle for the CRP is the Basin Steering Committee. Composed of community leaders and interested citizens from throughout the basin, this group meets annually to review activities and advise the program on priorities for monitoring and special studies. The Steering Committee membership includes: representation from municipalities, counties, industries, homeowner organizations, Texas Soil and Water Conservation Board, Texas Parks and Wildlife Department, Texas Department of Agriculture, Texas Railroad Commission, League of Women Voters, chambers of commerce, and local/ regional environmental organizations. Steering Committee meetings are OPEN TO THE PUBLIC with the primary purpose of reviewing and approving achievable basin water quality objectives and priorities, considering available technology and economic impacts, and guiding work plans and the allocation of available resources. Notice of the Steering Committee meetings is made available by emailed notices, as well as on the meeting page of the GBRA website (www.gbra.org).
SPECIAL SUB-COMMITTEES FOR LOCAL WATER QUALITY ISSUES
In addition to the Basin Steering Committee for the CRP, the GBRA has established the Hydroelectric Lake Citizens Advisory Committee and the Coleto Creek Reservoir Advisory Committee. These groups are given the opportunity to hear, question and give input on activities to control nuisance, non-native aquatic vegetation each year as well as lake operations and safety. The committees have representatives from homeowners associations, potable water systems, bass clubs, boating sales companies, industries, as well as the Texas Parks and Wildlife Department and Texas Department of Agriculture. These committees also receive invitations to the CRP steering committee meetings.
REGIONAL LAB The Regional Laboratory located at the General Offices of GBRA in Seguin provides technical assistance and support to GBRA’s operations, as well as municipalities, water districts, industries, engineering firms and other organizations as they comply with federal, state and local regulatory requirements that protect water quality. The Regional Laboratory has received its accreditation from the Texas Environmental Laboratory Accreditation Program. The Regional Lab is equipped to perform p h y s i c a l , chemical and b i o l o g i c a l analyses of water from n a t u r a l s t r e a m s , p o t a b l e water and wastewater treatment plants, groundwater wells and treatment residuals, utilizing current technology and equipment. The Regional Laboratory serves as a contract laboratory for the CRP. In addition to its broad water quality planning initiatives and participation in environmental and water quality monitoring programs within the river basin, the laboratory also sponsors and trains Texas Stream Team water quality monitors, a statewide volunteer program created under the Texas Clean Rivers Act of 1994 to involve citizens in the testing and protection of water resources. The lab also conducts presentations for schools, civic and other organizations on water quality, environmental issues, Texas Stream Team and other water-related subjects. The laboratory maintains strong working relationships with federal, state and local government agencies responsible for water quality, as well as corporations and individuals capable of affecting water quality.
PUBLIC EDUCATION EFFORTS
GBRA’s award-winning fourth-grade program, Journey through the Guadalupe River Basin maintains a strong presence in schools throughout the river basin. This Texas Essential Knowledge and Skills (TEKS) correlated program takes an interdisciplinary approach to the subject of water, placing an emphasis on watersheds and water quality, specific to the Guadalupe River Basin. In addition, the curriculum touches on the water cycle, water uses in the basin, population growth, and water conservation. GBRA continues to offer teacher trainings for this program.
Waters to the Sea, Guadalupe River
is a multi-media middle school program used throughout the river basin. This interactive learning program highlights relationships between human activities and water resources within the Guadalupe watershed from the river’s headwaters to San Antonio Bay. The program addresses Texas science and social studies education standards through numerous short videos, animations, simulations, and multimedia interactives that draw from the region’s rich history. Modules will focus on themes ranging from traditional Native American uses of natural resources, to the importance of water for agriculture, to the impacts of urban growth on surface water runoff, to the importance of wetlands at the bay.
Education staff makes a concerted effort in both the Plum Creek and Geronimo Creek watersheds. Water quality education and monitoring are introduced to fourth and fifth grade students in these target watersheds. School year 2017-2018 was the twelfth consecutive year GBRA Education staff led efforts in public elementary schools in the Plum Creek watershed. Working side by side with teachers and students, GBRA staff spent three weeks in classrooms presenting information using a tabletop watershed model to discuss watersheds, nonpoint source pollution and the Plum Creek project directly with the students. All needed supplies were donated to the schools including water monitoring test kits, watershed map posters and student workbooks. A total of 1,100 students and 30 teachers conducted water quality testing in the spring. Using the Texas Stream Team methods as a model for their monitoring, students have tested water from Plum Creek for the following parameters: temperature, dissolved oxygen, pH, turbidity, nitrates, and phosphates and bacteria. The results of the student monitoring indicate a slight decrease in dissolved oxygen and increases in phosphates and nitrates as the creek moves from the urban area in the northern portion of the watershed to the more rural southern area. Efforts in the Geronimo Creek watershed are implemented through programming at the Irma Lewis Seguin Outdoor Learning Center. Primarily fourth and fifth grade students are provided the opportunity to explore water quality through a variety of activities, including macroinvertebrate collection and identification, riparian studies and water quality testing.
OVERVIEW OF THE TECHNICAL SUMMARY
The technical summary section provides a review of the water quality conditions in the Guadalupe River Basin. Also included in this section is a discussion of the latest biennial assessment of the surface water quality done by TCEQ. In an evaluation of the water quality data, stations and parameters for which the data met sample number and sampling duration criteria were statistically examined to identify and verify trends. Also considered in the evaluation of the data were the results of biological analyses if available, land uses, soils and vegetation, and point source discharges. The factors at play in each sub-watershed are considered in order to identify and prioritize concerns or impairments and their most probable causes, recommend future monitoring activities, implementation of control or remediation actions, public outreach, or other appropriate measures. The origin of the data and the analytic procedures used to evaluate the data are explained in the section, Description of Water Quality Assessment Process. The Watershed Summaries section provides an overview of existing data, a discussion on the water quality concerns identified during the screening process and an assessment of
the trends seen in the water quality data.
The screening and assessment of water quality conditions in this Basin Summary Report is organized by watershed, segment and station. A watershed is the total area drained by a particular stream. The Guadalupe River basin is broken into 15 watersheds for this report. For assessment and trend analysis, the watersheds were broken down further into sub-watersheds and then further by segment. Segments are contiguous reaches that exhibit similar physical, chemical and biological characteristics for which a uniform set of standards apply. Most segments have one monitoring location. But in those
CONTINUED ON PAGE 14
cases where there are multiple sampling locations, the data sets were combined to observe differences within the segment, and/or to strengthen the analyses by increasing the number of data points used in the assessment. If two or more sites within one segment were statistically different for any water quality data type, the data was not combined for more than a comparison between sites and the difference was noted.
For evaluation of trends over time, water quality data available from the TCEQ’s Surface Water Quality Monitoring Information System was divided by station and then by parameter. The historical period of data examined varied by station, but generally encompassed all available data collected between December of 2002 and June of 2017. This time frame was examined in order include the data used from the previous 2013 Basin Summary Report in the evaluation of trending changes. The historical period examined utilized substantially similar collection and laboratory texting methodologies. For a given station and parameter the number of data points used in the initial trend analyses was at least 20 points over the historical period, with at least three measurements per year, in five or more years. The data sets that met the data criteria were compared over time to observe any trends using statistical tools in Excel. Each data set was evaluated for normality by comparing skewness and kurtosis to a normal distribution using the Jarque-Bera goodnessof-fit test. Linear regressions were performed to confirm the significance of the trend. Additionally, a graph and narrative were created to explain any significant trends. A trend was identified as significant by evaluating the F-test of overall significance for each regression model. The probability value or “p value” generated by the F-test was compared to a predetermined p-critical value. The default p-critical value that was utilized for this analysis was 0.05, but a 0.10 p value was also utilized at some stations in order to evaluate specific parameters of concern. If the “p value” was less than the predetermined p-critical value then the regression model was determined to be significant. A “p value” less than the p-critical value indicates that there is a high chance that at least some of the regression coefficients for the model are not equal to zero and that the regression model has some degree of validity.
When looking for potential changes in water quality conditions, water quality parameters are compared over time. The
statistical comparisons and graphs of these comparisons can show if there are overall upward or downward trends at a location or in a segment. The graphed data can be represented with or without a line that connects the data points. The line may make it easier to see seasonal patterns in the water quality data. It should be recognized that if the data points are connected by a line in time comparisons, the line between the points does not represent the true conditions of the stream between the times that the data was actually collected.
Table 1. Monitoring parameter and frequencies conducted by monitoring partners in the Guadalupe River Basin in 2018 Sampling
Entity Field Parameters Conventional Parameters Bacteria Biological and Habitat 24 Hr. Dissolved Oxygen GBRA 19 sites, monthly; 12 sites, quarterly 19 sites, monthly; 12 sites, quarterly 19 sites, monthly; 12 sites, quarterly 2 sites, twice yearly 1 site, twice yearly UGRA 6 sites, monthly; 11 sites, quarterly 11 sites, quarterly 6 sites, monthly; 11 sites, quarterly 1 site, twice yearly TCEQ 9 sites, quarterly 9 sites, quarterly 9 sites, quarterly WVWA 9 sites, quarterly 9 sites, quarterly 9 sites, quarterly 2 sites, twice yearly
Table 2. Summary of Findings from the 2014 Texas Integrated Report of Surface Water Quality in the Guadalupe River Basin. (Assessed using data inclusive of December 1, 2005 through November 30, 2012)
SEGMENT NUMBER WATER BODY 1701 Victoria Barge Canal 1801 Guadalupe River Tidal 1802 Guadalupe River Below San Antonio 1803 Guadalupe River Below San Marcos River 1803A Elm Creek
1803B
1803C 1803D 1803E 1803F 1803G 1804 1804A 1804C 1804D 1805 1806 1806A 1806D 1806E 1807 1807A 1808 1809 1810 1810A 1811 1811 1812 1813 1814 1815 1816 1817 1818 Sadies Creek
Peach creek Salty Creek Little Elm Creek Denton Creek Sandy Fork Guadalupe River Below Comal River Geronimo Creek Alligator Creek Bear Creek Canyon Lake Guadalupe River above Canyon Lake Camp Meeting Creek Quinian Creek Town Creek Coleto Creek Perdido Creek Lower San Marcos Lower Blanco River Plum Creek Town Branch Comal River Dry Comal Creek Guadalupe River Below Canyon Dam Upper Blanco River Upper San Marcos River Cypress Creek Johnson Creek North Fork Guadalupe River South Fork Guadalupe River
Impairment or Concern Nirtrate-Nitrogen And Chlorophyll - A Nirtrate-Nitrogen Nirtrate-Nitrogen Nirtrate-Nitrogen Depressed Dissolved Oxygen Chlorophyll - A Depressed Dissolved Oxygen; Impared Fish And Macrobenthic Communities; Bacteria; Impared Biological Habitat; Chlorophyll - A Depressed Dissolved Oxygen; Bacteria; Impared Fish Community; Total Phosphorus And Chlorophyll - A Not Assesed Not Assesed Not Assesed Not Assesed No Impairments Or Concerns Bacteria; Nirtrate-Nitrogen No Impairments Or Concerns Bacteria; Mercury In Edible Fish Tissue; Amonia-Nitrogen Impaired Biological Habitat Depressed Dissolved oxygen Bacteria; Depressed Dissolved oxygen Bacteria; Depressed Dissolved oxygen No Impairments Or Concerns No Impairments Or Concerns No Impairments Or Concerns No Impairments Or Concerns Bacteria; Depressed Dissolved Oxygen; Impaired Biological Habitat; Nirtrate-Nitrogen; Total phosphorous Bacteria; Depressed Dissolved Oxygen; Nirtrate-Nitrogen No Impairments Or Concerns Bacteria; No Impairments Or Concerns No Impairments Or Concerns No Impairments Or Concerns Depressed Dissolved Oxygen; Impaired biological habitat No Impairments Or Concerns No Impairments Or Concerns Depressed Dissolved Oxygen;
Impairment or Concern removed in 2014
Bacteria
Bacteria Bacteria
Bacteria
Depressed Dissolved oxygen Total Dissolved Solids
Category Note 1 Note 1 Note 1 Note 1 5b; Note 1
5b; Note 1
5b
5b; Note 1
Note 1 5c; Note 1 Note 1 Note 1 5a; Note 1 5a; Note 1
4b; Note 1 Note 1
5c
Bolded text indicates an impairment of the water quality standard. Note 1: A water quality concern was identified rather than an impairment of a designated use. Concerns are identified for bodies of water nearnonattainment of water quality standards (CN) or not meeting numerical screening levels (CS). Category 4: Standard is not attained or nonattainment is predicted in the near future due to one or more parameters, but no TMDLs are required. 4b – Other pollution control requirements are reasonably expected to result in the attainment of the water quality standard in the near future. Category 5: Standard is not attained or nonattainment is predicted in the near future for one or more parameters. 5a – TMDLs are underway, scheduled, or may be scheduled for one or more parameters. 5b – Review of the standards for one or more parameters will be conducted before a management strategy is selected, including a possible revision to the water quality standards. 5c – Additional data or information will be collected and/or evaluated for one or more parameters before a management strategy is selected.
