
Global Renewables Market Report: First Half 2026

Global Renewables Market Report: First Half 2026

Adam Cherry
Portland, OR
As Senior Director, Clean Energy Origination, Adam helps clients negotiate and execute commercial transactions, including power purchase agreements for renewable energy supply.

Anesa Muzurović Sarajevo, BIH
As Senior Brand and Communications Designer, Anesa leads and supports various design projects and collaborates with Trio team members on creative initiatives. Design and production of all issues of the Global Renewable reports are led by Anesa.


Bucharest, RO
As Associate Director, Clean Energy, Corina manages client relationships by bringing insights to life across our customers’ decarbonization journeys. Overseeing both the onsite and offsite renewables offering in Europe, Corina ensures that Trio’s tailored solutions meet clients’ sustainability, financial, and strategic goals.
New York, NY
As Senior Manager, Content, Communications, and Culture, Elana leads the development of content, communications, and media strategy across Trio’s global teams.

Rudd Jupiter, FL
As Manager, Clean Energy Origination, Brittany supports clients in structuring, negotiating, and executing clean-energy procurement strategies, including power purchase agreements and other renewable energy transactions.

Graves Dublin, OH
As Senior Analyst, Sustainability and Clean Energy, Charles leads client engagements through detailed analysis, and the creation of compelling, data-driven deliverables. He specializes in building advanced analytical tools and supporting clients through clear insights, reporting, and ongoing industry expertise.


Boston, MA
As Content and Communications Coordinator, Krista assists with the execution of various marketing tasks while also leading content management initiatives.
NLD
As Manager, Sustainability & Clean Energy, Kristi is responsible for analyzing renewable energy market risks and opportunities including policy and regulation, and managing developer communications. She is also responsible for economic and due diligence evaluation of prospective projects across European markets and for driving commercial negotiation support.

Liam Garvey Denver, CO
As Manager, Sustainability and Environmental Attributes, Liam works with clients to develop decarbonization strategies to help organizations meet their corporate and sustainability goals, specifically focusing on EAC strategy development and execution.

Matt Donath Milwaukee, WI
As Manager, Global Policy and Sustainability, Matt advises clients on legislative and regulatory developments across North America and Europe, helping them understand and navigate business and compliance implications.

Shannon Weigel Chicago, IL
As Director, Global Policy, Shannon tracks regulatory, legislative and administrative proceedings in North America and uses this information to help our clients make better energy procurement decisions.

Tim Hogan Dublin, OH
As Senior Manager, Sustainability and Clean Energy, Tim advises corporate clients on clean energy procurement, decarbonization strategy, and climate risk management. His work spans renewable and emerging energy solutions, regulatory reporting, and the integration of sustainability into enterprise-wide decision making.
The first half of 2026 has been defined by mounting pressure on clean energy markets as federal policy timelines accelerate and regulatory expectations tighten. In the United States, implementation of the One Big Beautiful Bill Act (OBBBA) is reshaping the development and procurement environment for renewable energy, increasing risk and cost while narrowing the window for projects to qualify for federal tax incentives.
Updated guidance for wind and solar projects seeking the Investment Tax Credit (ITC) and Production Tax Credit (PTC) has placed heightened emphasis on early execution. With the elimination of the five-percent safe harbor for most projects and a July 4, 2026, beginning-of-construction deadline, developers are racing to advance viable projects through permitting, interconnection, and financing. At the same time, trade actions, equipment constraints, and continued scrutiny of permitting processes are adding uncertainty to project timelines and economics, particularly for utility-scale wind and solar.
Despite these headwinds, U.S. environmental attribute markets remain relatively favorable for corporate buyers in the near term. Voluntary REC markets continue to be well supplied, keeping prices low even as longer-term demand drivers — including clean fuel tax credit requirements and potential updates to Scope 2 accounting guidance — begin to emerge. In power markets, PPA pricing has shown modest softening or stability in select regions, though structural challenges such as interconnection congestion
and concentrated corporate demand continue to underpin a higher-cost environment over the medium term.
In Europe, market dynamics contrast sharply with those in the U.S. Oversupply of renewable generation, easing project costs, and increasingly renewable-heavy grids have driven PPA prices downward across major markets. However, the growing frequency of negative power prices is changing how projects are developed and contracted. Hybrid projects incorporating battery storage are becoming more prevalent, reflecting a broader shift toward managing volatility and curtailment risk through contract structure.
As buyers navigate these divergent regional signals, additional uncertainty looms. Proposed revisions to the GHG Protocol’s Scope 2 guidance and expanding state-level clean energy initiatives in the U.S. are already influencing procurement strategies, even before final rules are issued. Together, these forces underscore a narrowing decision window. Buyers able to act decisively — securing contracts under current rules and remaining flexible on structure and technology — will be better positioned as markets grow more constrained later in the decade.
This report examines these developments across U.S. and European clean energy and environmental attribute markets, highlighting the policy, pricing, and structural trends shaping procurement decisions in 2026.

U.S. and Europe Environmental Attribute Marketplace
Voluntary REC pricing decreases while PJM PA Tier I REC market remains volatile during significant price drops
Q4 2025 through Q1 2026 saw Texas CRS-Listed REC prices decrease gradually, largely as a result of healthy REC supply levels in the market. Corporate buyers often address prior-year gaps with Q1 purchasing. While Q1 is no exception to this pattern, prices have not approached the higher levels observed in Q1 2025 and some other years.
Comparatively lower pricing means the market is generally favorable for corporate buyers. Texas CRS-Listed 2025 vintages are currently valued at $1.98, down from $2.35 at the end of Q3 2025, while 2026 vintages have decreased from $2.68 to $2.20 over the same timeframe. Later vintages do not command as significant a premium as they did throughout 2024 and in Q1 2025. 2027 vintages are currently trading at $2.45, while 2028
vintages are valued at $2.69. Even 2030 vintages are only selling at $3.10, down from approximately $5.20 in Q1 2025.
The One Big Beautiful Bill Act (OBBBA) is expected to slow the buildout of new renewable energy projects in the coming years as the Inflation Reduction Act (IRA) tax incentives are phased out, which could, in turn, begin to impact REC supply. However, both supply and voluntary demand remain healthy, with buyers continuing to purchase both spot market RECs and long-term strips despite federal headwinds.
In 2025, some regions, particularly MISO and SPP, experienced isolated REC price increases, reflecting increased corporate demand related to the Section 45Z Clean Fuel Production Tax Credit. Federal guidance for clean fuel tax credits has thus far required that RECs be sourced in the same region as the fuel facility, meet new project requirements, and comply with stricter vintage specifications to qualify as eligible, increasing demand for RECs located near these facilities.


Another development looming over the CRS-Listed REC Market is updated guidance for the GHG Protocol Scope 2 standard. While the revision process isn’t expected to be finalized until the end of 2027, some draft guidance under discussion would tighten renewable energy purchasing requirements for corporate buyers by instituting geographic and temporal restrictions. This could, in turn, increase demand for RECs from certain parts of the U.S., as well as RECs that are generated during a buyer’s hours of daily electricity consumption.
Prices in the PJM Pennsylvania Tier I REC market have continued to fall significantly throughout 2025 and into Q1 2026, reaching levels not observed since the summer of 2022. After hitting a calendar year high of $35.69 in February, vintage 2025 pricing declined steadily, reaching a low of $23.00 in December.
Similarly, vintage 2026 RECs dropped from $34.00 in March to $23.41 in December and are currently trading at $23.83. Later year vintages have followed this trend, with vintage 2027 RECs currently selling at $23.89.
This decline in Pennsylvania Tier I REC prices is echoed across other PJM markets, including Maryland Tier I RECs, New Jersey Class I RECs, PJM Tri-Qualified RECs, and Virginia RECs. Some market observers have pointed to potential changes to these states’ Renewable Portfolio Standard (RPS) programs as one of the drivers of this decrease. For example, in May, the New Jersey Board of Public Utilities decided to maintain the state’s RPS at the current 2025 level rather thann increase it in 2026 as originally planned, contributing to further REC price declines.
U.S. and Europe Environmental Attribute Marketplace
GO market continued to be oversupplied in 2025, but early 2026 saw price increases
Europe AIB GO pricing remained low throughout 2025 compared to pricing in prior years. However, the market experienced several notable movements during the year. GO prices reached calendar year highs between June and August before gradually declining through December. The relatively low prices observed for much of the year largely reflected an oversupplied GO market, with favorable weather conditions contributing to increased GO generation. Similar to the U.S. voluntary REC market, corporate buyers benefited from these lower spot-market prices, with increased corporate purchasing activity observed in the fall compared to earlier months.
January and February 2026 saw significant price increases, with vintage 2025 GOs rising from €0.19 in mid-January to €1.19 by mid-March. This price increase was reflected across later vintage as well, with 2026 vintages rising from €0.51 in early January to €1.20 in early March, and 2027 vintages increasing from €0.62 to €1.20 over the same period.
In 2026, supply levels are expected to remain generally healthy, though lower-than-average hydropower output in the Nordics could challenge this trend. When combined with the potential for increased demand driven by data-center-related policy measures and continued voluntary demand from technology companies, the GO market may experience a rebalancing. This shift, characterized by rising demand and potentially lower supply, could support higher prices going forward.

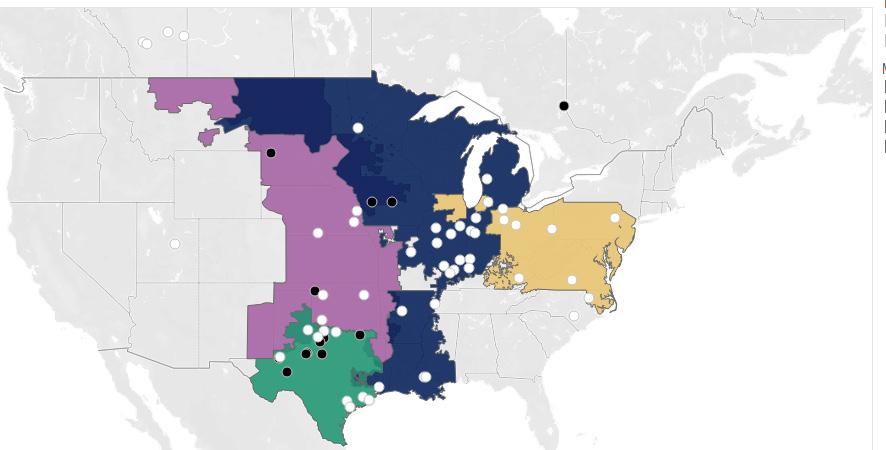
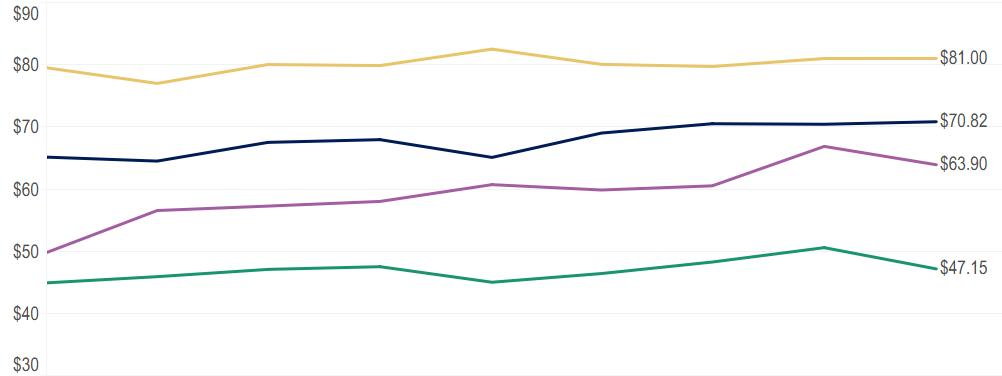
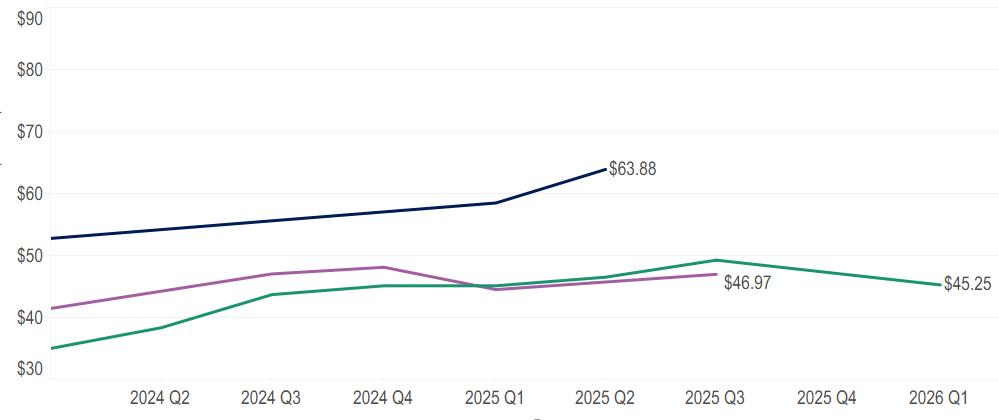
Prices shown reflect P25 prices over time for flat, hub-settled, unit contingent offers, inclusive of project RECs. Markets and technologies with fewer than four distinct projects in a given quarter are not shown. Please note that Trio has transitioned from publishing median pricing to P25 pricing, which reflects the 25th percentile of relevant bids offered during the quarter.
Figure 5. Current PPA Prices Q1 2026
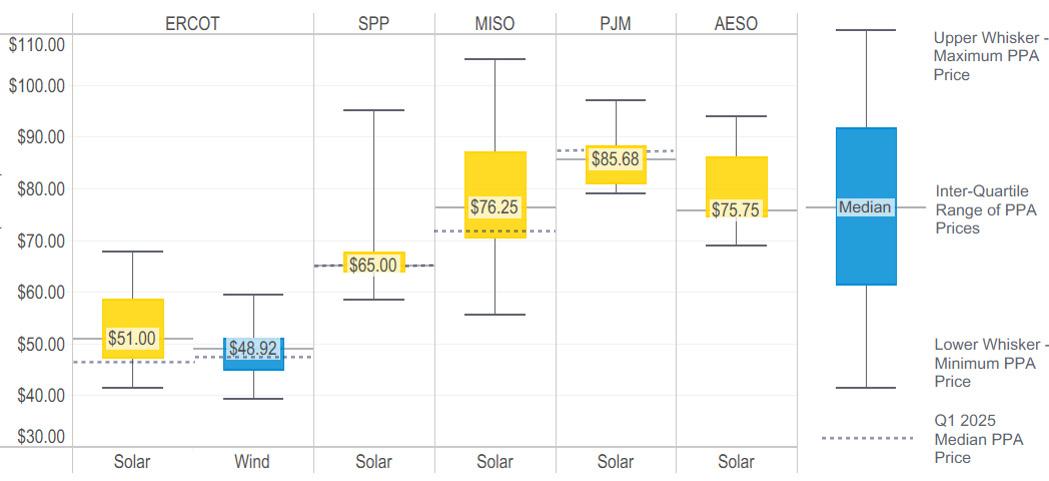
PPA prices shown above reflect flat, hub- and zone-settled, unit contingent offers inclusive of project RECs received in Q1 2026. Markets and technologies with offers from fewer than four distinct projects are not shown. Some offers shown may no longer be available in the market. The dotted line indicates the median PPA price observed one year ago.
→ The Q1 P25 price for solar in ERCOT and SPP decreased by 7% and 4%, respectively. ERCOT and SPP last experienced declines of this magnitude in Q1 2024 and Q3 2023, respectively.
→ PJM and MISO P25 solar prices have remained relatively flat since Q3 2025. Neither market’s P25 prices have varied by more than 2% over this period.
→ The ERCOT P25 price for wind decreased for the first time since Q1 2024. Since Q3 2025, ERCOT wind P25 pricing has declined by nearly 9%.
Corporate renewable procurement is entering a consequential five-year period. Today, federal incentives, specifically the Investment Tax Credit (ITC) and Production Tax Credit (PTC) for wind and solar, remain in place with safe harboring provisions that extend into the early 2030s. Buyers should expect that policies enacted under the One Big Beautiful Bill Act (OBBBA) and evolving GHG Scope 2 Protocol guidance changes will make renewable deployment and procurement more difficult.
Tax incentives can offset a substantial portion of a renewable project’s capital cost, often reducing total project costs by 30 –50%. When these tax credits go away, some expect the price of renewable energy to rise commensurately. At the same time, supply chain constraints, domestic content requirements, and interconnection congestion will continue to shape the economics of both onsite and offsite renewable projects.
In parallel, revisions to the GHG Protocol’s Scope 2 standard are under development. Proposed updates, including potential hourly matching and deliverability considerations, may encourage buyers to evaluate procurement strategies that account for the timing and location of clean energy generation. While the final framework is not yet determined, these discussions are already influencing how some market participants evaluate renewable contracts.
Against this backdrop, the key question for 2026 is not whether to procure renewables, but when to act before pricing increases and contracting options narrow. The timeline below outlines what buyers should anticipate and how to move proactively over the next several years.
To orient buyers to how market conditions will evolve, the figure above summarizes how tax credit certainty, supply chain pressure, interconnection risk, Scope 2 guidance changes, and procurement flexibility are forecasted to shift each year. The visualization highlights why the 2026-2028 window offers materially greater optionality than 2029-2030.
→ Move early to claim the strongest safeharbored projects
→ Revisit strategy for achieving 2030 clean energy and sustainability goals
→ Execute onsite solar contracts by 2026 to preserve tax credit eligibility and secure interconnection
→ Prioritize nearshovel-ready offsite projects
→ Target finalizing onsite solar projects (installed/ operational)
→ Run congestion and curtailment stress tests across vPPAs
→ Evaluate hybrid structures for 24/7 procurement
→ For those that need clean energy contracts, procure with urgency
→ Onsite projects likely no longer eligible for tax credits
→ GHG Scope 2 process changes will change PPA terms and REC markets
→ Implement hourly matching and deliverabilitybased boundaries
→ Large buyers lock up high-quality projects, increasing competition and limiting availability
→ Recontract, repower, or firm legacy wind/solar PPAs lacking tax credits to maintain emissions performance and pricing stability
→ Lock in long-term 24/7 and marginalemissionsoptimized portfolios
In 2026, the rules of the market are still relatively clear. The technology-neutral clean energy tax credits (45Y/48E) created under the Inflation Reduction Act remain in place, and developers are continuing to contract wind and solar projects expected to reach commercial operation later in the decade.
However, some incentives require early planning, like domestic content and energy community adders. Compliant supply chains, siting decisions, and documentation requirements must be locked in before construction progresses; waiting too long could make it impossible to source qualifying materials or validate eligible tracts. These details are specifically finalized before construction begins.
Another important milestone arrives in July 2026. Under the OBBBA, wind and solar projects must meet Beginning of Construction (BOC) requirements by July 4, 2026, to preserve eligibility for the four-year safe-harbor window for federal tax credits. For example, if construction begins in 2025, the continuity safe harbor is satisfied if the facility is placed in service by December 31, 2029. The IRS recognizes limited “continuity” exceptions, including severe weather, permitting or interconnection delays, shortages of specialized components,
labor stoppages, and certain financing delays tied to supply disruptions. These will not count against the four-year safe harbor, although these carve-outs will be narrowly construed and require substantiation.
“Beginning of construction” does not necessarily mean construction at the project sites. The IRS allows developers to meet this requirement through certain types of offsite work as well, such as manufacturing project components like racks, inverters, or transformers. Once such construction begins (prior to July 4, 2026), developers have four years to complete the project and still claim tax credits. For buyers, this means that clean energy will stay federally subsidized for a few more years.
Onsite and smaller commercial projects follow a slightly different timeline. These projects typically require signed power purchase agreements or other binding commitments (i.e., a binding letter of intent) before development can advance. They must either begin physical construction at the actual site by July 4, 2026, or allocate safe-harbored equipment from their limited inventory to extend the project completion past December 2027. For companies considering onsite solar, early planning is essential to ensure sufficient time for contracting, equipment procurement, and construction scheduling. Candidly, the time to act is now.


U.S. Renewable Energy Marketplace
Meanwhile, updates to the GHG Protocol’s Scope 2 standard are under review. The proposed changes could affect how renewable energy claims are reported in the future, but the final rules are still being developed. The proposals currently being discussed include ideas like hourly matching and clearer rules around where renewable energy must be generated relative to the buyer’s electricity consumption. Importantly, a “legacy clause” is under evaluation to allow existing long-term contracts, including power purchase agreements and renewable energy credits, to continue being recognized under current rules for a specified period. Depending on how these grandfathering provisions are structured, buyers that contract before the new rules take effect may be able to retain eligibility under earlier, more flexible standards, potentially securing lower-cost or less burdensome structures than those required after the rules are implemented.
For those with 2030 clean energy or scope 2 reduction goals: now is the time to revisit your strategy to ensure you can hit your targets while planning around the tax credit eligibility schedule and proposed GHG Scope 2 changes. 2026 is a window of opportunity and a pivotal planning year for buyers; acting both strategically and swiftly will ensure that such goals are met under the certainty and predictability of today’s rules and enforcement.
After the July 4, 2026, construction deadline, many projects that qualified for tax credits will be moving into the construction and execution phase. Developers will be working to coordinate
equipment deliveries, construction schedules, and interconnection timelines as these projects move toward completion.
Projects that did not begin construction before the July 4, 2026, deadline will need to reach commercial operation by the end of 2027 to qualify for certain tax credit structures. Because of this, many developers will be focused on advancing projects that already have clear development timelines, likely prioritizing buyers with strong credit and fast execution capabilities. These buyers will be competing for a finite pool of “in-window” 2027 COD projects.
One important caveat applies to smaller capacity solar facilities: the 5% safe harbor can still be used only for solar projects with a maximum net output of 1.5 MWac1 or less, provided they begin construction before July 4, 2026. For these facilities, maximum net output is determined by nameplate capacity.2 If multiple facilities have integrated operations, their capacities must be aggregated when assessing the 1.5 MWac limit. This exception allows a narrow subset of small solar projects to qualify under the 5% safe harbor even after other projects lose access to it.
Additionally, the GHG Protocol’s Scope 2 revision is slated for final publication in 2027, following the October 20, 2025 – January 31, 2026, public consultation. Buyers should be prepared for the finalized changes to increase the cost of compliance and reshape the criteria for credible market-based reporting going forward. As these standards evolve, Trio can help buyers evaluate how their existing contracts and reporting practices align with the forthcoming framework and identify opportunities to preserve flexibility under the new rules.

1 https://www.thetaxadviser.com/issues/2026/jan/irs-generally-eliminates-5-safe-harbor-for-determining-beginning-of-construction-for-wind-and-solar-projects/ 2 Id.
By 2028, many of the projects that began construction before the BoC deadline will be contracted and progressing toward completion. At the same time, developers will continue bringing new projects forward under evolving policy and market conditions, potentially at a significantly higher price due to the lack of federal tax credit eligibility for the newly developed projects. Different regions of the country have varying queue and development timelines, shaped by factors such as grid congestion and transmission availability, which may shape where developers focus their efforts. Interconnection queue reforms underway across several ISOs and RTOs are intended to mitigate multi-year backlogs. The effects of these reforms may begin to manifest in 2028 in ways that influence project pacing and regional development.
Scope 2 reporting changes may also begin moving toward implementation around this time. As companies prepare for updated emissions-reporting frameworks, buyers should begin incorporating additional tracking tools that help monitor when and where renewable energy is generated.
Overall, these developments are encouraging more creative approaches to cleanenergy contracting. The innovation starting to appear in 2026 is likely to carry into 2028, especially as companies look for ways to better match renewable energy to when they actually use power. Some buyers may choose contracts that bundle solar or wind with battery storage so they can use clean energy even when the sun isn’t shining or the wind

isn’t blowing. Others may use contracts that shape the amount of power they buy to better match their typical daily or seasonal energy needs.
By 2029, buyers will have clear federal guardrails to work with. By statute and IRS guidance, wind and solar that didn’t begin construction by July 4, 2026, only qualify for 45Y/48E if they were in service by December 31, 2027, whereas other technologies (e.g., storage, geothermal, hydro) are not subject to that 2027 cutoff and keep access to 45Y/48E beyond 2027 under the law’s transition rules. Projects that began construction in 2025 also carry a four-year continuity safe harbor to place in service by December 31, 2029. These are fixed timelines that buyers can plan around.
Buyers should continue to prioritize execution-ready deals with credible schedules and interconnection paths and broaden their strategy to include other clean energy technologies that still qualify for federal tax credits. Procuring a diversified mix (e.g., a non-wind/ solar tranche alongside operating asset acquisitions) will ensure that buyers are not dependent on scarce, credit-constrained wind and solar supply. Bottom line: 2029 still offers buyers meaningful opportunity though wind and solar options on new projects will be limited or much more expensive than the current market. By focusing on projects aligned with the published OBBBA credit timelines and expanding their procurement strategy, buyers still have clear, actionable space in 2029 to secure value and work towards their decarbonization goals.

By 2030, buyers will be operating in a market shaped by the final years of the OBBBA transition framework and the full implementation of updated Scope 2 reporting standards. For renewable projects, tax credit eligibility will depend heavily on when construction began and whether projects remain within their applicable safe-harbor timelines.
Standalone storage, geothermal, hydropower, and other qualifying resources will continue to receive support under the 45Y and 48E credit framework. As a result, buyers may increasingly evaluate a broader mix of technologies as part of their longterm procurement strategies. By this point, Scope 2 reporting reforms are also expected to be fully operational. Companies will
likely be expected to demonstrate greater transparency around how renewable energy contracts align with their electricity consumption and emissions reporting. This will place a premium on well-structured contracts, credible environmental attributes, and clear documentation of project eligibility.
For buyers, the priority in 2030 will be building renewable portfolios that are resilient under both policy and reporting frameworks. Projects that clearly meet credit eligibility requirements, demonstrate credible development progress, and align with evolving emission accounting rules will continue to offer meaningful value. Companies that take a diversified and wellinformed approach to procurement can still position themselves to meet long-term cleanenergy goals while navigating a more structured regulatory environment.

U.S. Renewable Energy Marketplace
Facing record load growth projections and growing concerns about grid reliability, state lawmakers are increasingly looking to state-level policy solutions to help curb consumer costs and ensure the grid can support rapid demand growth. These pressures contributed to a noticeable uptick in reforms to existing community solar programs, as well as new legislation introduced to launch statewide programs for the first time.
Community solar has emerged as a pragmatic tool that can deliver consumer savings and expand access to locally controlled clean energy, often framed as consumer choice, attracting decision makers from across the political spectrum. For commercial and industrial (C&I) buyers, expanded programs and new markets position community solar as a repeatable, portfoliolevel procurement option, particularly in regions where retail prices are rising and other clean energy pathways face siting or interconnection constraints.
In states with established community solar markets, including in Illinois, New Jersey, and Maryland, 2025 was defined less by wholesale redesign and more by targeted reforms aimed at bringing additional projects online. Policymakers focused on expanding program capacity, addressing siting constraints, and streamlining administrative requirements to relieve bottlenecks that have slowed development.
Reforms increasingly emphasized unlocking low impact sites, such as rooftops, brownfields, agrivoltaics, and floating solar, while increasing allowable project sizes to improve developer economics and reduce transaction complexity for subscribers. For C&I buyers, these changes improve the feasibility of aggregating

load under fewer subscriptions, reducing contract management and internal administrative burden.
At the same time, states sought to improve customer experience through measures such as consolidated billing and clearer crediting rules, reducing friction for participants, and improving subscription retention. Streamlined billing and clearer crediting rules also reduce internal friction, an increasingly important consideration as energy teams seek solutions that finance, legal, and accounting groups can support without bespoke processes.
These adjustments reflect a growing recognition that program success hinges on execution, not intent. Even well-designed incentive structures can fail to deliver if siting options are constrained, or project economics are misaligned. By recalibrating program rules to reflect market realities, states are signaling a commitment to long-term viability rather than short-term deployment targets. For buyers, these changes translate into deeper project pipelines, improved pricing stability, and greater confidence that community solar can support meaningful load over time.
Beyond established programs, the past year has marked a notable expansion of legislative interest in states that have historically lacked clean energy policy. In many cases, new proposals advanced with bipartisan support and were deliberately framed around consumer choice, affordability, local economic

States including Pennsylvania, Michigan, Ohio, Iowa, Missouri, Wisconsin, and Montana saw community solar legislation introduced or meaningfully advance in 2025. While efforts did not cross the finish line last year, momentum is carrying into the 2026 legislative sessions for some:
The Ohio House passed House bill (HB) 303 in November by a 77-8 vote, showing strong bipartisan support and setting up the bill for consideration in the Senate this session. The bill is currently in Senate committee but has not yet been scheduled for consideration. Importantly, large industrial and mercantile customers are unable to participate in the pilot program as currently drafted.
Senate bills (SB) 518 and 519 were introduced in November by Republican lawmakers and have bipartisan support. They have been referred to Senate committee and are expected to be debated this spring.
After significant momentum in 2025, Iowa’s legislature has quickly advanced House file (HF) 2672 through committee and has been added to the calendar for consideration by the full chamber. It’s companion bill in the Senate has seen limited action since early in the session, which could signal potential challenges ahead.
HB 504 passed out of the House on May 7, 2025, but has been held in Senate committee since that time. Broader energy negotiations expected in 2026 may reopen a pathway for consideration as part of larger reforms.
U.S. Renewable Energy Marketplace
For C&I buyers, the program reforms in 2025 and legislative efforts in 2026 point to a community solar market that is becoming more stable, geographically diverse, and resilient to political shifts. Expansion and reform in mature markets are reinforcing long-term certainty, while legislative momentum in new states signals that community solar is no longer confined to traditional clean energy strongholds. Even where bills may not advance in 2026, their introduction and bipartisan support remain meaningful, particularly given that repeated legislative attempts is common before passage. This diversification reduces geographic concentration risk and expands future procurement options for organizations managing multistate electricity portfolios.
Equally important, the evolving design of community solar programs strengthens the business case for participation. Policymakers are increasingly prioritizing measurable consumer savings, predictable billing, and scalable project structures, improving alignment with corporate energy procurement objectives. As community solar continues to shift from a climate driven policy tool to a cost control and consumer choice mechanism, it is positioned as a more durable component of C&I energy strategies.
What C&I buyers should be doing now:
• Assess portfolio fit: Identify states in your load portfolio where community solar reforms or new programs could support near-term subscriptions.
• Monitor and engage early: In emerging markets, early corporate input can influence program design toward larger project sizes, clearer crediting, and other features critical for C&I participation.
• Use as a bridge strategy: Community solar can help hedge near-term retail exposure while longer-term PPAs remain constrained by interconnection or transmission delays.
For buyers that engage early, by monitoring legislative developments or providing technical input into program design, 2026 may offer meaningful opportunities to secure local, costeffective energy solutions in both established and emerging markets.

U.S. Renewable Energy Marketplace
Diverging markets: Clean energy prices in U.S. and Europe head in different directions
The renewable energy market has bifurcated: Europe is entering a lower-price era while the U.S. continues to face high costs versus prior years.
Taken together, the European and U.S. pricing trajectories reflect fundamentally different market structures and policy environments. In Europe, increasingly renewable-heavy grids,
maturing policy frameworks, and easing project costs are driving prices downward, while in the U.S., persistent project bottlenecks, rising complexity, and strong corporate demand continue to push prices upward. For buyers evaluating global procurement strategies, this divergence underscores the importance of region-specific timing and risk assessment: Europe may offer near-term opportunities for lower-cost entry, whereas U.S. markets may require more flexibility and longer lead times to secure attractive positions.

U.S. Renewable Energy Marketplace
In contrast to Europe’s downward pricing trajectory, U.S. renewable PPA prices have remained elevated over the past several quarters. Several structural, regulatory, and demand-side dynamics are contributing to this trend.
1. Policy uncertainty and regulatory risk are adding a premium to pricing
U.S. developers continue to price in policy and regulatory risk, including tariff exposure, evolving implementation of tax credits, and uncertainty around transmission reform. In 2025, the OBBBA introduced additional uncertainty by accelerating phaseouts and tightening eligibility for several clean energy credits and supply chain rules, complicating financing timelines and pricing.
2. Persistent grid-equipment constraints and project delivery risk
While module and battery availability have generally improved since the pandemic era, shortages in critical balance-of-plant components (e.g., breakers, transformers, and switches) and customs/tariff compliance requirements continue to delay project schedules and raise costs.
3. Concentrated corporate demand
4. Interconnection backlogs and transmission congestion inflate risk premiums
Queue congestion and upgrade uncertainty extend development timelines and increase the probability of repricing or deferral. As projects wait longer for interconnection studies and face the possibility of costly network upgrades, developers build additional risk margins into PPA offers. These delays also concentrate viable capacity in a smaller set of grid-friendly locations, intensifying competition and further supporting higher prices.
5. Hybridization and 24/7 procurement goals are raising the bar and the price
U.S. buyers increasingly require flexibility and peak-hour coverage, driving growth in solar-plus-storage and more sophisticated delivery profiles. This structural shift raises capex and system complexity relative to standalone renewables, particularly in CAISO and PJM, where reliability and evening-hour coverage are prioritized. These hybrid and hour-matched structures command higher PPA price levels than simple asgenerated PPAs.
Corporate procurement remains a powerful force in the U.S., with tech and data center expansion driving multigigawatt offtake needs. These buyers’ scale and credit strength give them outsized influence over contract structures, delivery requirements, and acceptable risk allocation. As developers prioritize large, bankable offtakers, competition intensifies for the most viable projects, leaving smaller buyers navigating a market shaped by hyperscalers’ preferences. This concentration accelerates project development but also reinforces scarcity in already constrained regions, contributing to sustained upward pressure on PPA prices.
U.S. Renewable Energy Marketplace
Over the past several quarters, PPA prices have declined across all major European markets compared to previous years. Several factors are contributing to this downward trend.
Declining wholesale power prices
Across Europe, wholesale electricity prices have been steadily decreasing. Because PPA buyers often benchmark PPA offers against wholesale market prices, lower market prices have reduced buyers’ expectations of what they consider an acceptable PPA price. In response, developers are adjusting pricing downward to remain competitive.
2. Increased volatility and curtailment in systems dominated by renewables
In some markets with extensive solar and wind buildout, generation is increasingly concentrated in the same hours of the day. Simultaneous output places downward pressure on wholesale prices. This dynamic, commonly known as price cannibalisation, occurs when large volumes of same-type generation flood the system at the same time, lowering the value of that output. As a result, capture prices decline, affecting solar assets most significantly. This downward pressure translates into lower PPA offer levels from developers.
3. Rising frequency of negative prices heightens balancing and curtailment risks
In some cases, price cannibalisation pushes wholesale prices into negative territory, prompting developers to curtail production to avoid losses. The increased risk of negative-price events, balancing costs, and potential curtailment reduces expected project returns. To secure a PPA and, in turn, project financing under these conditions, developers are often required to accept lower PPA prices.
4. Emergence of new technologies intensifies competitive pressure
In response to these market challenges, developers are turning to hybrid solutions, such as solar-plus-wind or solar-plus-storage. Combining different technologies helps smooth generation profiles and mitigate price risks. The availability of these more flexible options increases competitive pressure on standalone solar and wind projects, further contributing to downward movement in PPA pricing.
5. Project costs eased compared to 2021-2023
During 2021–2023, renewable project costs surged due to global supply chain bottlenecks, extreme energy-price inflation, and expensive manufacturing inputs. By 2024–2025, these pressures partially subsided. Falling natural gas prices, stabilizing European energy markets, and moderating interest rates helped reduce inflationary pressure on manufacturing and logistics and ease overall project cost structures. Supply chain conditions improved after the pandemic-era disruptions, reducing delays and volatility even if equipment prices did not return to pre-crisis lows.
6. Corporate demand cooled materially in 2025
Counterintuitively, contracted PPA volumes were down roughly 30% year-on-year. Misalignment on PPA pricing drove much of this reduction, supplemented by uncertainty regarding potential GHG protocol revisions and perceptions of a long runway to 2030 targets.
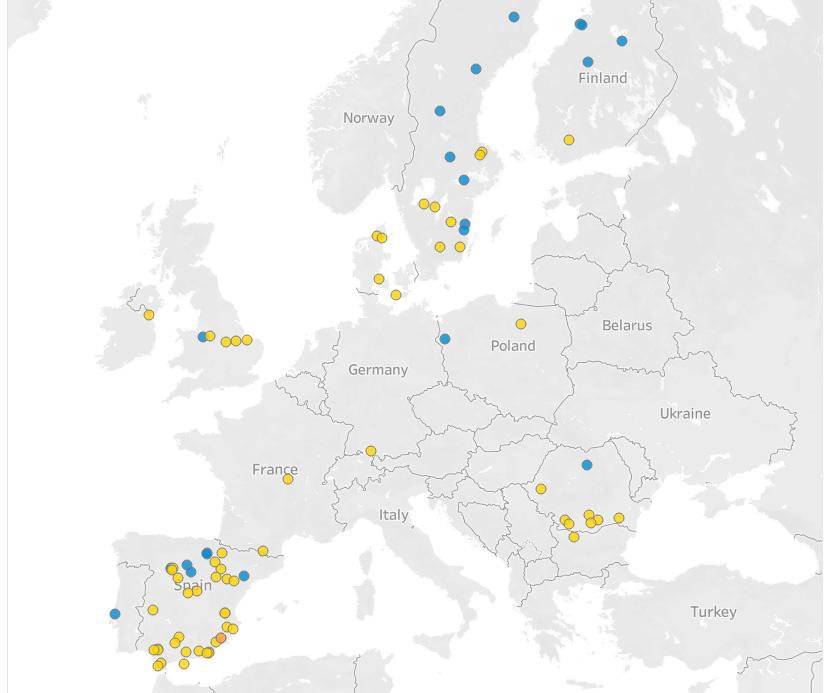
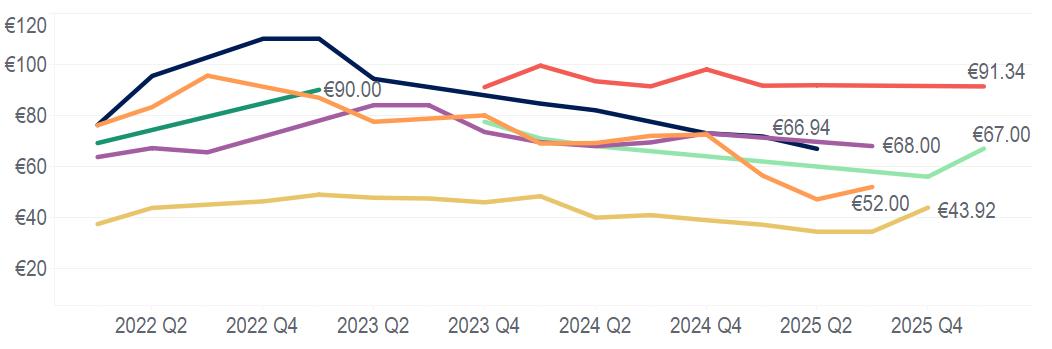
PPA prices for the three markets shown reflect the median of flat, unit-contingent offers inclusive of environmental attributes received over time. Markets and technologies with offers from fewer than three distinct projects in a given quarter are not shown. Wind PPA price trends are not shown this quarter due to fewer than three wind projects seeking offtake in each market.
9. Current PPA Prices Q4 2025 & Q1 2026
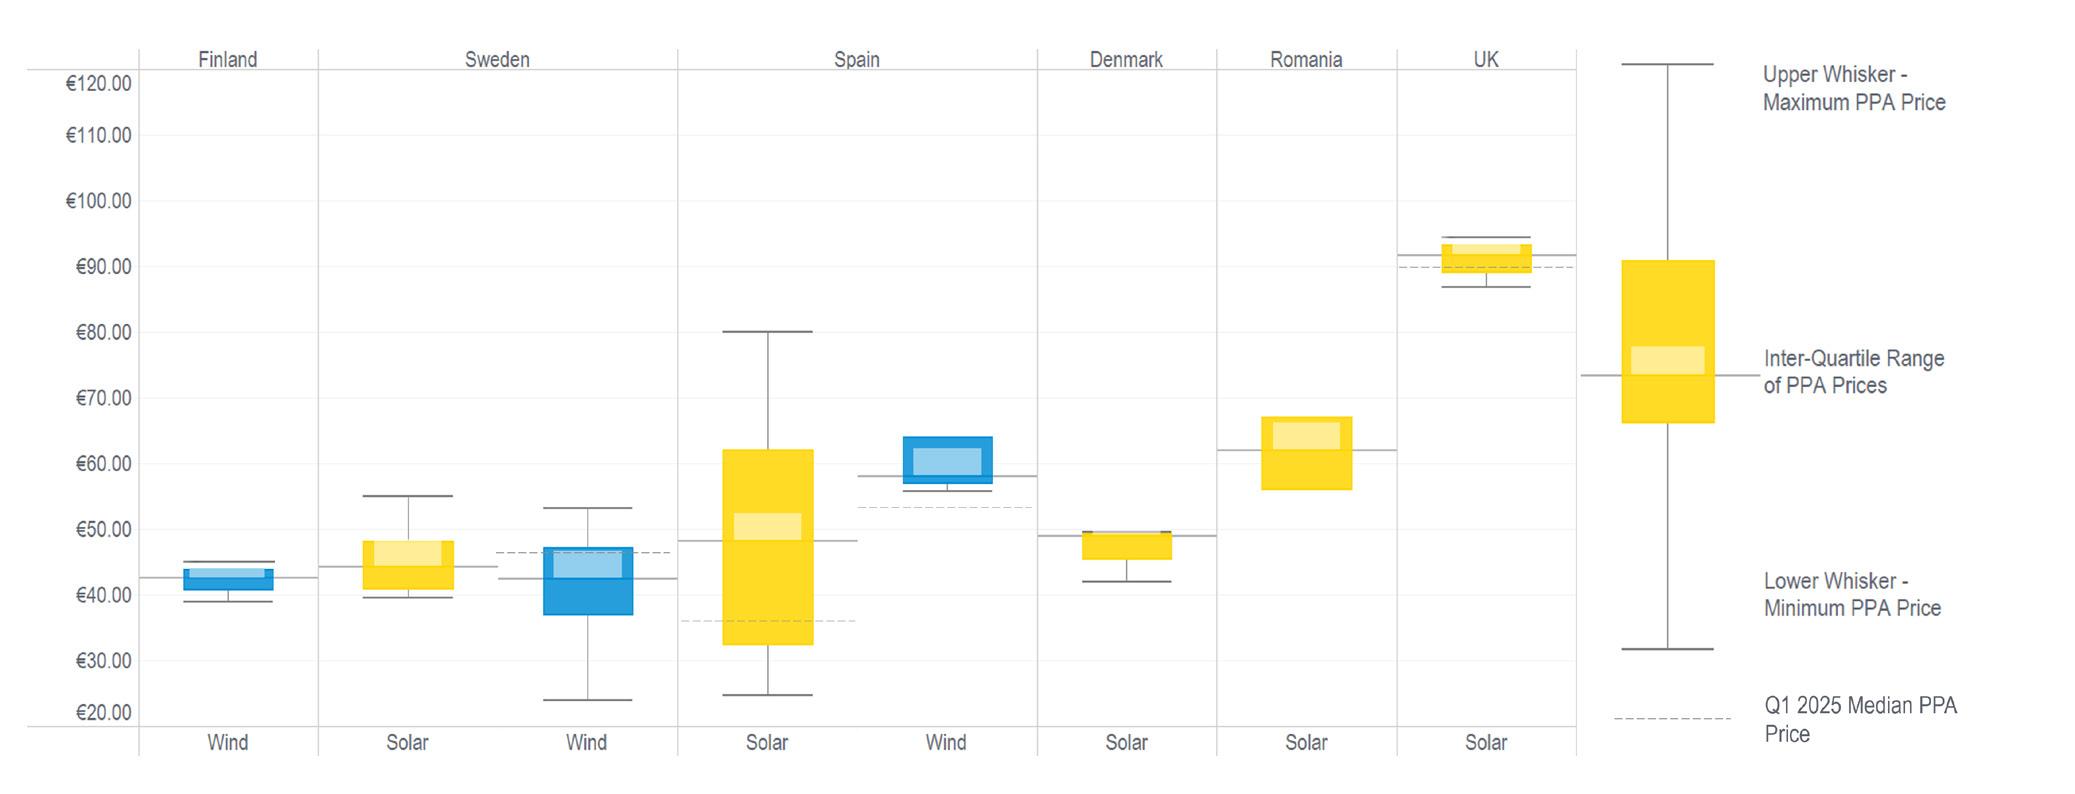
PPA prices shown above reflect flat, unit-contingent offers inclusive of environmental attributes received in Q4 2025 & Q1 2026. Markets and technologies with offers from fewer than three distinct projects are not shown. Some offers shown may no longer be on the market. For Spain, solar prices include both solar standalone and solar+BESS offers.
→ PPA prices remained relatively stable throughout Q1 2026, with only minor fluctuations compared to the previous quarter. This reflects stabilization of key cost drivers, including commodity prices and wholesale electricity rates.
→ Spain saw a notable shift in project supply this quarter, with a growing share of solar PV opportunities now being offered as hybrid configurations that include battery energy storage systems (BESS). While these hybrid PPAs typically come at a premium relative to standalone solar, they offer buyers meaningful advantages, including negative price risk mitigation, reduced curtailment risk, and an improved generation profile. The influx of BESS-hybridized projects marks a structural change in Spain’s solar market and is reshaping renewable energy project supply.
→ Standalone solar projects in Spain are still available, although cannibalization pressure and competition from more innovative hybrid solutions have pushed their pricing back to Q1 2025 levels ranging from the mid €20s to the mid €30s/MWh.
→ Finland continues to benefit from a strong onshore wind supply, with a healthy pipeline translating into highly competitive PPA pricing. For corporate buyers, these levels remain among the most attractive in Europe. However, the increasing frequency and depth of negative power prices in the Nordic region means buyers should carefully assess downside exposure in contract structures.

Finnish PPA prices continued to ease through late 2025, mirroring broader European trends as oversupply, increasingly frequent negative wholesale price hours, and price cannibalization put sustained downward pressure on contract values. Entering 2026, this dynamic has created a distinctly buyer-friendly environment, offering very strong economics for wind projects. Finland operates as a fully subsidy-free market, meaning renewable energy projects must secure a PPA or another offtake agreement to ensure project finance. Otherwise, the project remains exposed to merchant market risks.
Finland’s renewable buildout accelerated significantly heading into 2026. In 2025 alone, the country added 227 MW of utility-scale solar, more than doubling its industrial-scale PV base and marking its strongest solar-build year on record. Meanwhile, wind remained the backbone of the system: by the end of2024, Finland had reached ~8.4 GW of wind capacity, with 61 GW of onshore and 46 GW of offshore wind in the pipeline. The combined ramp-up of solar and wind is intensifying variability and contributing to structural market changes, including more frequent negative-price periods.
By late 2025 and into early 2026, Finland saw a clear shift toward hybrid and portfolio-based PPAs as developers and buyers responded to increasing price volatility and declining capture values. The move was reinforced by landmark deals such as Statkraft and OX2’s large-scale BESS-linked optimisation agreement, highlighting how batteries are now being paired with onshore wind to smooth production profiles and help mitigate exposure to negative priced hours. These hybrid structures offer buyers enhanced production flexibility, improved revenue resilience, and reduced reliance on single-technology generation in an increasingly volatile Finnish power market.
Finland experienced a significant increase in negative-price hours across 2023–2025, with ~5-8% of hourly prices falling below zero due to strong wind output and limited export capacity, making it one of the most volatile Nordic markets by late 2025. While Finland is able to offer very favourable PPA prices, Trio recommends buyers who are planning to transact in Finland to include negative price mitigation mechanisms into PPAs, such as settlement floors, curtailment-sharing, or hybrid configurations.
→ Executive brief: U.S.–Iran tensions and energy cost
By Shannon Weigel, Director, Global Policy, Sanjin Lucic, Director of Risk Management and Trading and
Jeff
Bolyard, Principal, Energy Supply Advisory
→ Financing the Future: How Organizations Are Rethinking Capital for Energy & Infrastructure
In a time of economic uncertainty, organizations are reevaluating how to advance energy efficiency, decarbonization, and infrastructure upgrades – without diverting capital from core business priorities.
→ As power costs rise, energy optimization is having a moment
U.S. businesses are entering a new energy reality. As demand climbs, driven by reindustrialization, electrification, and the rapid build-out of data centers, reliability is increasingly challenged by extreme weather and capacity constraints.
→ Managing Energy Price Risk During Extreme Weather: What Manufacturers Need to Know
Extreme weather events like Winter Storm Fern are no longer outliers – they are now a core driver of energy cost volatility and operational risk.
→ PJM capacity costs are surging: here’s what decisionmakers need to do now
By Matt
Croshal,
Director,
Sustainability & Clean Energy, and Matt Donath, Manager, Global Policy & Sustainability
→ Transform: Auto Program Announces First Community Solar Cohort Agreement
The Magna–Summit Ridge Energy deal marks Transform: Auto’s first major milestone to speed sustainability across the automotive supply chain
→ Transform: Auto expands into European markets to bolster automaker and supplier decarbonization
For suppliers operating in Europe, the program will offer market-specific education and engagement opportunities for the region grounded in the reporting standards most commonly used in Europe, such as the Corporate Sustainability Reporting Directive (CSRD).
Joey Lange
Senior Managing Director, Sustainability and Clean Energy
+1-617-663-8240
joey.lange@trioadvisory.com
Corina Melchor
Associate Director, Clean Energy
+40-73-399-8964
corina.melchor@trioadvisory.com
About Trio
Trio is a global energy and sustainability advisory company that helps large commercial, industrial, and institutional organizations navigate the energy landscape. Trio provides integrated strategy and implementation offerings across energy supply management, data management, energy optimization and electrification, clean
Fortune 500 (and similar) are clients
Did you know
Matt Donath
Manager, Global Policy & Sustainability
+1-773-382-0527
matt.donath@trioadvisory.com
Emily Williams
Vice President, Strategy & Sustainability
+1-815-847-9135
emily.williams@trioadvisory.com
energy, and sustainability to help the world’s largest organizations deliver on their strategic objectives and priorities.
For more information visit trioadvisory.com
Headquartered in Irvine, CA, with a global presence in North & South America, Europe and Asia-Pacific.
Irvine: 18500 Von Karman Ave., Suite 260, Irvine, CA 92612
Boston: 53 State Street, Suite 500, Boston, US 02109
London:1 Haven Green, Ealing Broadway, London, UK W5 2UU
On/off-site renewable energy procured
Sarajevo: Danijela Ozme 3, Sarajevo, BA 71000
Utrecht: Stadsplateau 19-40, Utrecht, NL 3521 AZ
Frankfurt: Fridrich Ebert Anlage 49, Frankfurt am Main (Messeturm), DE 60327