
Monthly Monitor I June 2026

Monthly Monitor I June 2026




Jeff brings over 30 years of experience in the energy industry, specializing in pipeline capacity management, utility agreement negotiations, and evaluating energy supply and infrastructure for greenfield facilities.

With more than 20 years of experience in supply advisory across Mexico and LATAM, Alberto focuses on both clean energy and conventional supply. He oversees Mexico operations and coordinates activities throughout Latin America.

Yasiru provides analytical support for energy supply strategies, contributing to procurement planning and market evaluations for Trio’s clients.
Bryon advises industrial and commercial clients on energy procurement strategies, leveraging extensive experience in the natural gas markets.
Anthony manages natural gas purchasing and balancing for large end users across multiple pipelines and LDCs. He also develops risk management and procurement strategies for clients in the steel and automotive manufacturing sectors.

Todd works with large industrial and commercial clients to manage natural gas exposure. Since entering the energy industry in 2000, he has developed deep expertise in risk management, asset management, and commodity trading.

With over ten years of experience and strong market expertise, Paola navigates the evolving power procurement landscape with a strategic approach. She supports clients with power procurement strategies, tariff analysis, budgeting, and ongoing market monitoring.
David brings nearly 25 years of energy industry experience, assisting clients with supply procurement, market analysis, tariff evaluations, budgeting, regulatory awareness, and cost control strategies.




John has over 30 years in the energy industry, including 20 years procuring power for clients in major deregulated U.S. markets. He supports Trio’s advisors in developing power procurement strategies.

With more than 11 years in the energy sector, Iryna manages gas and power procurement, physical trading, forecasting, budgeting, demand response, and customized reporting for industrial and commercial clients.

Stu has over 20 years of experience in the natural gas market, including physical and financial trading, procurement, asset optimization, balancing, and risk management.

Cynthia has over 17 years of experience in North American wholesale and retail energy markets. She offers expertise in deregulated power and gas markets, energy operations, regulatory compliance, and retail energy strategies.
Roger brings more than 25 years of experience in commodity sales, procurement, transportation, and midstream services. He excels in applying technical and interpersonal skills to drive results across diverse industry segments.
Irfan specializes in creating compelling visual content and brand assets that elevate Trio’s identity and storytelling across global platforms.
Daniel focuses on power procurement for large industrial and commercial clients. With 17 years in sales and account management, he brings a client-focused approach to energy strategy.
Jeff Bolyard - Principal, Energy Supply Advisory
U.S. natural gas markets have been relatively insulated from historical global pricing exposure primarily due to abundant domestic supply and limited LNG and pipeline export capacity. When the war with Iran began back on the last day of February and 1/5th of the world’s LNG supply was shut in due to the closure of the Strait of Hormuz, very little price impact was felt in the U.S., particularly at the Henry Hub benchmark, which has not really moved over the past four months. The reason is fundamental. Domestic production was still ample, and LNG exports were already maxed out, resulting in very little change in U.S. gas prices. Not nearly the same story for Europe’s TTF benchmark where prompt month pricing jumped $7.71/MMBtu in less than a week after the start of the Iran war. While the price premium has retreated in recent weeks with ongoing peace Memorandum of Understanding discussions, TTF remains a 4.4 multiplier to Henry Hub currently.
So does any of this structurally change for U.S. markets once winter comes should the Strait of Hormuz remain restricted? Admittedly, the correlation between global benchmarks have strengthened, and U.S. prices are being influenced by global supply-demand dynamics, primarily at the Henry Hub benchmark. But that influence has been measured in dimes, not dollars per MMBtu, with most other non-Henry Hub regional indices typically trading at a discount most of the year against that benchmark. However, there is an exception to this norm, which is the northeast region of the United States which still imports LNG to meet peak demand.

While northeast gas prices are not directly linked to European prices most of the year, they are influenced during periods of high demand for natural gas, particularly in the winter when insufficient pipeline capacity exists to deliver needed gas supply and prices diverge from Henry Hub and spike. It is during these short periods that the marginal price of energy becomes LNG imports. It is the confluence of increased demand, lack of domestic pipeline capacity, and the significant LNG premium to European buyers that forces the northeast market to compete for LNG molecules that would otherwise head to Europe.
Highlighted in the chart below are three natural gas pricing locations that clearly show this unique market dynamic. The Title Transfer Facility (TTF) European benchmark in the Netherlands, the Henry Hub benchmark in Louisiana, and Algonquin City Gate, a northeast pricing point that has no other alternatives to pull from during spurts of extreme demand. Highlighted are the past 5 winters where Algonquin City Gate prices departed the typical tight correlation to the Henry Hub to attract LNG molecules from Europe for a growing number of winter days. While LNG can raise national benchmark prices, the magnitude of impact is moderate relative to regional price drivers seen at Algonquin.
The dominant factor driving this trend is insufficient pipeline capacity. However, in the current energy market where price mitigation reliability are at the forefront, even the Northeast, an area long known for opposing gas infrastructure, is receiving some unlikely tailwinds from multiple sources. Algonquin Pipeline, which is currently in an open season for their Project Beacon, which would, if built, increase pipeline capacity in New England by 10%, has a new supporter in Massachusetts Gov. Maura Healy, which recently urged power generators to consider subscribing in some form to support the project. In the area of permitting at the federal level, the FERC unanimously issued a Notice of Proposed Rulemaking (NOPR), in May, which would more than double the spend threshold of current automatic “blanket authorization” program from $14.5 million to $30 million, to allow pipelines to move forward with smaller infrastructure projects without prior FERC review. Developments
like these will greatly assist gas pipeline and storage projects, reduce both costs and opposition to get them built, and significantly reduce the timelines to complete.
Northeast U.S. natural gas prices exhibit a partial and episodic correlation with European prices with an LNG structural linkage when the stars align. Regional infrastructure constraints and short periods of high demand dominate pricing outcomes. The higher the price of gas in Europe, the higher the floor price for the Northeast U.S. during these periods. However, the historical tides of opposition may be turning warmer to be more receptive to natural gas infrastructure development into New England. But time, and likely the next election or two, will likely play out the longer term direction in this evolving energy market dynamic.

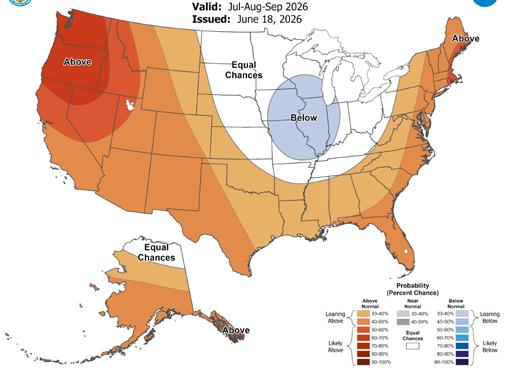
Temperature Outlook
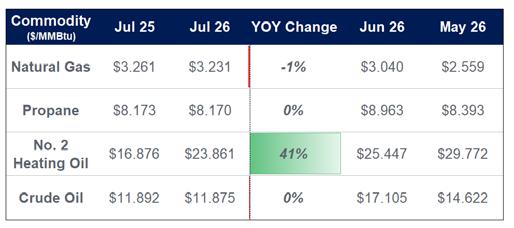
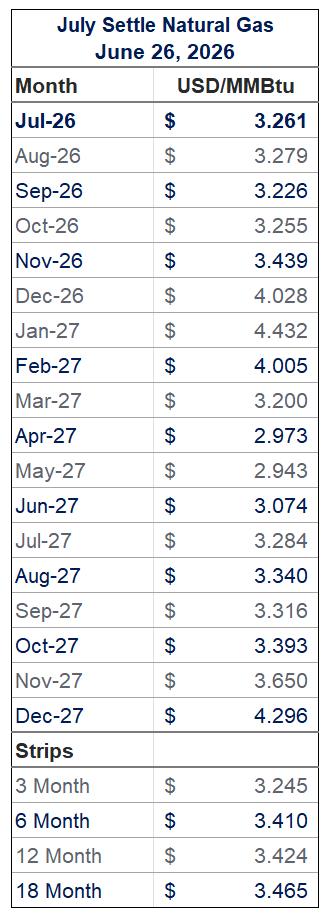
Precipitation Outlook NYMEX Settle
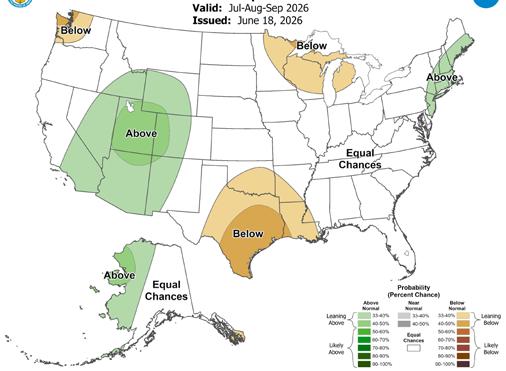
Valid: Jul-Aug-Sep, 2026
Issued: June 18, 2026
Stu Tuckett - Sr. Energy Supply Advisor
Over the past six months, U.S. natural gas prices have remained relatively range-bound despite several fundamentally supportive drivers. Henry Hub prices generally traded in the low-to-mid $3/MMBtu range during the first half of 2026, supported by strong LNG export demand, elevated power-sector consumption, and periodic weather-driven demand spikes. However, robust U.S. production and above-average storage inventories have largely prevented a sustained move higher. The EIA noted that working gas inventories remained above the five-year average through much of the injection season, helping cap price rallies even as domestic demand continued to grow.
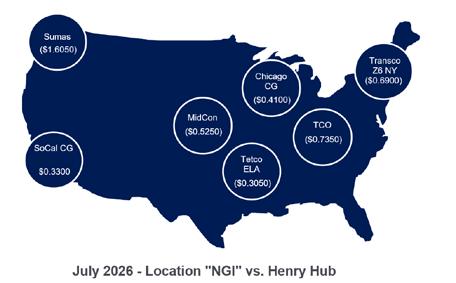
In the Midwest, Chicago Citygate prices exhibited a modest premium to Henry Hub for much of the period. Winter weather in January and February supported stronger regional demand and widened basis values, while concerns over storage withdrawals and pipeline utilization added temporary upward pressure. As winter transitioned into spring, the premium narrowed, though Chicago continued to trade at a slight premium reflecting its position as a major demand center. Market participants have also been monitoring increasing Midwest power demand and the potential for summer cooling loads to tighten regional balances.

Oklahoma and the broader Midcontinent region experienced a somewhat different dynamic. NGPL Midcontinent pricing generally traded at a discount to Henry Hub, consistent with the area's strong production base and proximity to supply sources. While basis values improved from late-2025 lows, Midcontinent markets remained pressured by abundant regional production and expanding pipeline connectivity to Gulf Coast demand centers. Seasonal demand and tighter regional balances provided intermittent support, but Oklahoma pricing largely reflected a well-supplied market.
Looking ahead, the key question for both Chicago and Oklahoma markets is whether rising LNG exports, growing electricity demand, and sustained summer heat can offset continued production growth. For now, fundamentals suggest a balanced market with localized basis volatility, but absent a significant weather event or supply disruption, the market appears well supplied heading into the second half of 2026.

At mid-year crude oil markets are emerging on the other side of an extraordinary period of geopolitically driven volatility that has likely permanently altered energy markets. Oil Markets experienced extreme volatility as renewed conflict between Iran and allied U.S. and Israeli forces disrupted both the flow of supply to global markets as well as new production from the oilfields of the Middle East. As the conflict settles into an uneasy truce and period of extended negotiations, what is the outlook for crude oil and refined product markets? Will conflict- driven high prices and volatility be the new norm or will markets return to pre-war excess.
The renewed conflict with Iran created the largest shock to energy markets since the Oil embargo in the 1970’s, reintroducing geopolitical risk premiums into global oil and natural gas markets. But the market found a way and the world largely managed the crisis
although with substantial increases in inflation. Oil prices spent most of 2025 in decline as the markets contemplated a likely supply glut in 2026 as growing supply, demand uncertainty, and international trade frictions weighed on markets. Last year geopolitical conflicts including Ukraine-Russia, Venezuela and a previous round of bombing of Iran failed to dent oil markets. These geopolitical flashpoints would occasionally cause price spikes that were not sustained. At year end U.S. pricing benchmark West Texas Intermediate (WTI) near lows for the year at $57 per barrel, with international benchmark Brent near $60.
The unprecedented closure of the Strait of Hormuz with the renewed conflict created an oil supply crisis that spiked oil prices but also impacted downstream supply chains extending into key industrial and agricultural inputs as the Strait carries substantial

amounts of LNG, fertilizers, and finished metals. Forward Crude Oil prices for Brent peaked near $120 per barrel with WTI hitting $113.
With the recently negotiated cease-fire agreement, the conflict has settled into a phase of tense negotiations for a long-term agreement punctuated by intermittent strikes by both sides however, both sides were motivated to extend the peace. Markets have reacted with prices falling rapidly. After several weeks of large price declines since the cease-fire, prices have approached prewar levels. Prices were rebounding again this week with renewed strikes by both sides amid a wavering cease-file. Brent this week was trading near $78/barrel and WTI back over $75.
Have oil markets changed coming out of this latest Midde East conflict? The conflict created economic disruptions around the globe and has renewed
concerns around supply security. This wake-up call may lead consuming countries to another reassessment of their supply sources and forms of energy. However, in the immediate aftermath of this latest Middle East conflict, producers and consumers are focused on full resumption of exports from the Middle East and the potential for ample supply again available to the markets.
• Key Supply Factors: On the supply side OPEC+ members are ramping production and exports back up as quickly as possible to recapture markets and contend with increasing competition from the U.S., South America. and now Iran. In fact, shipments through the Strait have quickly rebounded with increases in new production loadings as well as the transit of tankers through the Strait with oil on-board that have been

stranded since the war began. Exports have reached 10 million barrels a day, still below the average 18 million per day pre-war levels. After peaking at nearly 100 million barrels on board ships stranded in the Gulf, approximately 75% has now cleared the Strait. Production has rebounded with Saudi Arabia, Kuwait, UAE and Iraq approaching their pre-war levels. Iran’s production is now also joining supply pool as sanctions are being eased. Oversupply concerns in 2025 were driven by an OPEC+ campaign to unwind the organization’s voluntary suspension of existing production to support the market. OPEC+ is now set to ramp up production again with an initial 188 million combined increase in member quotas scheduled for August and more to come. Beyond constrained OPEC+ exports, U.S. production is hitting new highs as exports set modern highs and shifted to supplement European and Asian allies.
Add in newly unsanctioned and growing Iranian and Venezuelan production and the world supply picture appears to reflect the potential to rapidly return to pre-war levels.
• Key Demand Factors: On the demand side, refilling of strategic reserves and demand destruction are currently the leading considerations. Global strategic reserves held by individual countries were drawn done to cushion the impact of constrained exports through the Strait. This was the world’s safety net and these reserves must be replenished. Total international reserve withdrawals were estimated at close to 400 million barrels creating a large but potentially manageable refill process. The conflict has also created significant demand destruction with timing and volume of rebounds, particularly in Asia, uncertain. The EIA is now estimating global oil demand will be an

average of 1.2 million barrels a day lower for 2026. Demand destruction in China was particularly impactful as the country combined massive storage reserves, a multi-year shift to electrification in transportation and balancing of their petrochemical production enabled them to effectively weather the storm. Many other nations also managed through the conflict.
Energy markets will continue to be subject to global volatility coming out of this conflict with the new realities in the Strait. Exports will remain at risk from a battered Iran and susceptible to interruption. The offset will be all global producers want to sell their oil, including Iran. In the U.S., volatility but not scarcity drives the energy markets where crude oil, LNG, NGL’s and refined product markets remain well supplied, but many of these commodities, particularly crude oil will track global markets impacting wholesale and retail
fuel prices including gasoline, diesel, and jet fuel.
In the near-term Oil markets continue to take an optimistic view on supply recovery from the Persian Gulf, despite flare-ups between the U.S. Israel and Iran. Current WTI futures prices are effectively flat running out through 2027. Crude oil, Natural Gas and associated derivatives will remain primary energy inputs for the economy after this conflict. However, If consumers are able, they will opt for energy supply security. This process will take many forms from more pipelines to bypass the Strait to actual reductions of imports of fossil fuels, which in most cases will mean increasing their supply from nuclear and renewables. Increasing geopolitical shocks now are reinforcing the value of longer-term hedges of energy, particularly natural gas as well as diversification of energy portfolios into sustainable energies to provide a balance of long term cost stability and resilience.

Daniel Tubbs - Sr. Energy Supply Advisor
The Midcontinent Independent System Operator (MISO) region Zone 4 wholesale electricity market continues to show notable price movement heading through 2026. While forward prices for 2026 ranged between $56.30/MWh and $39.78/MWh from late 2024 to 2025, Zone 4’s electricity market remains volatile and is impacted primarily by natural gas prices.
MISO's 2026 Load Forecast: MISO recently updated its Long-Term Load Forecast, projecting that peak system demand will jump 35% by 2035 (growing from 121 GW to 163 GW). Zone 4 Impact: This aggressive growth is heavily driven by hyperscale data centers, manufacturing reshoring, and AI infrastructure. MISO Central—which encompasses Ameren's Illinois territory—is projected to absorb a staggering 58% of this new data center energy demand.
To combat the dwindling surplus capacity mentioned in your draft, Ameren is currently executing a massive $31.8 billion five-year investment plan (2026–2030).
New Resources: This aggressive capital push includes plans to add 5.3 GW of new generation resources across their footprint by 2030, anchored by a proposed 2.1 GW combined-cycle natural gas energy center and expanded battery storage capacity.
Generation alone won't solve regional volatility; moving the power efficiently is just as critical. MISO is moving forward with Tranche 2 of its long-range transmission projects to alleviate grid bottlenecks. Ameren has been assigned roughly $1.3 billion in Tranche 2 projects to build out high-voltage transmission highways. These are designed to relieve congestion and improve baseline reliability across the Midwest, with expected in-service dates between 2032 and 2034.

Against this backdrop, MISO recently released the results of its 2026/2027 Planning Resource Auction (PRA), which secures the necessary resources to ensure peak demand is met.
For Ameren's territory (Zone 4 in Illinois and Zone 5 in Missouri), the summer capacity price cleared at $424.30/MW-day. Year-Over-Year Relief: While this remains historically elevated, it represents notable relief from the record $666.50/MW-day seen during the 2025/2026 summer auction. MISO Footprint Averages: Across the broader MISO footprint, the annualized clearing price dropped 42%, settling into a range of $116 to $126/MW-day.
According to recent MISO data, this year's overall price decrease was driven by an influx of 4.8 GW of new generation. Unlike the 2025/2026 planning year— which was characterized by a dwindling capacity
surplus driven by 3.2 GW of power plant retirements and reduced imports—the 2026/2027 auction saw higher offered capacity successfully outpacing demand growth.
These auction results continue to test MISO's ongoing structural changes, including the reliability-based demand curve (RBDC) initiated in recent years. Designed through extensive collaboration with the Organization of MISO States, stakeholders, and the Independent Market Monitor, the RBDC aims to improve market efficiency, enhance grid reliability, and proactively adjust market operations to incorporate MISO's rapidly evolving mix of renewable and traditional generation assets.

Cynthia Wang - Sr. Energy Supply Advisor
The weighted average Alberta power price was $44.78/MWh (4.48¢/kWh) for 2025, the lowest annual pool price since 2017 and more than 31% lower than the previous year.
The soft pricing trend continues in 2026, with pool prices averaging just $31.59/MWh (3.16¢/kWh) for the
first half of the year, 23% less than the same period of 2025, largely attributed to February and June where both months settled at the lowest since 2017 at $22.72/MWh (2.27¢/kWh) and $17.56/MWh (1.76¢/ kWh) respectively.
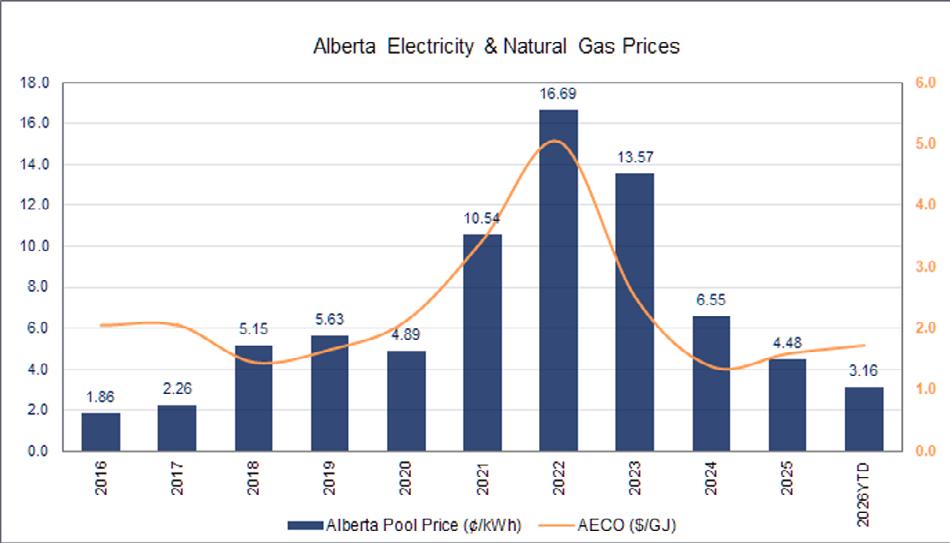
The year-over-year lower prices seen since summer 2024 were driven by increased capacity from both thermal and renewable generation installed over the past three years, which help Alberta’s total generation capacity reach 23,242 MW at the end of 2025, according to the latest annual market statistics report published by the Alberta Electric System Operator (AESO).
Some of the generation added in 2024, including cogeneration assets like Cascade and Base Plant, did not complete commissioning or fully operational until 2025. The additional supply helped increase 2025’s average supply cushion by 9.3%, put downward pressure on pool prices and offset impacts from increasing demand and higher exports, although total generation capacity was only up by 120MW in 2025, a minimal 0.5% year over year growth.
Alberta’s internal power load requirement increased by 2% in 2025, continuously led by increasing production from oil and gas industry, population growth, and periodic extreme weather conditions.
A new demand record of 12,785 MW was set on December 11, 2025, 3.2% higher than the previous one of January 2024, however, pool price during the new demand record was low, at $44.20/MWh. the high availability of gas generation and wind generation.
Alberta’s power demand for the first half of 2026 averaged 2.9% higher than the same period of last year, driven by strong oilsands activities and broader economy.
Total83,11585,21486,57286,29388,82790,371
Average9,4609,7289,8839,85110,11210,316
Gas-fired generation supplied 76.8% of Alberta’s total power demand in 2025, up from 74.7% in 2024. Meanwhile, wind, solar and hydro generation accounted for 21% of Alberta’s generation, up from 19% a year ago.
Gas generation provided 54% to 98% of total supply on an hourly basis in 2025, while intermittent generation provided 0% to 44% of total supply on an hourly basis, due to the nature of their dependency on prevailing weather conditions.
With prices lower than in other interconnected jurisdictions Alberta has shifted from an importer of power to an exporter in recent years and exported a record amount of 348 MW on average in 2025, up by 130+MW from 2024.
During a major system event on March 8, 2026, BC grid lost about 2,600 MW of generation. In response, Alberta subsequently provided emergency energy to a request from the Western Power Pool, supplying 425 MW for around 18 minutes, about 40% of export capacity between the two provinces.
Although average pool prices have been relatively low, market continued to exhibit a fair amount of volatility.
Sometime there was a large variation in prices intraday, generally driven by fluctuation in intermittent supply. For instance, on September 8, 2025, pool price
cleared at the floor of $0.00/MWh (0.0¢/kWh) at 2am due to low overnight demand and high wind supply. However, once wind conditions changed later in the day along with gas unit outages and constraints on imports. The AESO had to declare an Energy Emergency Alert 3 (EEA3) when supply curve had been exhausted, and contingency reserves were utilized to meet demand. Pool prices of several evening hours settled at the cap of $999.99/MWh (99.99¢/ kWh), closing the day at $431.66/MWh (43.17¢/kWh).
Similarly, when Alberta was under an unseasonal heat wave on May 25, 2026, a combination of increasing cooling demand, low renewable output (especially wind) and large number of outage units (~5,000MW) triggered an EEA in the evening, sending pool prices to the cap for a couple of hours with the help of expensive supply from imports, and closed the day at $400.37/MWh (40.04¢/kWh).
AlbertaMonthlyWeightedAveragePowerPoolPrices(¢/kWh)
There was only one EEA event in 2025 and 1HF of 2026, as discussed above. In 2024, the AESO declared an EEA3 on 8 separate days, with the events totaling 25+ hours.
Meanwhile, hourly pool prices cleared at the floor price of $0.00/MWh (0.0¢/kWh) for 10.56% of the time in 2025, much higher than 6.06% in 2024 and 0.95% in 2023. For first 6 months 2026, there are already 685 hours or 15.77% of the time, closed at $0.00/MWh
(0.0¢/kWh), and May 14 and 31 even became the first two days settled at $0.00/MWh (0.0¢/kWh) since market opening. The increase was caused by higher intermittent supply and more must-run cogeneration and combined cycle gas genera assets seen in the supply mix.
Market
Alberto Campos - Manager, Energy Supply Mexico
On June 18, two agreements issued by the Ministry of Energy (SENER) were published in the Official Gazette of the Federation:
• Agreement issuing the Guidelines for the voluntary and expedited migration of self-supply and cogeneration schemes of electric power to the structures established under the Electricity Sector Law.
• Agreement of the National Energy Commission establishing the methodology for determining the charge for the electricity transmission service provided by the Supplier to permit holders with generation plants that have interconnection agreements and transmission service contracts executed under the Public Electricity Service Law (LSPEE).
These agreements aim to regulate the migration of generators and load centers associated with a Legacy Structure (i.e., self-supply or cogeneration
permits under the LSPEE), linked to power plants with a capacity equal to or greater than 0.5 MW, as well as the related contracts and agreements currently in force.
Through this measure, SENER seeks to reduce the number of contracts under the LSPEE and promote the transition to the Wholesale Electricity Market (WEM). To do so, interested parties must submit an expression of interest to participate in the migration process. During this period, they may continue operating under the LSPEE, provided they maintain a valid interconnection agreement.
Load centers that are part of self-supply or cogeneration entities may aggregate their demand to obtain the registration as Qualified User, without requiring a minimum demand per load center. Additionally, consumption centers sharing a private network with a power plant may migrate to the selfconsumption modality under the Electricity Sector Law (LSE).

It is important to note that obtaining a permit under the LSE implies the waiver and termination of the legacy permit, while the completion of the migration process results in the early termination of the associated contracts and agreements.
End users currently receiving supply through Legacy Structures may choose to:
• Migrate to the WEM, or
• Receive supply from the Federal Electricity Commission (CFE).
If they choose not to migrate, they will continue to receive electricity under their contract until it ends and then with CFE’s Basic Supply scheme.
Load centers below 1 MW that choose to migrate will not be required to update their metering systems, provided the existing systems meet the minimum

requirements. Load centers above 1 MW will have up to 18 months to complete any required equipment upgrades; however, those upgrades will not delay the migration process.
The preferential transmission tariff applicable to legacy contracts will cease to exist on October 19, 2026 From that date onward, the transmission service charge will be calculated using the following formula:
CST_i = ISPTEE_i + ISPDEE_i + ISOCENACE_i + ISCnMEM_i
Where:
• CST_i: Total transmission charge for permit holder i
• ISPTEE_i: Market settlement for transmission service
• ISPDEE_i: Market settlement for distribution service
Meet the people who power Trio. In this video series, you’ll hear from people from across our organization as they share their perspectives on working at Trio, their areas of expertise, and how they incorporate Trio’s values into their everyday lives.

Discover our broadcast: Risky Business. This broadcast that cuts through the noise of global energy markets. Go behind the scenes with our experts and find out what market trading and risk management really look like.
• ISOCENACE_i: Market settlement for CENACE operation services
• ISCnMEM_i: Market settlement for ancillary services not included in the MEM
This implies the incorporation of regulated tariffs and MEM-related charges that were not previously considered.
However, generators and load centers that choose to migrate will retain their current wheeling (transmission) conditions until October 6, 2028.
This change could materially increase transmission costs—potentially by more than three times in some cases—which may make participation in the WEM more attractive for certain load centers compared with remaining under CFE tariff structures.
Loads that are interested in migration will have to announce it before June 19th, 2026.
The publication of the General Administrative Provisions (DACG) for the Integration of Electric Energy Storage Systems into the National Electric System establishes a formal regulatory framework for battery energy storage systems (BESS) in Mexico. Prior to this framework, storage existed in a regulatory gray area, hindering utility-scale financing, grid interconnection, and market participation.
The framework categorizes energy storage into specific business models, dictating how assets interact with the grid and the Wholesale Electricity Market (MEM):
• Associated with a Power Plant (SAE-CE): BESS co-located with generation (typically wind or solar). This allows developers to shift energy to peak pricing hours, firm up intermittent output, and reduce curtailment. Crucially, the BESS is considered part of the generation asset; as long as

the combined maximum output does not exceed the plant's contracted interconnection capacity, a separate generation permit is not required.
• Associated with a Load Center (SAE-CC): "Behind-the-meter" storage installed at industrial or commercial sites. This enables large off-takers to perform peak shaving (reducing demand charges), optimize time-of-use tariffs, and enhance localized reliability without injecting power back into the grid.
• Non-Associated / Standalone (SAE-NA): Independent, utility-scale battery parks connected directly to the National Transmission Network (RNT) or General Distribution Networks (RGD). These assets participate directly in the MEM, acting dynamically as both load (charging) and generator (discharging) to capture energy arbitrage and capacity market revenues.
• Distributed Generation (SAE-GD): Storage paired with generation assets under 0.7 MW (e.g., commercial rooftop solar), governed by existing distributed generation regulations.
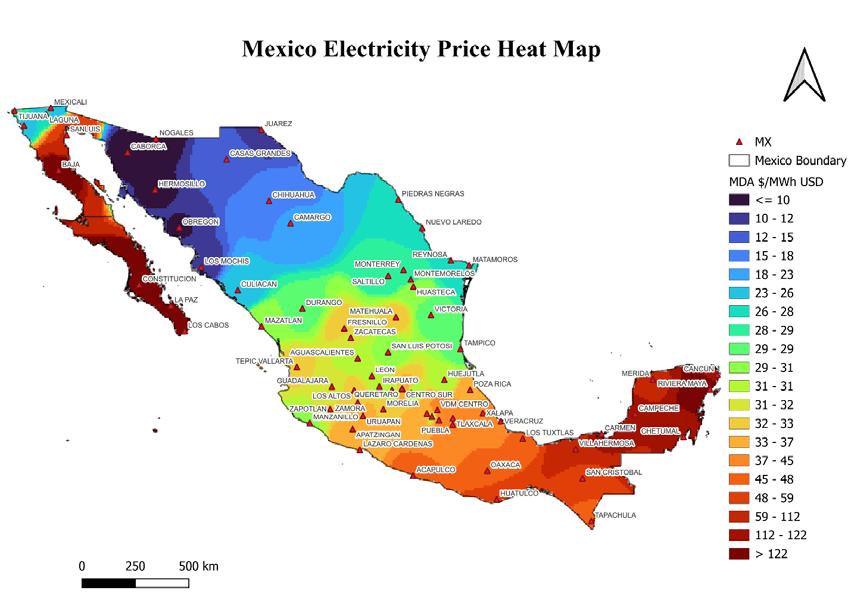
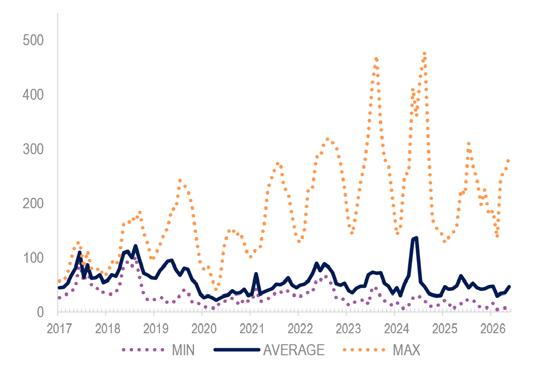
Average Day-Ahead Market (MDA) prices surged during May to $46.51/ MWh, representing a 34.1% increase over the previous month.
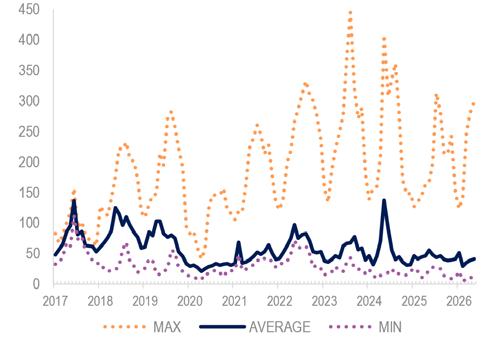
Average real-time market (MTR) prices have reached $41.19/MWh, marking a 7.5% increase from the previous month.
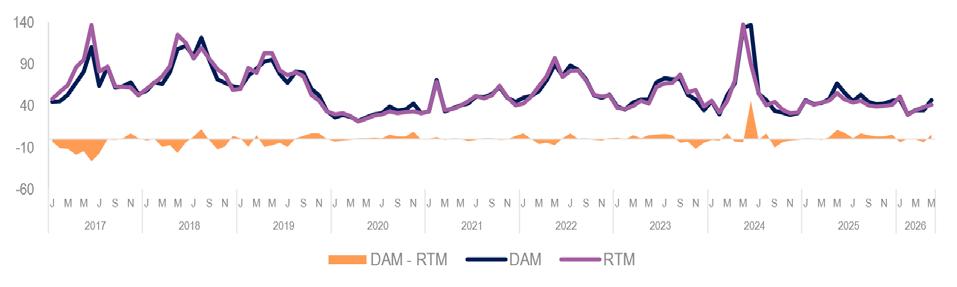
The price spread between the day-ahead and real-time markets increased to $5.33/MWh in May 2026. This widening spread may indicate greater challenges in demand forecasting and operational planning, particularly when actual consumption differs from forecasted demand.

Peggy Stassen
Managing Director, Supply Advisory +1-614-339-2639
Peggy.Stassen@TrioAdvisorycom
Jeff Bolyard
Principal, Energy Supply Advisory +1-614-339-2625
Jeff.Bolyard@TrioAdvisory.com
John Reid
Principal, Energy Supply Advisory +1-614-339-2629
John.Reid@TrioAdvisory.com
About Trio
Trio is a global energy and sustainability advisory company that helps large commercial, industrial, and institutional organizations navigate the energy landscape. Trio provides integrated strategy and implementation offerings across energy supply management, data management, energy optimization and electrification, clean
100+
energy, and sustainability to help the world’s largest organizations deliver on their strategic objectives and priorities.
For more information trioadvisory.com
clients in the Fortune 500 and Global Fortune 500 30+
countries doing business in 13+ GW
offsite and onsite renewable energy procured
Did you know
Headquartered in Irvine, CA, with a global presence in North & South America, Europe and Asia-Pacific.
Irvine: 18500 Von Karman Ave., Suite 260, Irvine, CA 92612
Boston: 53 State Street, Suite 500, Boston, US 02109
London:1 Haven Green, Ealing Broadway, London, UK W5 2UU
Sarajevo: Danijela Ozme 3, Sarajevo, BA 71000
Utrecht: Stadsplateau 19-40, Utrecht, NL 3521 AZ
Frankfurt: Fridrich Ebert Anlage 49, Frankfurt am Main (Messeturm), DE 60327