
Monthly Monitor I July 2026

Monthly Monitor I July 2026




Jeff brings over 30 years of experience in the energy industry, specializing in pipeline capacity management, utility agreement negotiations, and evaluating energy supply and infrastructure for greenfield facilities.

With more than 20 years of experience in supply advisory across Mexico and LATAM, Alberto focuses on both clean energy and conventional supply. He oversees Mexico operations and coordinates activities throughout Latin America.

Yasiru provides analytical support for energy supply strategies, contributing to procurement planning and market evaluations for Trio’s clients.
Bryon advises industrial and commercial clients on energy procurement strategies, leveraging extensive experience in the natural gas markets.
Anthony manages natural gas purchasing and balancing for large end users across multiple pipelines and LDCs. He also develops risk management and procurement strategies for clients in the steel and automotive manufacturing sectors.

Todd works with large industrial and commercial clients to manage natural gas exposure. Since entering the energy industry in 2000, he has developed deep expertise in risk management, asset management, and commodity trading.

With over ten years of experience and strong market expertise, Paola navigates the evolving power procurement landscape with a strategic approach. She supports clients with power procurement strategies, tariff analysis, budgeting, and ongoing market monitoring.
David brings nearly 25 years of energy industry experience, assisting clients with supply procurement, market analysis, tariff evaluations, budgeting, regulatory awareness, and cost control strategies.




John has over 30 years in the energy industry, including 20 years procuring power for clients in major deregulated U.S. markets. He supports Trio’s advisors in developing power procurement strategies.

With more than 11 years in the energy sector, Iryna manages gas and power procurement, physical trading, forecasting, budgeting, demand response, and customized reporting for industrial and commercial clients.

Stu has over 20 years of experience in the natural gas market, including physical and financial trading, procurement, asset optimization, balancing, and risk management.

Cynthia has over 17 years of experience in North American wholesale and retail energy markets. She offers expertise in deregulated power and gas markets, energy operations, regulatory compliance, and retail energy strategies.
Roger brings more than 25 years of experience in commodity sales, procurement, transportation, and midstream services. He excels in applying technical and interpersonal skills to drive results across diverse industry segments.
Irfan specializes in creating compelling visual content and brand assets that elevate Trio’s identity and storytelling across global platforms.
Daniel focuses on power procurement for large industrial and commercial clients. With 17 years in sales and account management, he brings a client-focused approach to energy strategy.
Jeff Bolyard - Principal, Energy Supply Advisory
If you have been in the business world any length of time, you’ve likely heard the phrase “past performance is not indicative of future results”. While this statement is true in many areas of personal life, this is also applicable to the natural gas pricing benchmark for the New York Mercantile Exchange (NYMEX) futures contracts. For many outside commodity markets, or more specifically the natural gas business, a reference to NYMEX futures pricing can often be misinterpreted. For many buyers of natural gas, the commodity portion price component can be protected for any month in the future for several years into the future, the price of which is transparently seen and known by both buyers and sellers looking to protect that price into the future and is visible via the NYMEX futures market for natural gas. To be clear, the price available is not a prediction of what the price will be at any point in the future, but the price at which a transaction could occur at that moment in time. This snapshot of pricing
for a future period can be transacted upon, effectively fixing or hedging a major component of a buyer’s gas cost. Absent locking in that component, the market continues to move up or down every day based on multiple variables that move natural gas prices. The price of natural gas that was shown yesterday is no longer available and the price the NYMEX will show tomorrow is still unknown. The only price that a buyer can lock down is the snapshot NYMEX price at this point in time today.

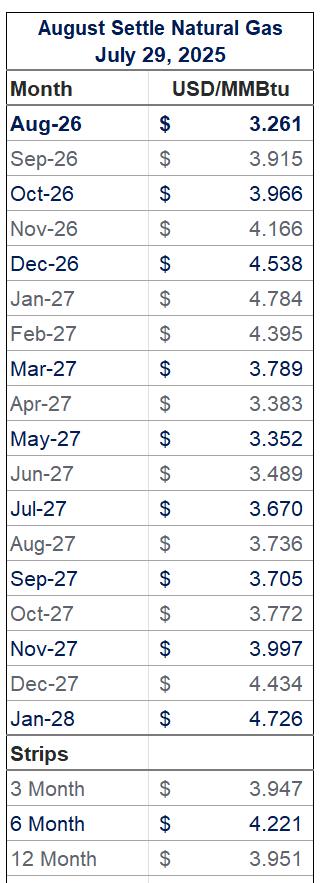
It is true that past performance is not indicative of future results, but we need to be careful not to completely ignore history, as it does provide insight as to what it has actually done and some fundamental reasons of why it may happen again. The chart below is a combination of recent NYMEX Last Day Settlement prices for January-August 2026, and the snapshot of what a buyer could purchase natural gas for each month into the future as of July 30, 2026. Each month on the chart has a gray column, which represents the range of trading for that month on the NYMEX over the past 2 years, or what the range of price that a buyer may have bought it for over that time.
For the period of Jan-Aug 2026, the blue bar within each gray column represents the final settlement price of NYMEX when each month ceased to be a future month and the price which a buyer paid that month that chose not to hedge. From September 2026-December 2028, the blue bar represents the NYMEX monthly price for a specific moment in time, on July 30, 2026.
There have been multiple reasons why natural gas prices in the U.S. have fluctuated in the past. Back in 2020, COVID demand destruction caused NYMEX Settlements to average just $2.07/MMBtu. Just two years later in 2022, Russia’s invasion of Ukraine pushed the same calendar year settlement to more than triple at $6.64/MMBtu. In late January this year, Winter Storm Fern shot the February 2026 NYMEX settlement to $7.46/MMBtu, (red circle on chart) the absolute highest price for the February 2026 NYMEX contract at any point in history. None of these examples could have been predicted to occur nor their price impact. Again, NYMEX natural gas futures aren’t a prediction of what prices will be, but rather the collective market’s provision of opportunity of what you could buy that future period for today.
Given the reminder of what happened in recent history, let’s take a pragmatic approach to the current NYMEX opportunity today. For every month to the right of the
Settled History in the chart above, we can see that the current NYMEX price available in the market today (blue bar) is at the lower end of pricing for each month within the September 2026-Decmber 2027 time frame (green rectangle). While the remainder of 2026 is near the lowest price in two years currently, Calendar year 2027 is also presenting an attractive price relative to history and currently sitting at the 9th percentile of price range over that period of time. In other words, over the last two years, the price for Cal 2027 has been higher than today 91% of the time and currently trading at an average price of $3.36/MMBtu.
Take time to evaluate the risk in your current gas purchase strategy. Should you decide to protect at some level, the time to do so is during periods of low prices, not high, and the upside risk today is currently greater than the remaining downside opportunity for some level of protection for conservative to moderate level risk buyers.

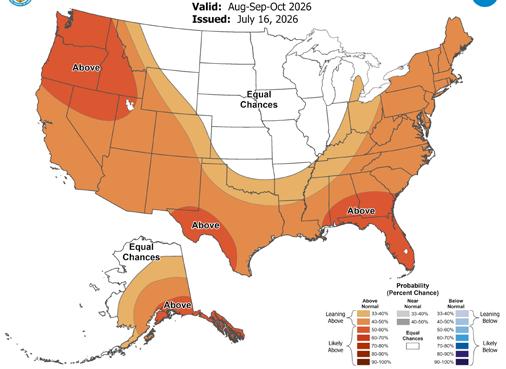
Temperature Outlook
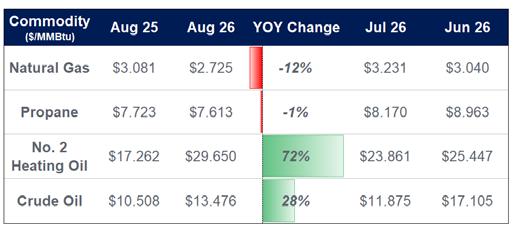
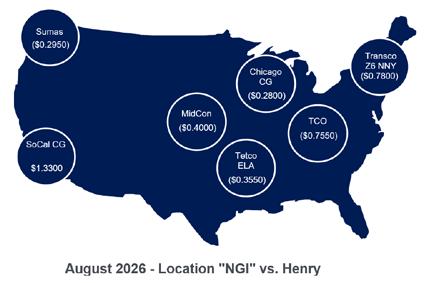
Precipitation Outlook NYMEX Settle
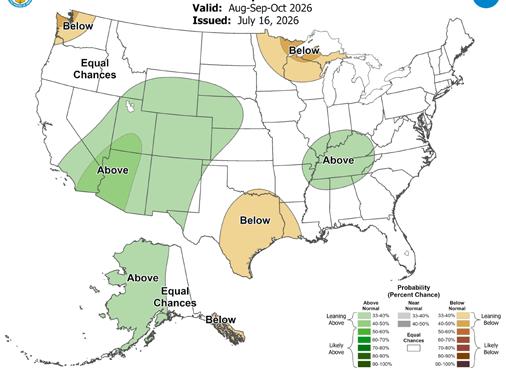
Valid: Aug-Sep-Oct, 2026
Issued: July 16, 2026
Anthony Carlozzo - Sr. Energy Supply Advisor
Working gas in underground storage is reported weekly by the EIA (U.S. Energy Information Administration). This storage is broken out by various regions throughout the country including East, Midwest, Mountain, Pacific, and South Central. While often we discuss storage as a whole, there often are regional variances that can have different market implications.
Looking at the Eastern storage region specifically as of the storage report released on 7/30/2026, the East has 654Bcf of gas in storage. This is slightly ahead of the same time last year (649BCF) and even further past the average of the last 5 years (631BCF). The impact of strong storage on the market is most easily seen on the weakness of cash pricing throughout the region. The Columbia hub that feeds many markets in Ohio, PA, WV and the Eastern Gas South hub which feeds much of northern Ohio both have steadily declined throughout July. Each starting the month well above 2.50 with Columbia approaching $2.00 to end them month and EGS falling below $2.00 on multiple occasions.
Another impact of this high storage environment is the increase of utility restrictions being put in place to limit the amount of gas going into storage. With cash being so cheap it is natural that end users will be eager to fill up their own personal “banks” or storage accounts behind their respective utilities. This can result in too much gas being on the utilities system during low demand periods, which has brought on an increase in restrictions which limit end users from delivering more gas than they are burning. A prime example of this can be seen in the high number of operational flow orders (OFOs) being called by Columbia Gas of OH. Throughout the month of July COH has called an OFO to restrict deliveries into their system on 5 different occasions, covering 16 days of the month. This poses a challenge to suppliers who must balance the urge to put favorably priced gas into storage while avoiding utility penalties for bringing in too much gas on OFO days.
Crude oil markets regained footing in July after the sharp correction experienced in June, as improving demand sentiment, tight inventory levels, and renewed geopolitical concerns offset expectations of increasing supply. While global crude flows continue to normalize, the market remains sensitive to inventory trends, geopolitics, and OPEC+ policy decisions, keeping volatility elevated.
Oil prices rebounded during July after June's sharp selloff, supported by strong seasonal fuel demand, tight global inventories, and ongoing geopolitical risk. Although supply disruptions continued to ease, markets remained focused on below-normal inventory levels and strong refining margins, helping Brent crude recover from early July lows and trade higher through much of the month.
Supply conditions continue to improve, but OPEC+ remains focused on actively managing market balances. On August 2, the seven OPEC+ members participating in voluntary production adjustments announced a 188,000 b/d increase in September output quotas, continuing the gradual reversal of voluntary production adjustments first announced in 2023. The group stated that the increase reflects confidence in market fundamentals while supporting member compliance targets.
Meanwhile, the International Energy Agency (IEA) reported that global oil supply increased by 4.1 million b/d in June to 98.8 million b/d as Gulf exports recovered. However, global output remained approximately 9.4 million b/d below pre-war levels, highlighting that the market is still transitioning toward balance rather than oversupply.

On the demand side, the IEA indicates that a recovery in global oil consumption is underway. Following significant weakness earlier in the year, demand is expected to improve as seasonal fuel consumption rises and product supplies become more readily available. The agency forecasts annual demand declines to ease from 4.8 million b/d in 2Q26 to 1.7 million b/d in 3Q26, before returning to growth of 1.2 million b/d in 4Q26. Transportation fuels are leading the recovery as summer travel demand supports gasoline and jet fuel consumption.
Inventory trends remain constructive for crude prices. The IEA reported that global observed oil inventories increased by 21 million barrels in June, marking the first build in four months. However, OECD inventories declined by 62 million barrels, underscoring the continued tightness in commercial stocks.
Refining margins remain elevated as product markets continue to tighten. The IEA noted that refining margins reached four-year highs in early July, supported by strong transportation fuel demand and delayed refinery recoveries in several regions.
Geopolitical risk remains a key variable. OPEC+ reiterated concerns regarding attacks on energy infrastructure and international shipping routes, warning that disruptions to energy supply chains could quickly tighten global balances and increase market volatility. The market is transitioning from supply recovery to managed supply growth. While the latest OPEC+ production increase signals confidence in demand, low inventory levels, strong refining margins, and ongoing geopolitical risks continue to support oil prices.

David Papish - Sr. Energy Supply Advisor
Average Real-Time LMP $/MWh
Comparing the first half of 2026 to the same period last year; while the US was mostly insulated from the events in Iran, it was not from exempt from extreme winter conditions. Observing the months of January and February of 2026, PJM-RTO LMP prices were on average approximately 79% higher than the year prior. During that same period, the NYMEX final settlement price was on average 72% higher than the same period the year prior. Power generation from natural gas in all of PJM still hovers around 40%, thus when natural gas prices increase, power prices complement. Another element that plays into how power prices behave is the generation fuel mix, or the type of
generation resources utilized in a particular area of PJM to meet the demand of customers. In Northen Illinois nuclear generation accounts for approximately 45-60% of total generation, compared to AEP-Dayton where nuclear isn’t as prevalent and natural gas and coal generation is closer to 75%. Since Northern Illinois is more reliant on nuclear generation, which also induces a lower cost of marginal power, real-time power prices in January and February 2026 remained stable.
This past July PJM released their Base Residual Auction results for the period June 1, 2028 to May 30, 2029 and higher capacity prices will continue.
In April 2025, the Federal Energy Regulatory Commission (FERC) approved a cap and floor for PJM’s capacity auction results after Governor Josh Shaprio of Pennsylvania filed a complaint about the capacity prices starting on June 1, 2025. The floor was set at $175/MW-day and the ceiling was set at $325/ MW-day for the next two delivery years starting June 1, 2026.
In April 2026, the Federal Energy Regulatory Commission (FERC) approved an extension of the price cap at $325/MW-Day for two additional auctions, including the July 2026 auction that just concluded. This means the price cap and floor will
be in place for one more planning year, through May 30, 2029. PJM stated that “without a price collar, the auction would have cleared at nearly $555/MW-day across PJM’s footprint…”
The primary drivers of the capacity price increase are power plant retirements and anticipated load growth. As coal generation resources have retired, substitutions from other sources have not appeared as required for reliable supply. Generation undersupply comes from a variety of factors such as capital investment needs, interconnection delays, and market signals. In addition to the supply side issues, utilities and ISOs across the U.S. are anticipating demand growth from data centers for things like cryptocurrency and artificial intelligence.
The following graph shows capacity prices by zone starting June 1, 2024 and ending May 30, 2029.
Local utility and regional transmission companies that are members of PJM also update their Annual Transmission Revenue Requirement (ATRR) filing. The utilities’ ATRR filing subsequently sets the Network Integrated Transmission Service (NITS or transmission) rate for utility and retail suppliers supplying customers in that area.
Like capacity rates, transmission rates change annually with some utilities updating at the beginning of the year and others every June 1st. Transmission costs can be collected by the utility as part of the distribution bill or on a retail supplier’s bill. Ultimately, transmission costs are recovered from ratepayers. The table below shows changes to NITS rates starting June 1, 2026.
Cynthia Wang - Sr. Energy Supply Advisor
Rate Hike
Electricity rates for customers in Newfoundland and Labrador have gone up 2.3% on July 1, 2026.
The initial rise filed with the Public Utilities Board (PUB) by Newfoundland and Labrador Hydro (Hydro) and Newfoundland Power (NP) was 7%, same level of annual increase that power customers in the province have seen since 2023.
The rate application drew strong criticism from public and advocates when many households and businesses are already heavily stretched after the whopping 23% rate hike over the past three years. With the advice from the provincial government and PUB’s approval, a $45 million credit balance from the Rural Rate Alteration (RRA) account held by Hydro
was directed to offset Newfoundland Power’s cost recovery need and limit this year’s rate adjustment to current level. RRA account was originally created to manage differences between rural and island electricity service costs.
According to the latest annual survey “Comparison of Electricity Prices in Major North American Cities” conducted by Hydro Quebec, electricity rates in Newfoundland and Labrador are the second lowest among the four Atlantic provinces, averaging from 11.15ȼ/kWh for large industrial customers to 15.59ȼ/kWh for residential customers as of April 2025.

Newfoundland and Labrador has more than 8,600 megawatts (MW) of installed capacity and generates majority of its electricity from hydro resources, while electricity produced from oil, natural gas and wind generation makes up the remaining 2-3% of supply mix.
The 5,428 MW Churchill Falls generation plant in Labrador is not only the province’s largest hydro unit but also the second largest underground hydro plant in North America. The plant generates more than 34 terawatt hours (TWh) of energy every year on average, and ~90% of generated by its 11 turbines flows to Quebec through a long-term power purchase arrangement and neighboring markets in Canada and the US, while the remaining power serves customers in Labrador.
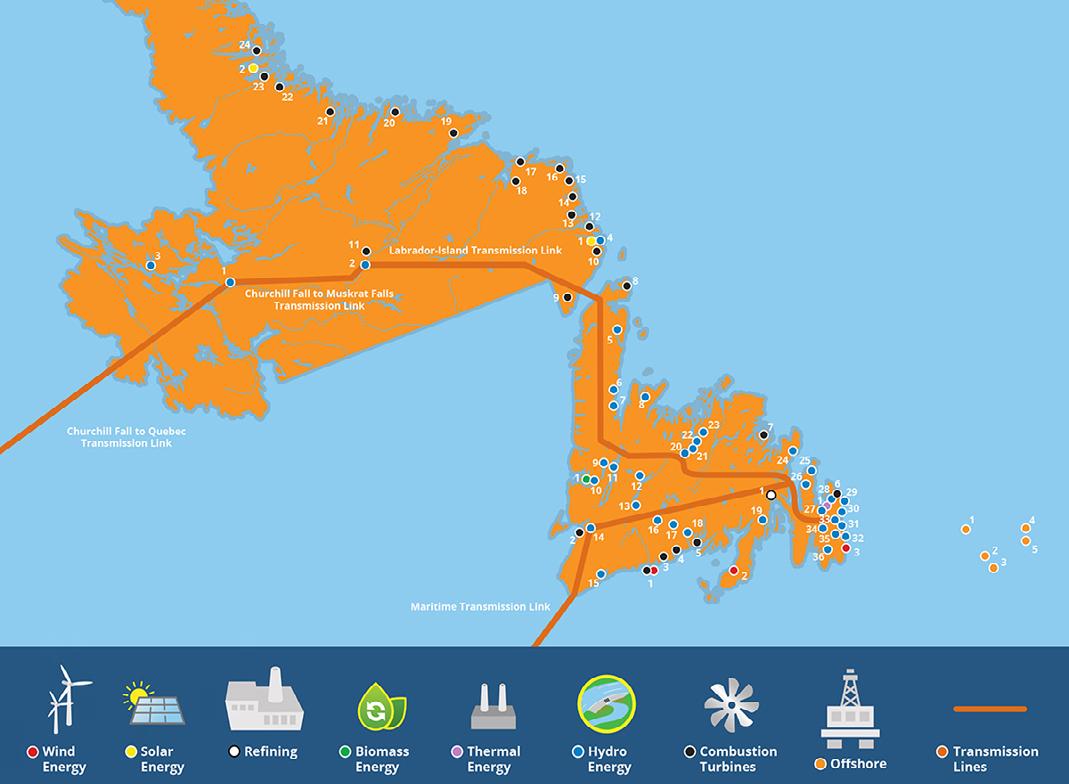
Source: Atlantica Centre for Energy https://www.atlanticaenergy.org/wp-content/themes/Avada-Child-Theme/maps/NFLD-map.jpg
Hydro, a provincial Crown corporation, manages electricity generation and transmission services in the province. Hydro owns 13 hydro, 1 oil, 4 gas, and 23 diesel power plants, and purchases additional capacity through a number of power purchase agreements with non-utility generators from wind, cogen, biogas and solar.
Hydro also provides distribution and retail services to customers in Labrador and rural areas of the island of Newfoundland not serviced by NP. Customers on 21 isolated systems on the province’s coasts receive their power from diesel generators operated by Hydro.
NP is an investor-owned utility and a subsidiary of publicly traded company Fortis Inc.
As the primary electricity distributor on the island portion of the Province, NP purchases 93% of its energy requirements from Hydro and supplies the remainder with its 139.4 MW generation facilities that consist of 23 hydro, 3 diesel and 3 gas turbine generating plants.

Newfoundland and Labrador’s electric transmission system has two grid networks: the Island interconnected system and the Labrador interconnected system. The Labrador grid gets power from the Churchill Falls and connects to Quebec’s infrastructure and beyond, while the Island system was isolated from the North American power grid until it was connected with Nova Scotia in 2018 through two subsea cables with the completion of the Maritime Link.
The Labrador-Island Link was also commissioned in April 2023. This connecting system consists of three 35 km submarine cables that carries electricity from the province’s second large hydro unit, the Muskrat Falls in Labrador, to the island of Newfoundland. This
marine cable crossing was the first ever physical connection between Labrador and the island of Newfoundland when the construction was completed in 2016.
Currently, 20% of the power originating from Muskrat Falls is purchased by Nova Scotia, which has the highest power rates in Atlantic Canada, through a long term fixed rate contract.

Market
Alberto Campos - Manager, Energy Supply Mexico
Mexico’s energy sector continues to evolve as policymakers work to balance Clean Energy ambitions with the country’s ongoing reliance on hydrocarbons. Recent regulatory progress, particularly around Battery Energy Storage Systems (BESS), is helping create greater clarity for market participants, while grid constraints and rising natural gas demand remain key factors shaping the market outlook.
Following the enactment of the new Electricity Sector Law (LSE), the newly established National Energy Commission (CNE) finalized the General Administrative Provisions governing the integration of Battery Energy Storage Systems (BESS) into the National Electric System. These regulations provide greater certainty for market participants by clarifying that only standalone storage systems with a capacity of 0.7 MW or greater require a CNE permit. Storage systems connected
to existing generation facilities or load centers are exempt from this requirement, which should help reduce deployment barriers and support faster project development.
The new regulatory framework is already supporting increased market activity. Mexico’s Ministry of Energy, SENER, recently secured more than 1,250 MW of storage capacity through a procurement process for projects expected to come online between 2027 and 2029. At the same time, SENER continues to advance grid modernization initiatives and transmission expansion tenders aimed at addressing one of the main barriers to renewable energy deployment: insufficient transmission infrastructure. To support these efforts, CFE has launched a portfolio of 58 transmission projects financed through Fibra E and OPF investment vehicles. These projects are aligned

with the National Electric System Development Program (PAMRNT) and will be critical to supporting the administration’s goal of adding 29 GW of generation capacity by 2030.
Despite this progress, questions remain about whether Mexico’s clean energy ambitions are aligned with current investment priorities. The government has reaffirmed its goal of reaching 38% renewable energy generation by 2030, but industry analyses published in July 2026 indicate that approximately 98.6% of the Energy Ministry’s budget continues to be directed toward hydrocarbons and PEMEX. This allocation highlights the ongoing challenge of advancing renewable energy objectives within a policy framework that remains heavily focused on fossil fuel development.
Questions also remain about whether Mexico’s planned electricity system expansions will be sufficient to support the country’s broader economic growth goals. A recent study by the Mexican Institute for Competitiveness (IMCO) estimates that electricity demand will need to increase by an average of 4.5% per year from 2026 through 2030 to meet the targets established under the Mexico Plan, reaching approximately 454,035 GWh by the end of the decade. This outlook is roughly 10.1% higher than the baseline scenario included in the 2025 to 2030 Electricity Sector Development Plan (PLADESE), highlighting a significant gap between expected demand growth and planned system expansion.
Meet the people who power Trio. In this video series, you’ll hear from people from across our organization as they share their perspectives on working at Trio, their areas of expertise, and how they incorporate Trio’s values into their everyday lives.


Discover our broadcast: Risky Business. This broadcast that cuts through the noise of global energy markets. Go behind the scenes with our experts and find out what market trading and risk management really look like.
These developments are unfolding as Mexico becomes increasingly reliant on natural gas. Domestic production continues to trail industrial and power sector demand, resulting in greater dependence on imports. Current forecasts suggest that U.S. pipeline imports could meet as much as 80% of Mexico’s natural gas demand by 2030. Although the federal government’s Strategy to Strengthen Energy Sovereignty aims to reduce this dependence by developing domestic conventional gas resources, meaningful progress will require a significant increase in local production. In the near term, however, lower long-term Henry Hub price expectations provide a
Prices
supportive outlook for Mexico’s power market, where natural gas-fired combined-cycle plants remain the backbone of dispatchable generation.
Overall, Mexico’s energy sector continues to advance across several key areas, including storage regulation, grid modernization, and generation expansion. However, meeting the country’s renewable energy and economic growth objectives will require continued progress in addressing transmission constraints, accelerating clean energy investment, and managing the growing reliance on imported natural gas.
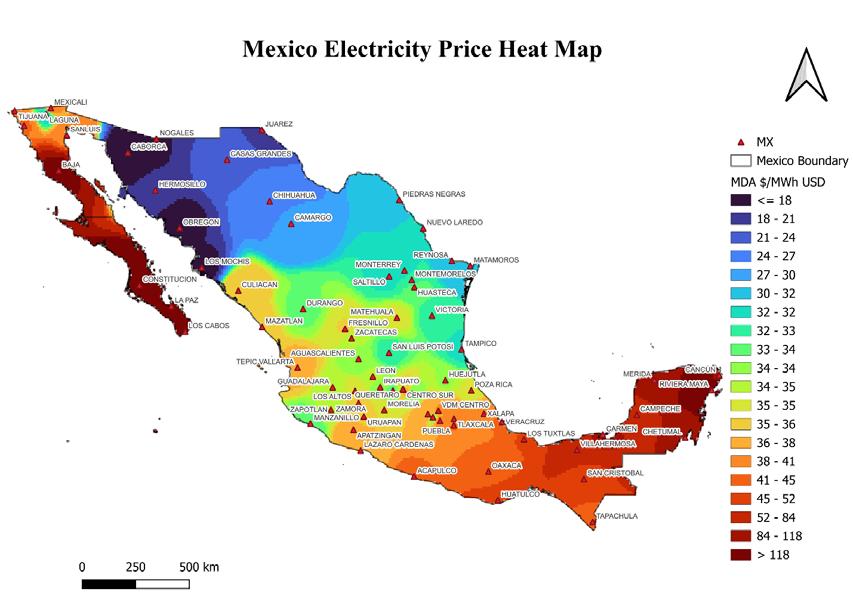
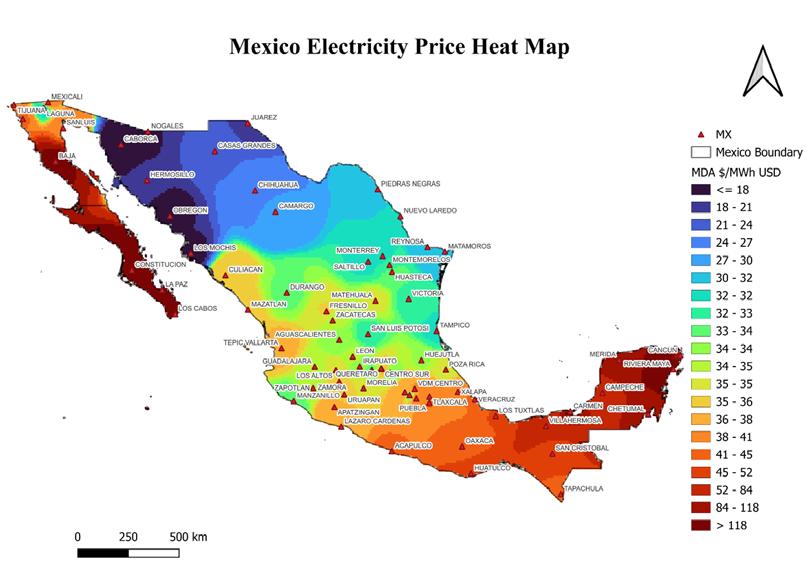
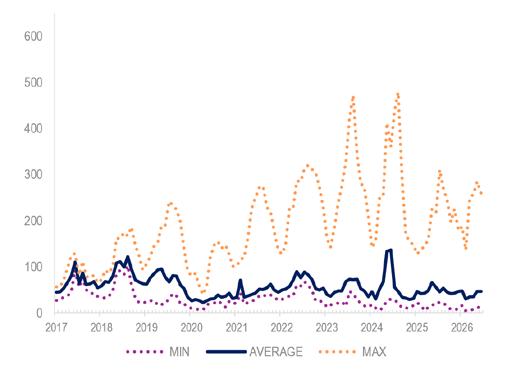
Average Day-Ahead Market (MDA) prices rose slightly in June to $46.74/ MWh, a 0.48% increase from the previous month.
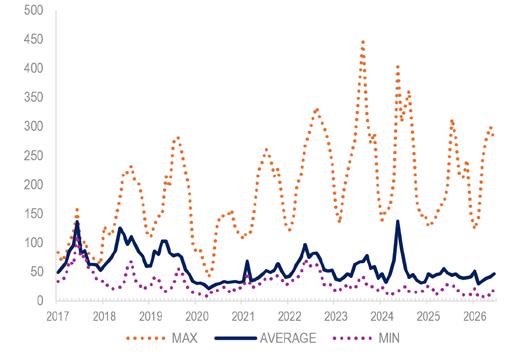
Average real-time market (MTR) prices rose sharply in June to $46.33/ MWh, a 12.5% increase from the previous month.
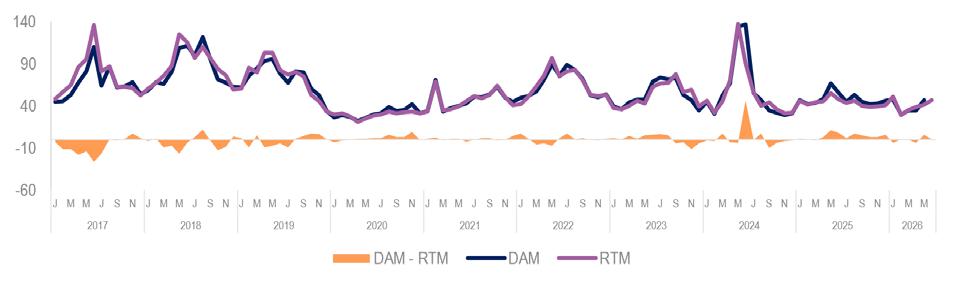
The spread between day-ahead and real-time market prices narrowed to $0.40/MWh in June 2026. This reduction may indicate closer alignment between demand forecasts and actual system conditions during the month.

Peggy Stassen
Managing Director, Supply Advisory +1-614-339-2639
Peggy.Stassen@TrioAdvisorycom
Jeff Bolyard
Principal, Energy Supply Advisory +1-614-339-2625
Jeff.Bolyard@TrioAdvisory.com
John Reid
Principal, Energy Supply Advisory +1-614-339-2629
John.Reid@TrioAdvisory.com
About Trio
Trio is a global energy and sustainability advisory company that helps large commercial, industrial, and institutional organizations navigate the energy landscape. Trio provides integrated strategy and implementation offerings across energy supply management, data management, energy optimization and electrification, clean
100+
energy, and sustainability to help the world’s largest organizations deliver on their strategic objectives and priorities.
For more information trioadvisory.com
clients in the Fortune 500 and Global Fortune 500 30+
countries doing business in 13+ GW
offsite and onsite renewable energy procured
Did you know
Headquartered in Irvine, CA, with a global presence in North & South America, Europe and Asia-Pacific.
Irvine: 18500 Von Karman Ave., Suite 260, Irvine, CA 92612
Boston: 53 State Street, Suite 500, Boston, US 02109
London:1 Haven Green, Ealing Broadway, London, UK W5 2UU
Sarajevo: Danijela Ozme 3, Sarajevo, BA 71000
Utrecht: Stadsplateau 19-40, Utrecht, NL 3521 AZ
Frankfurt: Fridrich Ebert Anlage 49, Frankfurt am Main (Messeturm), DE 60327