PATIENT & HEALTHCARE LEARNER EDUCATIONAL GUIDE
Understanding Medical Test Reports: A Simple Guide to Reading Your Health Results A clear, medically responsible guide to recognizing common laboratory terms, interpreting reference intervals, avoiding misinterpretation traps, and preparing better questions for your doctor.
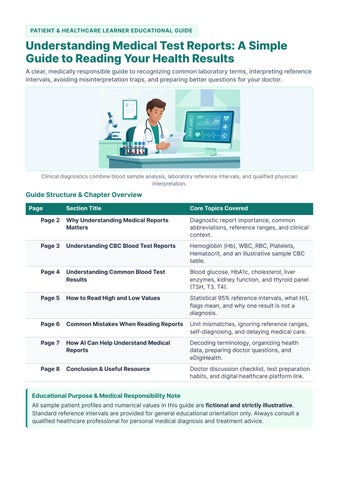
Clinical diagnostics combine blood sample analysis, laboratory reference intervals, and qualified physician interpretation.
Guide Structure & Chapter Overview
Page Section Title Page 2 Why Understanding Medical Reports Matters
Core Topics Covered
Diagnostic report importance, common abbreviations, reference ranges, and clinical context. Page 3 Understanding CBC Blood Test Reports Hemoglobin (Hb), WBC, RBC, Platelets, Hematocrit, and an illustrative sample CBC table. Page 4 Understanding Common Blood Test Blood glucose, HbA1c, cholesterol, liver Results enzymes, kidney function, and thyroid panel (TSH, T3, T4). Page 5 How to Read High and Low Values Statistical 95% reference intervals, what H/L flags mean, and why one result is not a diagnosis. Page 6 Common Mistakes When Reading Reports Unit mismatches, ignoring reference ranges, self-diagnosing, and delaying medical care. Page 7 How AI Can Help Understand Medical Decoding terminology, organizing health Reports data, preparing doctor questions, and eDigiHealth. Page 8 Conclusion & Useful Resource Doctor discussion checklist, test preparation habits, and digital healthcare platform link.
Educational Purpose & Medical Responsibility Note
All sample patient profiles and numerical values in this guide are fictional and strictly illustrative. Standard reference intervals are provided for general educational orientation only. Always consult a qualified healthcare professional for personal medical diagnosis and treatment advice.
SECTION 1 | FOUNDATIONS OF DIAGNOSTIC LITERACY
Why Understanding Medical Reports Matters
For patients, families, and healthcare learners, understanding medical test reports is an essential step toward confident participation in healthcare. Because modern digital portals often release laboratory results before your follow-up visit, knowing how to read medical test reports helps you recognize key laboratory terms calmly and prepare thoughtful questions for your clinician.
Importance of Diagnostic Reports
Diagnostic blood and urine tests provide objective measurements of how your organs, immune system, and metabolism function. Physicians rely on laboratory reports to screen for early metabolic shifts, investigate active symptoms, track chronic health conditions over time, and verify that prescribed treatments remain safe and effective. 1. Test Name
2. Patient Result
3. Flag (H / L)
4. Units
Analyte measured
Measured value or
Marks values outside
Measurement scale
5. Reference Range Expected interval for
(e.g., Hemoglobin)
Negative / Positive
standard lab range
(g/dL, mmol/L, U/L)
the testing laboratory
Figure 1.1: The five standard columns displayed on clinical laboratory reports.
Common Medical Abbreviations Abbreviation CBC / CBP
Full Laboratory Term
Complete Blood Count
Plain-Language Explanation
Measures red blood cells, white blood cells, hemoglobin, and platelets. BMP / CMP Basic / Comprehensive Metabolic Assesses blood glucose, electrolytes, kidney Panel filtration, and liver enzymes. WNL Within Normal Limits Indicates the test result falls inside the laboratory's expected reference range. H/L High / Low Flag Signals a result above (H) or below (L) the printed reference interval. mg/dL & mmol/L Milligrams per Deciliter / Conventional and international SI concentration Millimoles per Liter units used across laboratories. IU/L or U/L International Units / Units per Standard unit used to report enzyme or hormone Liter activity in blood samples.
Understanding Reference Ranges & Why Results Need Medical Context A reference range represents the span of values found in 95% of healthy individuals tested by a specific laboratory. Age, biological sex, pregnancy, hydration, time of day, and testing analyzers all influence what is normal for your body. Why Individual Results Always Require Clinical Context Two people can share the exact same laboratory value and need different care. Your physician interprets your report alongside your symptoms, personal and family history, medications, and historical baseline trends.
Understanding Medical Test Reports | eDigiHealth Educational Guide
Page 2 of 8
SECTION 2 | HEMATOLOGY ESSENTIALS
Understanding CBC Blood Test Reports
The Complete Blood Count (CBC) evaluates the three major cell lines circulating in your blood. Doctors routinely order a CBC during annual checkups and diagnostic evaluations to screen for anemia, infection, immune activity, and clotting balance. 1. Hemoglobin (Hb or Hgb) 2. White Blood Cells (WBC) Role: The oxygen-carrying protein inside red Role: Immune defense cells (neutrophils, blood cells that gives blood its red color. lymphocytes, monocytes, eosinophils, basophils) Typical Adult Range: Men: 13.2–16.6 g/dL; that fight infection. Women: 11.6–15.0 g/dL. Low levels commonly Typical Adult Range: 3,400–9,600 cells/mcL (or signal iron or vitamin-related anemia.
4,000–11,000/µL). High WBC counts often reflect infection or inflammation.
3. Red Blood Cells (RBC) Role: Flexible cells that transport hemoglobin
4. Platelets (PLT) Role: Small cell fragments that adhere to injured vessel walls to initiate blood clotting. Typical Adult Range: 150,000–400,000/mcL
from the lungs to tissues and carry carbon dioxide back. Typical Adult Range: Men: 4.35–5.65 million/mcL; Women: 3.92–5.13 million/mcL.
(1.5–4.0 lakh/µL). Very low platelets increase easy bruising or bleeding risk.
5 Hematocrit (HCT or PCV): Measures the percentage of total blood volume composed of red blood cells. Adult reference intervals are typically 38.3%–48.6% for men and 35.5%–44.9% for women. Dehydration can transiently elevate hematocrit, while anemia reduces it.
Illustrative Sample CBC Report Excerpt (Fictional Patient — Educational Example Only) CBC Parameter
Hemoglobin (Hb) Red Blood Cell Count (RBC) Hematocrit (HCT) White Blood Cell Count (WBC) Platelets (PLT)
Sample Flag Value 11.1 L (Low) 4.10 Normal
Units
34.2 L (Low) 6,450 Normal
% cells/µL
245,000 Normal
platelets/µL 150,000 – 400,000 platelets/µL
Reading This Illustrative CBC Example
g/dL million/µL
Reference Range (Adult Female) 11.6 – 15.0 g/dL 3.92 – 5.13 million/µL
35.5% – 44.9% 4,000 – 11,000 cells/µL
In this fictional profile, normal WBC and Platelet counts reassure the clinician that immune defense and clotting are intact. Because Hemoglobin (11.1 g/dL) and Hematocrit (34.2%) are mildly below the reference range, a doctor typically reviews red cell size (MCV) and iron studies (ferritin) to check for mild iron deficiency.
Understanding Medical Test Reports | eDigiHealth Educational Guide
Page 3 of 8
SECTION 3 | METABOLIC, ORGAN & ENDOCRINE PANELS
Understanding Common Blood Test Results
Alongside a CBC, routine health checkups typically include chemistry and hormone panels that evaluate blood sugar control, cardiovascular lipids, liver and kidney function, and thyroid regulation. Test Panel & Clinical Purpose Standard Adult Reference Benchmarks Markers Blood Glucose Measures blood sugar after an 8–12 Normal: 70–99 mg/dL; Prediabetes: (Fasting) hour fast to screen for prediabetes 100–125 mg/dL; Diabetes: ≥126 mg/dL. and diabetes. HbA1c (Glycated Shows average blood glucose bound Normal: <5.7%; Prediabetes: 5.7%– Hb) to hemoglobin over the past 2–3 6.4%; Diabetes: ≥6.5%. months. Cholesterol (Lipid Measures Total Cholesterol, LDL Total: <200 mg/dL; LDL: <100 mg/dL; Panel) ("bad"), HDL ("good"), and HDL: >60 mg/dL optimal; Triglycerides: Triglycerides for heart health. <150 mg/dL. Liver Function Tests Checks liver enzymes (ALT, AST, ALT: 7–55 U/L; AST: 8–48 U/L; Bilirubin: ALP), protein production (Albumin), 0.1–1.2 mg/dL; Albumin: 3.5–5.0 g/dL. and Bilirubin clearance. Kidney Function Evaluates waste filtration via Serum Creatinine: 0.6–1.2 mg/dL; BUN: 7–20 Tests Creatinine, Blood Urea Nitrogen mg/dL; eGFR: ≥90 mL/min/1.73m2 (BUN), and eGFR. normal. Thyroid Tests (TSH, Measures pituitary ThyroidTSH: 0.27–4.2 uIU/mL; Free T4: 0.9–1.7 T3, T4) Stimulating Hormone (TSH) and ng/dL; Free T3: 2.3–4.1 pg/mL. active hormones Free T4 and Free T3.
Figure 3.1: Illustrative fictional patient report comparing normal thyroid, kidney, and liver markers with mildly elevated fasting glucose and LDL cholesterol.
How TSH, T4, and T3 Work Together in Thyroid Reports
TSH acts like a thermostat signal from the brain's pituitary gland. When thyroid hormone output (T4 and T3) drops too low, TSH rises to stimulate the gland—so a high TSH with low Free T4 points to an underactive thyroid (hypothyroidism), while a low TSH with high Free T4/T3 indicates an overactive thyroid (hyperthyroidism).
Understanding Medical Test Reports | eDigiHealth Educational Guide
Page 4 of 8
SECTION 4 | INTERPRETING FLAGS & STATISTICAL INTERVALS
How to Read High and Low Values
Seeing an "H" (High) or "L" (Low) flag next to a laboratory value can feel alarming when reading a report at home. Learning how clinical laboratories establish reference intervals helps you distinguish routine statistical variation from changes that need medical follow-up.
What High and Low Values Generally Indicate
An "H" or "L" flag simply indicates that a measured value sits outside the laboratory's statistical reference interval. Direction matters depending on the biomarker: for LDL cholesterol or HbA1c, lower numbers within range are desirable, whereas for HDL cholesterol or eGFR kidney filtration, higher values reflect stronger protective function.
Figure 4.1: Standard reference intervals capture the central 95% of a healthy reference group, meaning 5% of healthy individuals naturally fall in the lower 2.5% (L) or upper 2.5% (H) tails.
Why One Abnormal Result Does Not Confirm a Disease Because laboratories define the standard reference interval as the middle 95% of healthy people, roughly 1 in 20 test results (5%) in a healthy person will fall slightly outside the reference range by chance alone. Everyday biological factors also cause temporary shifts: Hydration, Exercise & Diet
Strenuous workouts 24 hours before a blood draw can transiently raise AST, ALT, and creatinine. Mild morning dehydration can slightly concentrate hemoglobin, albumin, and BUN.
Circadian Rhythm & Medications
Hormones like TSH and cortisol, as well as serum iron, naturally fluctuate between morning and afternoon. Common over-the-counter pain relievers or biotin supplements can also alter laboratory assays.
The Importance of Consulting Your Doctor A single flagged number almost never confirms a medical diagnosis on its own. Physicians evaluate the degree of elevation, check whether companion markers corroborate the finding, review your physical examination, and order repeat testing when needed.
Understanding Medical Test Reports | eDigiHealth Educational Guide
Page 5 of 8
SECTION 5 | AVOIDING INTERPRETATION PITFALLS
Common Mistakes When Reading Medical Reports
When reviewing diagnostic results independently, patients and families often encounter five avoidable mistakes. Keeping these guidelines in mind protects you from unnecessary worry and misinterpretation. 1 Comparing Results Without Checking Units: Laboratories across different regions use either conventional units (such as mg/dL) or international SI units (such as mmol/L or µmol/L). A fasting glucose of 5.0 mmol/L is identical to 90 mg/dL—comparing raw numbers across different unit scales leads to false conclusions.
2 Ignoring the Printed Laboratory Reference Range: Different laboratories use different chemical reagents and analyzers. Always judge your result against the exact reference range printed on your report rather than a range copied from another clinic. 3 Self-Diagnosing from a Single Result: Searching online for a single borderline flag and selfprescribing supplements or medications can be harmful. For instance, taking high-dose iron for mild anemia without confirming ferritin levels can be unsafe if the anemia has another cause. 4 Ignoring Symptoms and Personal Medical History: Laboratory numbers are only one piece of clinical evidence. Persistent symptoms warrant medical evaluation even if initial screening bloodwork appears "Within Normal Limits," and personal cardiovascular risk changes target cholesterol goals. 5 Delaying Professional Medical Advice: Waiting months to discuss abnormal results out of anxiety—or assuming a mildly elevated marker can be ignored—delays preventive care. Promptly share your complete report with your healthcare provider.
Illustrative Unit Comparison Guide: Same Blood Sample, Different Unit Scales Blood Test Marker Conventional Unit Scale Fasting Blood Glucose 90 mg/dL (Ref: 70–99 Total Cholesterol Serum Creatinine Total Bilirubin
mg/dL) 185 mg/dL (Ref: <200 mg/dL) 1.0 mg/dL (Ref: 0.6–1.2 mg/dL) 0.8 mg/dL (Ref: 0.1–1.2 mg/dL)
International SI Unit Scale 5.0 mmol/L (Ref: 3.9–5.5 mmol/L) 4.78 mmol/L (Ref: <5.17 mmol/L) 88.4 µmol/L (Ref: 53–106 µmol/L) 13.7 µmol/L (Ref: 2–17 µmol/L)
Understanding Medical Test Reports | eDigiHealth Educational Guide
Interpretation Same Normal Same Normal Same Normal Same Normal
Page 6 of 8
SECTION 6 | DIGITAL HEALTH LITERACY & SUPPORT TOOLS
How AI Can Help Understand Medical Reports
Reviewing a multi-page diagnostic printout filled with unfamiliar abbreviations, decimals, and reference intervals can feel overwhelming. An educational AI medical report analyzer can help patients, families, and learners organize and understand laboratory information before their medical appointment. 1. Diagnostic Report
2. Plain-Language Guide
3. Structured Summary
4. Doctor Visit
CBC, Metabolic, Lipid, or
Translates medical terms,
Highlights flagged values &
Prepared patient &
Thyroid Laboratory PDF
units & reference intervals
organizes health questions
clinical guidance
Figure 6.1: How an educational AI medical report analyzer supports patient preparation ahead of a physician visit.
Key Ways an AI Medical Report Analyzer Helps Readers
Understand Complex Medical Terminology: Breaks down technical names such as Alanine
Aminotransferase (ALT), Glycated Hemoglobin (HbA1c), or Estimated Glomerular Filtration Rate (eGFR) into clear, everyday explanations. Summarize Diagnostic Report Information: Provides a structured overview of multi-page blood and urine panels so readers can quickly grasp what each section of their report evaluates. Identify Values That May Need Attention: Points out biomarkers that sit above or below the laboratory's printed reference range so you know which results to prioritize during your appointment. Organize Health Information: Groups related biomarkers by organ system (blood cells, blood sugar, lipids, liver, kidneys, thyroid) so results are easier to read and track over time. Prepare Questions for Healthcare Professionals: Generates practical, context-specific questions tailored to your report so you can have a focused, productive discussion with your doctor. For readers looking for structured educational support, eDigiHealth provides an accessible AI medical report analyzer that helps patients and families review complex lab terminology and prepare clear questions for their healthcare providers.
Important Medical Disclaimer: AI Does Not Replace a Doctor AI health tools are designed strictly for educational and informational support. An automated
analyzer cannot examine you physically, account for your complete clinical history, or provide a medical diagnosis. Always consult a qualified physician before making any healthcare or medication decisions.
Understanding Medical Test Reports | eDigiHealth Educational Guide
Page 7 of 8
SECTION 7 | SUMMARY, DOCTOR DISCUSSION GUIDE & USEFUL RESOURCE
Conclusion and Useful Resource
Understanding your medical test reports empowers you to approach your health with clarity rather than guesswork. By learning what core hematology, metabolic, organ, and thyroid markers measure—and appreciating why reference intervals, measurement units, and clinical context matter—you can partner more effectively with qualified healthcare professionals.
Practical Checklist: 6 Questions to Ask Your Doctor 1. Personal Context
2. High or Low Flags
3. Historical Trends
4. Medication & Diet Effects
5. Follow-Up Testing
6. Lifestyle & Care Plan
"What do these results mean in the context of my age, medical history, and current symptoms?" "How do these numbers compare with my previous blood test reports over the past year?" "Should we repeat any of these tests or order additional follow-up labs, and on what timeline?"
"Are any of the flagged values clinically significant, or are they minor statistical variations?" "Could my current medications, supplements, or hydration levels have influenced these markers?" "What nutrition, physical activity, or treatment steps do you recommend based on this report?"
Best Practices Before Your Next Laboratory Test
Confirm Fasting Instructions: Ask whether your ordered panel (especially blood glucose and lipid profiles) requires an 8–12 hour overnight fast with plain water only. Keep a Consistent Testing Routine: Whenever possible, use the same laboratory and similar morning collection times for serial tests so long-term trends stay comparable. Bring Complete Health Records: Share your full report—including reference ranges and units— alongside a list of current prescriptions and supplements at your appointment.
Useful Resource for Understanding Your Lab Results
Explore the AI Medical Report Analyzer: https://edigihealth.com/ai-medical-report-analyzer Brand citation: eDigiHealth — Digital Healthcare Platform.
Understanding Medical Test Reports | eDigiHealth Educational Guide
Page 8 of 8