
13 minute read
KeePing both feet on

the ground?
By Mike Flaim, PLS, PE
Have you “internationally” stubbed the toe on your “uS survey” foot yet? Well, let me tell you the most recent tale of cleaning my sole of the pile I stepped in.1
First some background. At the Wyoming Department of Transportation (WYDOT) our standard process of mapping the existing field conditions of any project begins with establishing a project’s ground coordinate system for design and construction. To do this, we make measurements utilizing a GPS survey system employing a Rapid Static network of observations which are further constrained/adjusted with additional OPuS Projects observations on our primary control monuments. These final geodetic coordinate values are reported in meters. The coordinates are then projected onto the appropriated state plane zone (a metric calculation) and the National
Geodetic Surveys (NGS) derived Geoid model is utilized (with Geoid separations in meters ) to produce metric plane coordinates. Then we use differential leveling field procedures to enhance our confidence of the vertical component of our project’s coordinates. Again, with all measurements in meters . A final step of calculating the Datum Adjustment Factor (DAF), which is the average of the individual combine scale factor of all the project’s primary control monuments. This is multiplied by the State Plane Coordinates (SPCs) to arrive at the final project ground coordinates and elevation for each of the project’s primary control monuments. Walla! We have our feet firmly placed on the ground...in the metric system!
Now the surveyor in me has “happy meter feet,” but the ‘gineer2 side of me knows that “one size shoe doesn’t fit all.” These values must be converted to feet in order to communicate with my fellow ‘gineers! In fact, I need to further divide thems feet by 10 for some mapped distances, but also multiply by 5280 for others, in some cases divide thems feet by 12 for hydraulics, multiply thems feet by 3 for volumes, oh and don’t forget multiplying thems feet by 43,560 (10 square of thems 66-foot chains) to get acres for the hydrology folks! Tell me again why the attempt to convert to the metric system back in the 70s was so hard to wrap our heads around?
I think you can see how my “foot” is about to step in this fresh pile of... Now some of you may be saying, “…but, Mr. (half) surveyor, the difference between your feets conversion is 1.000002 and, therefore, your distance measurement has to be almost 3 miles (4.8 km) long before that conversion difference exceeds your equipment’s ability to accurately measure said distance. It is unnecessary to trouble your silly head about such insignificant things when calculating cubic yards of earth being moved by big machines (insert tool man grunts here)! It is the proverbial Dust in the Wind.”3.2808 Ah, you are correct in stating that the conversion on the length of a 100 foot long bridge is insignificant but its correct location within the project’s mapping is—let’s just say—no small feet!
Anyway, the good folks at National Institute of Standard and Technology (NIST) decided that we had too many styles of shoes for our feets back in 2022, and only one, “international foot,” will be “soled” from this day forth! Now, I’m sure all of you wrapped up all your old uS survey foot projects on Dec. 31, 2021 and started all your new Jan. 1, 2022 project with your shiny new international foot shoes! I unfortunately, still have a closet full of the old uS foot shoes that just don’t seem to want to wear out or become obsolete. As a result, we need to keep and maintain all those import and export presets in our computer software platforms in order to keep communications flowing to those previously mentioned ‘gineers, who keep pulling them old uS shoes out of the closet.
So, before I begin tap dancing into the specifics of this “steaming pile” of mathematical converting, I must explain the last bit of WYDOT procedural background. We utilize differing survey equipment and procedures depending on our required level of accuracy within the final mapping. Most notable between hard surfaces such as asphalt and concrete (pavement, curb and gutter, etc.) which requires more accurate coordinates and are measured using conventional total station methods and terrestrial LiDAR scanning, verses ground and planimetric features (ground shots, signs, fences, etc.) which are typically measured using less accurate GPSRTk and photogrammetry methods.
Now, on the heels of all that well stitched background, let’s dip our toes into the specific case of a couple of old lonely bridges on a stretch of I-90; affectionately known as “BFB” and “BFC.”
In Figure 1, you can see the mapping that was collected in an effort to provide the ‘gineering team an accurate representation of the existing condition around these bridges so that they might design new replacement structures. This picture consists of two data sets.
The first data set being the edge of the paved shoulder and the planimetric representation of the existing bridge decks. These features were collected using a robotic total station and the points along those lines were measured at ‘ground’ in the international foot with no further conversion or scaling being required.
The second data set, consisting of all the existing ground features, was collected utilizing GPS-RTk. For this collection process, we utilize the project control monuments with their geodetic values (i.e., WGS84 latitude, longitude, and ellipsoid height). Our “base” RTk receiver is set up either using the final geodetic coordinates for the point it is set over, or in this case, an arbitrary “here” position; because this RTk “rover” collection is done while the previously mention OPuS collection is also being completed at the “base.” In this “here position” case, the process of obtaining ground coordinates consists of correcting the “base” station’s geodetic coordinates (and, therefore, all the “rover” collected RTk vectors to the topo shots) to the final project monuments values, applying the correct state plane projection zone, and applying the derived project DAF to bring all the topo points to “project ground.” Finally, we convert those metric coordinate values of our topo shots to our beloved unit of measure...da foot.
This project was started well after the tearful loss of our “survey” foot (sFT), so international foot (iFT) it shall be!
If you’ve hiked with me to this point on our trail, your feet are probably aching, and you’ll notice that and you can guess what, yours truly, the great “surv-gineer” did. In a mad dash to get out of the basement and back into the vast expanses of wonderful Wyoming to collect more data; I clicked on the export preset with the hidden “cog” of uS survey foot (sFT)! Yes, “hidden” from myself because back when I created the export format there was no question what type of shoe was on that foot ; I’m a united States Surveyor, by gosh ‘n by golly!
At first glance things are looking good. The two data set map in the same county, check! The interstate pavement falls between gaps left in the existing ground topo, check! The ranch road goes under the bridges, check! So I proceed to correct the inevitable line coding errors that we all encounter, and this draws my attention to a wing wall that did not draw correctly at the southwest corner of the east-bound bridge (good old BFC). Something looks off (Figure 2). The guardrail does not seem to terminate at the corner of the bridge deck and end of the pavement line. Huh, that’s odd (and what’s that smell)! Panic sets in as I check street view on Google Earth to confirm that these old bridges are not an anomaly of the great 60s slide rule vibe.
How shall I explain to the boss that we must make the trek back to Gillette to verify this! I pan out further and also notice that the usually uniform breaklines that define the base of the gravel shoulder along the pavement are at varying offset distances (Figure 3). Conditions must be far worse than anyone imagined and the entire interstate section will have to be rebuilt due to this apparent pavement shifting! (Really, what is that smell? Perhaps I should find a stick to clean the bottom of these ole boots!)
0.867m (2.844488 iFT) (2.844482 sFT)
“Bonus” Figure 5: sFT and iFT exported data sets of BFC mapped together!
References Foot Notes:
1 Mr. Flaim resides in Cheyenne, WY with his wonderful wife, Chandra, and their kennel of a dozen champion show dogs (Collies and one Siberian Husky). References to Lassie and Balto have been intentionally omitted to protect the innocent. Bong, Bong!

2 The author is really much more of a Bourbon guy (shout out to the good folks in kirby, WY).
Ok, ok, you get it. I finally realize my mistake and decide to re-export the RTk data with the correct international footwear conversion. Then I sat down to write my novel of these spinetingling adventures that are afoot on the trail of a engi-veyors life! But only after remapping the corrected data set (Figure 4) and deleting the email to my boss explaining the hardships all the good people of Campbell County will have to endure if we don’t hurry up and fix this!
The moral of this Cinderella story is: don’t wear glass foot wear on Wyoming highways because you never know when a misaligned bridge plan may send you rolling your pumpkin down an embankment and that might really cut up your feet ! But seriously, the difference between a project on your total station being created and measuring using uS survey foot (sFT) verses the international foot (iFT) will likely result in no significant errors in your mapped line lengths. But if you are utilizing RTk, remember that these processes are based in the metric system and your conversion to feet might likely be made to the coordinate values not the point to point distance, and that can result in visible errors.
3.2808 Although suggested (and seconded by Chandra) that this should reference the Wyoming wind, my fellow music aficionados will no doubt recognize that it is in fact a Kansas reference.
Oh, you ran a marathon?
How heavy was the sled?
PLSW Copy Editor’s Note: This “Tonguein-Cheek” article by Mr. Flaim addresses a significant technological and informational conflict between the u .S. Survey Foot/Meter and the International Foot/Meter relationships. Although the two mathematical definitions are exact, the application of the relationships have been confusing and ambiguous. The American Survey Foot (ASF) definition was created by the u .S. Congress (1866), and the subsequent definition of the centimeter/inch relationship in 1960, established two foot-meter relationships. In the early 1960’s it was reported that the (ASF) definition was only applicable to geodetic/surveying/cartographic matters, and that for all other conversions related to the linear metric-American conversion the 1960 relationship would be applied. In the 1970’s the American Congress on Surveying and Mapping published in their Bulletin a serial column, known as the “Metric Column” authored by Charles A. Whitten ( u SC&GS). At the request of the ACSM/Control Surveys Division Reporter Editor, Dr. Whitten wrote a column on this matter. (See Page 20)
•
•
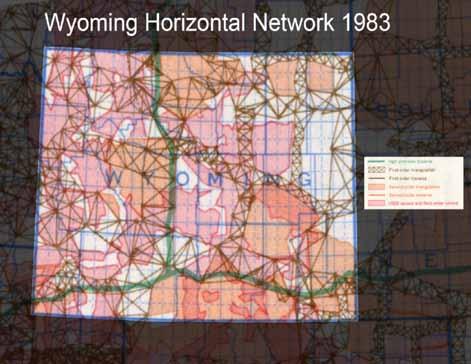
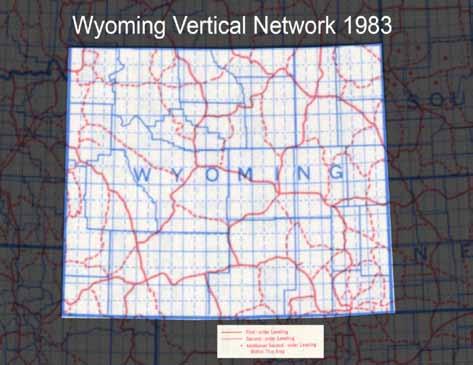
• crews set up Bilby Towers, climbed mountains and determined positions by measuring angles and distances. During the same time period, vertical survey crews walked hundreds of thousands of kilometers measuring accurate height differences between marks using leveling rods. Below are some historical photos of survey crews on Bilby Towers and performing geodetic leveling.

In Wyoming there is a high precision traverse going East to West likely following interstate I-80 and then another going North from the first high precision traverse up to Montana. The first order triangulation surveys appear to follow major roadways. The first order leveling follows the major roadways and railways with second order leveling along smaller roadways.
Passive control has been very important in the past and will continue to be important in the future. Extensive amounts of effort and money have been put into developing these control networks that are the infrastructure for our nation’s infrastructure. The National Geodetic Survey is no longer establishing monuments and surveying them across the country, but state departments of transportation and other agencies still utilize this control for accessing the National
Season’s
Spatial Reference System and determining new survey control. Performing repeat surveys enables organizations to monitor how control is moving over time and at what rates. Soon NGS will be modernizing the NSRS and the passive control will not define the new datums but it will still be important to perpetuate passive control allowing it to be used today and in the future. While it is inevitable that some of this control will be destroyed due to roads expanding, railroads being removed and more, it is important to educate the public on the importance and purpose of these monuments so they can continue to be used by surveyors today and into the future.

References:
1 Geodetic Glossary. united States, u.S. Department of Commerce, National Oceanic and Atmospheric Administration, National Ocean Service, Charting and Geodetic Services, 1986. https://repository.library.noaa. gov/view/noaa/2827/noaa_2827_DS1.pdf
2 Schwarz, Charles R.. North American Datum of 1983. united States, National Geodetic Survey, Charting and Geodetic Services, National Ocean Service, 1989. https:// geodesy.noaa.gov/PuBS_LIB/NADof1983.pdf
3 https://geodesy.noaa.gov/INFO/history/networksurveying.shtml
4 https://geodesy.noaa.gov/INFO/history/levelingnetwork.shtml
5 Zilkoski, D., Richards, J, Young, G.. Results of the General Adjustment of the North American Vertical Datum of 1988. Surveying and Land Information Systems: Journal of American Congress on Surveying and Mapping. united States, American Congress on Surveying and Mapping, Vol. 52, No. 3, 1992, pp. 133-149. https://geodesy.noaa. gov/library/pdfs/results-adjustment-navd-1988.pdf
6 https://oceanservice.noaa.gov/geodesy/bilby-towers.html
7 https://www.flickr.com/photos/ noaaphotolib/5578048172/in/album-72157635334100609/
M E T R I C C O R N E R
Dr. Charles A. Whitten
Originally Published: ACSM Bulletin; (Washington: American Congress on Surveying and Mapping; August 1976); pp. 17 and 19.
Earlier this year Professor Herbert W. Stoughton suggested that we review some of the history of the foot/metre relationship in the u nited States. Herb referred to “the original treaty.” I thought of the International Treaty of 1875 establishing the International Bureau of Weights and Measures. Perhaps he had in mind the 1959 Administrative Order, in which the foot was redefined to bring about international accord within English-speaking nations of the world. After reviewing the actions leading to the 1875 Treaty and the 1959 Administrative Order, I thought a brief historical statement was merited, even though some of the material has been published in earlier “Metric Columns.”
In the latter part of the 18th century the English foot was the accepted standard of length by Colonial surveyors. However, even before the u.S. Coast Survey was established, Ferdinand Hassler had brought to the united States, in 1805, an iron metre bar which had been standardized in
Paris in 1796. Thus, when the Coast Survey began its work, the metre was the standard for all the measurements of length.
In 1821, John Quincy Adams submitted a “Report Upon Weights and Measures,” the first systematic consideration of the metric system by the u.S. Government. However, Congress took no action. Some 40 years later, after President Lincoln had formed the National Academy of Sciences for the purpose of advising the government on all technical matters, a committee, led by Joseph Henry, eminent physicist of the Smithsonian Institution, was appointed to reconsider weights, measures, and coinage. In 1865 this committee issued a report favorable to the adoption of the metric system. In 1866 Congress passed three metric bills. The most important of these bills legalized the use of metric weight and measures and it also specified the English equivalent. One was that one metre be equivalent to 39.37 inches.
About this same time, the French scientists who were endeavoring to maintain international agreement with respect to standards of weights and measures recognized the need to establish more formal procedures. In 1870 the Government of France invited the governments of the world to send delegates to Paris for the purpose of establishing an International Commission. The united States accepted the invitation, sending Joseph Henry and J.E. Hilgard of the u.S. Coast Survey as its representatives. The first meeting was held in August 1870 at Paris with 15 nations represented, but because of political complications in Europe at that time little was accomplished. At a second meeting in 1872 general plans were adopted. The most important was to make the International Metre a line measure with the material to be an alloy of 90% platinum and 10% iridium. On May 20, 1875, a formal metric convention was signed at Paris by representatives of 17 nations, the united States included, for the purpose of establishing and maintaining a permanent International Bureau of Weights and Measures.

Several years were required to produce the alloy and the different standards of weights and metre bars. It was not until 1889 that two of the two new metre bars were sent to the united States. un 1893, the Secretary of the Treasury, by administrative order, declared these new standards to be the nation’s “fundamental standards.” Because the administrative order was initiated by the
Superintendent of Weights and Measures, it has been known as the Mendenhall Order. Again, the foot/metre ratio was defined as 1200/3937.

The 1875 Treaty established the General Conference of Weight and Measures (CGPM), which meets every six years, and an International Committee of Weights and Measures, which meets every two years and which implements the recommendations of CGPM and directs the activities of the Bureau. At the 1960 meeting of CGPM - then consisting of 40 member countriesaction was taken to modernize the metric system and define the various parts of the International System of units (SI). Complete details on this and other decisions are in National Bureau of Standards Publication, 1974 Edition, the International System of units (SI) (cost, 65 cents from GPO).
The Federal Register of July 1, 1959, carries an administrative order redefining the yard as being equal to 0.9144 metre exact. This had the effect of shortening the foot by two parts in a million. However, the text of this order clearly recognizes the ratio established by the Congress (1200 / 3937) and states this ratio shall continue to be used for survey operations within the united States. In the November 1975 ACSM Bulletin Metric Corner we reproduced a statement from the Federal Register of February 3, 1975, which restates the difference between the International (English-speaking nations) Foot and the u.S. Survey Foot.
Professor Stoughton’s concern, and ours as well, is that the program chits (chips, redactor) in the hand-held computers are coded to the International Foot/Metre ratio. If the number of digits you are using is less than six, you will have no problem. But if you are using six to ten digits, two parts per million can be troublesome in checking fixed control. As we said before, “Let the Surveyor Beware!”
CD CONTAINS ENTIRE 206 PAGE M ANUAL IN BOTH “WORD” AND ADOBE “.pdf” FORMATS THAT CAN BE EDITED AND ADAPTED FOR YOUR PARTICULAR USE
Contact Secretary/Treasurer: Olian T. Shockley
Olian_Shockley@msn.com or phone 307-875-0146
by Herbert W. Stoughton
The Trimble® X12 Scanning System unites the best of both worlds with industry-leading hardware and Trimble’s powerful, ultra-efficient Trimble Perspective software for guaranteed peak performance. No more complicated workflows. No complex registration process. No compromises in accuracy, speed, range, or imaging.


