12 minute read
Advances in seismic imaging of quick clays in Sweden

Tatiana Pertuz1*, Myrto Papadopoulou1 and Alireza Malehmir1 present a 2D seismic profile to demonstrate that seismic methods have great potential in mapping and characterising quickclay landslide settings.
Abstract
Advertisement
Quick clays are special types of soils that can liquefy under excess pore-water pressure with relatively low intrinsic stresses, resulting in landslides. In an area prone to quick-clay landslides in Sweden, various geophysical methods have been performed to map the subsurface. However, due to the high conductivity of the near-surface materials, seismic methods have shown greater potential than other geophysical methods. To exemplify this, a 2D seismic profile is presented with a 1 m shot and receiver spacing, having the highest resolution data so far acquired at the site. A processing workflow is followed to obtain P- and S- wave sections and their velocity models. Three main reflections identified early from raw shot gathers, are imaged in the final seismic sections. Borehole logging data are used to correlate the deepest reflection with the bedrock, overlayed by two coarse-grained layers. Our findings show the site is characterised by extremely slow S-wave velocities, between 60-100 m/s, that are indicative of high-water content along with the presence of quick-clay materials suggesting that the site requires special attention for future risk mitigation of landslides. 1 Uppsala University
* Corresponding author, E-mail: tatiana.pertuz@geo.uu.se
DOI: 10.3997/1365-2397.fb2023064
Introduction
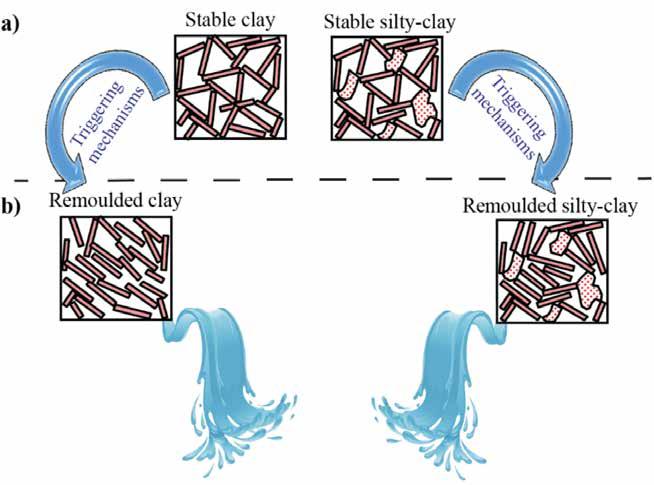
Quick clay is a specific type of clay, which has a structure that collapses when its shear strength is overloaded, producing liquefaction. Quick clays are principally made of non-swelling clay minerals, such as kaolinite and illite (Rankka et al., 2004). The type of clay mineral affects the particle collision, which controls the flocculation level. Sedimentologically, quick clays have structures resembling a ‘house of cards’, with angular grain contacts, producing a high void ratio and, hence, higher capacity to contain water (Figure 1a). Alienation of clay particles is formed when disturbed, leading to liquefaction at its natural water content (Figure 1b).
The quickness property of a quick clay is described by a property called sensitivity, which is determined by laboratory tests. The sensitivity term is given by the ratio of undisturbed and remoulded shear strength of soil. It is impacted by different external factors affecting sensitivity, such as, sea water salt leaching, ion composition of pore water, PH level, and dispersing substances. However, the collapse of a clay occurs only under the influence of a trigger mechanisms, which can be of natural (e.g., excess rains or seismicity) or handmade sources (e.g., excavations).
Quick clays formed during the last deglaciation and early postglacial period, when clay sediments were transported through the flow of ice melt water and deposited along the sea shore in marine to brackish environments. Clayey materials were accumulated in these salty environments, which made the sediments form unstable structures. As a result of the ice melting, the land rose isostatically, exposing the clays above the sea level (Torrance, 2012). Over the years, infiltration of fresh water in the ground leached out minerals changing the salinity in the pores. As a consequence, strength properties in clay structure changed, developing the quickness of the material.
Quick clay presence occurs mostly in northern countries, in Canada, Norway, Sweden and Russia. In Sweden, the Göta River is the main transportation media of sediments in the Scandinavian basin, flowing from Vänern lake towards the western coast. Morphologically, the region gently dips towards the west and is a structural boundary of gneiss in Sweden while regions near to the Göta River are glacial and post-glacial clays (Lundberg et al.,
2014). As a result of local landslides along the Göta River, the area is the subject of numerous geotechnical studies because of the presence of quick clays and numerous landslides scars.
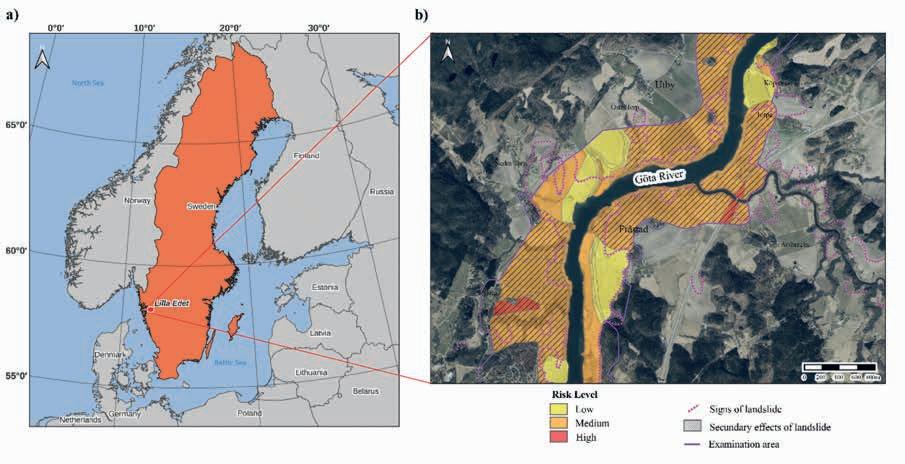
The focus of the current study is the area of Lilla Edet, located in the Göta älv Zone in the southwest of Sweden (Figure 2). Several geophysical campaigns were carried out during 2011 and 2013 in this location to investigate the presence of quick clays (Malehmir et al., 2013a; Lundberg et al., 2014). As a follow-up study from campaigns in 2011 and 2013 (Malehmir et al., 2013a; Lundberg et al., 2014), an ultra-high-resolution seismic data acquisition was conducted in 2020 to retrieve a high-quality shear-wave reflection section from the so-called vertical-component data. This was triggered by revisiting some of the earlier data showing some shear-wave reflection energy was present in the vertical component data. However, due to the extremely slow shear-wave velocities, the shear-wave reflections were judged to be strongly aliased in the vertical component data (Malehmir 2019, 2021). Here, we present some of the results and how the new data provide improved imaging capability in the area for quick-clay studies.
Historical background
Apart from the area of Lilla Edet, studied here, several examples of major quick-clay landslides with disastrous societal and economic impacts have occurred in different parts of Sweden. This highlights the importance of understanding the geological nature of quick clays through geophysical and other geotechnical methods. The large-scale landslide that occurred in Tuve, close to the city of Gothenburg in 1977, damaged main roads and houses within an affected area of 270,000 m2. In 2006 a landslide was reported in a main road in Munkedal, where about 500 m of soil ended up in a small stream down a slope beside the collapsed road. It resulted in a 200m-wide and 2m-deep crater. In the area of Lilla Edet, a slide of soil occurred at the eastern shore of the Göta River in 1957. A shoreline of 2 km was moved into the river causing a decrement of the river width and destroying a nearby sulphite paper mill (Larsson, 2021), essentially an environmental disaster in the river.
Why reflection seismic methods?
The site of interest is characterised by about a 20m-thick layer of clay-dominated sediments interbedded by coarse-grained layers and an underlying crystalline bedrock with a undulating surface. A variety of different geophysical techniques have been tested at the site (Malehmir et al., 2013a; Lundberg et al., 2014; in southwest of Sweden (from the Swedish Geotechnical Institute, SGI). (b) Aerial photo of the region where the seismic profile is positioned. Regions marked along the river are characterised according to the risk level because of landslides (Low-yellow, medium-orange, and high-red). Scars of landslides have been mapped, which are mostly located next to the river (purple lines).
Salas-Romero et al., 2019), to gain information on the subsurface structure, bedrock topography, the nature of the sediments, detect accumulations of clays and increase the current understanding of the quick-clay formation and triggering mechanisms. The applied methods, which are typically used for landslide characterisations, did not all provide equally good results. For instance, due to the presence of marine clays, which are conductive and inhibit deep current penetration (Malehmir et al., 2013a), ERT and controlled-source and radio-magnetotellurics did not achieve adequate investigation depths while gravity measurements could delineate bedrock morphology although with a limited resolution and great level of ambiguity.
On the other hand, it was shown that in this site seismic methods are favourable and could provide adequate investigation depth with great resolution (Malehmir et al., 2013a; Lundberg et al., 2014; Salas-Romero et al., 2019; Pertuz and Malehmir, 2023). The shallow sediments present seismic P-wave velocities (Vp) to the order of 1400-1500 m/s while the crystalline bedrock, expected at a depth of approximately 50 m, is characterised by a Vp of 5000-6000 m/s (Figure 3a), providing adequate impendence contrast for bedrock imaging. On the other hand, the S-wave velocities (Vs) of the sediments are much slower (60100 m/s) due to the low shear strength of the sediments and high level of water content. Due to this high Vp/Vs ratio the P-wave energy generated by a vertical seismic source is not well radiated and a large proportion of S-wave energy is, instead, generated (Papadopoulou et al., 2022) (see sketch of the radiation pattern plots, for various Vp/Vs values in Figure 3b and c).
Figure 3 Vp/Vs ratio plotted after processing the seismic sections. Along the seismic profile, a high Vp/Vs ratio is observed, favouring the radiation of S-wavefield energy over the P-wavefield as sketched in the radiation pattern plots contrary to the northeast side of the sketch (left and right, respectively). Radiation pattern plots represent how P- and S-wavefield (green and orange regions, respectively) are propagated in a media with (b) high and (c) low Vp/Vs ratios.
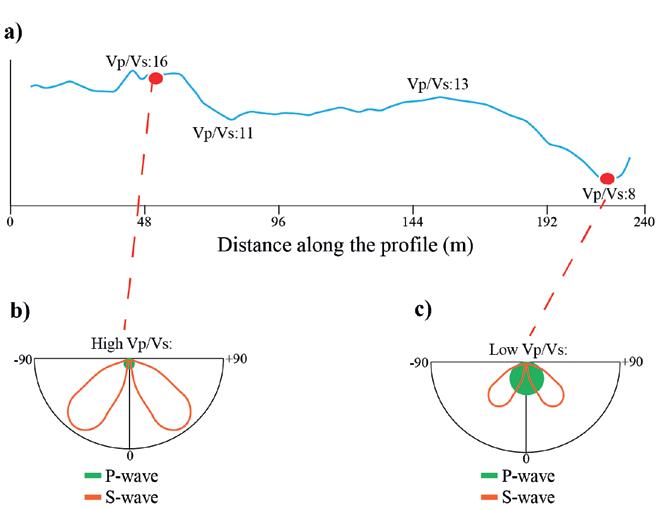
Figure 4 Seismic acquisition experiment in Lilla Edet. (a) Aerial photo of the acquisition line, located in between outcrops, and a landslide scar is exposed to the northeast of the seismic profile. (b) On the receiver side, wireless receivers were planted on the ground while the landstreamer was laid on the gravel road at 1 m receiver spacing. (c) A sledgehammer was used with a vertical-orientation hit over a flatmetallic plate at every receiver position. (d) At the early processing stage, raw shot gathers show strong reflections identified as S1, S2 and a deeper one at B both on P-wavefield (upper) and S-wavefield section (lower).
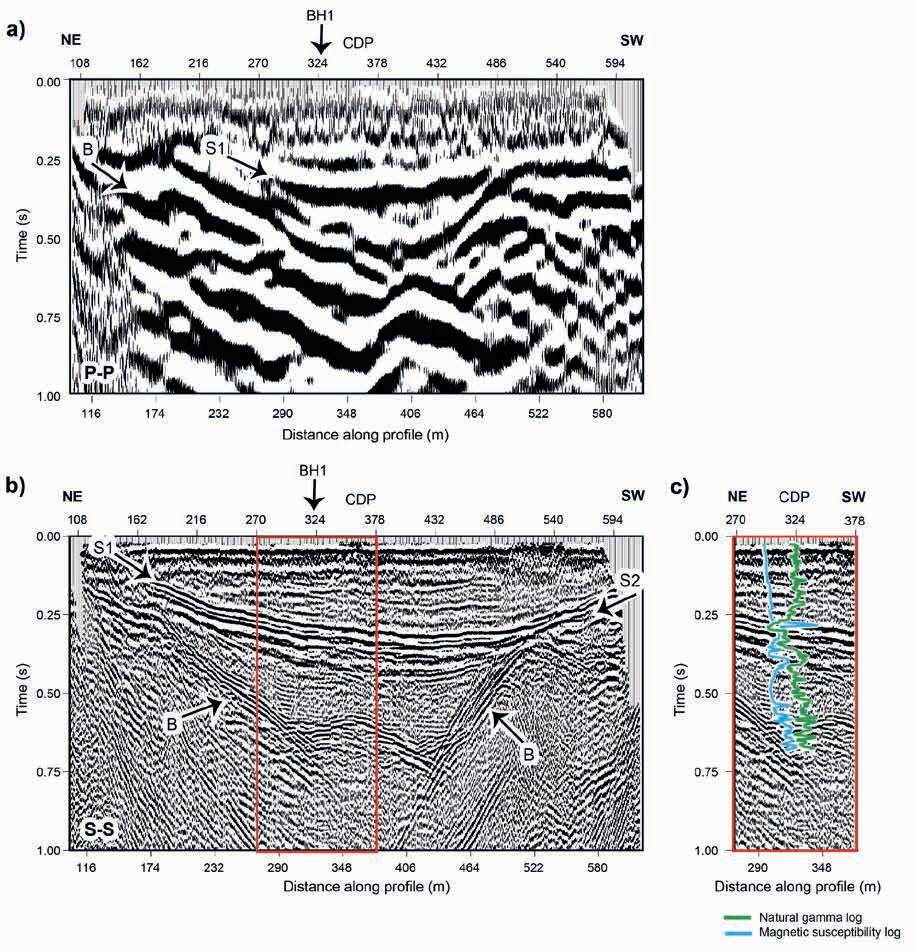
Figure 5 P- and S-wavefields processed seismic sections from Lilla Edet (Pertuz and Malehmir, 2023). (a) P-wavefield section could identify bedrock level and a shallower reflection labelled as S1. (b) S-wavefield section is characterised by higher resolution than the P-wavefield, which allows us to delineate shallower layers with details. Layers S1 and S2 onlap the undulating bedrock that are also correlated with borehole logging data such as natural gamma and magnetic susceptibility, shown zoomed in (c).
Seismic data
The new seismic data acquisition was performed in August 2020 on a straight gravel road, 300 m south of the Göta River (Figure 4a). As seismic receivers, 269 wireless recorders spaced at 1 m were combined with a landstreamer section of 120 sensors
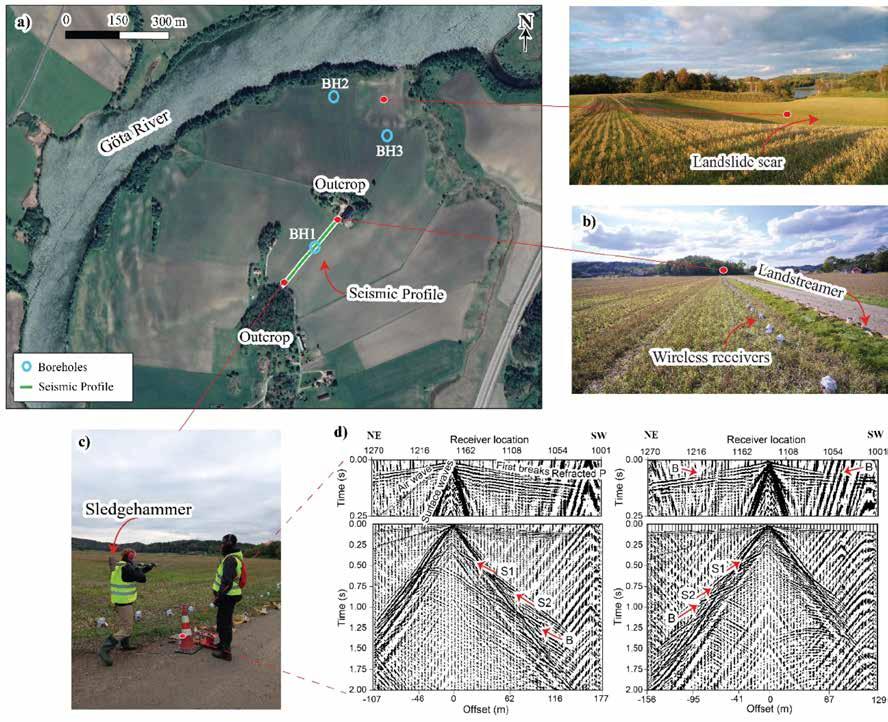
(MEMS) in a two-leg fixed geometry to cover the entire 240 m length of the profile. As shown in Figure 4b, the profile was positioned between bedrock outcrops towards the northeast and southwest of the profile (Figure 4b). As for the source, a 5 kg sledgehammer was used to impact three times a flat-metallic plate at every receiver position (Figure 4c). After completion of the survey, the repeated shot records were vertically stacked to improve signal-to-noise ratio. A 9C seismic survey was also acquired and processed (Pertuz and Malehmir, 2022a; Pertuz and Malehmir, 2022b) but here we will show only results of the vertical component data recorded with the wireless recorders.
Results
The seismic data show quality shot gathers for most of the shot points. Strong reflections, originated by a deep layer and two shallower ones, were identified in the raw shot gathers for S-wavefield and only one for P-wavefield. For instance, in Figure 4d we denote bedrock as B and two shallow reflections as S1 and S2. Since the shallow reflections have an apex at 0.40 s and 0.45 s (judged to be of S-wavefields), respectively, it can be understood that the thickness of the column between these two features is probably short. While the P-wavefield data can only identify bedrock, B is shown in top zoom of Figure 4d.
A conventional processing workflow (Pertuz and Malehmir, 2023) was followed to attenuate noise, create velocity models for P- and S-wavefields, and finally to obtain their corresponding sections from the same dataset. The results are shown in Figure 5 where we observe that, as opposed to the S-wavefield section, the reflections in the P-wavefield section are broader in wavelength, resulting in a lower resolution. As a consequence, the Pwavefield section can image only bedrock and a vague evidence for the shallowest reflection, S1 (Figure 5a). Meanwhile, the S- wavefield section holds smaller wavelength features leading to a much higher resolution, hence, adequate details to image both S1 and the underlying layer S2 (Figure 5b).
From the processing results, velocity models for P- and S- wavefields were determined showing high contrast in between them. As a characteristic of quick-clay environments P-wave velocities range from 1000 m/s to 1400 m/s, while S-wave velocities are extremely slow on the order of 60-120 m/s. which is also confirmed by first-break traveltime tomography (see Pertuz and Malehmir, 2023). A notable feature of the P-wavefield data, however, is the P-wave velocities retrieved from first break traveltime tomography showing an improved resolution of mapping bedrock surface as compared to the S-wavefield data. S-wavefield data fail to provide deep shear-wave velocities because the extremely slow shear-wave velocity requires much higher offsets than the 240 m used in this study.
Figure 6 Sketch of the geological section An undulating and complex bedrock is exhibited underlying clay and silt deposits. Coarse-grained layers are found interbedded in the clay deposits, which can facilitate the flow of water into different layers like a conduit. Logs from the borehole, BH1, located in the middle of the profile allow correlation of various features observed in the seismic sections (see Pertuz and Malehmir, 2023) and support this interpretation.
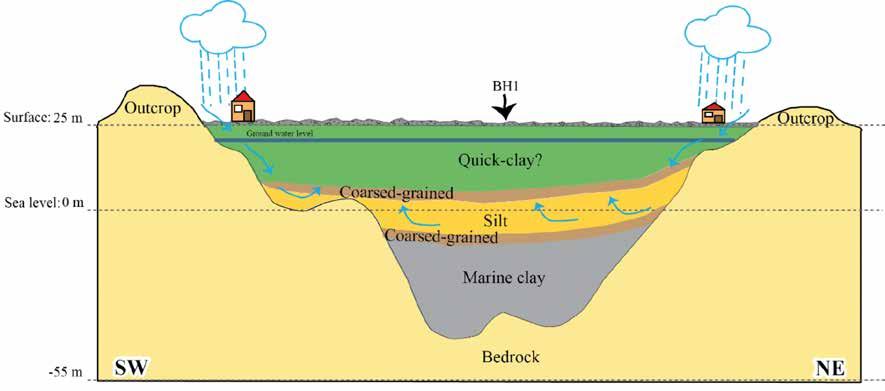
The seismic sections reveal an undulating bedrock, which is exposed on both sides of the seismic profile, also observed during the data acquisition (see sketch in Figure 6). The two interbedded shallow layers, S1 and S2, were correlated with borehole logs and geotechnical data from the site. A silty-sandy patchy-type layer was identified to represent reflections S1 and S2, containing a series of diffractions along them in the unmigrated stacked section of the S-wavefield (Pertuz and Malehmir, 2023, for details). The Vp/Vs ratio is calculated along the seismic section using P- and S-wavefield reflection traveltimes for each section. Results indicate low Vp/Vs ratio (e.g., a minimum of 8) in a short section of the profile towards the northeast but high Vp/Vs (e.g., between 13 and 16) along the profile, which imply high-water content, hence possibilities of liquefaction.
Conclusions
Several geophysical methods were used in Lilla Edet to study the presence of quick clays and each method presented different limitations. Techniques such as geoelectric, and potential field methods encountered difficulties providing high-resolution information about the clays because of their high conductivity and their inherent limitations. However, seismic methods, especially the S-wavefield reflections, presented far more detailed information on the structures and physical conditions of the sediments. P-wavefield seismic sections in quick-clays environments proved useful to locate the bedrock level and layering above it, but with low resolution; better when first breaks are used to retrieve velocities rather than the reflections. S-wavefield seismic section is, instead, more advantageous for this kind of geological setting and leads to higher resolution images. Besides, it is proved that vertical-orientation sources can produce strong S-wavefield reflections, adequate for quality S-wavefield seismic imaging. Combination of P- and S-wavefield data can additionally provide information on Vp/ Vs, useful for future geotechnical applications.
Based on the geophysical studies carried out in Lilla Edet, it is concluded that quick clays are present at the site. Coarsegrained layers are present within the clayey materials and this may facilitate their leaching, but also quick clay triggering mechanism during excessive rainy seasons.
Acknowledgments
We thank SGI (Swedish Geotechnical Institute) for their support of the new data acquisition and, as well as students from Uppsala University who took part in the fieldwork.
References
Larsson, A. [2021]. Landslides vs Archaeology: Case Studies of Site Loss and Emergency Fieldwork in Västra Götaland County, Sweden: Current Swedish Archaeology, 29(1), 183-205.
Larsson, R. and Jansson, M. [1982]. The landslide at Tuve: Swedish geotechnical institute (SGI), Report No. 18, 1-118.
Lundberg, E., Malehmir, A., Juhlin, C., Bastani, M. and Andersson, M. [2014]. High-resolution 3D reflection seismic investigation over a quickclay landslide scari in southwest Sweden: Geophysics, 79(2), 1942-2156.
Malehmir, A. [2019]. Recording Longer for Higher-Resolution Near-Surface Imaging – Shear-Wave Reflections from Vertical Sources and Receivers: 25th European Meeting of Environmental and Engineering Geophysics, 1-5.
Malehmir, A. [2021]. The forgotten shear-wave reflections in the compressional-wave surveys: NSG2021 27th European Meeting of Environmental and Engineering Geophysics, 1-5.
Malehmir, A., Bastani, M., Krawczyk, C.M., Gurk, M., Ismail, N., Polom, U. and Persson, L. [2013a]. Geophysical assessment and geotechnical investigation of quick-clay landslides – a Swedish case study: Near Surface Geophysics, 11, 341-350.
Malehmir, A., Saleem, M.U. and Bastani, M. [2013b]. High-resolution reflection seismic investigations of quick-clay an associated formation at a landslide scar in southwest Sweden: Journal of Applied Geophysics, 92, 84-102.
Papadopoulou, M., Malehmir, A., Berglund, J. and Brodic, B. [2022] Quick-Clay Site Characterization Through First-Break Tomography and Surface-Wave Analysis, A Study from Southwest of Sweden: 83rd EAGE Annual Conference & Exhibition, 1-5.
Pertuz, T. and Malehmir, A. [2022a]. 9C data acquisition for near-surface imaging in a quick-clay landslide-prone site in SW Sweden: Second International Meeting for Applied Geoscience & Energy, 2128-2132.
Pertuz, T. and Malehmir, A. [2022b]. Potential of a Multi-Component Seismic survey at a Quick-Clay Landslide-Prone Area: NGSG2022 285h European Meeting of Environmental and Engineering Geophysics, 1-5.

Pertuz, T. and Malehmir, A. [2023]. Ultra-high-resolution shear-wave reflection imaging of vertical-component data in a quick-clay prone to landslide area in southwest Sweden: Geophysics, 83, B121-B133.
Rankka, K., Andersson-Skold, Y., Hulten, C., Larsson, R., Leroux, V. and Dahlin, T. [2004]. Quick clay in Sweden: Swedish Geotechnical Institute, Report 65, 1-137.
Salas-Romero, S., Malehmir, A., Snowball, I. and Dessirier, B. [2019]. Subsurface characterization of a quick-clay vulnerable area using near-surface geophysics and hydrological modelling: Solid Earth, 10(5), 1685-1705.
Torrance, J.K. [2012]. Landslides in quick clay, Chapter 8, in: Landslides: Types, Mechanisms and Modelling, Cambridge University Press, 83-94.
Tryggvason, A. and Bergman, B. [2006]. A traveltime reciprocity discrepancy in the Podvin & Lecomte time3d finite difference algorithm: Geophysical Journal International, 165, 432-435.