Focus On: Arlington County Housing Market
November 2013
Units Sold
Active Inventory
Median Sale Price
Days On Market
176
439
$498,500
34
400
700
600,000
70
350
600
550,000
60
500,000
50
450,000
40
400,000
30
300
350,000
20
200
300,000
300
500
250 400
200 150
100
N-11 M-12 J-12
N-11 M-12 J-12 N-12 M-13 J-13 N-13
Down -27% Vs. Year Ago
N-12 M-13 J-13
N-13
10
N-11 M-12 J-12 N-12 M-13 J-13 N-13
Up 16% Vs. Year Ago
N-11 M-12 J-12 N-12 M-13 J-13 N-13
Down -2% Vs. Year Ago
Up 3% Vs. Year Ago
Units Sold* 180
Sold Detached
Sold Attached
Sold Condo/ Coop
160
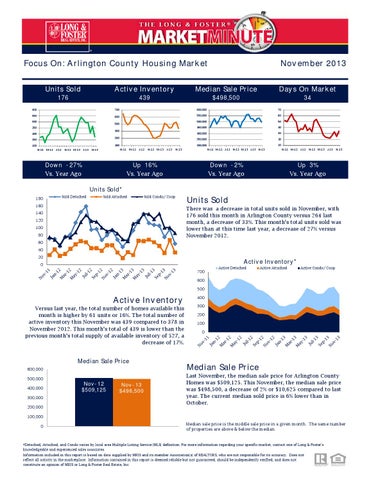
Units Sold There was a decrease in total units sold in November, with 176 sold this month in Arlington County versus 264 last month, a decrease of 33%. This month's total units sold was lower than at this time last year, a decrease of 27% versus November 2012.
140 120 100 80 60 40 20
Active Inventory*
0 700
Active Detached
Active Attached
Active Condo/ Coop
600
500
Active Inventory Versus last year, the total number of homes available this month is higher by 61 units or 16%. The total number of active inventory this November was 439 compared to 378 in November 2012. This month's total of 439 is lower than the previous month's total supply of available inventory of 527, a decrease of 17%.
Median Sale Price 600,000 500,000 400,000 300,000 200,000
Nov-12 $509,125
Nov-13 $498,500
400
300 200
100 0
Median Sale Price Last November, the median sale price for Arlington County Homes was $509,125. This November, the median sale price was $498,500, a decrease of 2% or $10,625 compared to last year. The current median sold price is 6% lower than in October.
100,000 0
Median sale price is the middle sale price in a given month. The same number of properties are above & below the median.
*Detached, Attached, and Condo varies by local area Multiple Listing Service (MLS) definition. For more information regarding your specific market, contact one of Long & Foster’s knowledgeable and experienced sales associates. Information included in this report is based on data supplied by MRIS and its member Association(s) of REALTORS, who are not responsible for its accuracy. Does not reflect all activity in the marketplace. Information contained in this report is deemed reliable but not guaranteed, should be independently verified, and does not constitute an opinion of MRIS or Long & Foster Real Estate, Inc.
Focus On: Arlington County Housing Market
November 2013
New Listings
Current Contracts
Sold Vs. List Price
Months of Supply
215
215
98.4%
2.5
600
350
500
300
400
101% 100% 100% 99% 99% 98% 98% 97% 97% 96%
250
300 200
200
150
100
100
0
N-11 M-12 J-12
N-11 M-12 J-12 N-12 M-13 J-13 N-13
Up 19% Vs. Year Ago
N-12 M-13 J-13
N-13
5 4 4 3 3 2 2 1 1 0
N-11 M-12 J-12 N-12 M-13 J-13 N-13
Up 26% Vs. Year Ago
No Change Vs. Year Ago
N-11 M-12 J-12 N-12 M-13 J-13 N-13
Up 60% Vs. Year Ago
Months Of Supply 3.9
Months of Supply In November, there was 2.5 months of supply available in Arlington County, compared to 1.6 in November 2012. That is an increase of 60% versus a year ago.
2.5
2.5 2.0 1.5
1.5
1.5
1.5
1.4
1.4
2.2
2.0
1.7
1.6
2.3
2.0
2.1
1.9
1.7
1.9
3.0 2.4
2.9
3.7 3.0
4.5 4 3.5 3 2.5 2 1.5 1 0.5 0
Months of supply is calculated by dividing current inventory by current sales. It indicates how many months would be needed to sell all of the inventory available at the current rate of demand.
New Listings & Current Contracts 600
New Listings & Current Contracts This month there were 215 homes newly listed for sale in Arlington County compared to 181 in November 2012, an increase of 19%. There were 215 current contracts pending sale this November compared to 170 a year ago. The number of current contracts is 26% higher than last November.
Number of New Listings
Total Pending
500
400 300
200 100 0
Sale Price/ List Price & DOM 101% 100% 100% 99% 99% 98% 98% 97% 97% 96%
Avg Sale / Avg List
Average DOM
70 60
50 40 30 20 10
0
Sale Price to List Price Ratio In November, the average sale price in Arlington County was 98.4% of the average list price, which is similar compared to a year ago.
Days On Market This month, the average number of days on market was 34, higher than the average last year, which was 33, an increase of 3%.
*Detached, Attached, and Condo varies by local area Multiple Listing Service (MLS) definition. For more information regarding your specific market, contact one of Long & Foster’s knowledgeable and experienced sales associates. Information included in this report is based on data supplied by MRIS and its member Association(s) of REALTORS, who are not responsible for its accuracy. Does not reflect all activity in the marketplace. Information contained in this report is deemed reliable but not guaranteed, should be independently verified, and does not constitute an opinion of MRIS or Long & Foster Real Estate, Inc.