3 minute read
Amplified uncertainty for dry bulk trade


Until almost the end of last month a broadly positive outlook for commodity import demand around the world seemed a realistic view. A sizeable increase in global seaborne dry bulk trade was a likely outcome. But events since then have raised questions about this conclusion.
Economic activity in many countries has been expected to continue recovering in 2022 from the adverse consequences of the coronavirus pandemic, albeit at a moderating pace compared with last year’s initial rebound. Import demand for dry bulks related to industrial output and construction could benefit. These assumptions are now surrounded by heightened uncertainty, resulting from the conflict between two substantial participants in global sea trade and the wider repercussions.
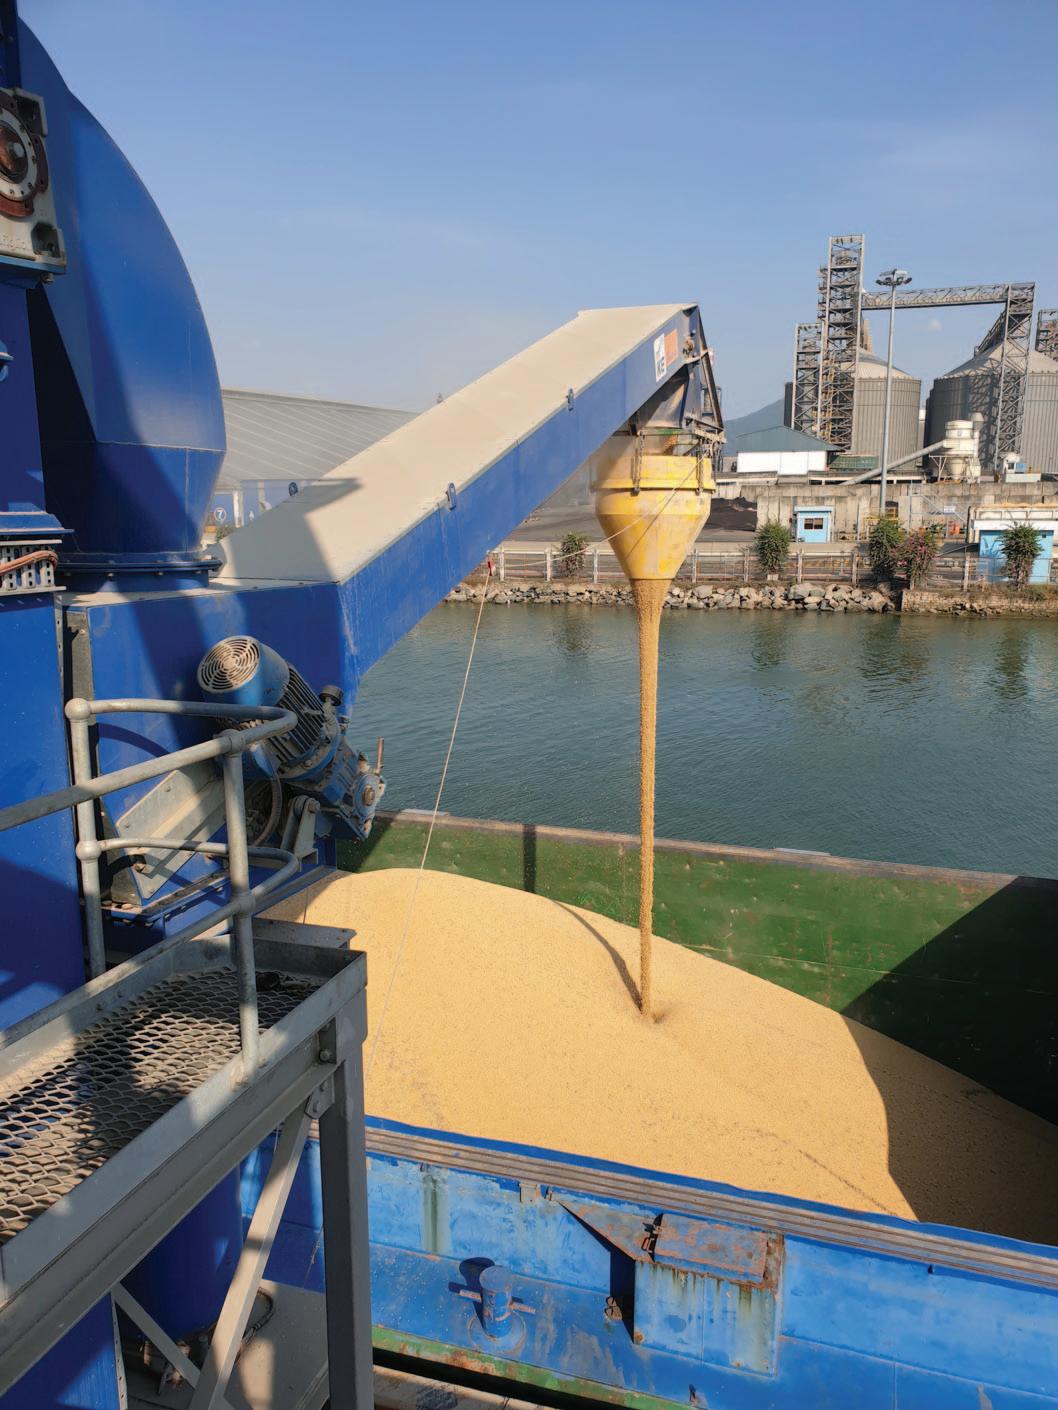
GRAIN & SOYA
A focus on grain movements has intensified. The latest (mid February) International Grains Council estimates show world trade in wheat plus corn and other coarse grains decreasing only marginally in crop year 2021/22 ending June. After attaining a record high volume of 427mt (million tonnes) in the previous twelve months, the total was expected to be just a half percent lower at 424mt in the current period.
Reduced grain imports into China were expected to be offset by increased imports into the Middle East area, accompanied by smaller changes elsewhere. However, greater uncertainty about supplies is now evident. As shown in table 1, the Black Sea region is a major source of exports, contributing roughly a quarter of the world total in the past twelve months. It is unclear whether the forecast of 108.5mt in 2021/22 remains valid.
IRON ORE
Calculations for trade in the main steelmaking raw materials— iron ore and coking coal — indicate that both increased during 2021. Growth in iron ore appears to have been marginal, reflecting China’s decreased purchases, more than offset by expansion among other countries. Current year prospects have been pointing to the possibility of further growth.
Some ideas suggest that imports into China will be flat or perhaps reduced in 2022. Imports into all other countries together, comprising about a quarter of the world total, increased by 15% to over 400mt last year and tentative forecasts show another increase this year. The outcome depends on how global economic activity performs, amid the greater uncertainty which has emerged recently.
COAL
Support for both steam and coking coal consumption and import demand seems to be holding up after last year’s rebound. Additional steel output in numerous countries could benefit coking coal usage. Broadly rising energy demand, accompanying the receding adverse effects from the pandemic, could be advantageous for steam coal as well as other fuels.
Despite policies and pressures which are clearly disadvantageous for coal trade in the longer term, other influences may be more than offsetting in the immediate future. High prices, and possible shortages, of natural gas during 2022 may assist further growth in world seaborne steam coal trade which grew by almost 50mt or 5% to 963mt last year, according to Clarksons Research calculations. Several European countries potentially will need extra imported supplies of coal to assist in ensuring energy security during the next twelve months.
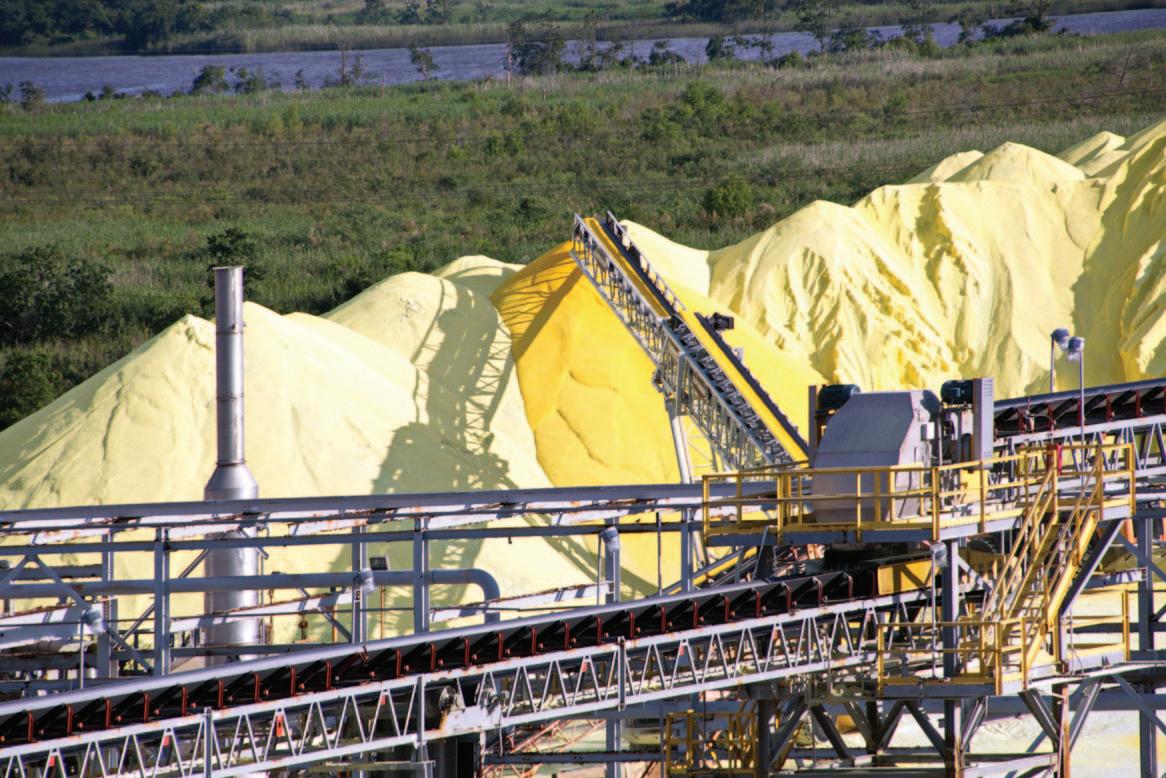
MINOR BULKS
Seaborne trade in the minor bulks segment saw an upturn last year when many commodities related to industrial activity experienced higher demand. Steel products and forest products, the largest components, revived strongly. The general positive trend may persist through 2022.
BULK CARRIER FLEET
During 2021 growth in the world fleet of bulk carriers almost matched the previous year’s expansion, at 3.6%, as shown in table 2. Reduced newbuilding deliveries were accompanied by lower scrapping. Prospects for 2022 suggest another decline in newbuildings delivered, while increased scrapping is likely, with a possible outcome of a sharply lower fleet growth rate.
TABLE 1: MAJOR GRAIN EXPORTING AREAS (MILLION TONNES)
North America South America Black Sea EU Australia 2016/17 122.0 51.8 88.3 34.6 31.9 Wheat and coarse grains, crop years ending June 2017/18 2018/19 2019/20
113.6 75.3 117.9 75.0 100.9 98.4
102.7 103.4 107.5
30.1 23.7 30.8 14.1 50.4 13.4
source: International Grains Council *forecast, as at 17 February 2022
2020/21 139.5 86.3 102.6 39.1 27.7 2021/22* 114.5 84.2 108.5 46.5 34.7
TABLE 2: WORLD BULK CARRIER FLEET (MILLION DEADWEIGHT TONNES)
Newbuilding deliveries Scrapping Losses Other adjustments/conversions Net change in fleet Fleet at end of year % growth from previous year
2016 47.3 29.4 0.2 –0.7 17.0 798.1
2017 38.5 14.8 0.3 0.0 23.4 821.5 2.9
2018 28.5 4.4 0.2 0.1 24.0 845.5 2.9
source: Clarksons Research (historical data) & BSA 2021 estimate *forecast
2019 41.6 7.8 0.1 –0.1 33.6 879.1 4.0
2020 48.9 15.3 0.5 0.0 33.1 912.2 3.8 2021* 38.0 5.2 0.1 0.1 32.8 945.0 3.6