1 minute read
Self-Awareness


Dr. Sudarshana Rana & Nisha Devi (Pg. 14799-14806)
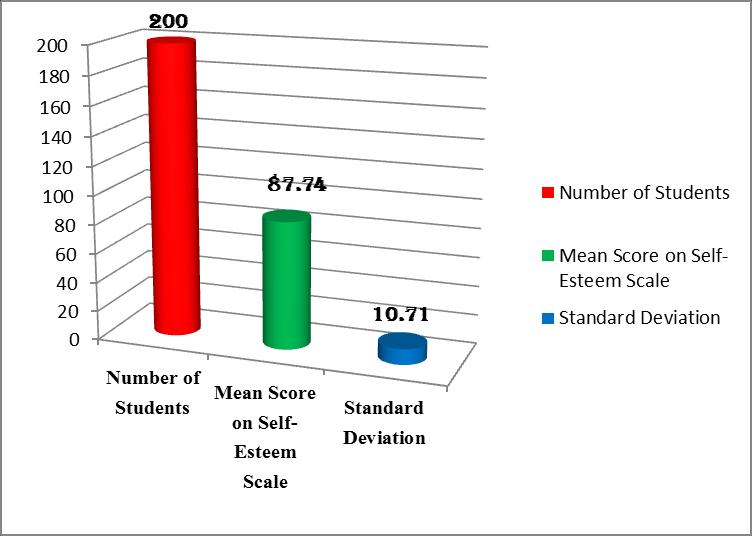
Figure-1 Mean and Standard deviation of total scores of undergraduate scheduled caste students on self-esteem
Advertisement
1.2 Comparison of the Self-Esteem of Scheduled Caste Students in relation to their Gender
Mean, standard deviation and t-test was employed to compare the self-esteem of undergraduate scheduled caste students in relation to their gender. The result and test of significance are shown in table-2
Table-2 Comparison of Male and Female undergraduate scheduled caste students in relation to Self-esteem
Gender Number Mean S.D t-value Significance
Male 200 90.35 10.78 3.00 Significant at Female 200 87.13 10.63 0.01 level
Table 2 shows that ‘t’ value ‘3.00’ is significant at 0.01 level of significance. It means that mean of male undergraduate scheduled caste students (90.35) is greater than the mean of female undergraduate scheduled caste students (87.13). From this, it may be inferred that the male undergraduate scheduled caste students have good self-esteem than that of female undergraduate scheduled caste students. Figure-2 shows the significant difference in selfesteem of male and female undergraduate scheduled caste students.
Copyright © 2021, Scholarly Research Journal for Interdisciplinary Studies
