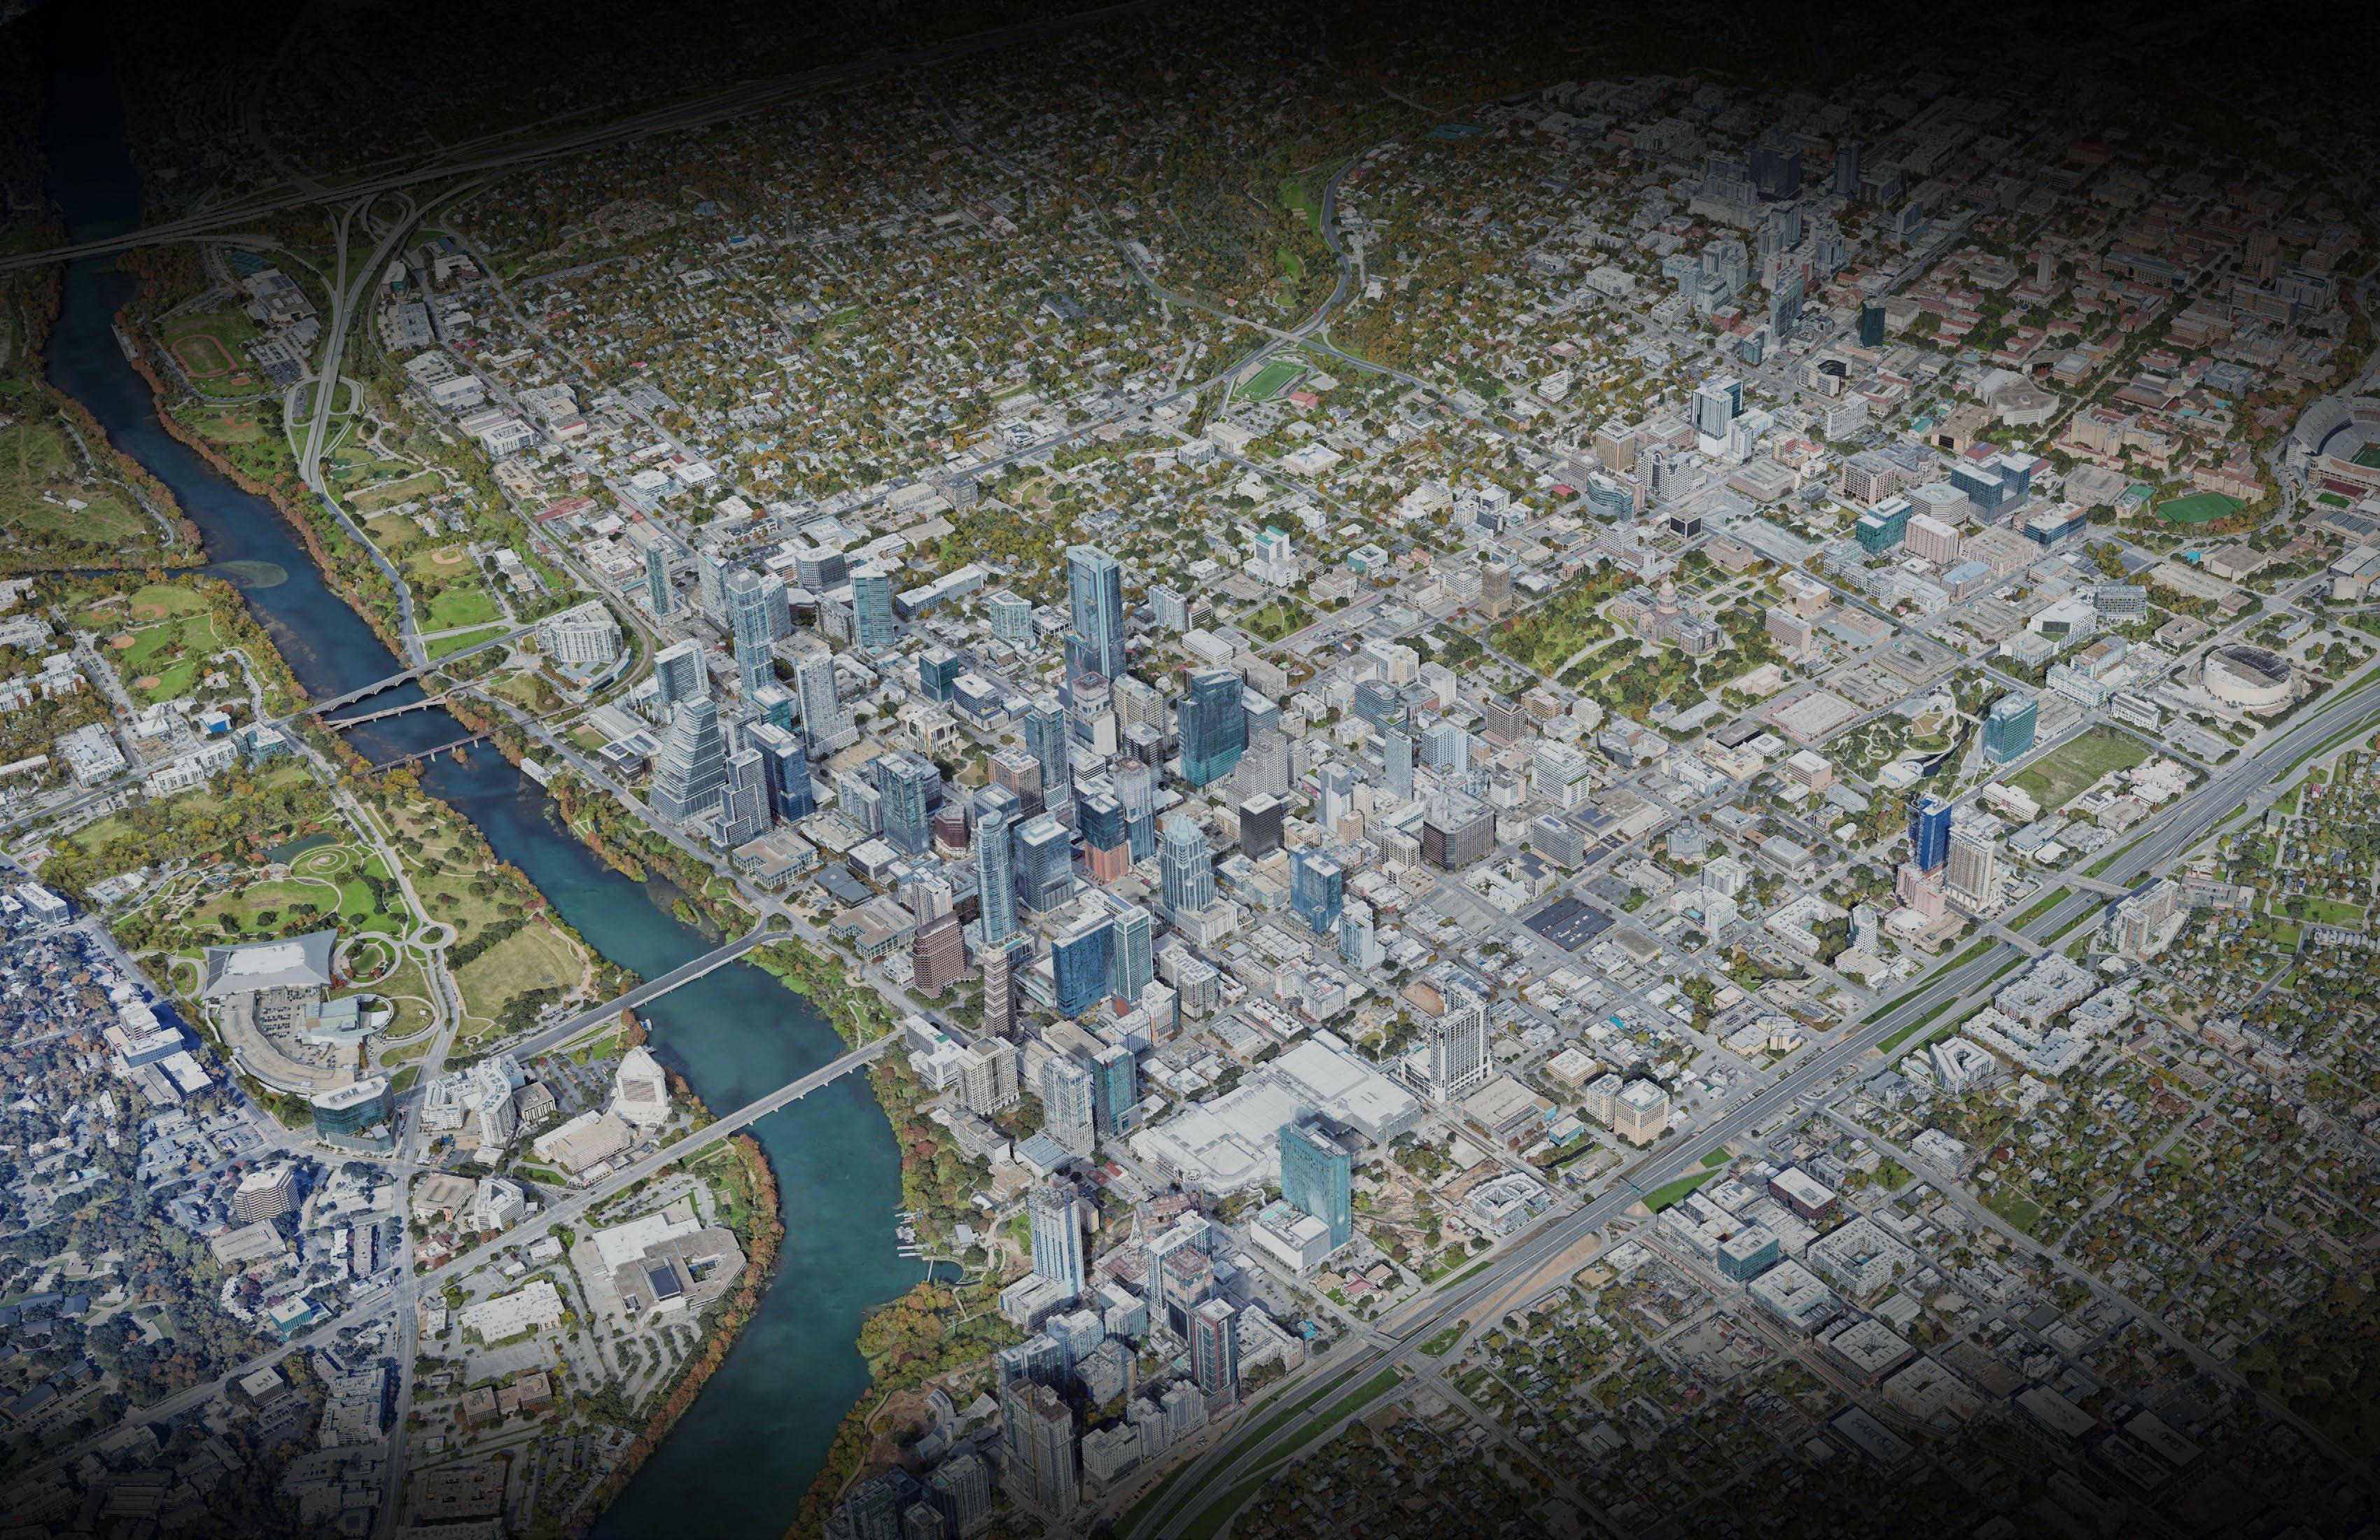
This report assesses Downtown Austin’s role as the City and Travis County’s primary economic and fiscal engine, establishing baseline conditions across property value, tax generation, and employment. Drawing on parcel-level data, high level market trends, and sectoral analysis, the study evaluates how Downtown contributes to citywide and countywide revenues and economic activity, and how these dynamics have evolved over the past decade. Downtown represents a highly concentrated value base, accounting for more than 11 percent of the City’s taxable value and approximately six percent of Travis County’s value on less than one percent of all parcels. This concentration has intensified over the past decade, with taxable value increasing by approximately 300 percent since 2015. As a result, Downtown generated approximately $121 million in property tax revenue in 2025, contributing to the City’s property tax revenue, which overall accounts for roughly onefifth of total City funds.
At the same time, Downtown functions as the region’s highest-density employment center, with over 75,000 private sector jobs concentrated in a compact geography and strong growth since 2015. Private sector employment is led by professional, scientific, and technical services, alongside finance, real estate, and administrative sectors, reflecting a shift toward a knowledge-based, office-oriented economy with high-paying jobs. These trends reinforce Downtown’s role as the core driver of economic activity, while also highlighting emerging risks tied to remote work and technological changes driven by AI.
Study Goals
The study quantifies Downtown’s property tax contribution and fiscal role, analyzes employment trends across key industry sectors using NAICS-based classifications, and establishes baseline conditions drawing on parcel-level land use and tax data. It identifies economic strengths, growth sectors, and development patterns, and supports scenario testing for select sites to inform policy decision-making.
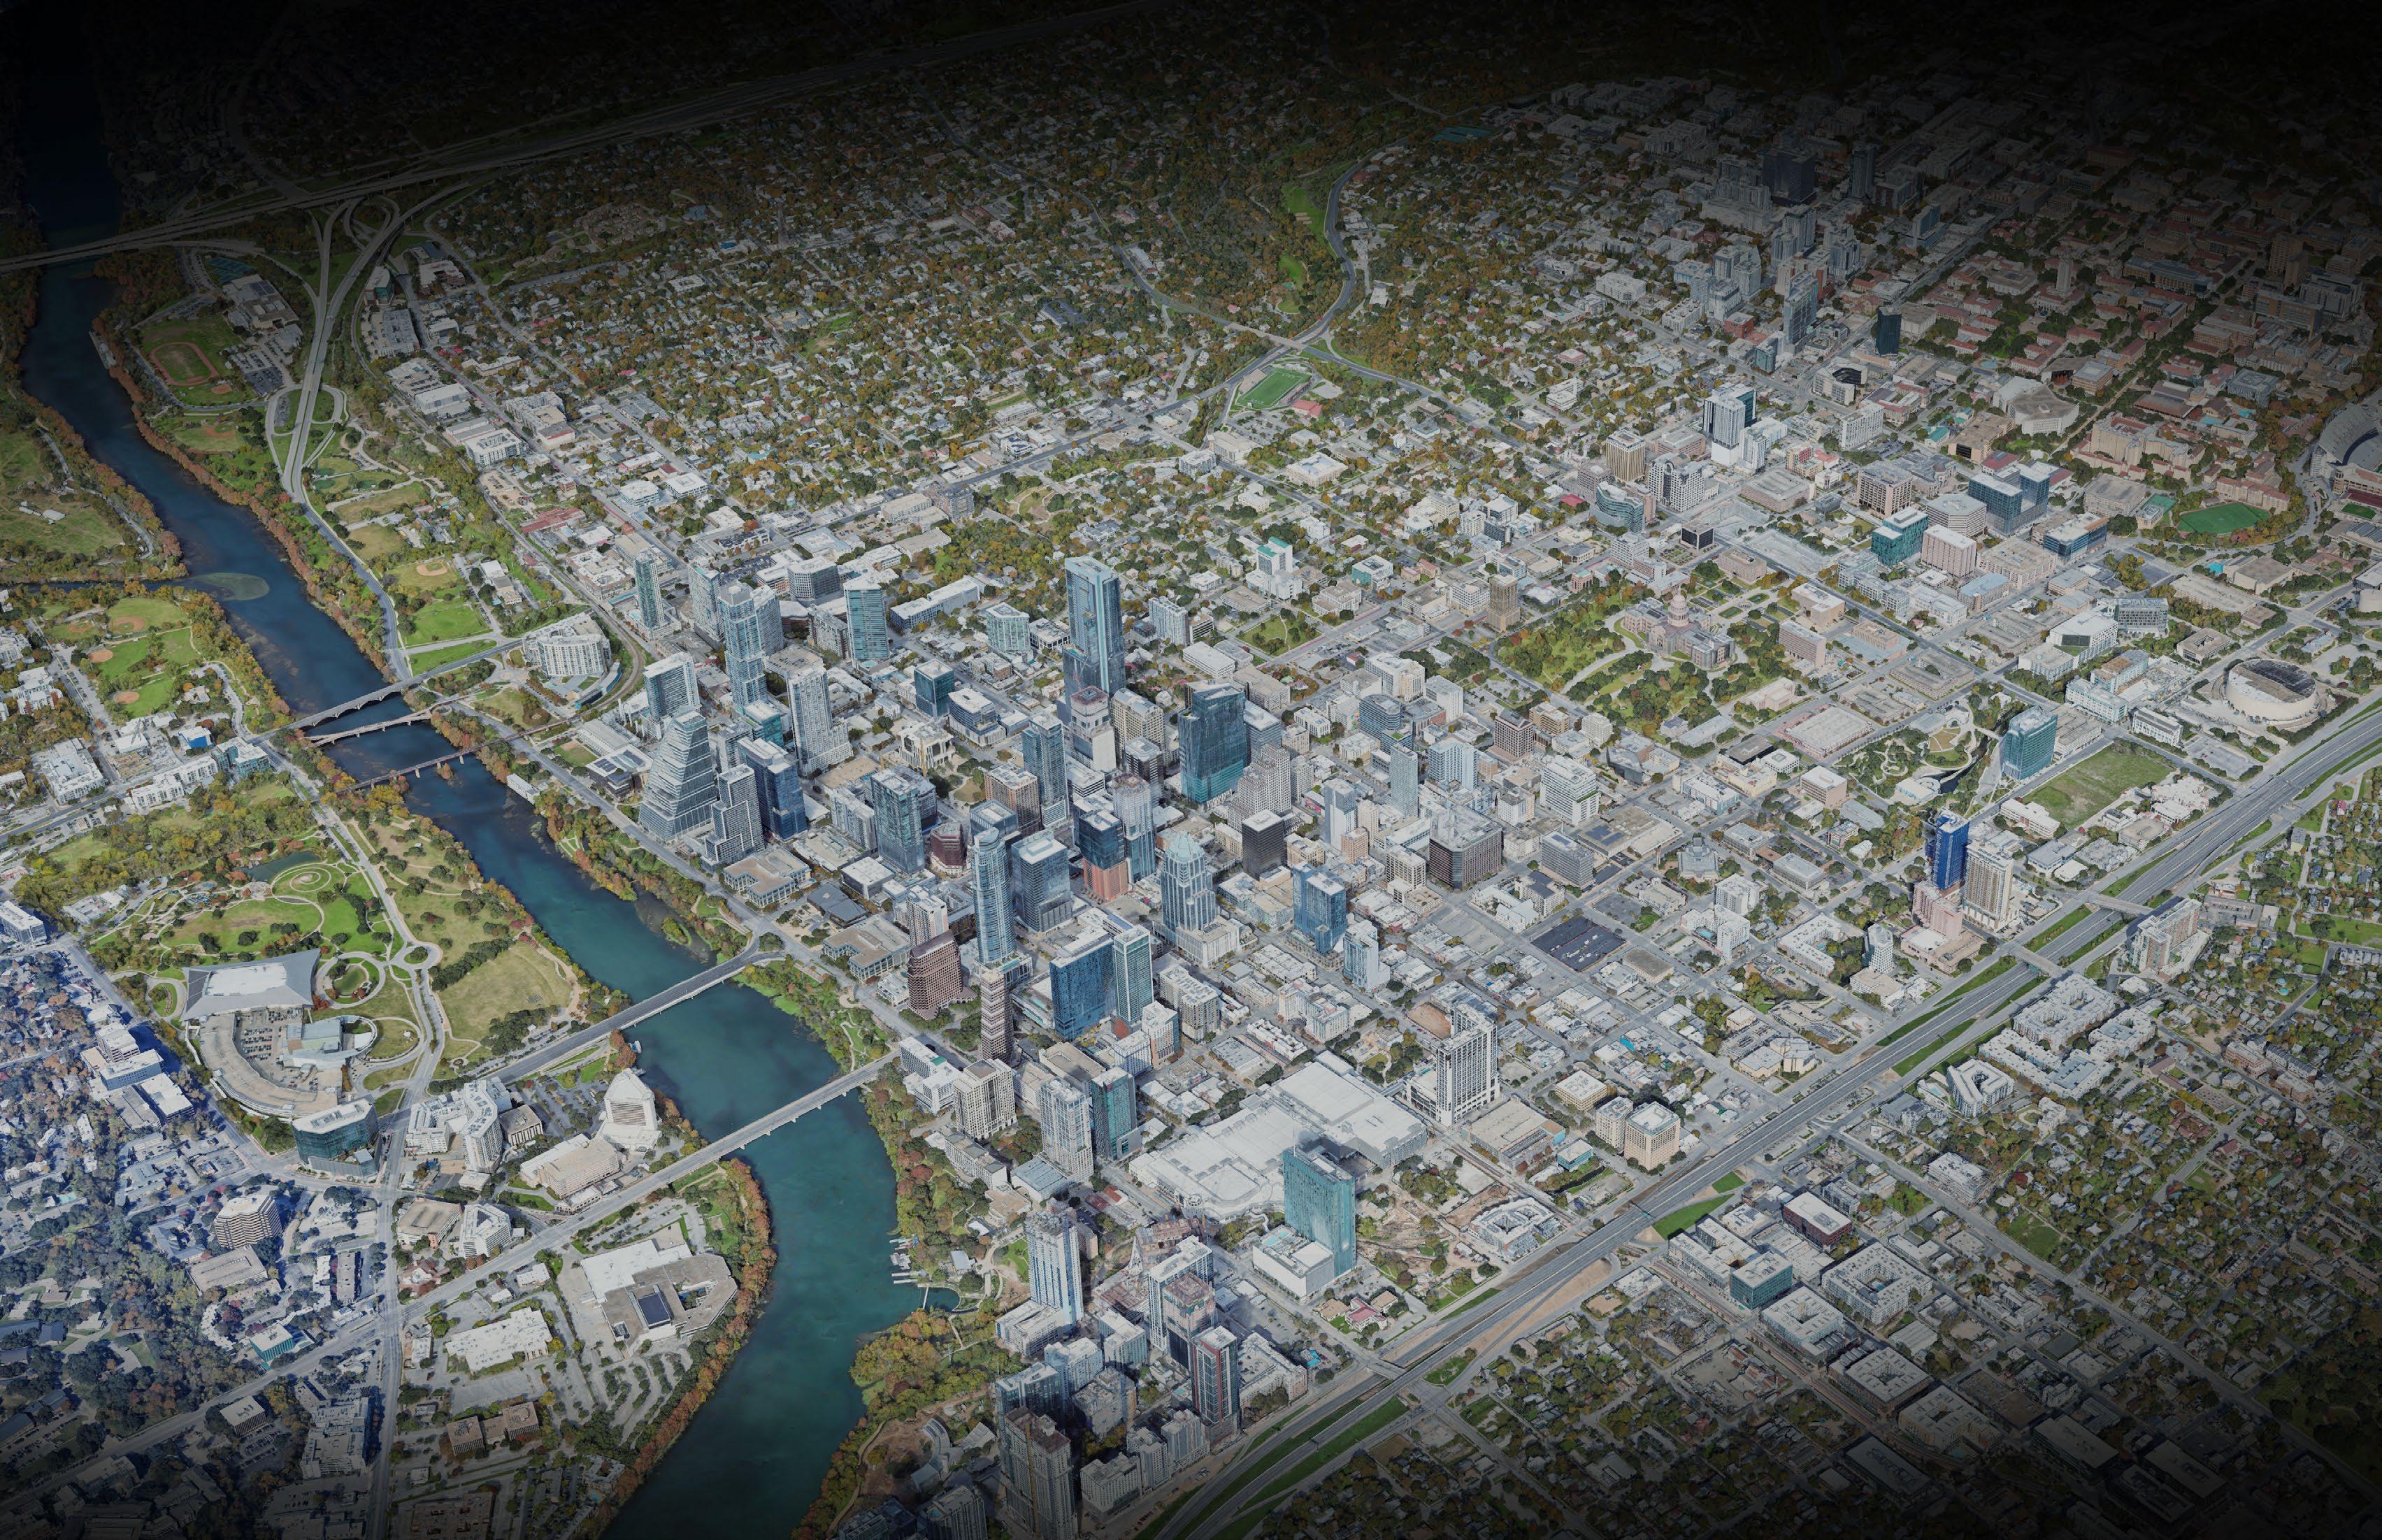
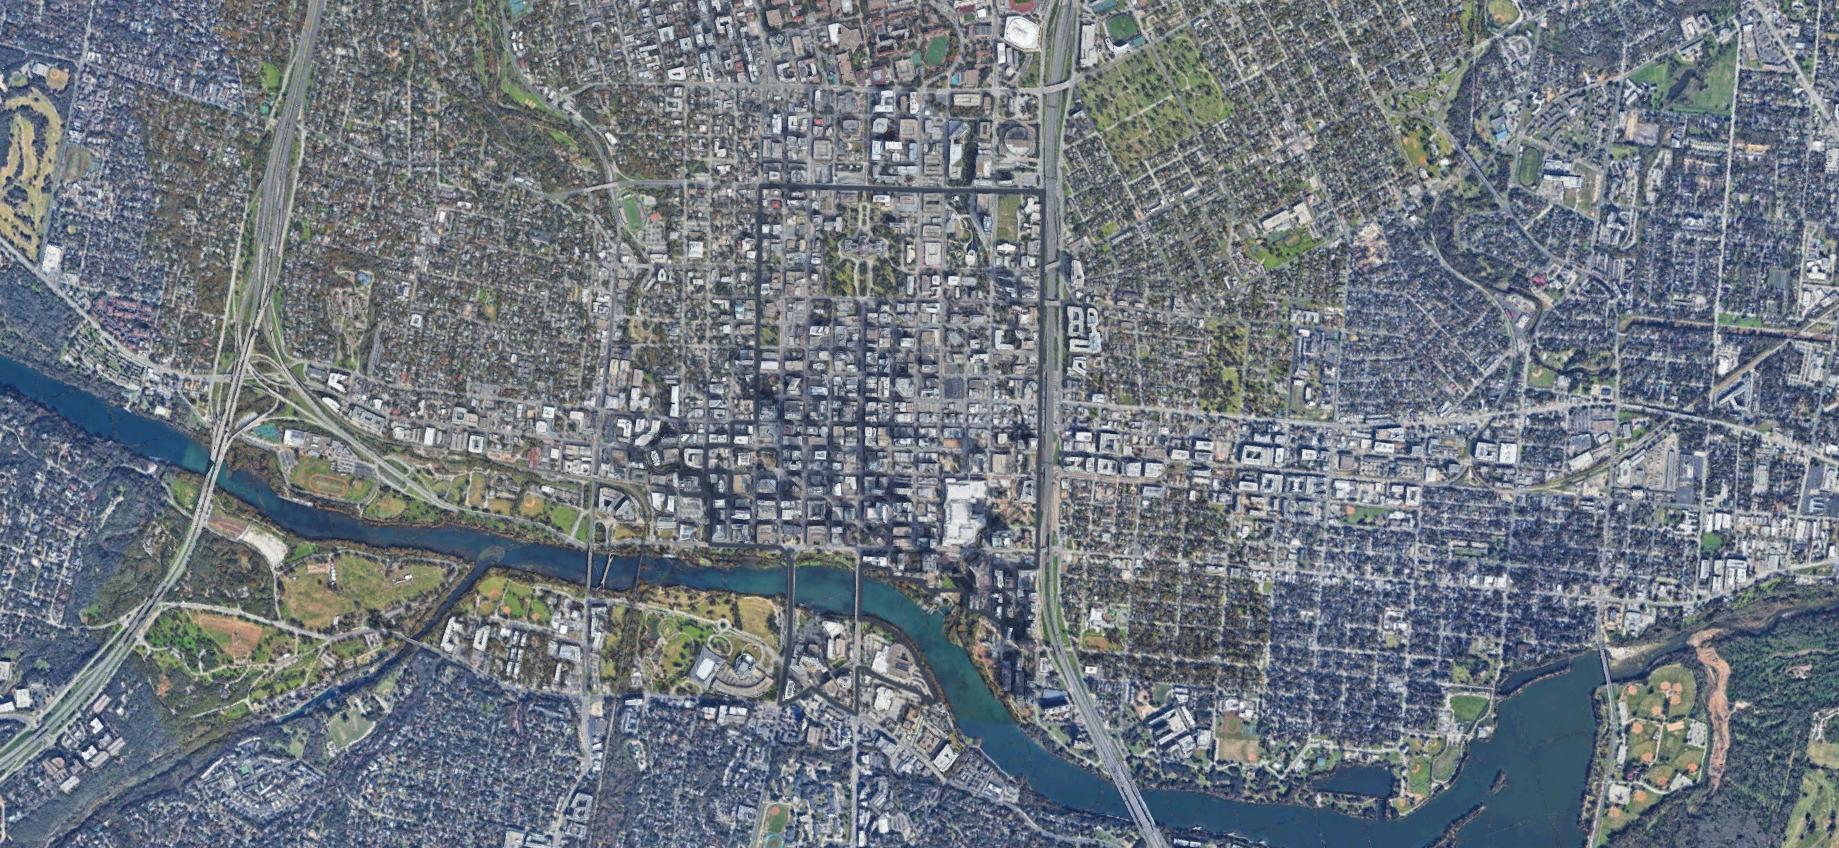
As part of the analysis the team looked at Downtown Austin, defined as ZIP code 78701, approximated in the red outline at right, which represents just 0.5% of the City’s total land area. It also compares Downtown Austin’s data to Travis County trends.
TravisCounty
The City of Austin is shown in blue, with the downtown area highlighted in red for reference.
In this analysis, zip code 78701, approximated in the red outline above, is used as a proxy for Downtown Austin.
Baseline Conditions
Study Area Context
Downtown Austin’s footprint is just 0.5% of city land, with 11,625 residents (88% growth since 2014) and 75,513 private-sector employees, the district hosts 6.5× more workers per square mile than residents — underscoring its role as the region’s primary employment hub. It also employes 10% of the county’s worker population and has seen growth of 38% since 2015.
Source: Census, 2014-2024 ACS 5-Year Estimate for ZIP Code 78701
Source: Lightcast, 2025 for ZIP Code 78701
Study Area Inventory
According to CoStar, office supply of Downtown Austin (25.2M SF) represents 22% of citywide inventory and grew 47% since 2015. Hotels (11,091 rooms) account for 30% of city rooms, the highest share of any category. Multifamily units in Downtown more than doubled (+105%), reflecting strong residential demand during the past ten years. Retail remains a smaller share (3%) with minimal growth (2%).
Source: CoStar, 2026
Baseline Conditions
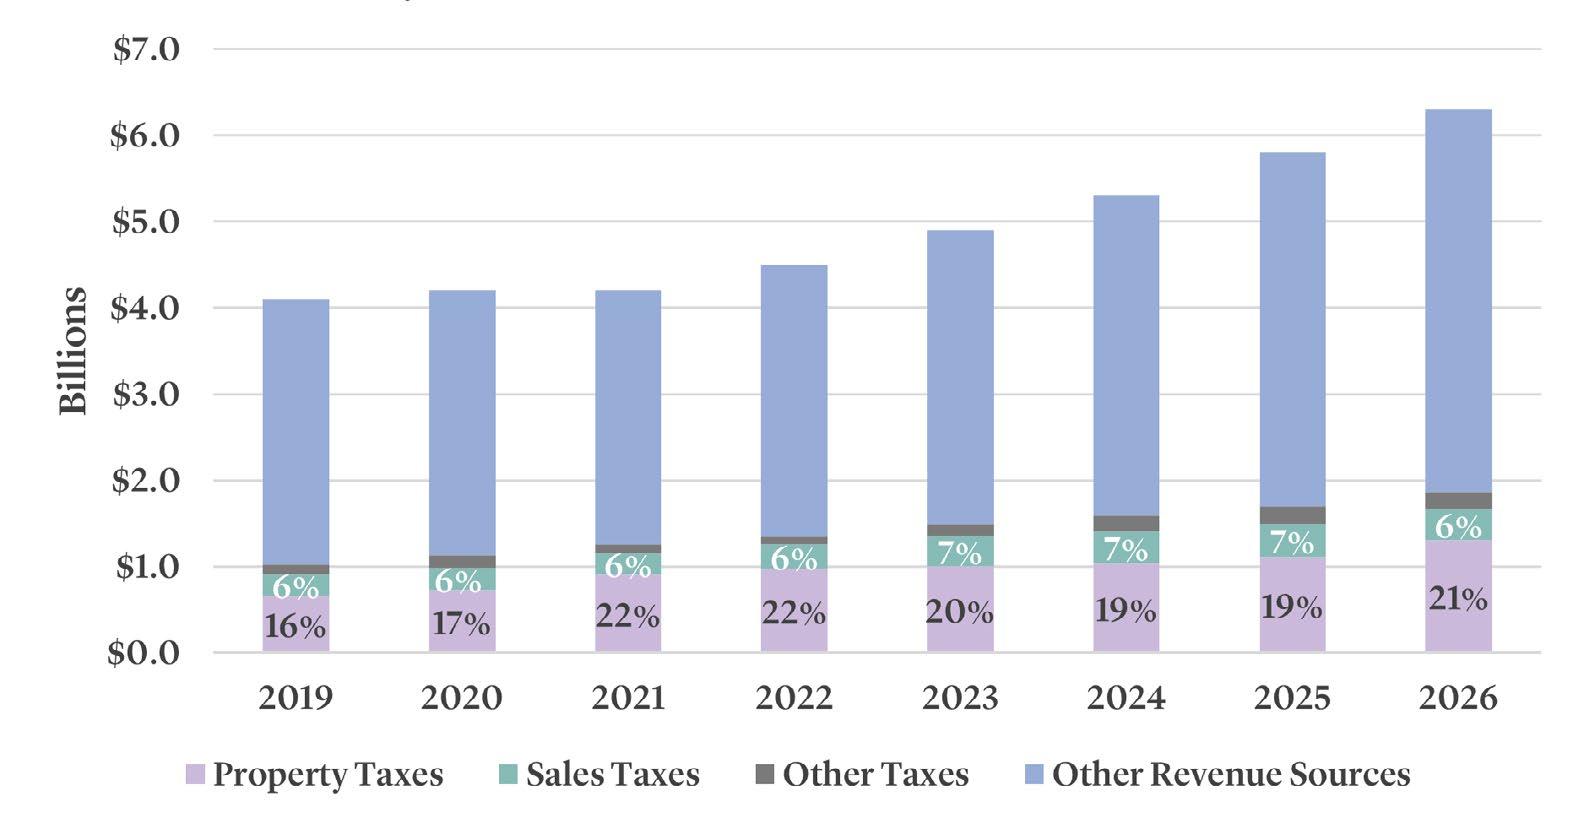
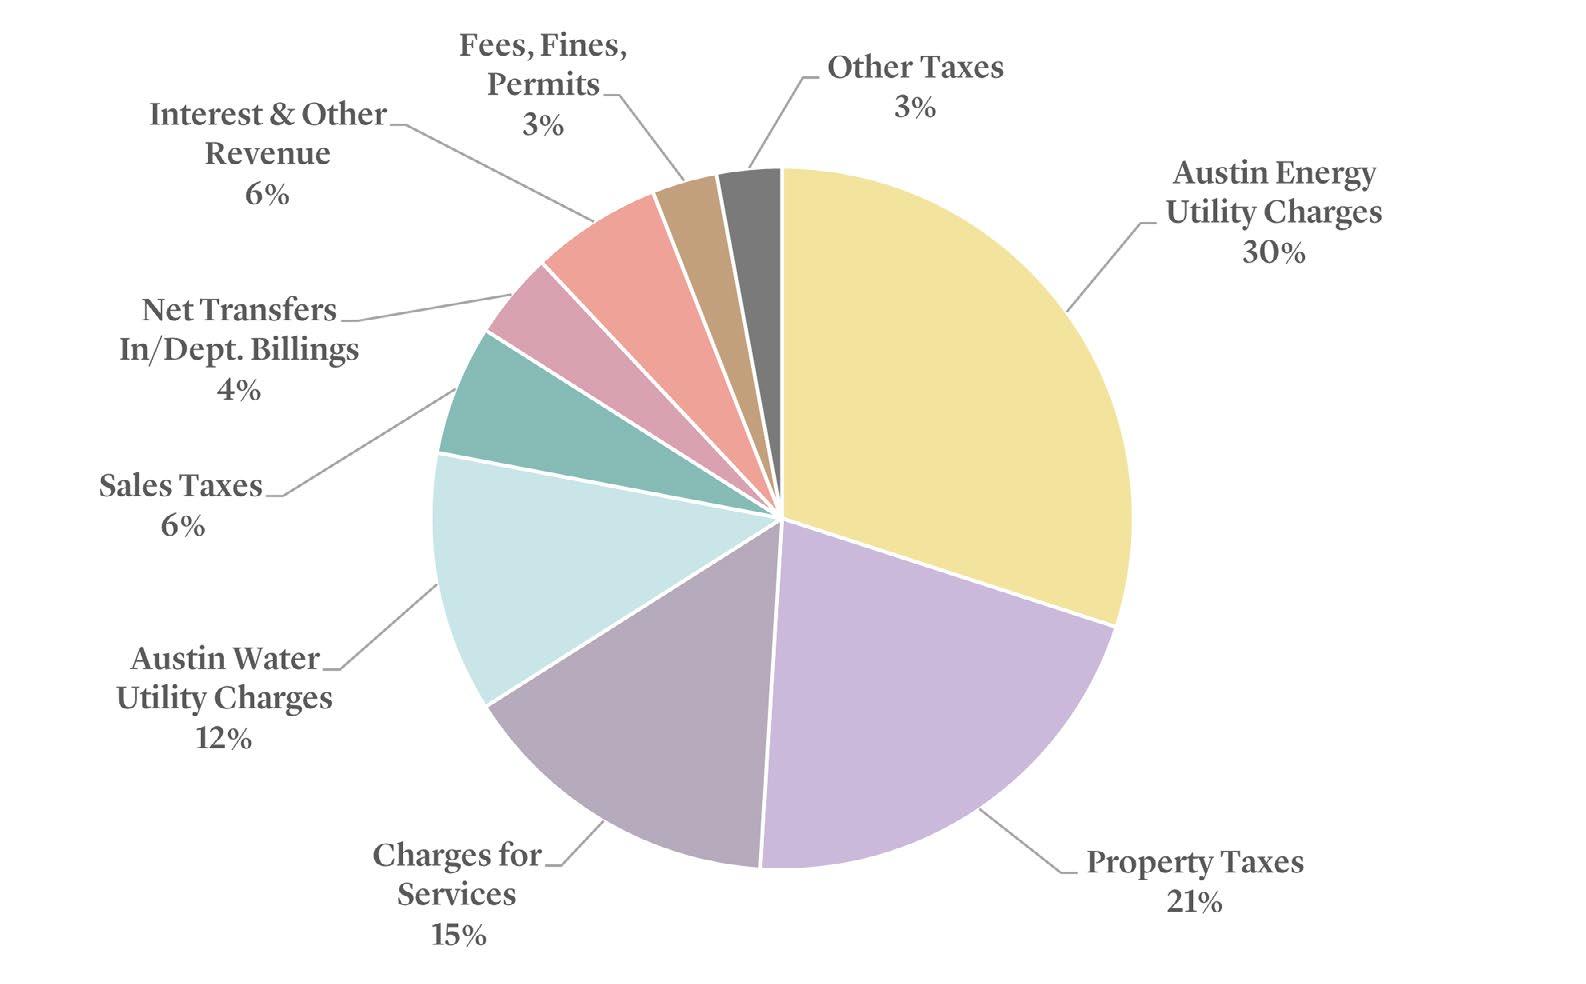
Property taxes generate approximately $1.3 billion annually, making them the largest non-utility revenue source and a critical foundation of the City’s budget.
The total property taxes across the City account for 21% of total City funds in FY 2026.
Source: FY 2025-26 Approved Budget, City of Austin Property and Sales Tax Contributions Over Time
Hotel Occupancy Tax Revenue Impact
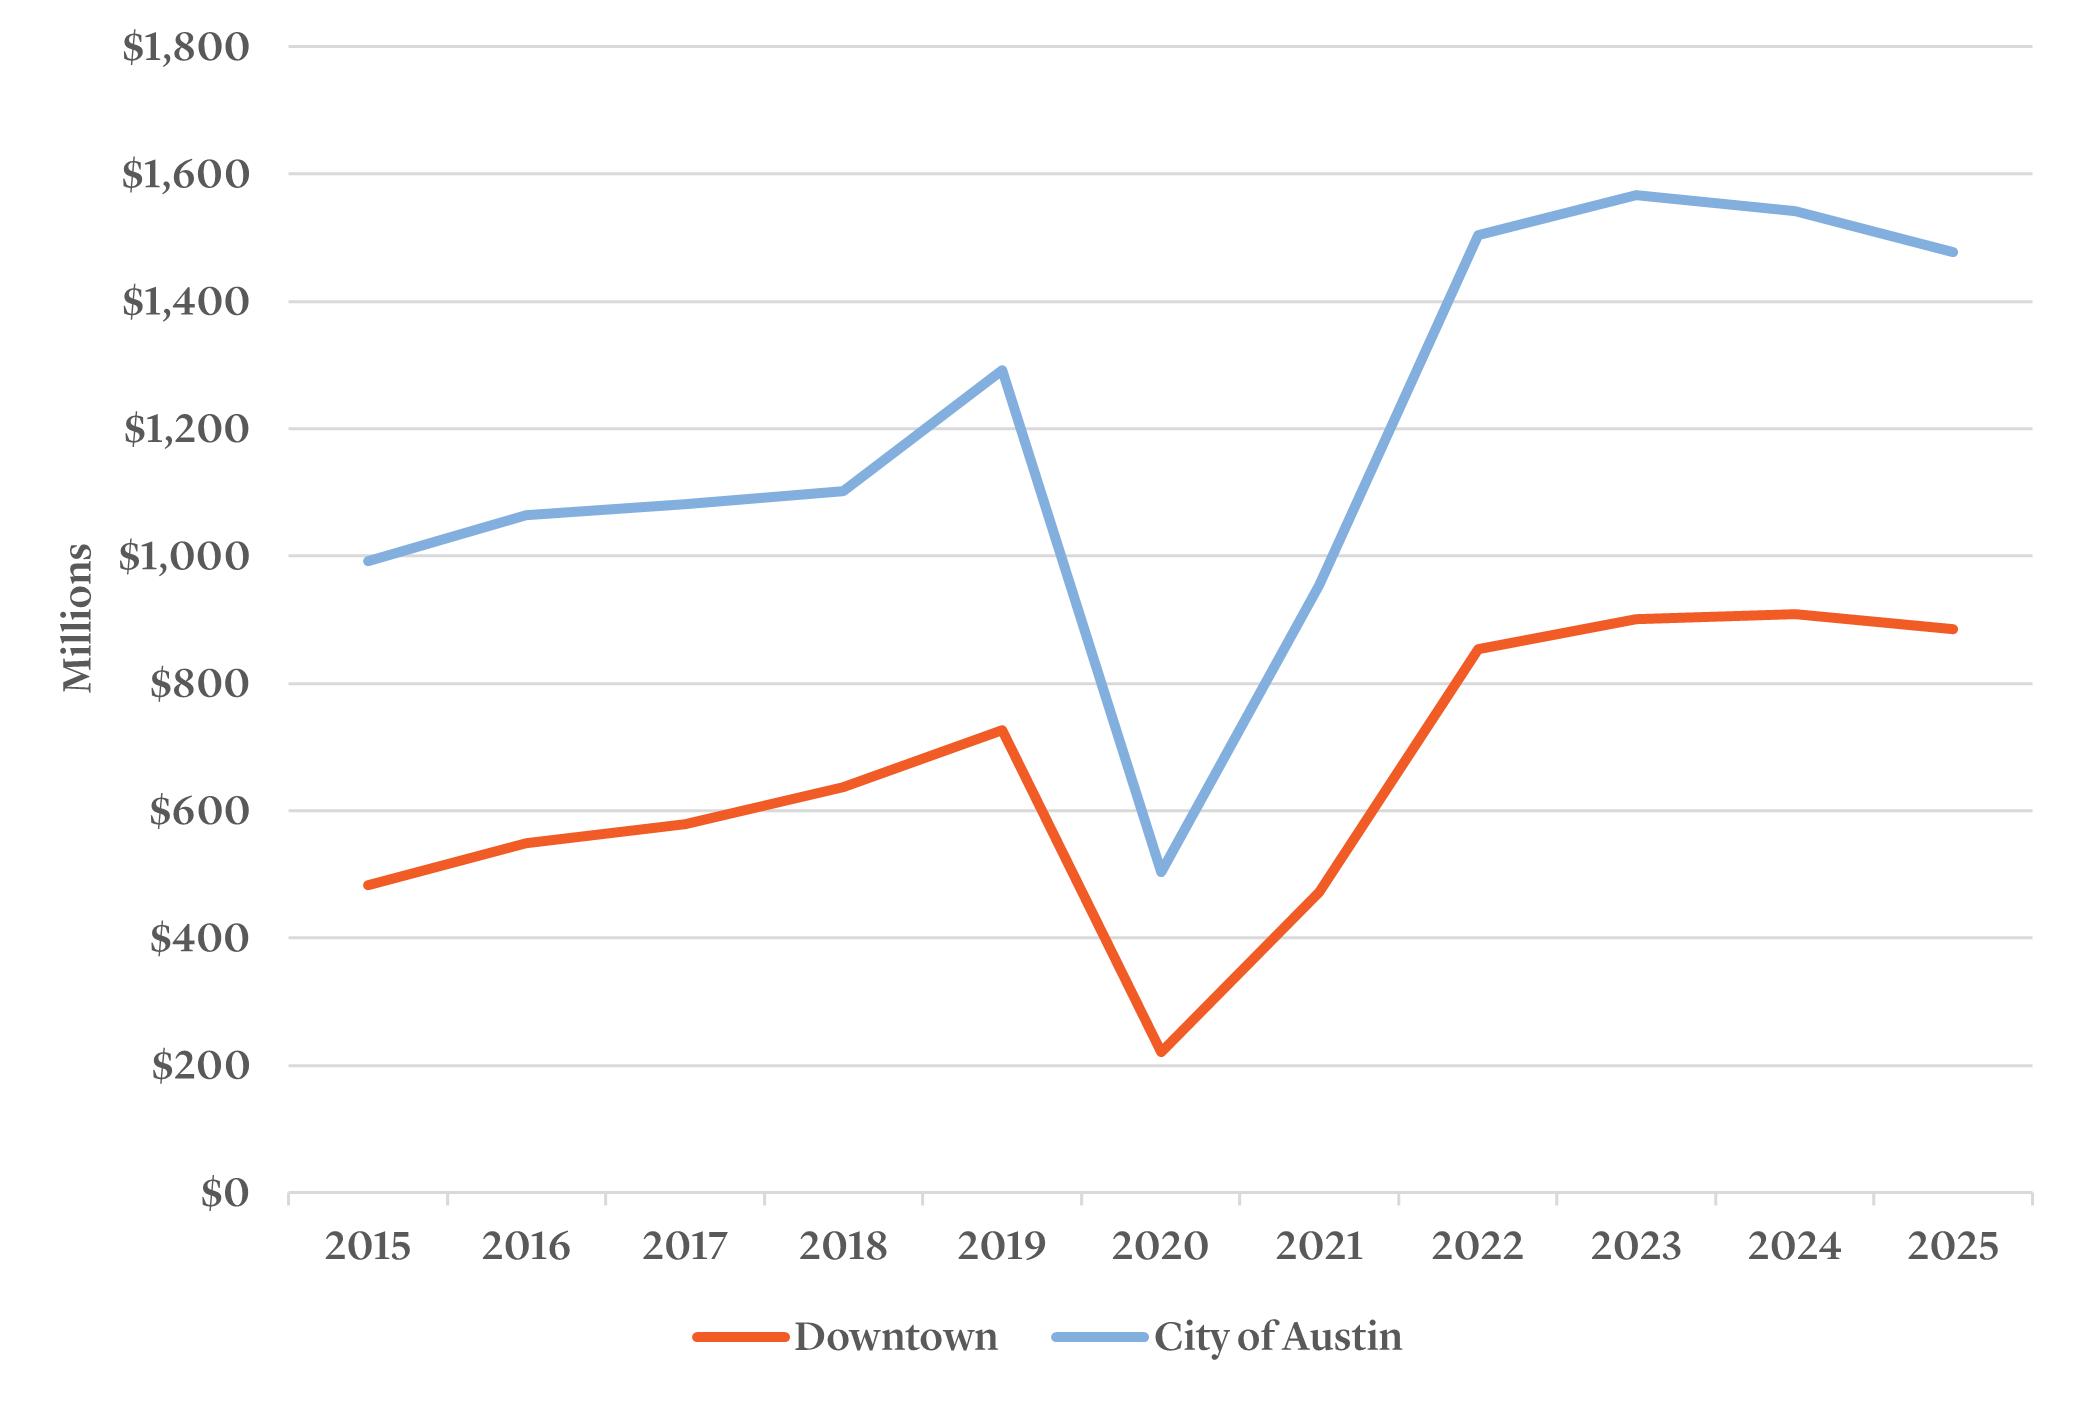
Downtown generates the majority of Austin’s hotel occupancy tax (HOT) revenue, a share that has grown from 35–40% in the early 2000s to 57–60% today, reflecting its central role in the region’s tourism economy and importance in the budget.
Downtown hotel revenue climbed from approximately $484M in 2015 to $885M in 2025, which represents nearly a 14× increase from the $61M recorded in 1991.
The sector absorbed a severe 70% drop in 2020 due to COVID-19 but rebounded sharply (+114% in 2021). After peaking in 2024, revenue declined slightly in 2025 (–3%), suggesting that near-term growth may require new demand drivers such as expanded convention activity or broader tourism investment.
Austin Hotel Revenue
Sales Tax Comparison | City of Austin vs. Downtown
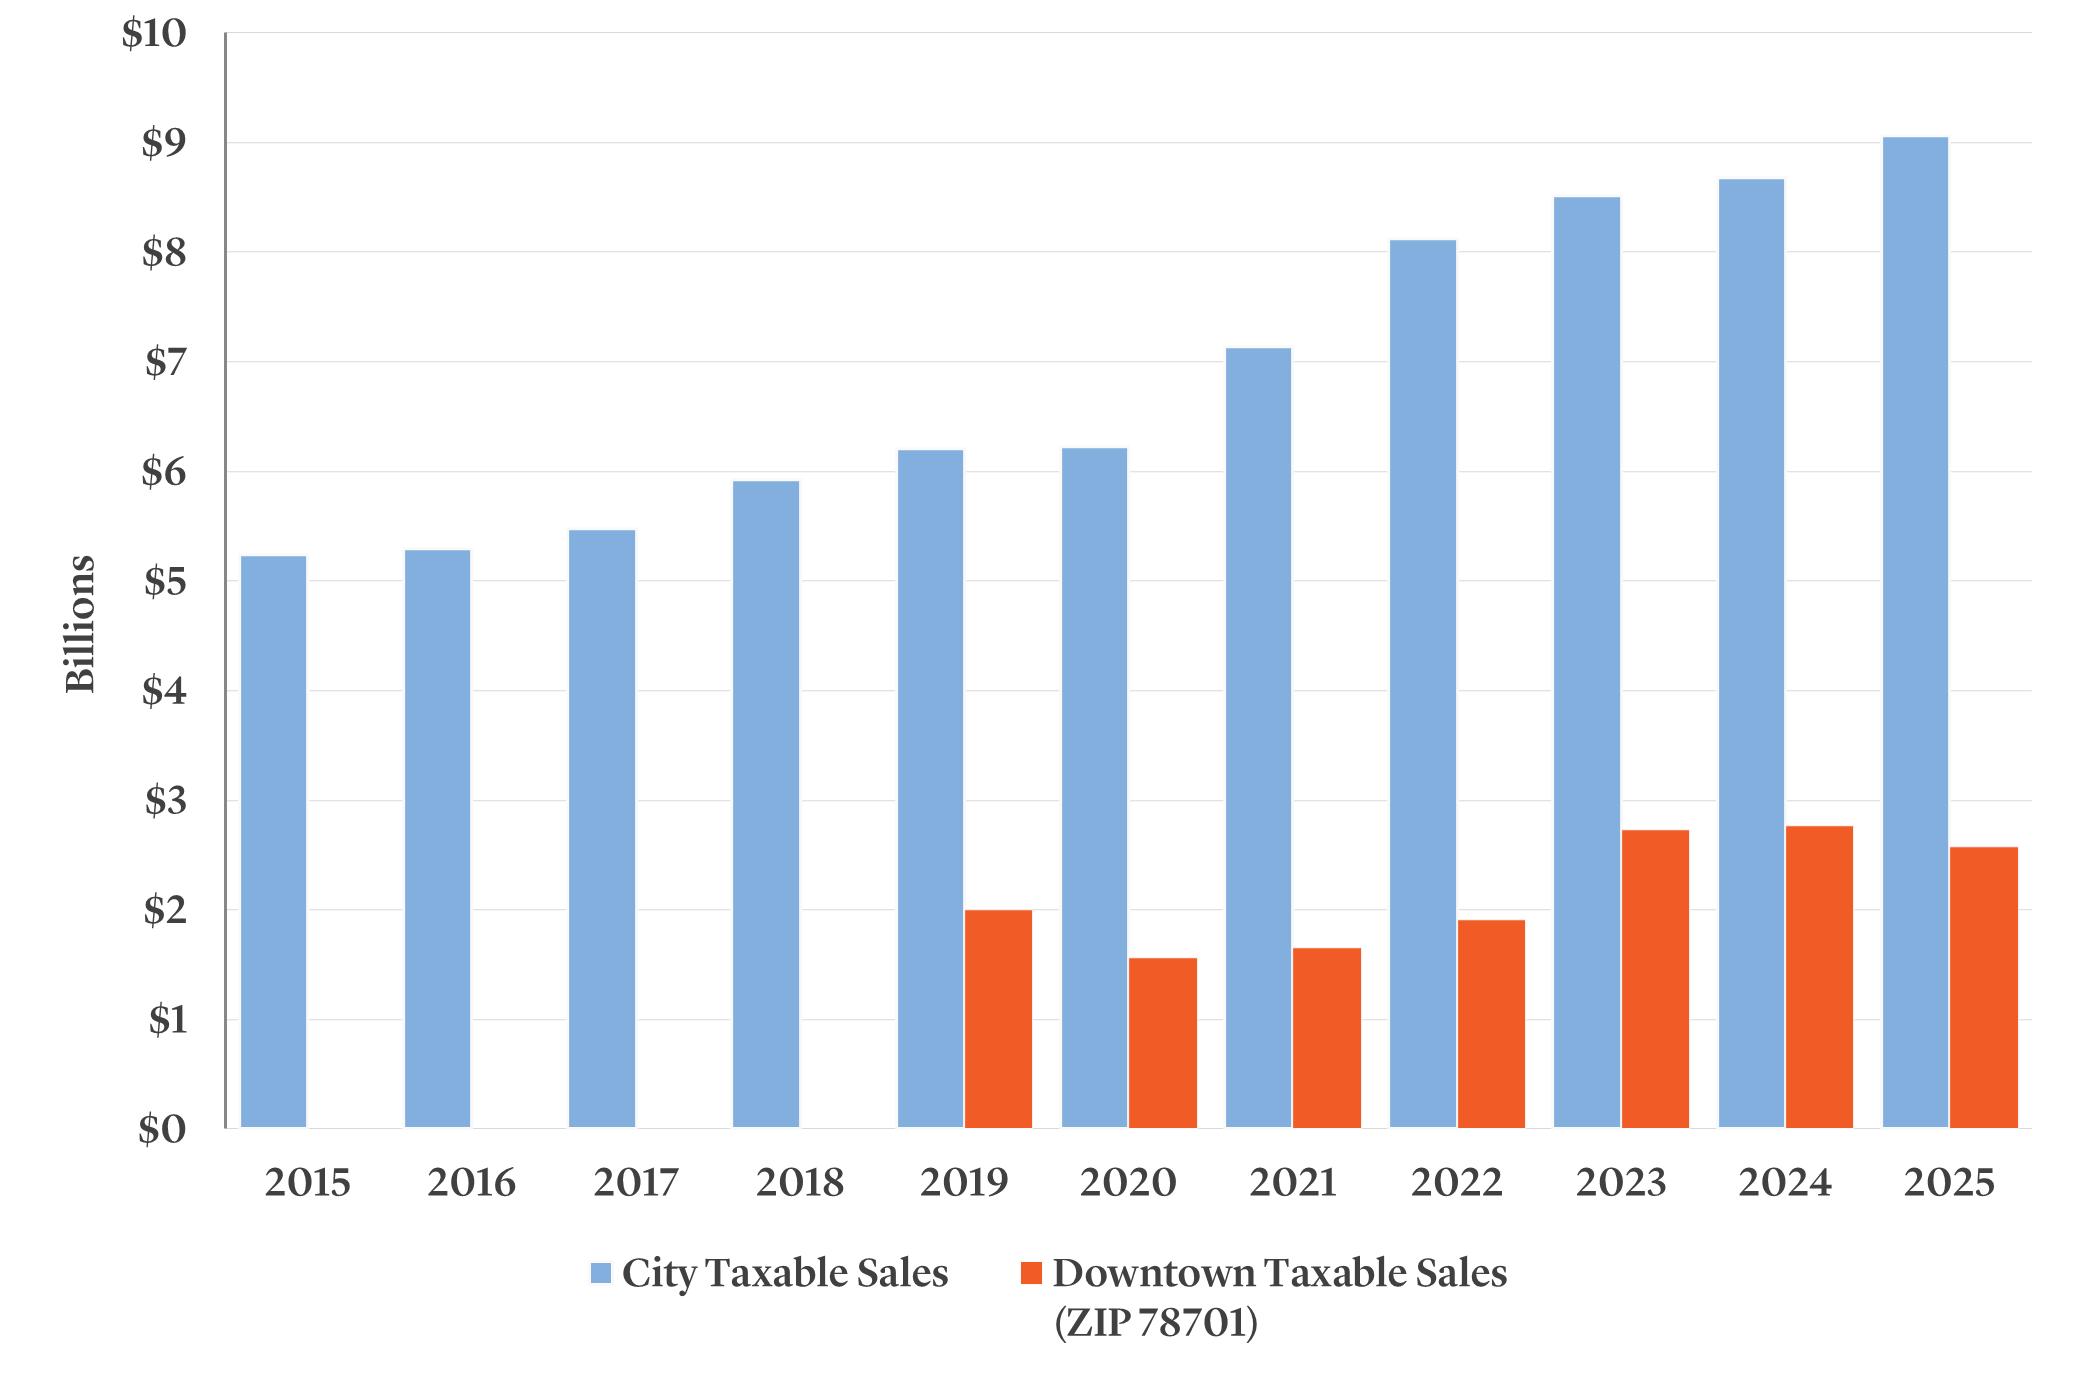
Downtown Austin (ZIP 78701) has consistently represented 28-32% of city-wide taxable sales from 2019-2025, while making up only 0.5% of Austin’s land area. The COVID-19 pandemic affected downtown with a 22% drop in 2020, due to its concentration of restaurants, retail, and hospitality, while city-wide sales remained essentially flat. Austin’s combined sales tax rate has remained stable at 8.25% throughout the entire period.
Property Tax Revenue Impact
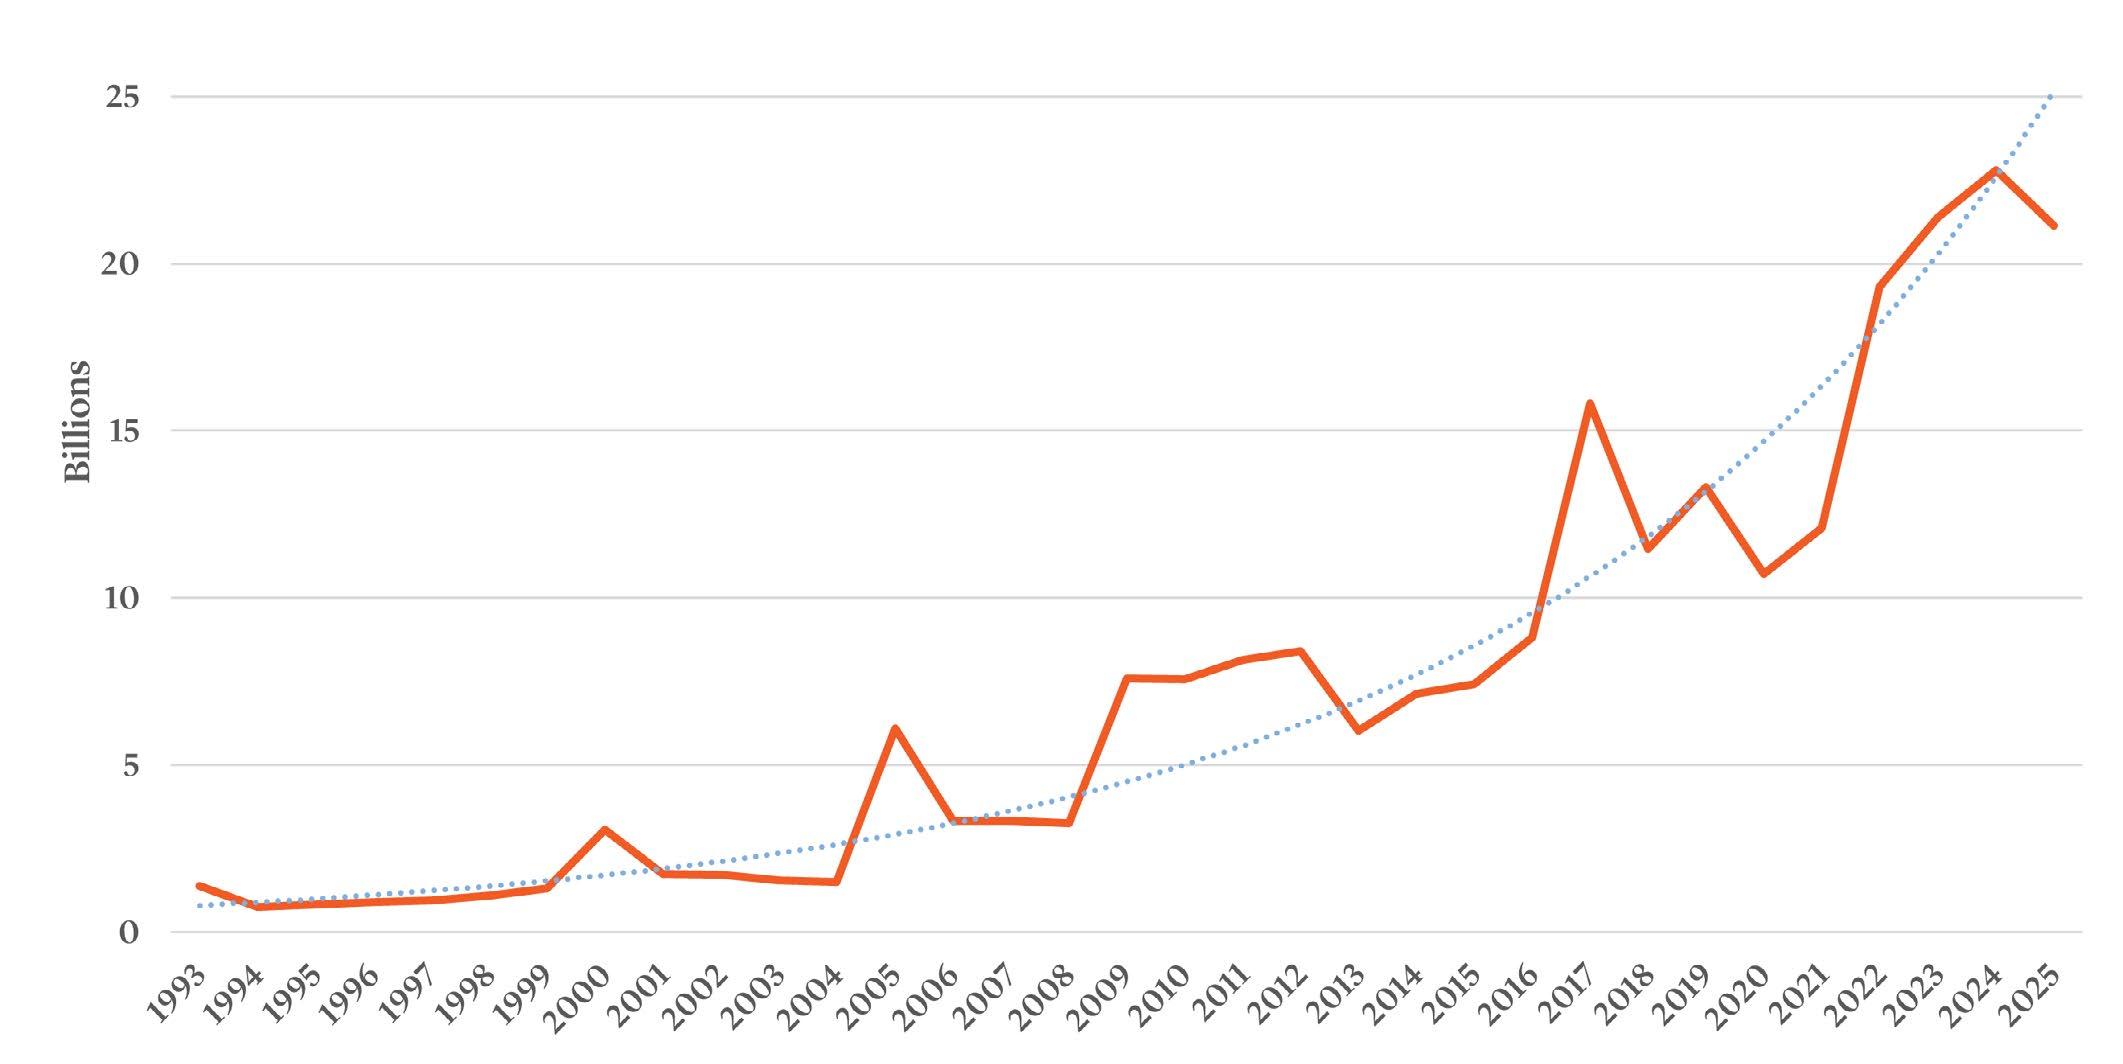
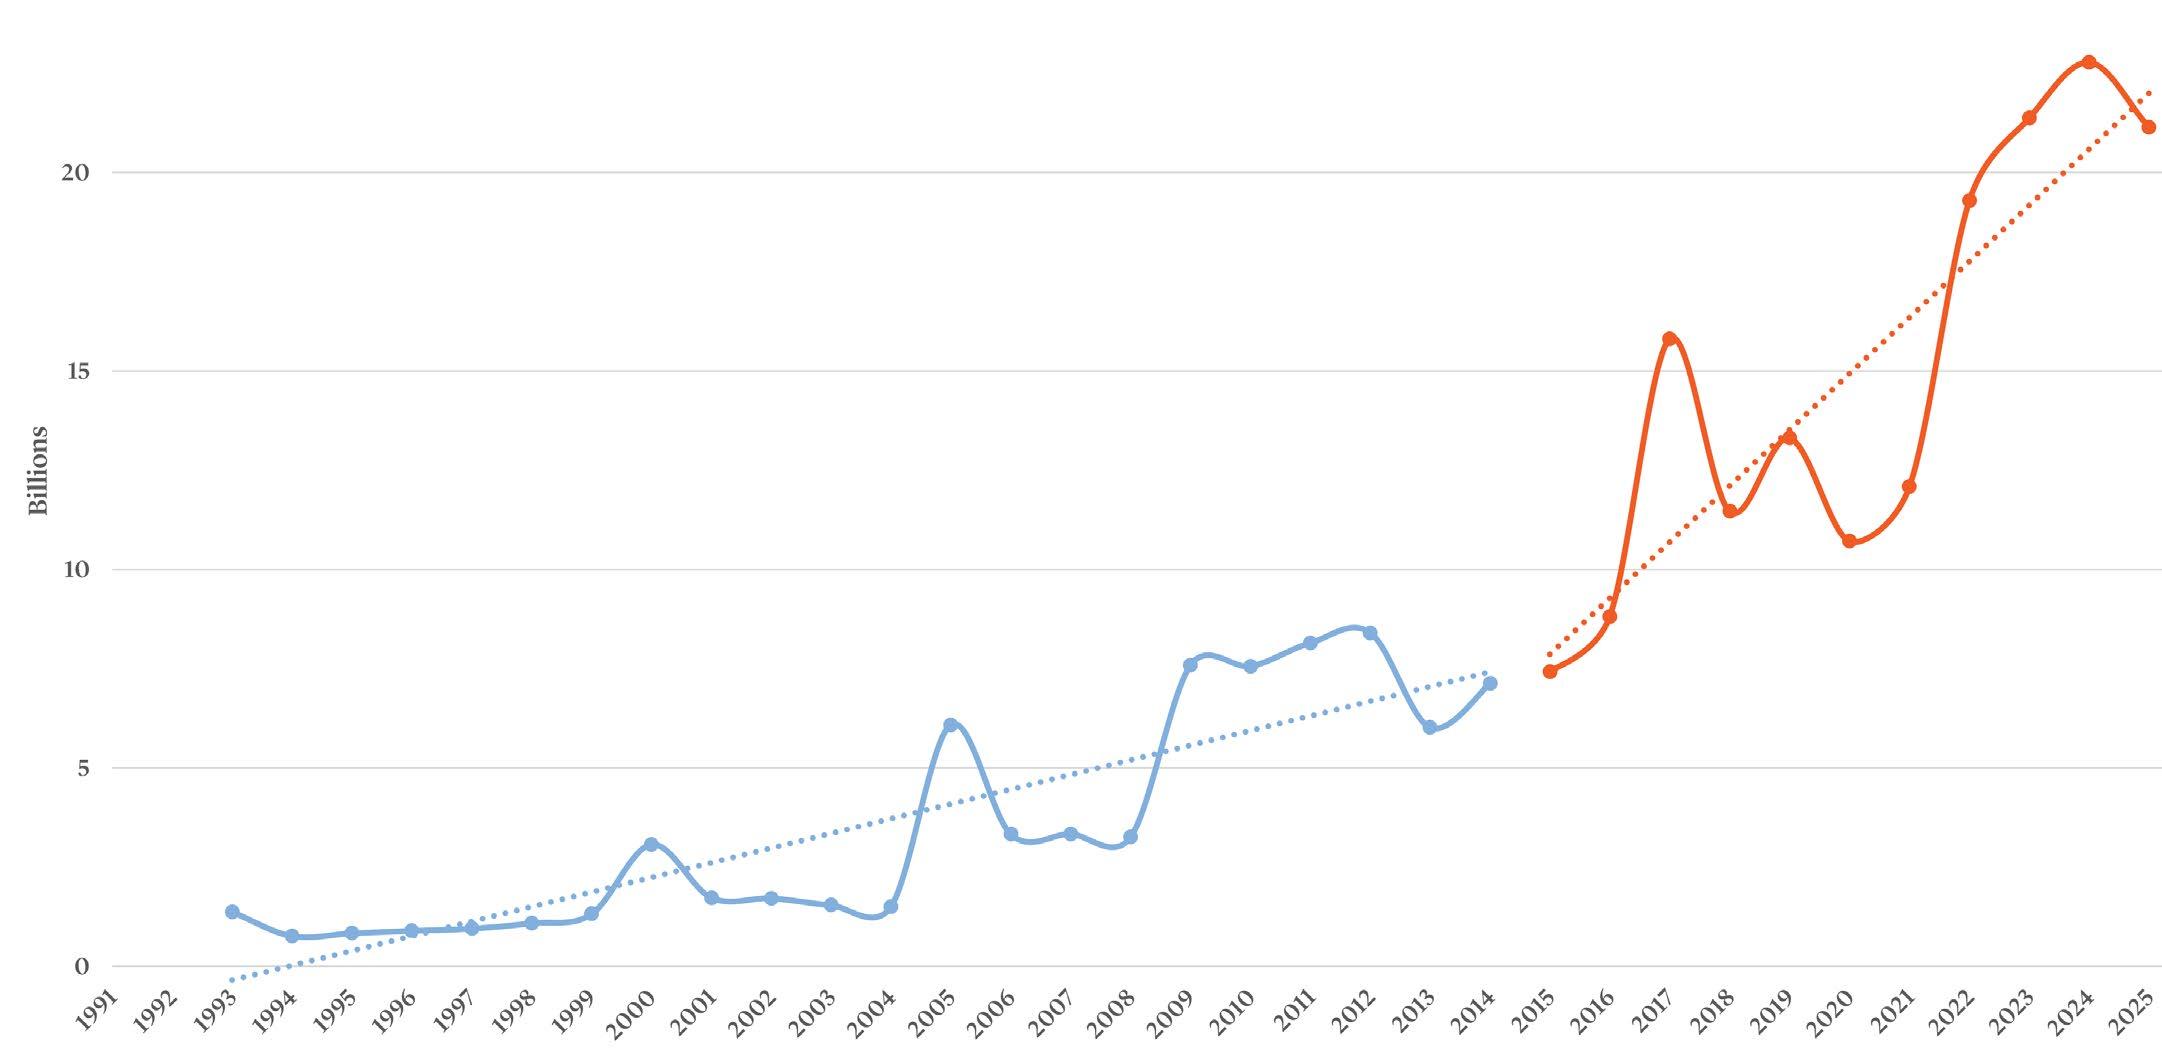
Downtown Austin has become a major fiscal driver for the City, with total taxable value rising dramatically over the past decade. Taxable value within the Downtown grew from approximately $5.3 billion in 2015 to over $21.1 billion in 2025, an increase of roughly 300%.
Despite representing less than 1% of all parcels, Downtown now accounts for more than 11% of the City’s total taxable value and approximately 6% of Travis County’s total, generating a disproportionate fiscal return relative to its geographic size.
in 2025
Downtown Austin’s Assessed Value is more than 11% of the City’s total, and more than 6% of Travis County’s total.
Property Tax Revenue Impact
Recent growth has been particularly accelerated, with taxable value increasing approximately 75% between 2021 and 2025 alone, driven by continued development and rising property values.
At approximately $20 million per acre, Downtown Austin reflects one of the most concentrated tax bases among major Texas downtowns.*
In 2025, the district generated approximately $121 million in property tax revenue, equivalent to $10,400 per capita and $1,600 per worker. This concentration of value highlights downtown’s role as a highly productive economic core, generating significant fiscal value relative to its size and reinforcing its importance to the City’s overall tax base.
Remaining question: Over the past 5-10 years, has commercial or multifamily residential driven more of the increase in taxable value Downtown?
Growth in Taxable Value in Downtown
Short-Term Value Fluctations
Austin’s Downtown Density Bonus Program (DDBP) accelerated taxable value growth post-establishment. Case studies illustrate how construction exemptions and completions cause short-term dips and spikes in assessed value: for example, 98 San Jacinto Blvd showed $0 in 2016 then $504M in 2017 (during construction exemption). Understanding these fluctuations is critical for interpreting year-over-year tax data.
Austin Plan (DAP) was adopted in 2011 and created an extremely productive framework for development downtown.
Austin’s Downtown Density Bonus Program was established in 2014 to promote the development of high-rise buildings and to support affordable housing funding in the City.
San Jacinto Blvd
Cesar Chavez
Sector Analysis
Section Definitions | Introductions & Definitions
BJH analyzed the private employment sectors to understand what types of industries are driving Downtown’s economy. This analysis allows to link Downtown’s employment base back to its fiscal performance and understand how industry mix supports long-term economic competitiveness.
Sectors are defined by the North American Industry Classification System (NAICS) and are organized within a hierarchy of 2–6-digit NAICS codes, with 2-digit NAICS codes representing the broadest sectors, and 6-digit NAICS codes representing the most granular industries.
This study considers high-level employment trends for 2-digit NAICS sectors, but indentifies key sub sectors at the 4-digit NAICS level.
Downtown Austin Employment Sectors Over the Past 10 Years
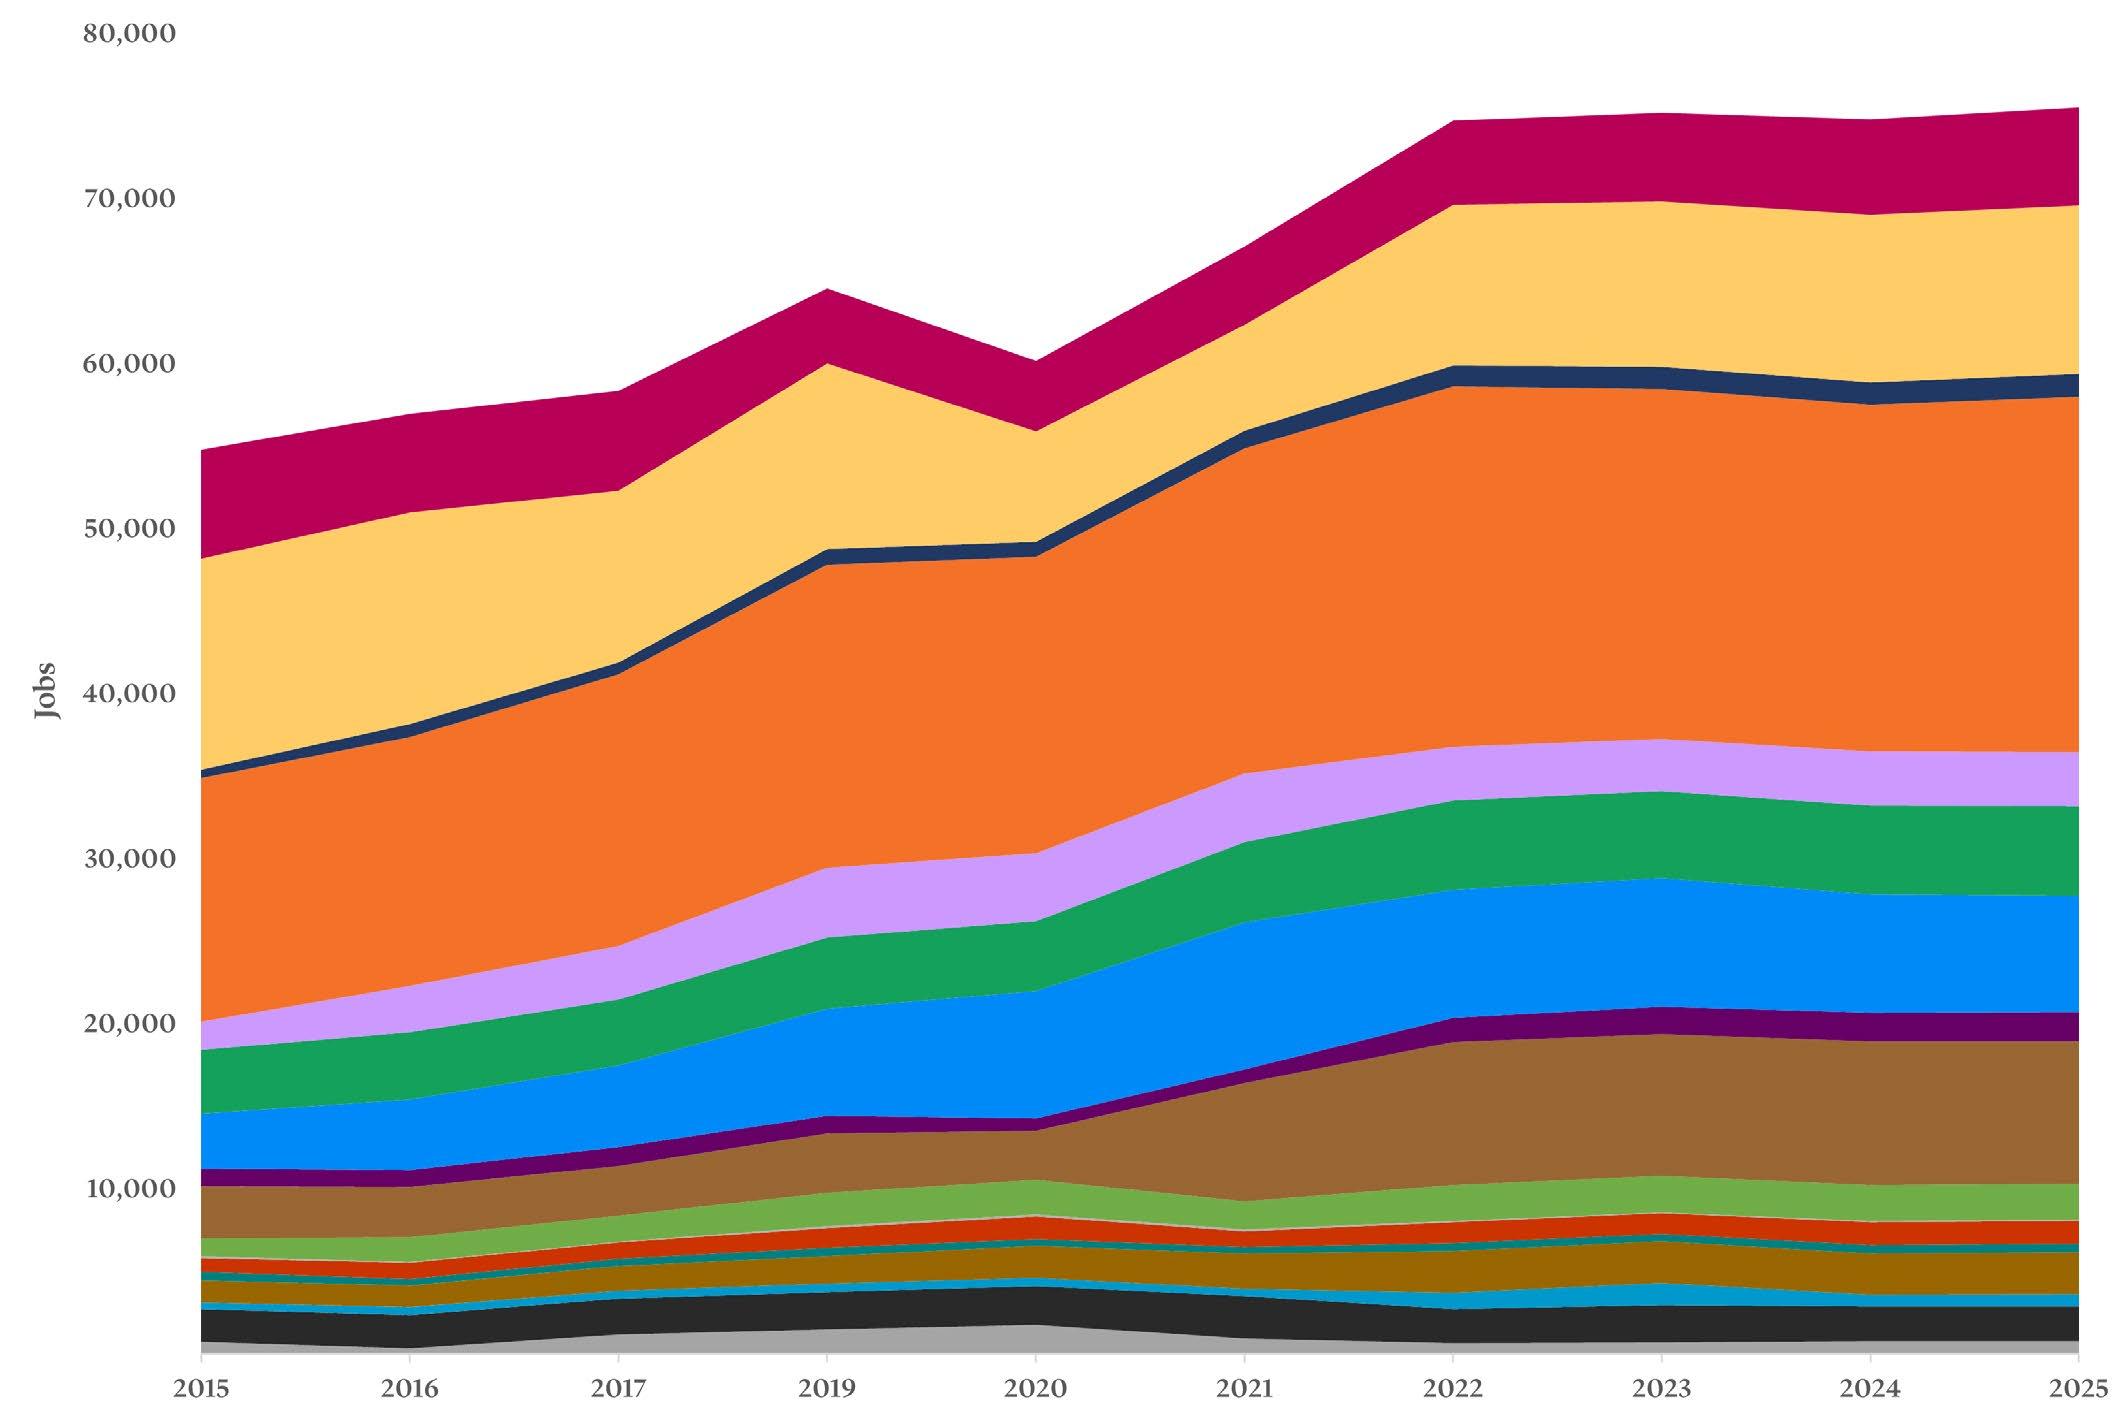
Downtown private sector employment grew from 55,000 jobs in 2015 to 75,500 in 2025, driven by post-pandemic recovery and the continued expansion of core sectors.
The most notable structural shift has been toward officesupport and service sectors, with significant growth in administrative and support services and steady gains across finance, real estate, and healthcare.
The professional, scientific, and technical services sector remains the dominant employer and primary growth driver, reinforcing Downtown’s identity as a high-value, knowledge-economy hub. However, the sector’s growth rate has flattened in recent years, suggesting it is approaching maturity. Future employment growth may increasingly be driven by other sectors rather than continued expansion of the professional services base alone.
Accommodation and food services rebounded strongly after a severe COVID-driven contraction and has continued expanding, reflecting sustained visitor demand, a growing residential population, and Downtown’s irreplaceable position in Austin’s tourism and convention economy. Arts, entertainment, and recreation has also grown steadily throughout the decade. The continued growth of these sectors drive hotel occupancy tax revenue, supporting retail and food and beverage tenants, and creating the street-level activation that makes Downtown attractive to office tenants and residents alike.
Downtown Austin Employment Sectors
Two metrics are used throughout this analysis. Compound Annual Growth Rate (CAGR) measures the average annual growth rate over a given period, smoothing out year-to-year volatility. Location Quotient (LQ) captures the relative concentration of a sector in Downtown Austin, calculated as the sector’s share of downtown jobs divided by its share of US jobs, where values above 1.0 indicate higher-than-average local concentration. Source: Lightcast
Downtown Austin’s employment base is more concentrated in high-value, office-oriented sectors than Travis County and the US, with Professional, Scientific, and Technical Services accounting for 28% of jobs downtown.
Sub Sectors of Interest in Downtown Austin
BJH used a scoring system to classify the sub sectors into three tiers based on 10-year CAGR, 5-year CAGR, and 2025 Location Quotient (LQ). ‘Strong & Growing’ sectors show high growth on both timeframes and high concentration. ‘Strong & Mature’ sectors show high long-term growth but decelerating recent growth. ‘Emerging’ sectors show consistent growth but are not yet highly concentrated locally, representing expansion opportunities.
Sectors that have experienced consistent employment growth over the past ten years, and are highly concentrated in Austin relative to the US
Sectors that have experienced strong but decelerating employment growth over the past ten years, and are highly concentrated in Austin relative to the US
Sectors that have experienced consistent employment growth over the past ten years, yet are relatively less concentrated in Austin relative to the US
Strong & Growing Sub Sectors
Seven sub-sectors qualify as Strong & Growing, achieving 10-year CAGR >8%, 5-year CAGR >4%, and LQ >1.7. Employment Services leads in size (4,783 jobs, 28% 5-yr CAGR). Other Financial Investment Activities has the highest concentration (LQ 11.2). Machinery/Equipment Wholesalers show the strongest long-term growth rate (31% CAGR). All seven reflect sustained demand for downtown office and service-based employment.
Strong & Mature Sub Sectors
Five sub-sectors are Strong & Mature: established, highly concentrated, but with decelerating recent growth. Computing Infrastructure/Web Hosting leads with 3,354 jobs and an LQ of 13.9, making it the most concentrated tech sub-sector downtown. Media Streaming/Social Networks (LQ 7.0) and Semiconductor Manufacturing (LQ 5.3) reflect Austin’s deep tech roots. Near-term growth may depend on new
or expanded physical footprint.
Emerging Sectors
Selected Set of Sub Sectors | Part 1
BJH categorized these sub-sectors by NAICS parent category to help identify broader sectors important for future growth in Downtown Austin.
Selected Set of Sub Sectors | Part 2
Key Sectors by Highest Employee Count in 2025
The 10 largest sub-sectors by 2025 employment are anchored by Employment Services (4,783 jobs) and Computing Infrastructure (3,354 jobs).
Austin’s business services cluster is 1.5 times more concentrated than the nation, underpinned by a major footprint of tech companies including Apple, Google, and Meta. Downtown’s employment services firms service the regional economy - companies like Workrise, Betts, and GQR specialize in placing technical and knowledgeeconomy talent for the energy, tech sales, and healthcare
sectors. Much of the demand pool is concentrated in Austin, with software developers are employed at 2.09 times the national rate, and computer systems analysts at 2.04 times. However, it should be noted that Workrise, which specializes in the energy sector, recently completed a round of layoffs due to federal policy changes and uncertainty.
The mix of staffing firms, tech infrastructure, financial services, media, and security firms reflects Downtown’s diverse yet knowledge-economy-focused employer base.
Key Sectors by Highest Employee Count in 2025
BJH mapped the dominant occupations within each of the 10 largest sub-sectors.
Knowledge-economy roles dominate the highest-employment sectors: Software Developers, Computer & Information Systems Managers, and Sales Reps anchor Computing Infrastructure, while Personal Financial Advisors and Financial Services Sales Agents define the Financial Investment sector. Lower-wage, in-person roles (Security Guards, Janitors, Landscaping Workers, Housekeeping Cleaners) concentrate in Building Services and Waste Management sub-sectors.
This occupational mix signals that Downtown’s workforce spans a wide earnings spectrum, with high-salary white-collar jobs to essential service workers supporting day-to-day operations.
Sub-Sector
Employment Services
Computing Infrastructure Providers, Data Processing, Web Hosting & Related Services
Other Financial Investment Activities
Investigation and Security Services
Media Streaming Distribution Services, Social Networks & Other Media Networks & Content Providers
The sectors driving Downtown Austin’s growth carry the some of the highest potential exposure to automation and AI displacement. Computing infrastructure, financial investment, and office administrative services, among Downtown’s most concentrated and highest-paying sub-sectors, face
the greatest disruption risk, meaning the same specialization that fueled the past decade of growth also creates the greatest vulnerability going forward.
The risk is concentrated at the top of Downtown’s economic pyramid, in the sectors that generate the
most value, pay the highest wages, and occupy the most office space. Although, AI exposure is highest in digital and knowledge-based sectors, recent reporting describes how many industries will see task-level augmentation rather than full job displacement.*
Conclusions
Downtown Austin’s economic and fiscal baseline established in this analysis provides a critical foundation for decision-making across planning, policy, and investment. Understanding where value is concentrated, which sectors are growing, and which occupations are at risk allows the Downtown Austin Alliance and its partners to move from observation to action.
y Workforce development programs can be calibrated to the occupational profiles identified here, prioritizing the skills most in demand across Downtown’s dominant employers.
y Emerging sub sectors, such as arts and culture, wholesale electronics, health practitioners, and credit intermediation, represent concrete targets for tenant recruitment and business attraction, while the occupational profiles of strong and growing sectors like employment services, financial investment, and office administrative services point to specific space and amenity needs that planning and development decisions can anticipate.
y Knowledge-economy tenants in professional services and computing infrastructure require large, flexible floor plates, high-speed connectivity, and proximity to transit and amenities, while the growth of health practitioners and educational services downtown signals demand for smaller, more specialized suites alongside accessible ground-floor retail and services.
Across all of these sectors, the shift toward hybrid work means that shared amenity spaces, activated ground floors, and proximity to food, culture, and recreation are no longer differentiators but baseline expectations for attracting and retaining tenants. The entertainment and hospitality economy, anchored by Downtown’s role as Austin’s arts and cultural destination, remains a powerful complement to the office economy, contributing disproportionately to hotel occupancy tax revenue and reinforcing Downtown’s identity as a place people want to be, not just work. Sustaining and expanding this role, through investment in the arts district and live music and cultural programming, will be essential to long-term fiscal health.
This analysis can be leveraged for the future downtown strategy, one that targets growth in emerging sectors, protects and deepens the entertainment and cultural economy, invests in workforce transitions, and continues to track the metrics pertaining to Downtown’s fiscal and economic resilience.