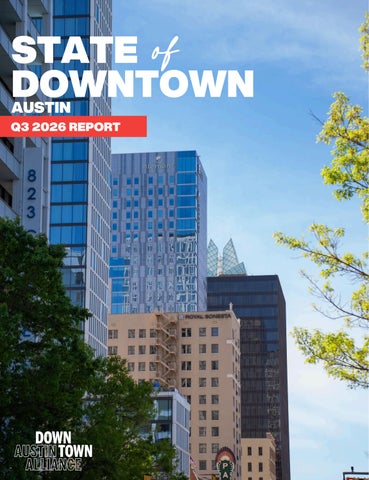
STATE of DOWNTOWN AUSTIN
Q3 2026 REPORT
Waterline, the tallest building in Texas, has
officially opened to the public, delivering approximately 700,000 sq. ft. of office space to the market. The tower contains the 252-room ultraluxury 1 Hotel, 352 rentable luxury housing units, and 27,000 sq. ft. of retail and food & beverage space.
DEVELOPMENT PIPELINE Downtown Development Pipeline Since 2016 (SF) Delivered
Under Construction
Planned
10M SF
10M 8M
teeF erauqS
6M 4M
1.9M SF 1.2M
2M
THREE PROJECTS HAVE DELIVERED IN 2026, ANOTHER 21 ARE ON THE HORIZON Downtown Development Trends National office market trends are prompting a shift in Austin’s development pipeline, with proposed projects moving away from speculative office space toward residential and hospitality uses. DAA is currently tracking approximately 5,800 proposed residential units and 2,300 hotel rooms in the development pipeline. While several significant projects are in the pipeline, the proposed redevelopment of the Austin American-Statesman site stands out as the most transformational, with the potential to reshape the South Central Waterfront.
SF
0
de nn no alP i tc u DT rts Y n 6 oC 52 202 re dn 02 U 42 02 32 0 2 22 02 12 02 02 02 91 02 81 02 71 0 2 61 02
Delivered Projects in 2026
Waterline Hotel Trinity Tru by Hilton Hotel
Three projects were completed in Q3 2026, adding 695 hotel rooms to Downtown Austin’s inventory. The remaining four projects under construction are expected to deliver in 2027 and 2028. Source: Downtown Austin Alliance Emerging Projects, October 2026
4 Projects Under Construction 21 Projects in Planning
OFFICE MARKET ycnacaV %
-1Q
20 2
02
(6 20 2
62 02 3Q
)2 Q
Q
(5
(5 2
20 2
(4 20 2
-3 Q
-1Q
Q
)4
)2 Q
)4 -3 Q
(3
02
20 2
(4 20 2
-3 Q
-1Q
4Q
(2
20 2
(3 2
-3 Q
(2
-1Q
Q
)2 Q
)
)2 Q
)4
)2 Q -1Q
Q 20 2
Historical Downtown Trophy Asset Office Rents & Vacancy Downtown Trophy Asset Asking Rate
Downtown Trophy Asset Vacancy
$70
24%
$65
18%
$60
12%
$55
6%
$50
0
62 02 3Q
)2 Q -1Q (6 )4 20 52 Q - 2 02 3Q (
)2 Q -1Q ( 5 )4 202 42 Q02 3Q (
20 2
20 2
)2 Q -1Q (4 )4 20 32 Q - 2 02 3Q (
(2
(1
)2 Q -1Q (3 )4 202 22 Q 02 3Q (
-1Q
Q
)2 Q
)4 -3 Q
Source: CoStar; Downtown Austin Alliance, Q3 2026
ycnacaV tessA yhporT nwotnwoD
(1
Austin Vacancy
Source: CoStar; Downtown Austin Alliance, Q3 2026
etaR gniksA tessA yhporT nwotnwoD
declined modestly in the first half of 2026 but edged upward following the delivery of Waterline, which added 700,000 sq. ft. of vacant office space. Average office asking rates stabilized in 2026, remaining near $60 per square foot. Indeed’s announcement that it will sublease 300,000 sq. ft. of downtown office space will be reflected in Q4 2026 data, further increasing vacancy rates.
Downtown Vacancy
22% 20% 18% 16% 14% 12% 10% 8% 6% 4% 2% 0
-3 Q
Downtown’s office vacancy rate
Austin Gross Rent Overall
$64 $60 $56 $52 $48 $44 $40 $36 $32 $28 $24 $20
)4
Downtown Office Market Trends
Downtown Gross Rent Overall
tooF erauqS rep tsoC tneR ssorG
OFFICE MARKET RATE STABILIZES AMID RISING VACANCY
Historical Downtown Office Rents & Vacancy
HOTEL CAPACITY EXPANDS TO ACCOMMODATE GROWING SEASONAL DEMAND
Downtown Hotel Market Trends
The third quarter typically brings a seasonal
slowdown in hotel activity as travel shifts toward family-focused destinations and downtown office activity declines. October is traditionally a strong month for downtown, with major festivals and events attracting hundreds of thousands of visitors. The addition of 695 hotel rooms in Q3 expands downtown’s capacity to accommodate growing demand during peak spring and fall festival seasons.
Downtown Hotel Average Daily Room Rate (ADR) Downtown ADR
Austin ADR
$280 $260 $240 $220
$217.78
$200 $180 $160
$151.34
$140 $120 $100 $80
62 02 3Q )2 Q -1 Q (6 20 )4 Q 2 -3 Q (5 )2 20 Q 2 -1Q (5 20 )4 2 Q 3 Q (4 )2 20 Q 2 -1Q (4 20 )4 Q 2 -3 Q (3 )2 20 Q 2 1-Q (3 20 )4 2 Q -3 Q (2 )2 20 Q 2 -1 Q (2 20 )4 2 Q -3 Q (1 20 2 Source: CoStar; Downtown Austin Alliance, Q3 2026
Downtown Hotel Occupancy Rate Downtown Occupancy
Austin Occupancy
100% 89% 79% 68% 58%
63%
47% 37% 26% 16% 5%
62 02 3Q )2 Q 1-Q (6 20 )4 Q 2 -3 Q (5 )2 20 Q 2 -1 Q (5 20 )4 2 Q 3 Q (4 )2 20 Q 2 -1Q (4 20 )4 Q 2 3 Q (3 )2 20 Q 2 -1Q (3 20 )4 2 Q -3 Q (2 )2 20 Q 2 1-Q (2 20 )4 2 Q -3 Q (1 20 2 Source: CoStar; Downtown Austin Alliance, Q3 2026
HOTEL MARKET
DOWNTOWN RETAIL: STRONG DEMAND AMID RISING OPERATING COSTS
Downtown Retail Market Trends
Demand for downtown retail space remains strong, with 21 prospective retailers expected to open locations over the next year. Elevated buildout costs continue to challenge retailers’ ability to secure and sustain storefront space across the region. More than 40 new retail businesses have opened downtown in 2026, with the majority in the food and beverage sector.
Downtown Retail Leasing Activity & Occupancy Leasing Activity SF Total
Occupancy %
72K
99.2%
64K
98.4%
56K
97.6%
96.0%
-4%
$16
-8%
-1Q
Q
(3
20 2
20 2
62 02 3Q )2 Q 1-Q (6 )4 2 02 Q -3 Q (5 )2 2 Q -1Q 02 (5 )4 20 Q 2 -3 Q (4 )2 20 Q 2 (4 20 2 )4
-3 Q
(3
20 2
20 2
20 2
(2
(2
(1
-1Q
Q
20 2
20 2
(3
(3
-3 Q
-1Q
Q
20 2
20 2
20 2
(2
(2
(1
-3 Q
-1Q
-3 Q
62 02 3Q )2 Q -1Q (6 )4 20 Q 2 -3 Q (5 )2 2 Q -1Q 02 (5 )4 20 Q 2 3 Q (4 )2 20 Q 2 (4 20 2 )4
)2 Q
)4
)2 Q
) 4Q
Source: CoStar; Downtown Austin Alliance, Q3 2026
Source: CoStar; Downtown Austin Alliance, Q3 2026
RETAIL MARKET
)2 Q
92.0%
0
$20
-1Q
0
$24
Q
92.8%
4%
)4
8K
8%
$28
-3 Q
93.6%
12%
$32
)2 Q
16K
16%
$36
-1Q
94.4%
$40
Q
24K
20%
)4
95.2%
24%
$44
-3 Q
32K
28%
$48
Select New Openings in 2026 Business Name
Retailer Type
Fleet Coffee List
Coffee & Tea
Jo's Coffee
Coffee & Tea
League Of Rebels Coffee Bar
Coffee & Tea
Sundeck Social
Drinks & Entertainment
Austin Polo Lounge
Drinks & Entertainment
Amy's Ice Cream Truck
Food Truck
La Santa Barbacha
Quick Eats
Neighbors Café and Wine Bar
Quick Eats
The Fresh Monkee
Quick Eats
Austin Sports Club
Restaurant
Nobody's Business
Restaurant
Honest Mary's
Restaurant
Akiba Austin
Retail Goods
Cullen Jewelry
Retail Goods
Source: Downtown Austin Alliance, Storefront Inventory Fall 2026
htworG tneR ylretrauQ
40K
Quarterly Rent Growth
$52
FS rep tneR gniksA NNN
96.8%
NNN Asking Rent per SF
% ycnapuccO
latoT FS ytivitcA gnisaeL
48K
Downtown Retail Rent
Downtown Multi-Family Occupancy & Rent Concessions Occupancy %
Effective Rent Concessions %
Downtown Market Asking Rent per SF
92.5%
7%
90.0%
6%
87.5%
5%
85.0%
4%
82.5%
3%
80.0%
2%
77.5%
1%
75.0%
0
$4.05
10.5%
$3.90
9.0%
$3.75
7.5%
$3.60
6.0%
$3.45
4.5%
$3.30
3.0%
$3.15
1.5%
$3.00
0
$2.85
-1.5%
$2.70
-3.0%
-1Q
Q
20 2
20 2
(3
(3
-3 Q
-1Q
Q
62 02 3Q )2 Q -1Q (6 )4 20 Q 2 -3 Q (5 )2 2 Q -1Q 02 (5 )4 20 Q 2 3 Q (4 )2 20 Q 2 (4 20 2 )4
)2 Q
)4
20 2
20 2
20 2
(2
(2
(1
-3 Q
-1Q
Q
)2 Q
)4 -3 Q
-1Q
Q
20 2
20 2
(3
(3
-3 Q
-1Q
Q
62 02 3Q )2 Q -1Q (6 )4 2 02 Q -3 Q (5 )2 2 Q -1Q 02 (5 )4 20 Q 2 -3 Q (4 )2 20 Q 2 (4 20 2
)4
)2 Q
)4
20 2
20 2
20 2
(2
(2
(1
-3 Q
-1Q
Q
)2 Q
)4 -3 Q
MULTIFAMILY MARKET
Asking Rent % Growth per Year
Source: CoStar; Downtown Austin Alliance, Q3 2026
EFFECTIVE RENT CONCESSIONS CONTINUE TO ATTRACT RESIDENTS Downtown Housing Market Trends
Waterline’s delivery added 352 multifamily
units to downtown’s inventory in Q3, contributing to a shift in overall occupancy levels. Despite softer occupancy, average asking rents continued to rise, reaching $3.92 per square foot. Rent concessions remain attractive for prospective and renewing tenants, with effective rental concessions exceeding 8% in Q3 2026. Demand for urban, walkable living remains strong, with downtown’s accessibility, employment centers and cultural amenities continuing to attract residents.
raeY rep htworG % tneR gniksA
8%
FS rep tneR gniksA tekraM nwotnwoD
9%
95.0%
% snoissecnoC tneR evitceffE
% ycnapuccO
97.5%
Source: CoStar; Downtown Austin Alliance, Q3 2026
Downtown Multi-Family Asking Rent Per SF & Percentage Growth
Q3 2026 SUMMARY Downtown is nearing the end of its current
development cycle, with just four projects under construction. However, momentum is building for the next cycle, with more than 20 projects anticipated to break ground over the next several years. Office vacancy declined during the first half of 2026 following several significant lease signings but edged upward with Waterline’s delivery of 700,000 sq. ft. of speculative office space. Despite this increase, market sentiment remains positive, presenting opportunities for both landlords and tenants. Downtown added 695 hotel rooms in Q3 2026, reflecting continued investment in hospitality and demand for visitor accommodations. Downtown’s retail landscape remains strong, with more than 760 operating storefronts. Drinks and Entertainment represents the largest retail segment at approximately 24% of storefronts. Also, Retail Goods and Body, Health and Fitness have gained momentum, adding 11 new establishments over the past year.
QUESTIONS? Luke Goebel, Economic Development Manager lgoebel@downtownaustin.com
DOWNTOWNAUSTIN.COM