

REPORT
APRIL 2026

PREPARED BY CAELUS

In early 2026, the Downtown Austin Alliance (DAA) conducted a large-scale survey of Downtown users, capturing 706 responses and nine 1:1 interviews across residents, employees, visitors, business owners, and property owners and managers. The survey ran from January 21 to February 28, 2026, amid heavy construction activity, most notably the Convention Center rebuild and the I-35 Capital Express Central Project.
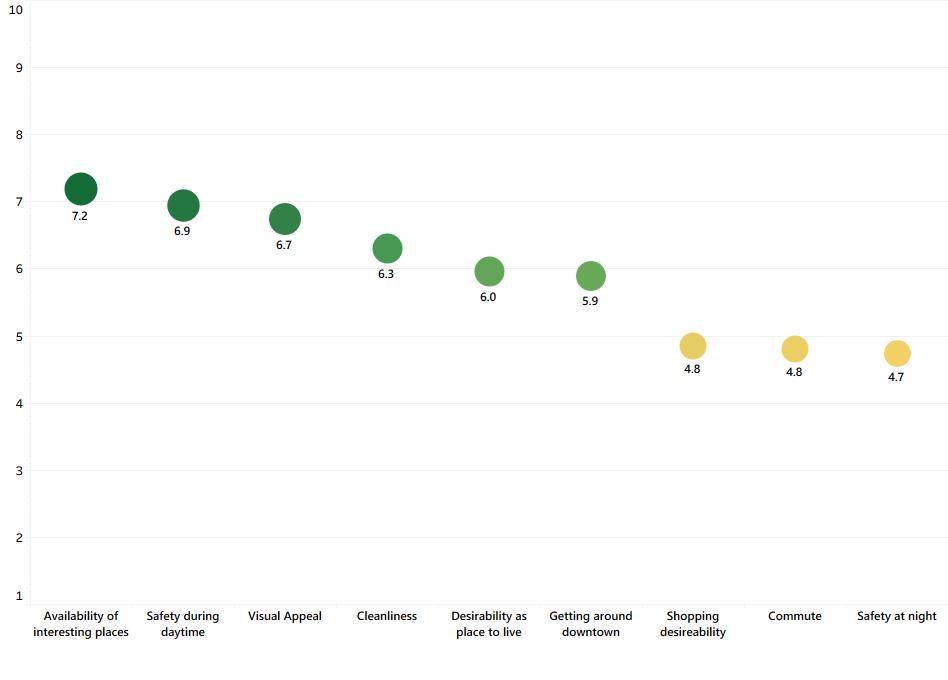
Respondents are cautiously optimistic but divided. Nearly half (48%) agree Downtown is headed in the right direction; a third disagree. Downtown rates well as a destination availability of interesting places (7.2), daytime safety (6.9), visual appeal (6.7), and cleanliness (6.3) all score above 6.0 but nighttime safety (4.7) and commute (4.8) lag, with 44% saying the commute has gotten worse over the past three years.
Homelessness and public safety dominate the call to action. They rank as the top investment priorities across every profile, and 68% cite homelessness or panhandling as the single biggest factor shaping their sense of safety Downtown. Because respondents form these perceptions from direct observation, the DAA must address both underlying conditions and the perception gap.
Construction is the second major drag: 69% describe it as disruptive, with traffic congestion (74%) and street closures (68%) leading the complaints. Open-ended responses surface a deeper concern that rapid development is displacing the local businesses that give Downtown its character.
The DAA itself is a bright spot. 64% rate its performance as good, very good, or excellent, and nearly 80% name the Clean & Safe Ambassadors as its most visible service goodwill that provides a foundation for harder work ahead.
Stakeholder-specific findings reinforce these themes:
• Residents report high quality-of-life satisfaction and strong intentions to stay, but want better grocery access and more affordable dining.
• Employees report high work satisfaction overall, with pockets of concern concentrated in the Convention Center district, where construction has cut foot traffic.
• Visitors express mixed satisfaction but strong return intent (84%), with parking, traffic, and safety concerns functioning as a ceiling on visitation.
• Business owners take a notably cautious, wait-and-see posture, citing parking, construction impact, and a need for better advance notice and timeline transparency on city projects.
• Property owners and managers voice the sharpest frustration with local governance and development friction, while strongly endorsing the DAA's current leadership and ambassador program.
Taken together, the survey suggests a Downtown that works well as a place to visit and experience but faces real headwinds in access, nighttime safety, and the erosion of local character. The DAA enters this moment with substantial public trust and a clear mandate: lead on homelessness and safety, advocate for better construction coordination and communication, and protect the street-level vibrancy that makes Downtown worth showing up for.
Caelus LLC is a research and development firm with roots in the technology sector, where rigorous, user-centered research drives product and service decisions. Founded in 2012 and headquartered in Kirkland, Washington, the firm applies that same standard of research quality to community and public sector work, supporting projects across the full lifecycle from research design and instrument development through analysis and reporting. Caelus team members hold doctoral degrees in empirical research fields and teach at R1 universities.
Past clients include Microsoft, Amazon, Alphabet, and Fidelity Investments, as well as municipal governments and community organizations across the Pacific Northwest and Mountain West. Caelus works with clients across the United States and internationally, with experience in inclusive research design, including multilingual outreach, accessible survey delivery aligned with WCAG standards, and recruitment strategies that engage underrepresented communities.
For the Downtown Austin Alliance, Caelus conducted the 2026 Downtown Austin User Survey, gathering responses from five distinct Downtown populations: residents, employees, visitors, business owners, and property owners and managers. The team applied stratified sampling methods, real-time quality controls, and geospatial analysis to ensure findings are statistically reliable and representative across subdistricts and demographic groups. The firm designed the survey instrument, managed data collection and quality control, and produced this report, including all data analysis and visualizations.
Early in 2026, the Downtown Austin Alliance (DAA) conducted a comprehensive survey of Downtown users to assess their priorities, needs, perceptions, and experiences regarding Downtown Austin’s growth, construction activity, public safety, and overall usability. While efforts to capture user sentiment had previously been conducted, this survey represented the first systematic, large-scale effort to collect and analyze data from a broad cross-section of Downtown users in a consistent, replicable format.
The survey was open from January 21 to February 28, 2026. At the time of data collection, several large-scale construction projects were underway, most notably the complete demolition and rebuilding of the Convention Center and the I-35 Capital Express Central Project. These high-profile projects were part of a broader 25-year period of rapid growth that included over 180 construction and development projects within Downtown's dense, roughly three-squaremile area.
The Downtown Austin community navigated significant social tensions around the time of data collection. In January 2026, reports of U.S. Immigration and Customs Enforcement (ICE) activity Downtown triggered multiple protests and widespread community concern.
On March 1, 2026, a mass shooting on West Sixth Street tragically claimed three lives and injured 15 others. The DAA and Caelus closed the survey immediately following the shooting to prevent acute public safety concerns from skewing results.
Despite these circumstances, the survey yielded a robust and diverse response. The following sections describe the survey's methodology, respondent demographics, and key findings, with relevant context noted where the conditions described above may have influenced results.
The DAA partnered with an independent research and consulting firm, Caelus, to develop, field, and analyze an inaugural user survey for Downtown Austin. The survey included a mix of core questions that gauged universal themes such as safety, accessibility, and overall satisfaction with the Downtown environment, as well as a tailored set of questions specific to one of five Downtown user profiles:
• Downtown residents
• Downtown employees
• Downtown visitors
• Downtown business owners/managers
• Downtown property owners/managers
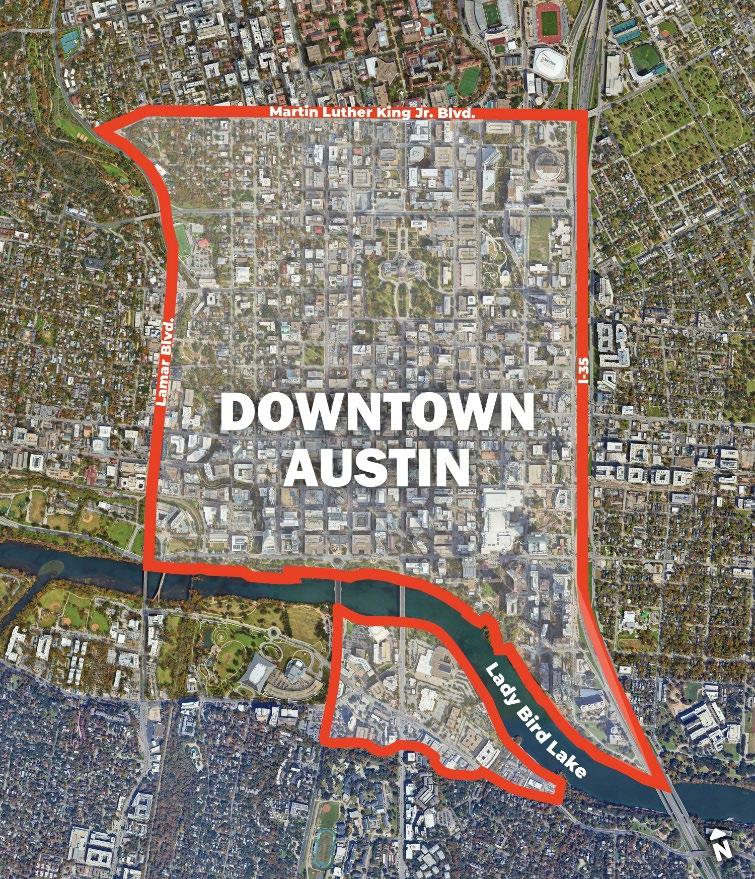
Downtown Austin was defined as the region bounded by I-35, Lamar Blvd, Lady Bird Lake, and Martin Luther King Jr. Blvd, with the addition of the South Central Waterfront region directly south of Lady Bird Lake (Figure 1).
The DAA piloted the survey at the 2025 Holiday Sing-Along & Stroll and refined the instrument based on feedback, shortening it to reduce respondent fatigue and adding questions to capture longitudinal perspectives on Downtown's trajectory.
The survey officially launched to the public on January 21st and remained open until February 28th. Promotional strategies included social media posts, in-person solicitation with a $5 gift card gratuity, and direct emails. Supplementary 1:1 virtual interviews were held with Downtown business owners, property developers, and civic leaders to add qualitative depth to survey findings and capture the perspectives of harder-to-reach profiles.
Caelus set recruitment targets for each user profile in proportion to the estimated concentration of users across Downtown Austin's subdistricts, prioritizing geographic breadth across the study area. The resulting sample reflects a broad cross-section of engaged Downtown users across all five profiles and geographic areas.
Data collection yielded 706 complete survey responses and nine 1:1 virtual interviews with Downtown stakeholders. A breakdown of the respondent pool is provided in Table 1
Table 1. Respondent demographics
Seaholm West (Seaholm, Republic / W 6th, and 2nd Street)
Findings follow the survey's overall structure, with results organized into a central section of core findings and five additional sections corresponding to each user profile: residents, employees, visitors, business owners, and property owners.
All respondents answered a series of core questions gauging their overall perceptions of Downtown. The results of these questions across all 706 respondents are detailed below.
Respondents express mixed views on whether Downtown Austin moves in the right direction, signaling that perception itself stands as a strategic challenge.
Respondents expressed mixed views on whether Downtown Austin is headed in the right direction, as shown in Figure 2. Nearly half (48%) agreed with the statement to some degree, with 11% strongly agreeing and 37% somewhat agreeing. However, a substantial share pushed back: 33% disagreed, including 19% who somewhat disagreed and 14% who strongly disagreed. Another 16% neither agreed nor disagreed.
Is Downtown Austin Headed in the Right Direction?
Level of Agreement
Percent of Respondents
The results suggest a cautiously optimistic but genuinely divided outlook: more respondents lean positive than negative, but the margin is not commanding, and the relatively high share of disagreement signals that many users have real concerns over the direction Downtown is headed. This tension between optimism and dissatisfaction runs through many of the findings that follow.
Respondents were asked to rate nine Downtown attributes on a 1-to-10 scale (Figure 3) and indicate whether each had improved, stayed the same, or gotten worse compared to three years ago (Figure 4).
Average Ratings of Downtown Austin Attributes

Average Rating (110)
Downtown Attribute

Figure 3. Using a 10-point scale where 1 is “poor,” and 10 is “excellent,” how would you evaluate Downtown Austin in terms of the following attributes?
Availability of interesting places
Visual Appeal
Cleanliness
Safety during daytime
Attribute
Desirability as place to live
Shopping desirability
Getting around downtown
Safety at night
Commute
Percent of respondents
Figure 4. Compared to 3 years ago, do you think Downtown Austin today is better, about the same, or worse in terms of the following?
Together, the two measures tell a consistent story:
• Downtown Austin earns its strongest marks as a destination: Availability of interesting places (7.2), Safety during daytime (6.9), Visual Appeal (6.7), and Cleanliness (6.3) all scored above 6.0, and respondents largely see these attributes as stable or improving. Visual Appeal stands out in particular: 36% of respondents say it has gotten better, and only 13% say it has gotten worse, suggesting broad agreement that Downtown looks and feels good.
• Ratings drop into the middle tier for Desirability as a place to live (6.0) and Getting around Downtown (5.9), and the trend data adds cause for concern: 29% of respondents say getting around has gotten worse, compared to only 13% who say it has improved.
• The clearest warning signs appear at the bottom of the scale. Safety at night received the lowest average rating (4.7), and 34% of respondents say conditions have deteriorated
over the past three years. Commute scored similarly low (4.8), but its trend data is the most troubling in the entire set. 44% of respondents say the commute experience has gotten worse, while only 4% say it has improved.
Taken together, the results suggest that Downtown Austin performs well as a place to visit and experience, but respondents increasingly feel that getting to, moving through, and feeling safe in Downtown after dark are heading in the wrong direction.
A vibrant, welcoming street-level environment where dining, entertainment, and events thrive remains essential to Downtown’s future.
Data on respondents’ reasons for visiting Downtown reinforce the view of Downtown as primarily a leisure destination (Figure 5). Setting aside employment and residential responses, the top draws were dining and restaurants (49%), entertainment and nightlife (46%), and events and festivals (34%), while utilitarian trips such as business meetings (13%), and conventions or conferences (8%) ranked at the bottom. For the DAA, this underscores the importance of maintaining a vibrant, welcoming street-level environment where the dining, entertainment, and events ecosystem can thrive.
Respondents' Reasons for Visiting Downtown
Conventions or conferences
Business meetings
Visiting friends or family
Shopping
Percent of Respondents Visit Reason
Parks and outdoor spaces
Cultural attractions (museums,…
Events and festivals
Entertainment and nightlife I live here
Dining and restaurants I work here
Respondents were asked what issues, if invested in, have the greatest opportunity to move Downtown Austin forward (Figure 6).
Homelessness services and support
Public safety improvements
Better parking availability/affordability
Enhanced public transportation
Support for local businesses
Cleanliness and maintenance
Improved walkability and pedestrian infrastructure
More affordable housing
More parks and green spaces
More retail and shopping options
Infrastructure improvements (streets
Better street lighting
Percent of Respondents
Figure 6. What issues, if invested in, have the greatest opportunity to move Downtown Austin forward?
56% of respondents selected homelessness services and support as the top priority to move Downtown forward, with public safety (31%) ranking second.
• Respondents consistently selected homelessness services and support (56%) and improved public safety (31%) as top priorities to move Downtown forward. As openended responses reveal, many respondents view these issues as two sides of the same coin:
This sounds cruel, but less violent / disruptive homeless people. I'm a pregnant woman and it's scary getting harassed."
- Survey respondent, Downtown employee
The ignored population of unhoused that harass people and cause fear and uncertainty (they should be helped, not brushed aside, but there is a problem and we cannot let it persist or ignore it)."
- Survey respondent, Downtown resident
While many respondents acknowledged that addressing the unhoused population in Downtown is a challenging task without simple solutions, reducing homelessness remains the central request across all respondent profiles, and the key intervention that would move the needle.
Respondents point overwhelmingly to visible disorder as the factor most shaping their sense of safety Downtown.
When asked what factors most influence their sense of safety Downtown, respondents pointed overwhelmingly to visible disorder (Figure 7).
Contributing Factors to Sense of Safety
Homelessness or panhandling
Disorderly behavior (e.g., public intoxication, aggressive…
Police or security presence
Factor
Construction areas or detours that reduce visibility or access
Cleanliness and maintenance of public spaces
Time of day (e.g., late night)
Street lighting and visibility
Presence of other people
Experience at transit stops/stations
Personal or friends' experiences downtown
News/social media reports about crime
Figure 7. What most impacts your sense of safety Downtown?
Percent of Respondents
• Homelessness or panhandling topped the list by a wide margin, with 68% of respondents selecting it as a factor. Disorderly behavior, such as public intoxication, came in second at 50%, reinforcing that respondents connect their safety less to crime itself and more to what they observe and encounter on the street.
Visibility of homelessness - while most unhoused people in town are harmless and doing their own thing, the visibility of those folks, along with what they bring (like leaving trash) can make it look like Downtown is not a desirable place to live, work and play.”
- Survey respondent, Downtown employee
• Police or security presence followed at 26%, suggesting that visible enforcement also shapes how safe respondents feel, though at a notably lower rate than the social disorder factors.
• Physical environment factors, including construction and detours (19%), cleanliness and maintenance of public spaces (19%), street lighting and visibility (12%), appear in the
middle of the list, indicating that the built environment plays a secondary but meaningful role.
• Factors like time of day (15%), presence of other people (12%), and transit stop experiences (10%) round out the picture.
• Notably, indirect or mediated sources of information, such as personal or friends' experiences (9%) and news or social media reports about crime (5%), rank at the bottom, suggesting that respondents base their safety perceptions primarily on what they directly observe Downtown rather than what they hear or read about it.
• In addition to the provided answer choices, several respondents wrote in concerns about motorists driving recklessly and endangering pedestrians, as well as the risks posed by bicycle lanes and motorized scooters.
Poorly designed and executed cycling infrastructure; lack of respect for existing infrastructure by motorists (including various motorized 2-wheel vehicles) and sometimes pedestrians.”
- Survey respondent, Downtown visitor
The drivers that don’t ever look for bikers or pedestrians!”
- Survey respondent, Downtown resident
Interview participants echoed findings that Downtown safety concerns stem less from actual crime rates and more from perceptions of safety.
Essentially, that's the biggest hurdle down here, is perception of safety and willingness of people that live Downtown and other Austin... tourists to come down to the street and feel safe and that they can walk around and go to these businesses"
- Downtown revitalization developer and investor
Some interview participants felt that concerns over safety and rampant homelessness did not reflect Downtown’s reality. When asked why perceptions of crime were so high, one participant curtly put it, “I think that’s because people have not lived other places.”
Regardless of whether perceptions align with reality, survey results clearly indicate that homelessness and public safety are critical concerns for Downtown users. These results call on DAA to address both the underlying conditions and the perception gap, investing in on-theground interventions while also communicating clearly to Downtown users about existing safety and homelessness response efforts.
69% of respondents describe construction as disruptive to their Downtown experience. Only 14% view it as beneficial in any way.
At the time of data collection, Downtown Austin was in the midst of significant construction activity, including the full demolition and rebuild of the Convention Center and the I-35 Capital Express Central Project, two projects with a substantial footprint in and around the Downtown core. Survey respondents were asked how ongoing construction impacts their experience of Downtown (Figure 8). Nearly seven in ten respondents (69%) described construction as disruptive to their Downtown experience, while only 14% viewed it as beneficial in any way.
Impact of Construction on Downtown Experience
Mostly beneficial
Percent of Respondents Construction Impact
Somewhat beneficial
No noticeable effect
Somewhat disruptive
Mostly disruptive
8. What effect has construction activity had on your experience of Downtown Austin?
Respondents pointed overwhelmingly to access and mobility issues as the key drivers of construction-related frustrations. Traffic congestion (74%) and sidewalk and street closures (68%) ranked as the top two inconveniences by a wide margin, suggesting that construction's most-felt impact is not noise or business disruption but rather the friction it creates in getting into and moving through Downtown. Duration of projects (53%) and parking challenges (42%) also ranked relatively high, indicating broader frustration with construction that lingers and compounds over time.
Traffic congestion
Sidewalk/street closures
Duration of projects
Parking challenges
Impact on businesses Noise
Percent of Respondents Construction concerns
Figure 9. What are your primary construction-related concerns?
Several write-in responses cited noise, light, and particle pollution from construction as additional concerns.
Dust and pollutants. Constantly sneezing. Also working in evenings and weekends. City needs to impose quest hours. Working people need to be able to rest when they get home.”
- Survey respondent, Downtown resident
I had cranes shining lights in my window with zero accountability. I called everyone. Zero traction. I had to move. This was “the republic.”
- Survey respondent, Downtown resident
These responses suggest that noise, light, and pollution mitigation, along with clearer accountability channels for residents, represent meaningful opportunities for the DAA and city partners to improve the Downtown living experience during this period of growth
In addition to the inconveniences posed by ongoing construction, several write-in responses suggested that Downtown development has sterilized the distinct, “weird,” locally rooted character that many respondents see as fundamental to Downtown's appeal.
It seems like the city is more interested in packing the skyline with high-rent towers than preserving the local character."
- Survey respondent, Downtown employee
Tearing down everything that made this city unique and the city council selling its soul to developers and Silicon Valley Tech firms and their tedious community of wealthy tech
professionals… Austin City Council sold us out to every corporation that flashed a promise of money brought into our city.”
- Survey respondent, Downtown employee
These concerns point to a pattern at the root of Downtown's character loss: rapid commercial development has driven up rents and lease rates, pushing out the small, locally owned businesses that give Downtown Austin its identity. As property values climb, landlords increasingly terminate leases with long-standing tenants to pursue renovation projects or attract corporate tenants willing to pay higher rents. Interviews with Downtown stakeholders familiar with business interests and leasing practices illustrate this phenomenon:
It’s getting sterilized a bit, just because local businesses have a harder time succeeding and sticking around. You had a lot of development that’s displaced people that were just tenants that didn’t own their own space.”
- Entertainment venue owner and property investor
When you are factoring in Class A rents that are 60 bucks a foot and the operating expenses are 25 to 30 bucks a foot, and then you got to pay parking on top of that. I mean, my question is, who the hell can afford that if you're not a national law firm, a venture capitalist, a private equity firm... The local mom and pops, you know, like, where do they go?"
- Commercial real estate broker and investor
The survey data reinforces this picture: Downtown's desirability as a shopping destination scored an average of just 4.8 (Figure 2), and respondents across profiles noted the visible shift from independent businesses to corporate chains.
Lack of affordable retail means too many chains and not enough soul.
- Survey respondent, Downtown employee
Too much focus on generic businesses that are only appealing to business people who are only here for a few days or other people who aren’t really engaging with Austin culture."
- Survey respondent, Downtown visitor
What emerges is not simply frustration with construction or change, but a recognition that the economic forces driving Downtown development are actively displacing the businesses and culture that make Downtown worth visiting, working in, and investing in.
Across every channel and user profile, respondents voice genuine appreciation for the DAA’s efforts to keep Downtown safe and clean.
Whatever frustrations stakeholders carry about Downtown Austin, few extend them to the DAA. Across all data collection channels and user profiles, respondents expressed genuine appreciation for the DAA’s efforts to keep Downtown safe and clean. Nearly three-quarters of survey respondents report some degree of familiarity with the organization, and nearly a third describe themselves as very familiar (Figure 10). Clean & Safe Ambassadors stand out as the DAA's most visible service, with nearly 80% of respondents naming the program, followed by public space improvements (47%) and advocacy efforts (38%). That visibility translates into broadly positive performance ratings: 64% of respondents rate the DAA's performance in advancing its mission as good, very good, or excellent, while just 7% rate it poor. Notably, 14% selected "unsure," suggesting that a meaningful share of Downtown users remain unfamiliar with what the DAA does even if they recognize the name.
on DAA's performance
Figure 10. How familiar are you with the Downtown Austin Alliance and its services?
respondents
Figure 11. The mission of the Downtown Austin Alliance is to preserve and enhance the value and vitality of Downtown Austin for everyone. How would you rate the DAA's performance in advancing that mission?
While the survey didn’t provide an open-ended field for DAA-specific feedback, respondents chose to spotlight the organization anyway, with many citing it as Downtown’s primary strength:
Honestly, DAA - they help keep our Downtown beautiful and as a resident, I know I feel a litle safer when I see an ambassador on the same street as me. The impact that the DAA team (most importantly the ambassadors) is significant to our Downtown district.”
- Survey respondent, Downtown employee
The survey's promotion on Reddit drew similar praise from community members who volunteered their appreciation unprompted:
I’m so grateful for the Downtown Austin Alliance team. I can’t even imagine what it would be like without yall.”
- r/Austin Reddit commenter
As someone who lives less than a mile from Downtown and whose kid’s daycare is Downtown, I just gotta say how grateful I am for DAA. Keep up the excellent work!”
- r/Austin Reddit commenter
Together, these responses point to an organization that has built real goodwill on the ground. The DAA's brand is not just recognized, but trusted.
Clean and Safe Ambassadors
27 DAA Ambassadors completed the survey, offering a distinct perspective; they know Downtown more intimately than almost any other user group, and their responses reflect that on-the-ground depth. Their ratings of Downtown conditions track closely with the broader respondent pool: cleanliness averages 6.9 out of 10, daytime safety 7.0, and nighttime safety a notably lower 5.3.
Where ambassadors diverge from other groups is in the candor and specificity of their openended feedback. Homelessness dominates their responses, surfacing as the most-cited weakness and the top investment priority by a wide margin. Beyond the humanitarian dimensions, ambassadors flag the challenge of managing people experiencing mental illness and those who have left treatment programs, pointing to a gap that cleanliness and safety interventions alone cannot fill. Internally, ambassadors also raise workforce concerns: several call for more recognition of long-tenured staff, better pay, improved equipment, and more training and funding for the safety ambassador program itself.
Taken together, ambassador responses paint a picture of a team that is proud of its work and deeply invested in Downtown's success, but wants more resources, more support, and a more coordinated citywide response to homelessness.
The survey captured the perspectives of 247 Downtown employees. Respondents work across 12 sectors (Figure 13), with government and professional services each representing the largest shares at 16%, followed by hospitality/hotel (12%), restaurant/bar/food service (10%), and technology/IT and arts/entertainment/cultural at 9% each. Work schedules also varied (Figure 12). While weekday mornings and midday hours accounted for the largest share of work hours (32%), respondents reported working across all time periods, including evenings, late nights, and weekends.
Geographically, employee respondents interact most often with the Congress subdistrict (41%), though workers reported meaningful engagement across all nine Downtown subdistricts, including the Convention Center (13%), Seaholm West and Innovation District (11% each), and the Entertainment District (8%). Together, these distributions reflect a sample that spans sectors, schedules, and areas of Downtown Austin.
Downtown employees report high work satisfaction and strong commitment to staying Downtown, suggesting the workforce remains anchored despite broader concerns.
Likelihood to Continue Working Downtown
Downtown employee respondents reported high levels of both work satisfaction (Figure 16) and commitment to staying Downtown (Figure 17). Three in four employees (76%) reported feeling satisfied with working in Downtown Austin, with 27% reporting they are very satisfied and 49% somewhat satisfied. Only 13% expressed some level of dissatisfaction. This positive sentiment aligns closely with employees' likelihood to continue working Downtown: 83% said they are likely to remain with a Downtown employer, including 54% who said very likely. Just 4% reported they are unlikely to continue working Downtown, while 13% expressed uncertainty. Together, these findings suggest that Downtown Austin retains a strongly committed workforce with broadly positive attitudes toward their work environment.
While satisfaction levels were generally high across the Downtown workforce, one notable exception emerged: Restaurant/Bar/Food service workers were three times more likely than the employee average to report feeling dissatisfied with working Downtown (32% somewhat dissatisfied). Reports of dissatisfaction were heavily concentrated in the Convention Center district, where respondents cited the impact of nearby construction on getting to work, finding parking, and earning income.
The ongoing construction is killing small businesses, especially service industry.”
- Service industry worker, Convention Center district
The Convention Center is out of commission for the next several years. I don’t know if I can keep working in this area or if my restaurant will even make it.”
For service industry workers who rely on tips for income, the diminished foot traffic and reduced tourism from the closed convention center represent a direct loss of income, not just an inconvenience. This makes them among the most financially vulnerable to Downtown's current construction and transition.
When asked what amenities or improvements would most enhance their Downtown work experience, employees identified affordability and access as their top priorities (Figure 18).
Employees' Desired Downtown Improvements
More affordable lunch options
Better commute options
Improved safety
Better/cheaper parking
Better public transit
Quiet outdoor spaces
More retail/services nearby
Nothing - satisfied as is
Figure 16. What amenities or improvements would enhance your Downtown work experience?
Nearly half of respondents (49%) selected more affordable lunch options, making it the most commonly cited improvement, followed closely by better commute options (46%), improved safety (45%), and better or cheaper parking (40%). Better public transit rounded out the top five at 39%. Notably, these five items clustered tightly together, suggesting that cost, safety, and getting to and from work are broadly shared concerns rather than niche preferences. Quiet outdoor spaces (19%) and more nearby retail and services (17%) ranked lower, indicating that while employees value these amenities, they are secondary to more immediate practical needs. Only 3% of employees selected "nothing," indicating that nearly all respondents see meaningful room for improvement in their Downtown work experience.
Employees' priorities cluster around cost, access, and safety. The following opportunities address each.
• Affordable lunch and daily spend: Partner with Downtown businesses to offer employee-focused discounts or a coordinated "Downtown worker" pricing network. This drives foot traffic to participating businesses while directly addressing employees' topcited priority.
• Construction impact mitigation for service workers: Reroute foot traffic toward businesses open near the Convention Center construction zone through wayfinding, signage, and promotional efforts that signal "open for business." For tip-dependent workers, even modest increases in foot traffic translate directly to income.
• Commute cost relief: Promote pre-tax transit benefits, coordinate with employers on transit pass programs, or negotiate employee parking rates at underutilized garages. Better commute options and cheaper parking together represent the second-largest cluster of employee priorities.
• Off-hours safety: Employees work evenings and late nights at rates visitors don't. Lighting improvements, activated corridors, and visible security presence targeted to offpeak hours would serve this population more directly than daytime-focused interventions.
• A Downtown worker program: Bundle discounts, transit benefits, and safety resources under a unified "Downtown worker" identity. The tight clustering of employee priorities suggests a coordinated program could address multiple pain points at once while giving DAA a direct channel to this constituency.
Residents who experience Downtown around the clock reflect the broader tensions identified in the Core Questions section most acutely.
The 222 residential survey respondents represent a relatively established resident base, reporting a near-even split among those living Downtown for less than 2 years (25%), 3-5 years (30%), 6-10 years (24%), and longer than 10 years (22%). Nearly all respondents live in an apartment that they either rent (49%) or own (41%).
Walkability and urban lifestyle drive residential choice. 82% of residents selected walkability as a reason for living Downtown, and 78% cited urban lifestyle preference, with dining and entertainment ranking third at 68% (Figure 19). Proximity to parks (48%), cultural amenities (44%), and not needing a car (36%) also drew substantial shares. Proximity to work ranked lowest at 26%, suggesting that lifestyle and amenity considerations outweigh commute convenience for Downtown residents.
Reasons for living Downtown
Walkability
Urban lifestyle preference
Dining and entertainment
Proximity to parks
Cultural amenities
No need for a car
Building amenities
Proximity to work
Figure 17. Why did you choose to live Downtown?
Percent of respondents
Residents’ priorities mirror those of other profiles: nearly three in four residents (74%) identify safety and security as a top quality-of-life factor, making it the dominant concern by a wide margin (Figure 20).
Factors Impacting Residents' Quality of Life
Safety and security
Cleanliness
Access to nature/green space
Factor
Neighbor/community feel
Access to retail/services
Cost of living
Noise levels
Traffic and parking
Percent of respondents
Figure 18. Which factors most impact your quality of life?
As write-in responses indicate, visible homelessness has substantially degraded residents’ feelings of safety Downtown:
The homeless situation in the Downtown area needs to be addressed. Many individuals experiencing homelessness also appear to be struggling with emotional or psychological distress, which has resulted in frequent yelling and disruptive behavior on the streets. This has made walking in the area increasingly uncomfortable. On several occasions, individuals have entered my building’s lobby, which has caused concern for residents’ safety. As a result, my household no longer feels as safe as we once did. This is a significant change, and it is something I have observed developing over the past five years.”
- Survey respondent, Downtown resident
Cleanliness ranked as respondents’ second-highest priority at 42%, followed by access to nature and green space (37%) and neighbor and community feel (31%). Notably, only 24% of respondents cited cost of living as a top factor impacting their quality of life, a finding that likely reflects Downtown Austin's residential demographics: with median rents among the highest in the city, Downtown has increasingly attracted higher-income households for whom affordability is less a daily constraint than a background condition of choosing urban living.
Grocery access and dining affordability stand out as the most significant service gaps (Figure 21). Half of residents (49%) identified full-service grocery stores as a missing amenity, and 45% flagged affordable dining options. These gaps appeared in open-ended responses as well, as respondents expressed their views on Downtown’s most pressing weaknesses:
Need affordable restaurants. All the new ones are high end steakhouses. Wider variety of cultural food that isn't high end is needed as well.”
- Survey respondent, Downtown resident
All the cheap restaurants and bars have been driven away. There's no affordable grocery store and parking for guests is absurd.”
- Survey respondent, Downtown resident
Hardware and home goods stores ranked third at 34%. These top three responses point to unmet everyday retail needs. Quieter outdoor spaces (24%) and pharmacies (20%) also drew notable shares. 15% of respondents selected an option labeled "other," with many write-in responses expressing a desire for greater police presence.
Full-service grocery stores
Affordable dining options
Hardware/home goods stores
Quiet outdoor spaces
Pharmacies
Healthcare facilities
Parks and playgrounds
Fitness facilities
Schools (K-12)
Pet services
Childcare facilities
Percent of respondents
Figure 19. What amenities or services are most missing Downtown?
While the question framed residents' unmet dining needs as a lack of affordable options, writein responses indicate the gap lies not in price, but in formality:
Not enough family restaurants. Downtown Austin has white table restaurants or over 21 establishments.”
- Survey respondent, Downtown resident
Residents report high satisfaction with their Downtown quality of life and a strong intent to stay long term.
Despite these service gaps, residents report high satisfaction with their Downtown quality of life: 82% are either very satisfied (32%) or somewhat satisfied (50%), while only 13% express dissatisfaction and 5% are neutral. Satisfaction rates hold steady across subdistricts, though northern residential areas (Judges Hill/Northwest, State Capitol, and the Innovation District) show a slightly higher share of very-satisfied responses.
Residents also express strong intentions to stay: a third (33%) plan to live Downtown indefinitely, and another 15% are unsure of their timeline. Nearly half of respondents, in other words, have no plans to leave or haven't ruled out a long-term stay.
Residents' concerns cluster around safety, everyday service access, and the felt character of Downtown. The following opportunities address each.
• Homelessness and visible disorder: Expand ambassador coverage in residential corridors during early-morning and evening hours, when residents are most likely to be on foot, and create a simple, publicized reporting channel so residents know how to flag concerns and what to expect in response.
• Everyday retail and grocery access: Half of residents identify a full-service grocery store as the top missing amenity. Develop a retail recruitment case to property owners in high-density residential subdistricts, leading with demand data from this survey to demonstrate that the residential customer base exists.
• Family-friendly and mid-range dining: The gap isn't affordability, it's format. Target recruitment outreach toward casual, family-friendly restaurant concepts and highlight residential density and daytime foot traffic as selling points to prospective tenants.
• Resident communications: Residents want to feel that Downtown is a neighborhood, not just a commercial district. A lightweight resident-facing newsletter or digital channel, distinct from DAA's general communications, could surface programming, safety updates, and local business news directly to this constituency.
Downtown Austin visitors skew local and experienced. The vast majority (83%) come from within Austin, with another 13% from the greater metro area, meaning out-of-town visitors represent
Origin of Downtown visitors
Frequency of Downtown visits
just 4% of respondents (Figure 22). Most visit frequently (Figure 23): 41% come weekly or more, and another 33% visit monthly. Only 2% were first-time visitors.
Despite their familiarity with Downtown, visitors express mixed satisfaction, pointing to access and experience gaps that limit return visits.
Despite their familiarity with Downtown, visitors express mixed satisfaction (Figure 24). Just over half (52%) report being satisfied with their Downtown experience (12% very, 40% somewhat), while 36% are dissatisfied (24% somewhat, 12% very). Return intent is considerably stronger (Figure 25): 84% say they are likely to visit again, but willingness to recommend tells a more cautious story (Figure 26). Only 53% say they would recommend Downtown Austin to others, and nearly a quarter remain neutral. Given that this is a largely local, repeat-visitor population, a 24% neutral and a 24% combined "unlikely to recommend" rate warrants attention.
The gap between return intent and recommendation likelihood deserves closer attention. 84% of visitors say they are likely to return, yet only 53% say they would recommend Downtown Austin to others (a 31-point gap). For a population that is overwhelmingly local and visits frequently, this pattern suggests that Downtown has secured habitual visitation without generating equal enthusiasm.
This distinction matters for DAA. Repeat visits from local regulars reflect habit as much as preference; Downtown is familiar and woven into daily routines, but recommending it to others is a higher bar: a visitor must feel the experience is good enough to vouch for it. The data suggest that for nearly half of respondents, it isn't.
The data that follows helps explain why. Parking difficulty or cost prevails as the leading challenge for Downtown visitors, with 74% citing it among their top difficulties.
Parking difficulty or cost
Traffic congestion
Construction obstacles
Safety concerns
Cleanliness issues
Limited public restrooms
Confusing to navigate
No significant challenges
Percent of respondents
Figure 25 What challenges have you encountered during your visit? (Select all that apply)
Several respondents identified parking scarcity as a key deterrent to visiting Downtown
Parking, it’s a nightmare. Stops me going to many night time events because I just don’t want to try and find somewhere in the dark. It’s too hard to try and find signs saying it’s an area you can park and pay. I’d love easy parking, I don’t even mind paying extra to feel safe and non stressed about parking.”
- Downtown visitor
I used to work Downtown and I literally had to pay to park Downtown all my money was going to parking and it sucks… I’m not joking when I say I would visit Downtown every damn
day if parking was fixed, no joke there was a time where I went to go park in a parking garage and it was almost $100. That’s crazy.”
- Downtown visitor
Traffic congestion (59%) and construction obstacles (55%) round out the top three difficulties, painting a consistent picture: the primary barrier to visiting Downtown is the inconvenience and expense of getting there and getting around. Open-ended responses describe a frustrating sequence: heavy traffic, scarce parking, high fees, and long walks from car to destination. Many respondents called for more frequent and comprehensive public transportation into and within Downtown, particularly a return of the Dillo Trolley.
Public transit! I want to be able to visit Downtown without having to deal with the mess of driving and finding parking. Current public transit options like the red line aren’t frequent enough for it to be reasonable for a family with small children.”
- Downtown visitor
Safety concerns rank fourth (49%) and compound the access problem: when visitors park far from their destination, they often walk long distances through areas where they feel unsafe. Many cite negative experiences of aggressive panhandling
Several respondents said they would visit more often if getting in and out were easier, though others perceive parking difficulties as an insurmountable barrier, regardless of what Downtown has to offer.
Faster and more frequent public transit so it was quicker to get in and leave, especially in the evening, without having to deal with congested roads and parking prices. It doesn’t matter how great Downtown activities are if I can’t get there in time or can’t get home in a reasonable way.”
- Downtown visitor
Taken together, these findings suggest that access functions as a ceiling on Downtown visitation. Improvements to programming, amenities, or the visitor experience itself may have a limited impact if the friction of getting in and out of Downtown remains high. Visitors are not indifferent to what Downtown has to offer; many express genuine enthusiasm for it. But for a meaningful share of respondents, parking and transit barriers are nonnegotiable obstacles that no amount of Downtown appeal can overcome.
Raising the ceiling on visitation starts with access. The following opportunities address the barriers visitors cite most often, with an emphasis on near-term, targeted action over systemic overhaul.
• Wayfinding for parking availability: Many visitors describe hunting for parking rather than knowing where to go. Real-time parking availability signage or a simple digital map of garages and lots with pricing could reduce the perception of scarcity even before supply changes.
• First/last mile connections: The gap between where visitors park and where they want to go is a recurring theme. Shuttle loops, bike-share expansion, or even clearly marked walking routes could shorten that perceived distance and address the safety concern simultaneously.
• Evening-specific transit frequency: Respondents specifically mention evening events as a pain point. Targeted increases to transit frequency during evening hours, rather than a wholesale system overhaul, are a more achievable near-term intervention.
• Parking validation partnerships: Coordinating with Downtown businesses and venues to offer validated or discounted parking could reduce sticker shock without requiring new infrastructure.
• Lighting and activation along walking corridors: Safety concerns along the walk from parking to destination are hard to solve directly, but well-lit, activated corridors (vendors, seating, programming) can shift the felt experience without requiring large capital investment.
The survey captured responses from 20 Downtown business owners and managers across a range of sectors, with restaurant and food service, hospitality, and arts and entertainment representing the largest shares (Figure 26). The majority (75%) operate local businesses rather than national chains, reflecting a respondent pool weighted toward the independent operators who are most sensitive to Downtown's economic shifts and most directly shaped by its streetlevel conditions.
Businesses' Primary Industry
Despite operating in one of the country's most dynamic urban cores, business owners express a notably cautious outlook. Just 36% agree that Downtown Austin is headed in the right direction, a lower share than any other respondent profile. Roughly a quarter have seen their business performance decline since they began operating Downtown (Figure 28), and only 46% say they would recommend Downtown as a business location to others. Most owners plan to stay at their current size over the next two years, with only a handful planning to expand and one weighing relocation outside Downtown (Figure 27). The overall picture is one of resilience rather than momentum: business owners are holding on, but the conditions for growth feel tenuous.
Figure 28. How has your business performed Downtown since you began operating here?
Figure 27. What are your plans for your Downtown business in the next 2 years?
Parking tops the list of operational challenges named by Downtown businesses, ahead of safety, foot traffic, and labor costs.
When asked to identify their biggest operational challenges (Figure 29), parking topped the list by a wide margin, cited by 70% of business owner respondents. Homelessness impacts ranked second at 50%, followed by construction impacts (45%) and rent and operating costs (35%).
The parking issue runs in two directions simultaneously. Business owners struggle to attract customers who won't come Downtown if they can't park affordably or predictably, and they struggle to retain employees who can't afford to park near work and lack viable transit alternatives.
About 60% of our staff drive themselves or depend on cars to get to work... those challenges as it relates to parking mean that either they're having to pay significant amounts of money for parking or they've got to park further away and then commute somehow from within the urban core.”
Challenges
Parking (customers or employees)
Homelessness impacts
Construction impacts
Rent/operating costs
Safety concerns
Employee recruitment/retention
Customer foot traffic
Competition
Taxes/regulations
Percent of respondents
Parking is the big one. I mean them being able to get to work – it doesn't make any sense to pay 30 bucks for parking to work a happy hour shift."
- Entertainment venue owner
The logistics problem extends to delivery and supply chains. One business owner flagged that restricted commercial loading zones and congested streets make it increasingly difficult for delivery drivers and third-party pickup services to reach Downtown businesses, a challenge the city has not meaningfully addressed and one that business owners specifically named as an area where they want DAA advocacy.
Homelessness surfaces both as an operational concern and as a public safety issue that business owners feel acutely. Open-ended responses called for better safety and a more active police presence. In interviews, one business owner described near-daily instances of loitering, vandalism, and violence near his restaurant involving unhoused individuals that he said went largely unreported.
One of the challenges that we started facing just in the last six months or so, most mornings when we get to work, a member of the unhoused community has defecated somewhere on or around the property. And as you can imagine, that's not ideal in any scenario. It's certainly not ideal for a restaurant."
- Restaurant owner, 2nd Street District
Overall, these findings point to a compounding cycle in which access constraints and high operating costs limit customer and workforce stability, while visible disorder further suppresses
demand, underscoring the need for coordinated, near-term interventions that make Downtown easier to reach, safer to navigate, and more viable for doing business.
Construction stands out as a near-universal source of stress for business owners. 80% report that nearby construction has negatively impacted their operations over the past three years, with 25% describing the impact as very negative (Figure 32). Among the specific ways construction has hurt their businesses, parking challenges for customers and noise affecting operations rank as the most common complaints, with several respondents citing employee commute difficulties and reduced foot traffic as well (Figure 33).
Construction's Impact on Respondents' Businesses Somewhat positive impact
Financial Strain from Construction on Businesses
of respondents
Figure 31. How would you characterize the impact of construction on your business's financial health?
Operational Challenges from Construction
Noise affecting operations
Delivery and loading complications
Loss
Decreased visibility of storefront
Reduced hours of operation
Difficulty with customer/client access
Percent of respondents
Figure 32. In what ways has nearby construction negatively affected your business? Select all that apply.
The financial stakes vary considerably. While four respondents described construction as a significant financial strain requiring immediate intervention, and three characterized it as a critical threat to business survival, another four said the impact has been minor and manageable, while four others reported a positive or negligible impact of construction on their operations (Figure 30). This spread suggests that construction's financial toll depends heavily on proximity to active project sites and the type of business operating there. Businesses that depend on walkin foot traffic, reliable delivery access, and visible storefronts feel the pinch most sharply; those drawing from a broader customer base or anchored in a more insulated part of Downtown have weathered it more easily.
Businesses prioritize advance notice and timeline transparency above all else when navigating construction impacts.
When asked what interventions would be most helpful during active construction periods, business owners prioritized advance notice and timeline transparency above all else, followed by temporary loading zone access for deliveries and regular communication channels with City construction liaisons. The demand for better communication is telling: business owners are not asking to stop construction, but they want to plan around it, and right now they often can't.
Business owners' concerns cluster around three pressure points: access, safety, and operational visibility. The following opportunities address each.
Businesses' Preferred Construction Interventions
Advance notice and timeline updates about construction
Regular communication with city construction liaisons
Temporary parking accommodations or permits
Financial assistance or tax relief programs
Temporary loading zones or delivery access
Coordinated marketing campaigns for affected businesses
Improved wayfinding signage directing customers to your business
Help promoting open for business messaging
Percent of respondents
Figure 33. Which of the following interventions would be most helpful to your business during periods of nearby construction? Please select up to three.
• Commercial loading and delivery access: Work with the City to designate and protect short-term loading zones in areas with high restaurant and retail density. For food businesses in particular, the inability to receive deliveries reliably is not a minor inconvenience, but rather a direct operational constraint. DAA is well-positioned to advocate for this with the City, and business owners have specifically named it as an area where they want that advocacy.
• Employee parking and transit: Explore negotiated employee parking rates at underutilized Downtown garages, or coordinate with employers and business associations to identify transit solutions that meaningfully serve hourly workers. The customer parking problem is real, but the employee parking problem is more acute and more tractable.
• Construction communication and wayfinding: Establish a clear, consistent channel for advance notice on construction timelines and a direct liaison contact for affected businesses. Pair this with wayfinding and "open for business" signage that directs customers to accessible businesses during active disruption. Business owners asked for both.
• Homelessness response visible to business operators: Business owners want to know that incidents affecting their customers and staff are being tracked and acted on. DAA can add value by compiling and communicating documented data on public safety and homelessness response in Downtown's commercial corridors, and by reinforcing the role of ambassador teams as a consistent, visible presence.
The survey captured responses from 18 Downtown property owners and managers, supplemented by in-depth interviews with four property owners and investors representing portfolios spanning office, retail, entertainment, and mixed-use assets across Downtown. Many respondents own or manage multiple properties, and several have operated in Downtown for decades.
When asked about their confidence in Downtown Austin's future, property owner respondents leaned cautiously positive: 11 of 18 expressed some degree of confidence, including 6 who said they were very confident, while 6 expressed concern and 1 remained neutral (Figure 35). Plans for the next three years tell a similar story of measured stability rather than momentum (Figure 34). Half of respondents plan to hold and maintain their current properties, 5 remain uncertain about next steps, and only 3 plan to take active steps, whether making improvements or acquiring additional Downtown properties. Taken together, the two charts reflect a group that has not lost faith in Downtown but is largely in a wait-and-see posture, holding steady while the market works through its current pressures. The themes that follow help explain why.
35. How confident are you in Downtown Austin's future?
34. What are your plans for your property over the next 3 years?
Homelessness and security dominate the challenge landscape for property owners. When asked to name their biggest operational challenges, homelessness issues topped the list by a wide margin, cited by over three-fourths of respondents, followed closely by security and safety concerns (Figure 36). Property taxes ranked third, cited by roughly a third of respondents, followed by vandalism and property damage. Construction impacts and competition from new developments rounded out the picture. These same themes persist when property owners describe what their tenants complain about most, with homelessness and safety concerns ranking first among tenant complaints (Figure 37).
Vandalism/property damage
Construction impacts
Competition from new developments
Regulation/permitting processes
Tenant/resident retention
Maintenance costs
Parking for tenants/residents
Finding quality tenants/residents
Figure 37. What are your biggest challenges as a Downtown property owner/manager?
Cleanliness concerns
Lack of amenities
Limited access to retail/services
Cost/value concerns
Poor maintenance
Figure 36. What are the most common concerns or complaints you hear from your tenants/residents? Select up to 3
Interview participants gave greater context to these dynamics. One owner with a portfolio of commercial properties Downtown described the compounding pressures felt by landlords and tenants alike:
When you are factoring in Class A rents that are 60 bucks a foot and the operating expenses are 25 to 30 bucks a foot, and then you got to pay parking on top of that. I mean, my question is, who the hell can afford that if you're not a national law firm, a venture capitalist, a private equity firm? The local mom and pops, you know, like, where do they go?"
- Commercial real estate broker and investor
A consistent and forceful theme across property owner interviews is frustration with the city's development and permitting environment. What survey respondents capture through checkbox responses – regulatory and permitting processes named as a challenge by nearly a fifth of owners – the interviews render in vivid detail.
One owner and developer described the development process as one of relentless accumulation: an 18-month site development timeline, the Downtown density bonus program, capital view corridor restrictions, and a recently surfaced 60-foot public square setback requirement that he said cuts buildable square footage in half for at least one Downtown parcel and, by extension, cuts the land value in half. He framed the stakes plainly:
It's so challenging to go find a property off-market, to negotiate that deal, get a price that makes sense to build the tower on it. To go through an 18-month site development process,
jump through all the hoops, you want to build more? You gotta pay into the Downtown density bonus program. It's just like they just take and take and take."
- Downtown property owner and developer
Another owner described a 12-month delay caused by Austin Energy’s permitting process, during which he paid over $20,000 to a consultant to help navigate the red tape. An entertainment venue owner echoed the pattern from the commercial side, describing inconsistent health and fire inspections where requirements shift with every change of personnel.
A commercial real estate broker, while somewhat more diplomatic, agreed that Austin is "not the most development friendly" city, comparing it unfavorably to Fort Worth in terms of regulatory receptiveness and noting that permitting timelines and construction mitigation coordination routinely fall short of what developers need.
The development impact data reflects genuine division among property owners (Figure 39). Slightly more than a third (35%) say Downtown development over the past three years has had a negative impact on their property, while 29% report a positive impact. The negative view is more intense: four respondents described development's impact as very negative, compared to three who called it very positive.
Downtown Development Impact on Property
38. How has Downtown development over the past 3 years impacted your property (e.g., new buildings, infrastructure improvements, public spaces)?
For owners whose properties sit adjacent to major construction projects, the impact is not abstract. An entertainment venue owner described losing two businesses he operated due to a construction project that ran 50% longer than promised, with no relief from the city on property taxes or any other cost:
I became a victim of it. Lost two, three million dollars in business investment because of that construction. If that construction did not happen, it would still be there."
- Entertainment venue owner and property investor
He pointed to a dynamic that makes construction especially punishing for food and beverage tenants in particular: unlike office workers, who must show up regardless of conditions, customers choose freely, and they choose to go elsewhere.
"Nobody wants to go in the middle of a construction site. They'll just go somewhere else. And the problem with that is it becomes a brand loyalty thing."
- Entertainment venue owner and property investor
Most interviewees believed construction would ultimately benefit Downtown, pointing to the Convention Center rebuild and I-35 reconfiguration as real long-term gains, but were clear-eyed about the toll of the interim period. The perception of safety that Downtown is working to rebuild is particularly vulnerable during active construction, when streets are disrupted, storefronts become less visible, and foot traffic that took years to cultivate can quietly redirect to other parts of the city.
What would most help property owners succeed? Improved public safety tops the list by a wide margin, with 14 of 21 respondents citing it (Figure 39). Better cleanliness and maintenance programs ranked second, followed by more parking options and more parks and green space The strong showing for public safety is consistent with what owners name as their biggest challenge and what their tenants complain about most.
Improved public safety
Better cleanliness/maintenance…
More parking options
More parks and green spaces
Public transportation improvements
Better street lighting
Enhanced Downtown Austin Alliance…
Grocery stores and essential retail
Percent of respondents
Figure 39. What would most help your property succeed? Select up to 2.
Interview participants drew a distinction between the actual safety conditions Downtown and the perception of those conditions, and argued that the perception problem is, at this point, the harder one to solve. One owner, who has lived Downtown for a decade and said he personally feels generally safe, acknowledged that the damage done during the sit-lie camp ordinance reversal and police defunding years created a flight of tenants who are simply not coming back:
The damage that the city did when they rescinded our sit-lie camp ordinance and the defunding of the police – that damage we can never get back. People, certain tenants just didn't feel safe. They said enough is enough and they're never coming back."
- Downtown property owner and developer
Multiple interviewees credited DAA's ambassador program as doing meaningful, visible work, including graffiti removal, de-escalation, and maintaining a clean and active street-level presence. But one interviewee flagged a structural frustration: the DAA spends millions of dollars annually on ambassadors to perform functions he believes the city should fund and staff itself. For him, DAA's value is not in question. The question is why property owners and the DAA are subsidizing responsibilities that belong to city government.
Interviewees offered an unambiguous endorsement of the DAA's current leadership and direction, with one participant calling the organization the best it has been in his long relationship with the organization. That kind of credibility among the city's most vested stakeholders is a meaningful asset, and one that DAA can deploy as it advocates alongside property owners on permitting reform, construction mitigation, and safety investment.
Property owners' priorities converge on safety, regulatory friction, and the economics of staying competitive. The following opportunities address each.
• Expand ambassador coverage: Safety and homelessness top the list of both owner challenges and tenant complaints. Target ambassador deployment toward corridors with the highest property owner concentration, and communicate proactively to owners about what the program covers and where to escalate gaps.
• Aggregate and surface permitting frustrations: Collect specific examples of costly delays from property owners and bring them to city leadership as a unified case for reform. Prioritize smaller infill projects, where permitting friction does the most damage relative to project size.
• Protect tenants during active construction: Establish a standard playbook for construction-adjacent businesses: advance timeline notices, wayfinding signage, and coordinated "open for business" promotion. Advocate with the city for financial relief options for owners absorbing the longest-duration impacts.
• Make the case for green space as an economic asset: When communicating with property owners about parks and public space investments, lead with property value data rather than civic framing. Owners already see green space as a priority; DAA can reinforce why investing in it serves their bottom line.
Across 706 respondents and five stakeholder groups, a consistent picture emerges. Respondents describe a place they still believe in, but one whose day-to-day experience is being tested by homelessness and visible disorder, by a nighttime safety gap, by construction that compounds the friction of getting into and moving through the core, and by economic forces that are steadily eroding the local character that makes Downtown worth visiting in the first place.
Yet the survey also makes clear that the foundation for action is strong. Downtown scores well as a destination, residents intend to stay, visitors intend to return, and the DAA carries a high level of public trust and brand equity. The Clean & Safe Ambassador program, in particular, has built credibility on the ground that extends well beyond its formal scope, a foundation the DAA can build on as it takes on the harder, more systemic work ahead.
The priorities that emerge from these findings are consistent across profiles and clear in their direction:
• Lead on homelessness and public safety, both in substance and in how the work is communicated
• Push for better coordination, timelines, and mitigation during the current construction cycle
• Protect the small, locally owned businesses and street-level vibrancy that give Downtown its identity
• Use the DAA's credibility to advocate alongside stakeholders on the governance and regulatory issues that sit beyond its direct control.
Acted on together, these priorities offer a credible path from the cautious optimism this survey captured to the confident Downtown its users want to see.
As the first systematic effort of its kind, this survey establishes a baseline that the DAA can measure against in the years ahead. Repeating the instrument on a regular cadence will allow the organization to track whether perceptions of safety, construction impact, and Downtown's direction are moving in the right direction, and to hold itself and its city partners accountable to the progress these findings call for.