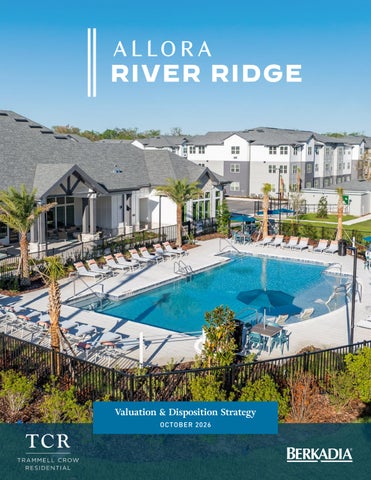
Valuation & Disposition Strategy OCTOBER 2026
Berkadia thanks you for the opportunity to present our opinion of value, qualifications, and considerations for the disposition of Allora River Ridge (the “Property”). We are very excited about the compelling acquisition opportunity the Property would present to the investment community, and we intimately understand how to position the asset to achieve the highest value and attract the deepest pool of motivated, qualified investors. The following pages outline Berkadia’s in-depth valuation analysis, key considerations and marketing strategies, as well as our expertise with similar-profile multifamily assets across the Tampa Bay market. We would welcome the opportunity to work with Trammell Crow Residential and look forward to discussing the Property further.
2
ALLORA RIVER RIDGE BERKADIA
Contents
04 08 14 26 38 46
BERKADIA TEAM INTRODUCTION
VALUATION OVERVIEW
WHY BERKADIA IS THE RIGHT CAPITAL MARKETS ADVISOR FOR THIS ASSET
BERKADIA’S PITCH TO THE MARKET
TARGET BUYERS & BERKADIA’S PROCESS
FINANCIAL APPENDIX
Berkadia Team Introduction
5
Berkadia’s Allora River Ridge Advisory Team Senior Institutional Capital Markets Advisory Team with Proven Local Expertise and $40+ Billion of Capital Markets Transaction Experience
6
ALLORA RIVER RIDGE BERKADIA
INVESTMENT SALES ADVISORS
FINANCING CONTACTS
Matt Mitchell
Mitch Sinberg
matt.mitchell@berkadia.com 813.217.3419
mitch.sinberg@berkadia.com 561.609.4006
Chris Burtner
Brad Williamson
chris.burtner@berkadia.com 321.446.4789
brad.williamson@berkadia.com 716.523.6403
Jason Stanton
Matt Robbins
jason.stanton@berkadia.com 727.244.3329
matthew.robbins@berkadia.com 561.609.4008
Alexander Hames
Scott Wadler
alexander.hames@berkadia.com 813.294.5109
scott.wadler@berkadia.com 786.646.2595
Danielle Gonzalez
Wes Moczul
danielle.gonzalez@berkadia.com 786.681.3771
wesley.moczul@berkadia.com 407.481.0030
Jacob Kelly jacob.kelly@berkadia.com 813.675.0114
NATIONAL LEADERSHIP Blake Okland Chief Revenue Officer
Mary Ann King Co-Head of Institutional Solutions
Dori Nolan Senior Vice President - Institutional Solutions
Tampa
Orlando
Miami
4890 W. Kennedy Blvd. Suite 940 Tampa, FL 33609
300 S. Orange Ave. Suite 1500 Orlando, FL 32801
1111 Brickell Ave. Suite 1650 Miami, FL 33131
Valuation Overview
9
Valuation Summary VALUATION METRICS
Outlier Bid
Strike Bid
Market Bid
Purchase Price
$69,000,000
$66,000,000
$63,000,000
Price Per Unit
$209,091
$200,000
$190,909
Price Per SF
$231
$221
$211
Pro Forma Cap Rate
4.98%
5.18%
5.39%
FY3 Stab. Cap Rate
5.87%
6.02%
6.19%
FY3 Stab. Cap Rate w/ PPA[1]
6.21%
6.36%
6.53%
Unlevered IRR
9.26%
9.89%
10.58%
Levered IRR
12.46%
14.08%
15.99%
5.19%
5.53%
5.96%
RETURN METRICS
CASH-ON-CASH ANALYSIS Average Cash-on-Cash [1] Contemplates tax reassessment at 60% of purchase price in accordance with estimated Real Advice purchase price allocation.
Buyers will be most focused on as-stabilized yields and going-in basis vs. replacement cost
INVESTOR DEPTH
BUYER COMPETITION SHI
COMPETITOR STRIKE ZONE Narrower buyer pool results in less competitive tension
PRIC
MORE INVESTOR COVERAGE Berkadia team makes 400+ personal phone calls & emails to C-suite level stakeholders on each deal
10
ALLORA RIVER RIDGE BERKADIA
+
DEEPER BUYER POOL More capital sources drive competitive tension
+
Proven Performance Berkadia consistently outperforms competitors across west coast Florida garden sales
11.7
ACHIEVED GROSS RENT MULTIPLE
10.9
ACHIEVED GROSS RENT MULTIPLE
Berkadia’s achieved garden sale pricing outperforms competitors by 7% across the last 14 trades Rent multiples for trades completed prior to 2026 interest rate increase.
IFTS THE PRICING CURVE
BERKADIA STRIKE ZONE Wider buyer pool creates more competition and stronger pricing
CING
+
PRICING STRATEGY Pricing guidance designed to maximize buyer pool & push in best and final
=
How Berkadia Delivers More Value for Allora River Ridge Valuation Overview
11
Berkadia Can Bring Bridesmaids fro Central & SW Florida Investment S
Recent Activity Has Generated Offers from More than 200 Unique Buyer G For Allora River Ridge Representative Buyers, # Recent Offers (Not Exhaustive)
12
1
29th Street
4
CAPREIT
2
Abacus
2
Carlyle Group
2
Advenir
3
Castle Lanterra
1
AIR Communities
2
CBRE Investment Management
2
AJ Capital
1
Cedarwood
2
Alliance
1
CEG
2
American Landmark
1
Centennial
2
Ares
3
CGI
9
Ascent
3
Connor Group
3
Ashcroft
3
Continental
1
Bainbridge
2
Corebridge
1
Barings
2
Cortland
2
Beachwold
2
Cottonwood
2
BH Equities
3
Covenant Capital
1
BH Management
2
Dinerstein Companies
1
BlackRock
2
DWS
2
Blackstone
3
Eagle Property Capital
4
Blaze Partners
4
ECI Ventures
2
Blue Roc Premier Properties
1
Elmington
1
Bozzuto
3
Excelsa
2
Bridge Investment Group
4
Fairfield Residential
3
Capital Square
3
FPA
ALLORA RIVER RIDGE BERKADIA
om Our Recently Marketed Sales Assignments
Groups, Creating a Deep Pool of Active Capital to Target
1
GID
1
Olympus
3
Greystar
3
Passco Companies
6
Hamilton Zanze
3
Radco
3
Harbor Group
1
RangeWater
8
Hilltop Residential
1
Related Group
1
Hines
2
RPM
2
Inland Real Estate Group
1
S2 Capital
3
Integra
1
SP Real Estate
2
JPM
6
St. Clair Holdings
1
Laramar
3
Stark Enterprises
2
Lightstone
1
StoneBridge
2
MAA
5
Stoneweg
3
MetLife
1
TCRE
2
Michaelson Group
2
TerraCap
4
Milestone Group
2
Trinitas
3
Milhaus
3
TruAmerica
4
MLG Capital
1
UBS
1
Momentum Real Estate Partners
4
Venterra
1
NexPoint
2
Waterton
7
Northland
3
Waypoint
4
Northrock Companies
2
West Shore
1
Nuveen
2
White Oak Partners
Valuation Overview
13
Why Berkadia is the Right Capital Markets Advisor for This Asset
15
Central Florida’s Trusted Advisor for Institutional Sales
16
ICON CENTRAL
LIVANO UPTOWN
CORTONA SOUTH TAMPA
JADE AT NORTH HYDE PARK
ASCEND RIDGEWOOD L AKES
THE IV Y RESIDENCES
ALLORA RIVER RIDGE BERKADIA
Proven experience as one of Tampa’s top-performing investment advisory teams for nearly two decades
500 HARBOUR ISL AND
TAPESTRY TOWN CENTER
VIDA L AKEWOOD RANCH
PROVENZA ST. PETE
APEX SOUTH CREEK
SHOREVIEW Why Berkadia is the Right Capital Markets Advisor for This Asset
17
Berkadia Has Unmatched Visibility SW Florida’s Most-Active Buyers ACTIVE ASSIGNMENTS
18
Summerall
Village at Terra Bella
Champions Walk
Year Built
2024
2016
1997
Units
352
311
376
Type
4-Story Garden
3-Story Garden
2- & 3-Story Garden
Profile
Core-Plus
Core-Plus
Value-Add
Price
$95,000,000
$71,000,000
$80,000,000
Per Unit
$269,886
$228,296
$212,766
PSF
$258
$209
$214
ALLORA RIVER RIDGE BERKADIA
Ridg
3
into Central &
Ranch Lake
The Shore
Verandahs of Brighton Bay
2025
2014
2020
2002
240
336
300
381
3-Story Garden
3-Story Garden
3-Story Garden
2- & 3-Story Garden
Core-Plus
Core-Plus
Core-Plus
Core-Plus
$48,000,000
$80,500,000
$75,000,000
$105,000,000
$200,000
$239,583
$250,000
$275,591
$189
$222
$223
$291
Ascend gewood Lakes
Why Berkadia is the Right Capital Markets Advisor for This Asset
19
Berkadia Has Unmatched Visibility SW Florida’s Most-Active Buyers R E C E N T LY C L O S E D
The Easton
Vida Lakewood Ranch
Fiore (Forward)
Marisol (Forward)
2014
2023
2024
2024
2024
Units
308
300
304
126
172
Type
4-Story Garden
3-Story Garden
2-Story Garden
Townhomes
Paired Villas
Profile
Core-Plus
Core-Plus
Core-Plus
Core-Plus
Core-Plus
C
Price
$93,000,000
$75,000,000
$92,112,000
$45,360,000
$68,370,000
$8
Per Unit
$301,948
$250,000
$303,000
$360,000
$397,500
$
PSF
$290
$226
$317
$194
$263
Provenza St. Pete Year Built
20
ALLORA RIVER RIDGE BERKADIA
H Tam
into Central &
Henley Jade at North Hyde Park mpa Palms
Odyssey
Bridgewater Grand
Orchid Run
ShoreView
1997
2022
2023
2022
2015
2021
315
192
129
300
282
216
2-Story Garden
5-Story Wrap
BTR-Cottage
3-Story Garden
2- & 4-Story Garden
4-Story Garden
Core-Plus
Core
Core-Plus
Core-Plus
Core-Plus
Core-Plus
81,500,000
$64,500,000
$47,730,000
$67,500,000
$89,500,000
$58,000,000
$258,730
$335,938
$370,000
$225,000
$317,376
$268,519
$188
$422
$372
$130
$305
$262
Why Berkadia is the Right Capital Markets Advisor for This Asset
21
Recent Berkadia Case Studies
Berkadia was engaged at mid-70% occupancy and brought the asset to market in the high 80s. While physical occupancy stabilized during marketing, economic loss exceeded 25%. We targeted private capital and 1031/family office buyers who looked past the in-place cap rate and negative LTOs to buy the basis, underwriting to a 6.00% to 6.25% stabilized yield, consistent with our River Ridge underwriting.
Ascend Ridgewood Lakes DAVENPORT, FL
Year Built
2025
Units
240
Type
3-Story Garden
Profile Under Contract Per Unit PSF Cap Rate
22
ALLORA RIVER RIDGE BERKADIA
Core-Plus $48,000,000 $200,000 $189 ~3.00% in-place, 6.00%-6.25% stabilized
Berkadia recently completed a competitive marketing process for The Village at Terra Bella in Pasco County. Run after the rate increases, the process drew a deep pool of motivated core-plus and value-add investors who view Pasco County as a core-quality submarket within the Tampa MSA. The process generated 220+ executed CAs, 20 tours, 35 offers, and 10 best-and-final participants. We can bring the runner-up bidders, already sold on the Pasco market, directly to River Ridge.
Village at Terra Bella PASCO COUNTY, FL
Year Built
2016
Units
311
Type
3-Story Garden
Profile
Core-Plus
Under LOI
$71,000,000
Per Unit
$228,296
PSF Cap Rate
$209 5.20% in-place, 6.00% stabilized
Why Berkadia is the Right Capital Markets Advisor for This Asset
23
#2
HUD LENDER
Berkadia is Florida’s Most Dominant Debt Advisor 2025 Florida Mortgage Banking by the Numbers
$4.8B+
59
TOTAL DEBT, EQUITY & STRUCTURED FINANCE VOLUME
UNIQUE SOURCES OF CAPITAL UTILIZED
20,000+
19
UNITS FINANCED
132
CLOSED TRANSACTIONS 24
ALLORA RIVER RIDGE BERKADIA
Ot
Bank 9%
Life Company 8%
DIFFERENT STATES
88
SPONSORS REPRESENTED
Conduit 6%
FHA/HUD 5% Proprietary 3%
IN LO
#4
FANNIE MAE DUS LENDER
R
#1
FREDDIE MAC LENDER
Fannie Mae 21%
ther 19%
$60B
LOAN ORIGINATION VOLUME
2,750+ LOANS CLOSED
Freddie Mac 29%
ACROSS 2024 & 2025 NATIONALLY
Why Berkadia is the Right Capital Markets Advisor for This Asset
25
Berkadia’s Pitch to Maximize the Property Value
27
The Elevator Pitch Seamless Access to Moffitt Speros
Located only a five-minute drive to Moffitt’s 775-acre, $1.6B new Speros campus, Allora River Ridge will have direct access to over 14,000 new healthcare jobs at full build-out and the #2 cancer hospital in the state, establishing robust long-term renter demand.
2.
Premium Product at a Compelling Rental Discount
The Property offers a rare pricing gap as a new-construction asset priced at a $150+ per month discount to new Class A communities, but only ~$45 above the older vintage garden stock in the submarket. This positioning allows Allora to fill a gap in West Pasco for renters priced out of Class A product but underserved by aging assets, including the growing Speros and Trinity medical workforce.
3.
Pasco’s Regulatory Moat
Pasco County has spent the past five years shutting the door on new development. The two moratoria, a lawsuit against Live Local and a 2026 tax abatement opt-out have resulted in zero planned deliveries within five miles of River Ridge after 2027, providing substantial insulation against future competition.
4.
Statewide Leader for Apartment Demand
Pasco boasts the highest T12 net absorption of any Tampa Bay MSA submarket and third highest in the entire state (2,276 units). With ~70 people moving in per day, new supply flatlining after 2027, and absorption outrunning deliveries by 1.6x in the trade area, Allora is positioned to benefit from significant demand tailwinds.
5.
Captive Renter Base, Priced Out of Home Ownership
Based on 5-mile average home prices, the cost to own is 1.85x the cost to rent at Allora, creating a captive renter base for the asset.
6.
Attractive Basis Below Replacement Cost
1.
28
ALLORA RIVER RIDGE BERKADIA
At a price in the low $200,000’s per unit range, investors will have a structural cost advantage over newly developed assets that are being delivered at $240,000 to $265,000 per unit.
Resort-Style Pool
Poolside Grilling Stations Covered Outdoor Lounge
Dog Run
Expansive Fitness Center Luxury Clubhouse
Berkadia’s Pitch to Maximize the Property Value
29
Anchored by a Billion-Dollar Medica Four Hospitals and a Life Sciences “Medical City,” All In The Trade Area
MOFFITT SPEROS, FL 775-acre, $1.6B capital investment, 14,000+ projected jobs at full build-out. 117,000 SF outpatient center opened January 2026. Tampa Bay’s first proton therapy center.
$1.6B+ INVESTMENT
MEDICAL AND LIFE SCIENCES
14,000+ PROJECTED JOBS
HEALTHCARE AND LIFE SCIENCES
3
HOSPITALS SERVING THE TRADE AREA
Only 5 minutes away from Allora River Ridge
30
ALLORA RIVER RIDGE BERKADIA
1
LIFE SCIENCES CLUSTER INNOVATION AND RESEARCH TALENT
al and Life Sciences Cluster AdventHealth Connerton Long-term acute care hospital; $20.6M, 22,000 SF wing expanded the hospital to 77
beds
HCA Florida Trinity Hospital $300M+ opened 2026; plus Johns Hopkins All Children’s Pediatric expansion
Morton Plant North Bay Hospital 222 acute care beds; $24.7M expansion added 13,925 SF and a 28-room emergency department; plus 30-bed rehab hospital and 72-bed psychiatric hospital
Healthcare and life sciences has become one of Pasco’s largest employment sectors
Speros anchors a 775-acre research and treatment campus backed by more than a billion dollars of investment
Four hospital systems ring the corridor and keep expanding
Durable, recessionresistant demand
Berkadia’s Pitch to Maximize the Property Value
31
Built for Outsized Rent Growth Allora River Ridge Delivers Brand-New Product Priced Between Pasco’s Legacy Housing Stock and Its Newest Class A Communities, Positioning the Asset for Outsized Go-Forward Rent Growth
$1,900 7% Premium 10% Discount
$1,800
$1,600 $1,500
$1,686
17%Premium Premium 3%
$1,700
$1,655
$1,533 $1,543 $1,489
$1,400 $1,322 $1,300 $1,200 OldVintage Vintage Comps Old Comps (Built <1990) (Built 1990-2010)
AlloraRiver River Ridge Allora Ridge (In-Place) (In-Place)
NewVintage Vintage Comps New Comps (Built 2020+) 2017+) (Built
Average Rent
Allora River Ridge is among the newest communities in the competitive set, yet it leases at a $153 monthly discount to the new-vintage average and only a $44 premium to older product. That positioning fills the missing middle in West Pasco’s workforce housing market: new construction at a price point renters can reach. The result is embedded mark-to-market upside and a property well positioned to lead the submarket in rent growth and occupancy as West Pasco matures. 32
ALLORA RIVER RIDGE BERKADIA
Class A Communities
The Elliot
Livano Serenova
Altera Conner Park
Ascend Angeline
Magnolia at Spring Hill
Older Vintage Communities
The Columns at Bear Creek
Ashton Oaks *Not exhaustive
Trinity Palms
Sawgrass Creek Apartments
Palms at Wyndtree
Berkadia’s Pitch to Maximize the Property Value
33
The Supply Pipeline Has Been Turned Off MULTIFAMILY DELIVERIES WITHIN 5 MILES OF ALLORA
500
Zero
330*
Units Delivered After 2027 Within 5 Miles of Allora
240 180
2023
2024
2025
2026
2027
0
0
0
0
2028
2029
2030
2031
Source: CoStar *Allora River Ridge
DELIVERIES FLATLINE AFTER 2027 34
ALLORA RIVER RIDGE BERKADIA
Statewide Leader For Apartment Demand
6.4%
POPULATION GROWTH OVER 2026 - 2031
70
+42.2%
PEOPLE PER DAY MOVING TO PASCO COUNTY
POPULATION GROWTH SINCE 2010
TRAILING TWELVE MONTH NET ABSORPTION (UNITS) TTM NET ABSORPTION Downtown Miami
2,659
I-Drive Orlando
2,522
Pasco County
2,276
North Polk - Lakeland
1,829
Southside - Jacksonville
1,727
Northwest Orlando
1,460
Southwest Orlando
1,434
Hollywood
1,332
Central Lee County
1,233
Cape Coral
1,202
Source: CoStar
7.84%
TTM Net Absorption as a Share of Existing Inventory in Pasco County
Berkadia’s Pitch to Maximize the Property Value
35
Affluent and Growing Household Demographics 1-MILE
3-MILE
TAMPA-ST. PETERSBURGCLEARWATER, FL MSA
2020 POPULATION - CENSUS
5,523
17,854
3,175,275
2026 POPULATION - ESTIMATE
5,660
18,932
3,420,189
2020 - 2026 POPULATION GROWTH
2.47%
6.04%
7.71%
2031 POPULATION - FIVE YEAR PROJECTION
5,471
18,365
3,584,094
$131,102
$114,946
$116,810
HOUSEHOLDS > $100K
48%
46%
42%
WHITE COLLAR
74%
69%
69%
2026 RENTER OCCUPIED HOUSING UNITS
23%
20%
30%
2026 AVERAGE HOUSEHOLD INCOME
Source: Sitewise
NOTABLE ON-SITE RESIDENT EMPLOYERS:
36
ALLORA RIVER RIDGE BERKADIA
Rents at Allora River Ridge could increase by more than $600 per month and still be below the industry-standard 30% rent-to-income limit.
30%
30% RENT-TO-INCOME LIMIT
$447/mo
Rent Burden
24%
$493/mo 24%
BELOW RENT BURDEN LIMIT
BELOW RENT BURDEN LIMIT
$539/mo
23%
BELOW RENT BURDEN LIMIT
23%
22%
$630/mo
$585/mo BELOW RENT BURDEN LIMIT
BELOW RENT BURDEN LIMIT
22%
21%
21%
20%
20%
Achieved Rent achieved rent
3% Rent Increase 3% rent increase
6% Rent Increase 6% rent increase
9% 9% Rent rentIncrease increase
12%12% Rent rentIncrease increase
Based on average household income of $86,544 per the Property’s demographic report. Berkadia’s Pitch to Maximize the Property Value
37
Target Buyers & Berkadia’s Process
39
Active Capital Likely to Buy This Deal
Financial Institutions & Advisors With active separate account mandates
Public REITs Who have re-entered the market
Private, Ultra HNW Family Offices Both foreign and domestic capital UHNW buyers have actively participated in recent Berkadia marketing processes
40
ALLORA RIVER RIDGE BERKADIA
Value-Add Funds Who have been starved of quality opportunities and are now pursuing “market-recovery” investments to achieve target returns
Exchange Buyers 1031 exchanges and exchange fund vehicles
Closed-Ended Core/ Core+ Funds Sponsored by leading financial institutions
NEW YORK STATE COMMON RETIREMENT FUND
VANTAGE POINT CAPITAL
WORKFORCE HOUSING INVESTOR: Groups that have recently acquired Pointe Grand, Prose, LTD, Authentix or other institutional-grade workforce housing communities nationally. Target Buyers & Berkadia’s Process
41
Go-to-Market Timing Strategy Phase 1
Phase 2
Off-Market Approach
Launch Marketing Campaign
• Strategically show deal to key buyers
• L aunch during NMHC conference in late-January 2027. This will also provide more runway for the asset’s operations to further season.
• Tight control on messaging
Pre-Marketing • Conduct pre-marketing due diligence
• Once launched, marketing campaign will be 4-6 weeks
• W alk the Property with asset management
Extended Market Coverage
• P rovide pre-marketing recommendations (physical improvements / leasing strategy) • Source insurance and debt quotes
• C ast wide net to capture active buyer universe • D irect calls and/or meetings (with Top 300 Target Buyers)
Prepare Marketing Materials • R eady the OM, promotional video, emails and other marketing collateral
4 Weeks
42
ALLORA RIVER RIDGE BERKADIA
4 – 6 Weeks
Employ a Phased Marketing Strategy That Provides Flexibility to Opportunistically Take Advantage of ‘Hot’ Money and Time a Sale That Maximizes Value
Phase 3
Phase 4
Bid Process
Due Diligence
• O rchestrated auction process to find the “emotional buyer”
• Monitor and facilitate the DD process
Buyer Selection • Extensive vetting of buyer qualifications • LOI & PSA negotiations
2 – 3 Weeks
• Track financing process
Closing • Assist lender requests • P ray for good weather and steady interest rates
30-Day DD, 30-Day Closing
Target Buyers & Berkadia’s Process
43
Berkadia’s Process to Extract Maximum Value Extract the Last Increment of Value • Direct Conversations With Hundreds of Active Investors • No Stone Unturned • Leverage Senior Principal Relationships • Drive OM Underwriting • Use Debt to Push Pricing • Multiple Rounds of Bidding • Push Pricing to an Emotional Level
44
ALLORA RIVER RIDGE BERKADIA
Protect Against Re-Trade • Extensive Upfront Due Diligence • Force Bidders to Compete on DD & Timing • Real Time Debt Guidance Throughout • Comprehensive OM/War Room • Thoroughly Vet Finalists • Actively Groom Back-Ups
Target Buyers & Berkadia’s Process
45
Financial Appendix
47
Rent Roll Summary RENT ROLL SUMMARY UNIT TYPE
FLOORPLAN
UNIT COUNT
% OF MIX
OCC. UNITS
OCCUPANCY
1 Bed / 1 Bath
A1
165
50%
138
84%
1 Bed / 1 Bath
A2
66
20%
42
64%
2 Bed / 2 Bath
B1
33
10%
22
67%
2 Bed / 2 Bath
B2
66
20%
51
77%
330
100%
253
77%
TOTAL / AVERAGE Rent Roll as of: September 29, 2026.
48
ALLORA RIVER RIDGE BERKADIA
AVG UNIT SIZE
RENTABLE AREA
MARKET RENT
PSF
LEASE RENT
PSF
762 SF
125,730 SF
$1,432
$1.88
$1,380
$1.81
830 SF
54,780 SF
$1,472
$1.77
$1,504
$1.81
1,224 SF
40,392 SF
$1,923
$1.57
$1,886
$1.54
1,187 SF
78,342 SF
$1,816
$1.53
$1,819
$1.53
907 SF
299,244 SF
$1,566
$1.73
$1,533
$1.69
Financial Appendix
49
LAST 90 DAYS
LAST 60 DAYS
LAST 30 DAYS
Lease Tradeout Summary
50
FLOOR PLAN
LEASE TYPE
# LEASES
AVG PRIOR GROSS
AVG NEW GROSS
GROSS TRADEOUT $
1B1B
New
2
$1,508
$1,383
($125)
1B1B
Renewal
8
$1,498
$1,498
-
1B1B
Total
10
$1,500
$1,475
($25)
2B2B
New
4
$1,868
$1,789
($79)
2B2B
Renewal
2
$1,835
$1,835
-
2B2B
Total
6
$1,857
$1,804
($53)
ALL
NEW
6
$1,748
$1,653
($94)
ALL
RENEWAL
10
$1,565
$1,565
-
ALL
TOTAL
16
$1,633
$1,598
($35)
FLOOR PLAN
LEASE TYPE
# LEASES
AVG PRIOR GROSS
AVG NEW GROSS
GROSS TRADEOUT $
1B1B
New
7
$1,500
$1,290
($210)
1B1B
Renewal
17
$1,503
$1,504
$0
1B1B
Total
24
$1,502
$1,441
($61)
2B2B
New
4
$1,868
$1,789
($79)
2B2B
Renewal
9
$1,879
$1,879
-
2B2B
Total
13
$1,875
$1,851
($24)
ALL
NEW
11
$1,634
$1,471
($162)
ALL
RENEWAL
26
$1,633
$1,633
$0
ALL
TOTAL
37
$1,633
$1,585
($48)
FLOOR PLAN
LEASE TYPE
# LEASES
AVG PRIOR GROSS
AVG NEW GROSS
GROSS TRADEOUT $
1B1B
New
9
$1,511
$1,281
($230)
1B1B
Renewal
23
$1,507
$1,508
$0
1B1B
Total
32
$1,508
$1,444
($65)
2B2B
New
5
$1,893
$1,830
($63)
2B2B
Renewal
11
$1,890
$1,890
-
2B2B
Total
16
$1,891
$1,871
($20)
ALL
NEW
14
$1,648
$1,477
($170)
ALL
RENEWAL
34
$1,631
$1,631
$0
ALL
TOTAL
48
$1,636
$1,586
($50)
ALLORA RIVER RIDGE BERKADIA
GROSS TRADEOUT %
AVG PRIOR EFF
AVG NEW EFF
EFF TRADEOUT $
EFF TRADEOUT %
(8.3%)
$1,291
$1,266
($26)
(2.0%)
-
$1,273
$1,385
$113
8.9%
(1.7%)
$1,276
$1,361
$85
6.7%
(4.2%)
$1,666
$1,564
($102)
(6.1%)
-
$1,572
$1,714
$142
9.0%
(2.8%)
$1,635
$1,614
($21)
(1.3%)
(5.4%)
$1,541
$1,465
($76)
(5.0%)
-
$1,333
$1,451
$119
8.9%
(2.2%)
$1,411
$1,456
$45
3.2%
GROSS TRADEOUT %
AVG PRIOR EFF
AVG NEW EFF
EFF TRADEOUT $
EFF TRADEOUT %
(14.0%)
$1,267
$1,227
($41)
(3.2%)
0.0%
$1,273
$1,413
$140
11.0%
(4.1%)
$1,271
$1,358
$87
6.8%
(4.2%)
$1,666
$1,564
($102)
(6.1%)
-
$1,577
$1,781
$204
12.9%
(1.3%)
$1,604
$1,714
$110
6.8%
(9.9%)
$1,412
$1,349
($63)
(4.5%)
0.0%
$1,378
$1,540
$162
11.7%
(2.9%)
$1,388
$1,483
$95
6.8%
GROSS TRADEOUT %
AVG PRIOR EFF
AVG NEW EFF
EFF TRADEOUT $
EFF TRADEOUT %
(15.2%)
$1,292
$1,232
($60)
(4.7%)
0.0%
$1,288
$1,412
$124
9.6%
(4.3%)
$1,289
$1,362
$72
5.6%
(3.3%)
$1,673
$1,650
($22)
(1.3%)
-
$1,596
$1,786
$190
11.9%
(1.0%)
$1,620
$1,744
$124
7.7%
(10.3%)
$1,428
$1,381
($47)
(3.3%)
0.0%
$1,388
$1,533
$146
10.5%
(3.0%)
$1,400
$1,489
$89
6.4%
Financial Appendix
51
Pro Forma INCOME Effective Rental Income Gross Potential Income Loss-to-Lease Gross Scheduled Rent Income Losses Vacancy Concessions Bad Debt Non-Revenue Units Subtotal: Effective Rental Income Effective Rent Effective Rent PSF Physical Occupancy Economic Occupancy Other Income Utility Reimbursements Bulk Wi-Fi (Net) Valet Trash (Net) Miscellaneous Income Subtotal: Other Income EFFECTIVE GROSS INCOME EXPENSES Controllable Expenses Payroll Marketing General & Administrative Turnover Repairs & Maintenance Contract Services Utilities Subtotal: Controllable Expenses Non-Controllable Expenses Management Fee Real Estate Taxes Insurance Subtotal: Non-Controllable Expenses TOTAL EXPENSES Expense Ratio NET OPERATING INCOME Capital Reserves CASH FLOW FROM OPERATIONS
52
ALLORA RIVER RIDGE BERKADIA
TOTAL
Trailing 12 PER UNIT
%
TOTAL
Trailing 3 PER UNIT
%
$6,382,876 ($82,189) $6,300,687
$19,342 ($249) $19,093
(1.3%) 100.0%
$6,317,596 ($152,025) $6,165,571
$19,144 ($461) $18,684
(2.4%) 100.0%
($2,206,789) ($548,090) ($28,882) ($30,648) $3,486,277
($6,687) ($1,661) ($88) ($93) $10,564 $1,378 $1.52 65.0% 55.3%
(35.0%) (8.7%) (0.5%) (0.5%) 55.3%
($1,572,070) ($557,509) ($29,767) ($29,688) $3,976,537
($4,764) ($1,689) ($90) ($90) $12,050 $1,368 $1.51 74.5% 64.5%
(25.5%) (9.0%) (0.5%) (0.5%) 64.5%
$102,285 $151,809 $0 $194,176 $448,269 $3,934,546
$310 $460 $0 $588 $1,358 $11,923
1.6% 2.4% 0.0% 3.1% 7.1% 62.4%
$105,670 $176,485 $0 $236,251 $518,407 $4,494,944
$320 $535 $0 $716 $1,571 $13,621
1.7% 2.9% 0.0% 3.8% 8.4% 72.9%
$531,371 $214,852 $96,461 $54,359 $26,635 $154,870 $258,297 $1,336,844
$1,610 $651 $292 $165 $81 $469 $783 $4,051
13.5% 5.5% 2.5% 1.4% 0.7% 3.9% 6.6% 34.0%
$600,156 $278,052 $95,597 $106,793 $31,590 $148,726 $263,469 $1,524,383
$1,819 $843 $290 $324 $96 $451 $798 $4,619
13.4% 6.2% 2.1% 2.4% 0.7% 3.3% 5.9% 33.9%
$102,039 $472,183 $385,239
$309 $1,431 $1,167
2.6% 12.0% 9.8%
$102,158 $665,000 $245,286
$310 $2,015 $743
2.3% 14.8% 5.5%
$959,461
$2,907
24.4%
$1,012,444
$3,068
22.5%
$2,296,306
$6,959 58.4% $4,964 $200 $4,764
58.4%
$2,536,827
56.4%
41.6% 1.7% 40.0%
$1,958,117 $66,000 $1,892,117
$7,687 56.4% $5,934 $200 $5,734
$1,638,240 $66,000 $1,572,240
43.6% 1.5% 42.1%
TOTAL
Trailing 1 PER UNIT
$6,302,256 ($128,386) $6,173,870
$19,098 ($389) $18,709
($1,418,404) ($670,771) ($12,527) ($26,328) $4,045,839
%
Year 1 Pro Forma TOTAL PER UNIT
%
(2.0%) 100.0%
$6,132,430 $0 $6,132,430
$18,583 $0 $18,583
($4,298) ($2,033) ($38) ($80) $12,260 $1,339 $1.48 77.0% 65.5%
(23.0%) (10.9%) (0.2%) (0.4%) 65.5%
($306,622) ($367,946) ($30,662) ($18,583) $5,408,618
($929) ($1,115) ($93) ($56) $16,390 $1,451 $1.60 95.0% 88.2%
(5.0%) (6.0%) (0.5%) (0.3%) 88.2%
$109,103 $184,863 $0 $246,099 $540,065 $4,585,904
$331 $560 $0 $746 $1,637 $13,897
1.8% 3.0% 0.0% 4.0% 8.7% 74.3%
$134,743 $122,760 $54,450 $342,166 $654,119 $6,062,737
$408 $372 $165 $1,037 $1,982 $18,372
2.2% 2.0% 0.9% 5.6% 10.7% 98.9%
$618,364 $293,166 $90,448 $93,540 $35,019 $144,807 $324,420 $1,599,764
$1,874 $888 $274 $283 $106 $439 $983 $4,848
13.5% 6.4% 2.0% 2.0% 0.8% 3.2% 7.1% 34.9%
$531,371 $99,000 $96,461 $82,500 $82,500 $154,870 $231,000 $1,277,701
$1,610 $300 $292 $250 $250 $469 $700 $3,872
8.8% 1.6% 1.6% 1.4% 1.4% 2.6% 3.8% 21.1%
$102,000 $665,000 $287,553
$309 $2,015 $871
2.2% 14.5% 6.3%
$151,568 $852,415 $280,500
$459 $2,583 $850
2.5% 14.1% 4.6%
$1,054,553
$3,196
23.0%
$1,284,483
$3,892
21.2%
$2,654,316
$8,043 57.9% $5,853 $200 $5,653
57.9%
$2,562,185
42.3%
42.1% 1.4% 40.7%
$3,500,552 $66,000 $3,434,552
$7,764 42.3% $10,608 $200 $10,408
$1,931,588 $66,000 $1,865,588
0.0% 100.0%
57.7% 1.1% 56.7%
Financial Appendix
53
Income Notes Gross Potential Income
Utility Reimbursements
Berkadia has based top-line revenue on the in-place leases per the September rent roll contemplating 1.0% rent growth in FY1.
Berkadia projects Utility Reimbursements of $408 per unit based on the Trailing 3 Financials adjusted for stabilized occupancy.
Loss-to-Lease
Bulk Wi-Fi (Net)
Berkadia assumes 0.0% Loss-to-Lease in analysis.
Berkadia assumes a standard 5.0% vacancy loss.
Berkadia projects Bulk Wi-Fi Income (Net) of $372 per unit based on monthly income of $60 per unit at 95% occupancy less associated monthly expense of $26 per unit.
Concessions
Valet Trash (Net)
Vacancy
Analysis assumes 6.0% concessions in FY1, 3.0% in FY2 and 0.0% thereafter.
Bad Debt Berkadia assumes 50bps of Gross Rents based on market underwriting.
Non-Revenue Units Berkadia assumes 1 non-revenue unit in Year 1 and throughout the hold.
54
ALLORA RIVER RIDGE BERKADIA
Berkadia projects Valet Trash Income (Net) of $165 per unit based on monthly income of $25 per unit at 95% occupancy less associated monthly expense of $10 per unit.
Miscellaneous Income Berkadia projects Miscellaneous Income of $1,037 per unit based on the Trailing 3 Financials adjusted for stabilized occupancy.
Expense Notes Payroll
Management Fee
Berkadia projects Payroll Expense of $1,610 per unit based on the Trailing 12 Financials.
Berkadia projects Management Fee Expense of 2.50% of EGI based on market underwriting & excluding in-place asset management fees.
Marketing Berkadia projects Marketing Expense of $300 per unit based on market underwriting.
General & Administrative Berkadia projects General & Administrative Expense of $292 per unit based on the Trailing 12 Financials.
Turnover Berkadia projects Turnover Expense of $250 per unit based on market underwriting.
Repairs & Maintenance Berkadia projects Repairs & Maintenance Expense of $250 per unit based on market underwriting.
Contract Services
Real Estate Taxes Berkadia projects Real Estate Tax Expense of $2,583 per unit based on re-assessment at 80.0% of Purchase Price, contemplating a millage rate of 16.8169 and a 4.0% discount for early payment. A buyer may have an opportunity to take advantage of a Purchase Price Allocation (Real Advice), which has a proven track record of reducing real estate taxes.
Insurance Berkadia projects Insurance Expense of $850 per unit based on market underwriting.
Capital Reserves Capital Reserves are forecast to be $200 per unit based on market underwriting for this vintage.
Berkadia projects Contract Services Expense of $469 per unit based on the Trailing 12 Financials.
Utilities Berkadia projects Utilities Expense of $700 per unit based on market underwriting.
Financial Appendix
55
Cash Flow Year 1
Year 2
Year 3
Year 4
Year 5
$6,132,430
$6,255,079
$6,442,731
$6,636,013
$6,835,093
$0
$0
$0
$0
$0
$6,132,430
$6,255,079
$6,442,731
$6,636,013
$6,835,093
Vacancy
($306,622)
($312,754)
($322,137)
($331,801)
($341,755)
Concessions
($367,946)
($187,652)
$0
$0
$0
Bad Debt
($30,662)
($31,275)
($32,214)
($33,180)
($34,175)
Non-Revenue Units
($18,583)
($18,955)
($19,523)
($20,109)
($20,712)
$5,408,618
$5,704,442
$6,068,858
$6,250,923
$6,438,451
Utility Reimbursements
$134,743
$138,785
$142,949
$147,237
$151,655
Bulk Wi-Fi (Net)
$122,760
$126,443
$130,236
$134,143
$138,167
Valet Trash (Net)
$54,450
$56,084
$57,766
$59,499
$61,284
Miscellaneous Income
$342,166
$352,431
$363,004
$373,894
$385,111
Subtotal: Other Income
$654,119
$673,743
$693,955
$714,773
$736,217
$6,062,737
$6,378,185
$6,762,812
$6,965,697
$7,174,668
Payroll
$531,371
$544,655
$558,272
$572,228
$586,534
Marketing
$99,000
$101,475
$104,012
$106,612
$109,277
General & Administrative
$96,461
$98,872
$101,344
$103,877
$106,474
Turnover
$82,500
$84,563
$86,677
$88,843
$91,065
Repairs & Maintenance
$82,500
$84,563
$86,677
$88,843
$91,065
Contract Services
$154,870
$158,742
$162,710
$166,778
$170,947
Utilities
$231,000
$236,775
$242,694
$248,762
$254,981
$1,277,701
$1,309,644
$1,342,385
$1,375,945
$1,410,343
Management Fee
$151,568
$159,455
$169,070
$174,142
$179,367
Real Estate Taxes
$852,415
$873,725
$895,569
$917,958
$940,907
Insurance
$280,500
$287,513
$294,700
$302,068
$309,620
Subtotal: Non-Controllable Expenses
$1,284,483
$1,320,693
$1,359,339
$1,394,168
$1,429,893
TOTAL EXPENSES
$2,562,185
$2,630,336
$2,701,724
$2,770,113
$2,840,236
42.3%
41.2%
39.9%
39.8%
39.6%
$3,500,552
$3,747,848
$4,061,088
$4,195,584
$4,334,431
$66,000
$66,000
$66,000
$66,000
$66,000
$3,434,552
$3,681,848
$3,995,088
$4,129,584
$4,268,431
INCOME Effective Rental Income Gross Potential Income Loss-to-Lease Gross Scheduled Rent Income Losses
Subtotal: Effective Rental Income Other Income
EFFECTIVE GROSS INCOME EXPENSES Controllable Expenses
Subtotal: Controllable Expenses Non-Controllable Expenses
Expense Ratio NET OPERATING INCOME Capital Reserves CASH FLOW FROM OPERATIONS
56
ALLORA RIVER RIDGE BERKADIA
Cash Flow, Financing, & Reversion Assumptions ASSUMPTIONS & GROWTH RATES Year 1
Year 2
Year 3
Year 4
Year 5
Outlier Bid Rent Growth
2.00%
3.00%
3.00%
3.00%
3.00%
Strike Bid Rent Growth
1.00%
2.00%
3.00%
3.00%
3.00%
Market Bid Rent Growth
0.00%
1.00%
3.00%
3.00%
3.00%
Loss-to-Lease
0.00%
0.00%
0.00%
0.00%
0.00%
Vacancy
-5.00%
-5.00%
-5.00%
-5.00%
-5.00%
Concessions
-6.00%
-3.00%
0.00%
0.00%
0.00%
Bad Debt
-0.50%
-0.50%
-0.50%
-0.50%
-0.50%
Non-Revenue Homes
-0.30%
-0.30%
-0.30%
-0.30%
-0.30%
Other Income Growth
0.00%
3.00%
3.00%
3.00%
3.00%
Expense Growth
0.00%
2.50%
2.50%
2.50%
2.50%
Management Fee
2.50%
2.50%
2.50%
2.50%
2.50%
FINANCING OVERVIEW SIZING
LOAN CHARACTERISTICS
Year 1 NOI (Pro Forma)
$3,434,552
Debt Coverage Ratio 5-yr Treasury + Margin = Interest Rate
1.25x
Interest-Only Component
60 Months
Loan Term
5 Years
4.90% + 1.10% = 6.00%
Monthly Loan Payment
Amortization
35 Years
Annual Loan Constant
6.00% (I/O)
6.84% (Amort)
Max Proceeds
$40,160,000
Loan Fee w/ buydown
2.00%
$803,200
Loan Fee "Out"
0.00%
$0
Size of Loan Cannot Exceed this LTV
65% LTV
Debt Yield Loan Proceeds:
8.55% $40,160,000
61% LTV
HOLD ASSUMPTIONS Buyer's Hold Period
5 Years
Exit Cap Rate
5.25%
Residual Value
$84,033,691
Per Unit Cost of Sale
$228,988
$254,648 1.50%
REPLACEMENT COST ANALYSIS Land Cost
$30,000
Hard Costs
$154,156
Soft Costs
$45,000
Replacement Cost
$229,156
Trended Replacement Cost - Year 5
$257,917
Berkadia estimates replacement cost at $229K per unit, or $258K per unit trended at 3% annually. A 5.25% exit cap produces a Year 5 reversion of $255K per unit, which remains below trended replacement cost. Because a future buyer would still acquire the asset at a discount to new construction, we are comfortable underwriting a 5.25% exit cap.
Financial Appendix
57
Sales Comps DATE
PROPERTY NAME
CITY
UNITS
AVG. UNIT SIZE (SF)
YEAR BUILT
PRODUCT TYPE
U/C
Ascend Ridgewood Lakes
Davenport
240
1,060
2025
Garden
Jul-26
Spectra
Fort Myers
324
993
2017
Garden
May-26
Prose Horizon Village
Orlando
300
1,006
2024
Garden
Jan-26
Prose Stevens Pointe
St. Cloud
264
1,008
2022
Garden
Dec-25
The Ridge at ChampionsGate
Champions Gate
330
1,002
2023
Garden
Mar-25
Charleston at Wesley Chapel
Wesley Chapel
228
1,022
2022
Garden
1,686
1,013
Total / Average
58
ALLORA RIVER RIDGE BERKADIA
SALE PRICE
$/UNIT
$/SF
BUYER
SELLER
$48,000,000
$200,000
$189
Confidential
D.R. Horton
$66,744,000
$206,000
$207
Embassy Group
Coastal Ridge
$67,500,000
$225,000
$224
Alliance Residential
Lubert-Adler
$54,120,000
$205,000
$203
Confidential
Alliance
$70,000,000
$212,121
$212
Katz Properties
Greystar
$49,020,000
$215,000
$210
Bainbridge Companies
Chason Affinity
$60,474,078
$210,785
$208
Financial Appendix
59
Rental Rate Comparable Analysis
One Bed
Property
Size (SF)
Avg Market Rent
PSF
Ascend Angeline
843
$1,679
$1.99
The Elliot
726
$1,559
$2.15
Avilla Silver Palm
700
$1,547
$2.21
Livano Serenova
749
$1,489
$1.99
Altera Conner Park
704
$1,464
$2.08
Allora River Ridge (In-Place)
781
$1,416
$1.81
Size (SF)
Avg Market Rent
PSF
Ascend Angeline
1,338
$2,117
$1.58
Avilla Silver Palm
1,006
$2,032
$2.02
The Elliot
1,154
$1,969
$1.71
Allora River Ridge (In-Place)
1,199
$1,842
$1.54
Livano Serenova
1,065
$1,718
$1.61
Altera Conner Park
1,057
$1,702
$1.61
Two Bed
Property
60
ALLORA RIVER RIDGE BERKADIA
Allora River Ridge
Ascend Angeline
Altera Conner Park
Avilla Silver Palm
The Elliot
Livano Serenova
Financial Appendix
61
Disclaimer and Confidentiality Agreement The material contained in this document is confidential, furnished solely for the purpose of considering investment in the property described therein and is not to be copied and/or used for any purpose or made available to any other person without the express written consent of Berkadia Real Estate Advisors LLC and Berkadia Real Estate Advisors Inc. In accepting this, the recipient agrees to keep all material contained herein confidential. This information package has been prepared to provide summary information to prospective purchasers and to establish a preliminary level of interest in the property described herein. It does not, however, purport to present all material information regarding the subject property, and it is not a substitute for a thorough due diligence investigation. In particular, Berkadia Real Estate Advisors LLC, Berkadia Real Estate Advisors Inc. and Seller have not made any investigation of the actual property, the tenants, the operating history, financial reports, leases, square footage, age or any other aspect of the property, including but not limited to any potential environmental problems that may exist and make no warranty or representation whatsoever concerning these issues. The information contained in this information package has been obtained from sources we believe to be reliable; however, Berkadia Real Estate Advisors LLC, Berkadia Real Estate Advisors Inc. and Seller have not conducted any investigation regarding these matters and make no warranty or representation whatsoever regarding the accuracy or completeness of the information provided. Any pro formas, projections, opinions, assumptions or estimates used are for example only and do not necessarily represent the current or future performance of the property. Berkadia Real Estate Advisors LLC and Berkadia Real Estate Advisors Inc. and Seller strongly recommend that prospective purchasers conduct an in-depth investigation of every physical and financial aspect of the property to determine if the property meets their needs and expectations. We also recommend that prospective purchasers consult with their tax, financial and legal advisors on any matter that may affect their decision to purchase the property and the subsequent consequences of ownership. All parties are advised that in any property the presence of certain kinds of molds, funguses, or other organisms may adversely affect the property and the health of some individuals. Berkadia Real Estate Advisors LLC and Berkadia Real Estate Advisors Inc. recommend, if prospective buyers have questions or concerns regarding this issue, that prospective buyers conduct further inspections by a qualified professional. The Seller retains the right to withdraw, modify or cancel this offer to sell at any time and without any notice or obligation. Any sale is subject to the sole and unrestricted approval of Seller, and Seller shall be under no obligation to any party until such time as Seller and any other necessary parties have executed a contract of sale containing terms and conditions acceptable to Seller and such obligations of Seller shall only be those in such contract of sale. For more information on these and other Berkadia® exclusive listings, please visit our website at www.berkadia.com Berkadia®, a joint venture of Berkshire Hathaway and Jefferies Financial Group, is an industry leading commercial real estate company providing comprehensive capital solutions and investment sales advisory and research services for multifamily and commercial properties. Berkadia® is amongst the largest, highest rated and most respected primary, master and special servicers in the industry. © 2026 Berkadia Proprietary Holding LLC Berkadia® is a trademark of Berkadia Proprietary Holding LLC Investment sales and real estate brokerage businesses are conducted exclusively by Berkadia Real Estate Advisors LLC and Berkadia Real Estate Advisors Inc. Commercial mortgage loan origination and servicing businesses are conducted exclusively by Berkadia Commercial Mortgage LLC and Berkadia Commercial Mortgage Inc. Tax credit syndication business is conducted exclusively by Berkadia Affordable Tax Credit Solutions. In California, Berkadia Real Estate Advisors Inc. conducts business under CA Real Estate Broker License #01931050; Adrienne Barr, CA DRE Lic. # 01308753. Berkadia Commercial Mortgage Inc. conducts business under CA Real Estate Broker Lic. #01874116. This proposal is not intended to solicit commercial mortgage company business in Nevada. For state licensing details for the above entities, visit www.berkadia.com/licensing.
KB | 503894