Who Really Sets Interest Rates?
Every investor watches the Fed. The data suggests they are watching the wrong thing.
Watching the Wrong Lever
When clients ask us about interest rates, the conversation almost always orbits the same body: the Federal Reserve. Will the Fed cut at its next meeting? What did the “dot plot” signal? Is Fed Chair Kevin Warsh, who succeeded Jerome Powell in May, more hawkish or dovish than his predecessor?
It is easy to understand why everyone asks these questions. The Fed is the most visible actor in the rate story –it earns the headlines and markets visibly lurch around its meetings. The instinct that the Fed sets the price of money in the economy is nearly universal among investors.
It is also, for the rate that matters most, largely mistaken. The yield that anchors mortgages, corporate borrowing costs and the discount rate underneath every stock in your portfolio is the 10-year U.S. Treasury yield, and the Fed does not set it. The market does. More specifically, the market prices the 10-year off two fundamentals: how much inflation it expects and how fast it expects the real economy to grow. This piece makes that case with seven decades of data.
What the Fed Actually Controls
The Federal Reserve sets one interest rate directly: the fed funds rate, the overnight rate that banks charge each other to borrow reserves. That is the lever. Everything else (the 2-year note, the 10-year, the 30-year bond, the mortgage you sign) is set in open markets by buyers and sellers, not decreed by the Fed.
The Fed’s grip is firmest at the very short end of the curve and loosens steadily as maturities lengthen. By the time you reach the 10-year, the Fed’s overnight rate is only one input among many. The 10-year yield is a market-clearing price that reflects what millions of investors collectively expect inflation and growth to average over the next decade. Chairman Warsh can influence that expectation at the margins, but he cannot set it. He is only one voice in a very large room.
Inflation Plus Growth: The Intrinsic Rate
There is a clean way to frame this relationship, sometimes called the intrinsic rate, a concept that valuation professor Aswath Damodaran has written about at length1. Over time, a lender requires compensation for two things: the expected loss of purchasing power to inflation and the real return the broader economy can support. Add those together and you get the rate that long-term bonds should gravitate toward:
Intrinsic rate = expected inflation + expected real
growth
The logic is intuitive. If inflation is expected to run at 3% and the real economy can sustainably grow at roughly 2.5%, a 10-year lender will demand something in the neighborhood of 5.5% to part with their money for a decade. The Fed’s overnight rate barely enters the calculation. What does the historical record show? The chart below plots the 10-year Treasury yield against this intrinsic rate (inflation plus real GDP growth) using monthly data going back to 1953.
The 10-year yield tracks inflation and growth
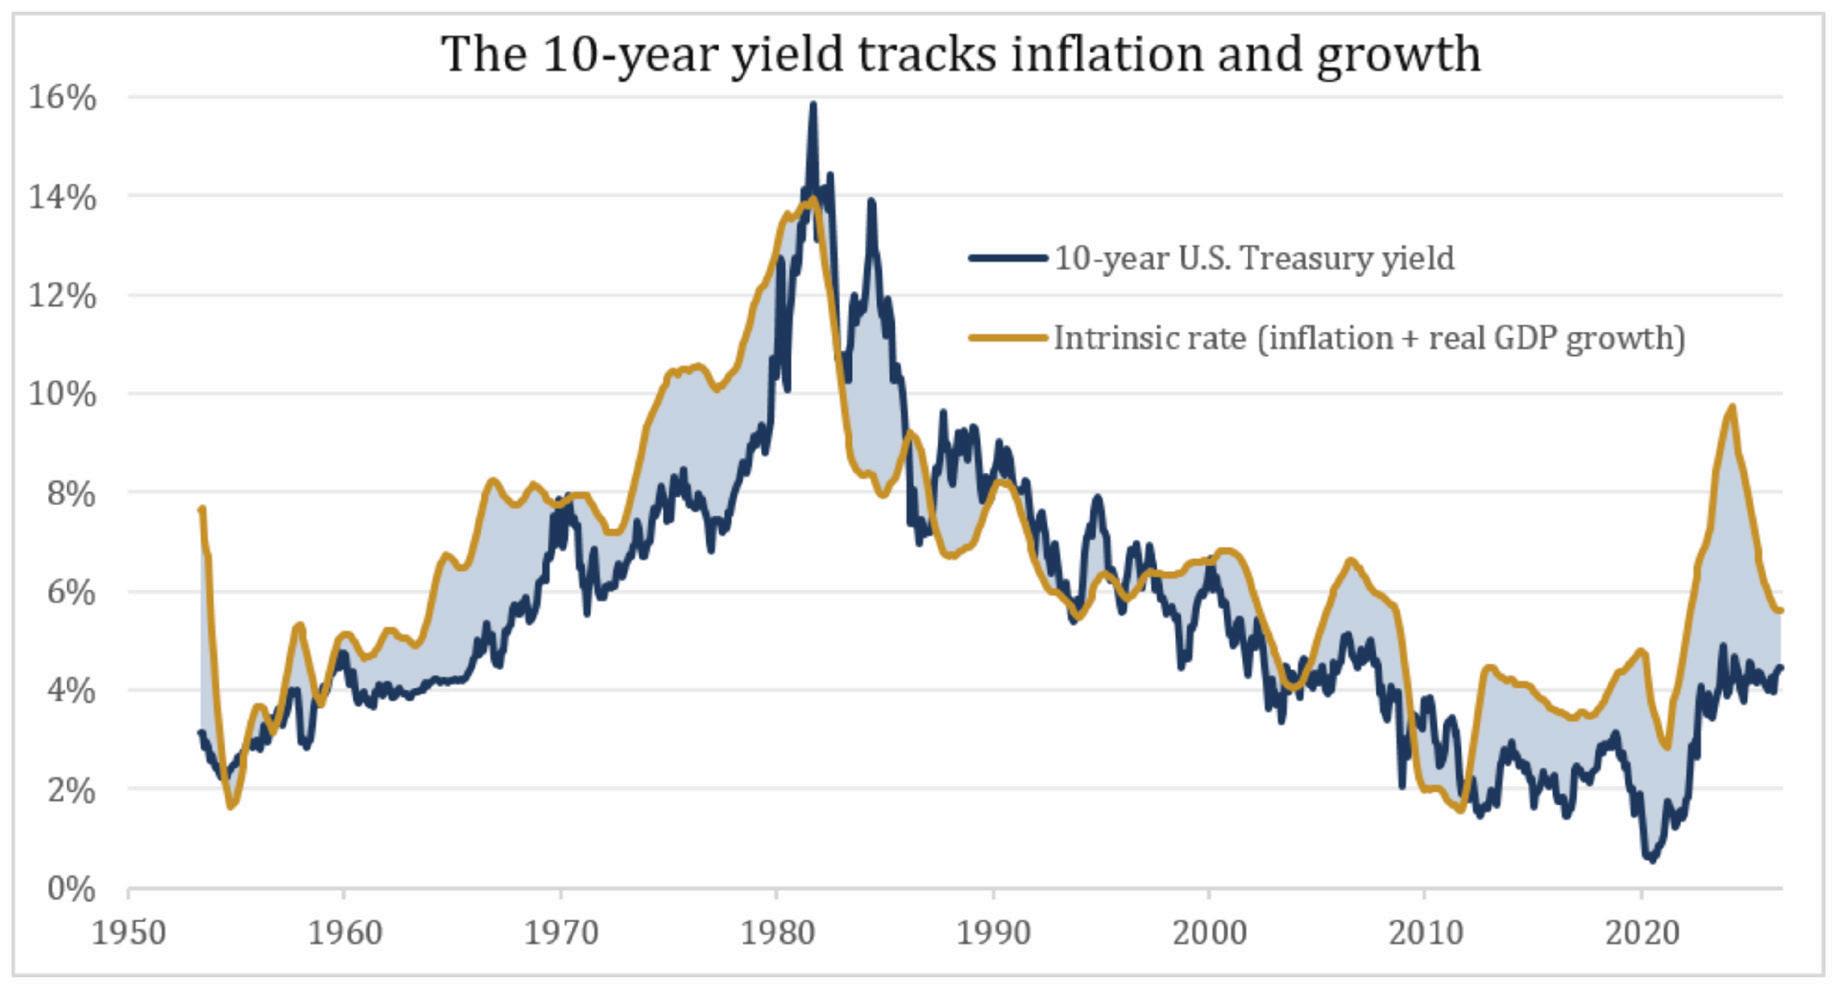
Source: FactSet. 10-Year U.S. Treasury yield, U.S. CPI (year-over-year), and U.S. real GDP growth (year-over-year), monthly, 1953–2026. Intrinsic rate shown as a three-year trailing average of inflation plus real growth to smooth recession-year distortions.
The two lines rise and fall together across every major era of the last 70 years. When inflation and growth climbed through the 1960s and 1970s, yields climbed with them. When both receded after 1982, yields followed them down. Of course, the fit is not always perfect month to month. In inflationary spikes, such as the mid-1970s and 2021–22, realized inflation temporarily runs ahead of yields. But the relationship is unmistakable, and it is the fundamentals, not the Fed, doing the work.
Seventy Years, One Pattern
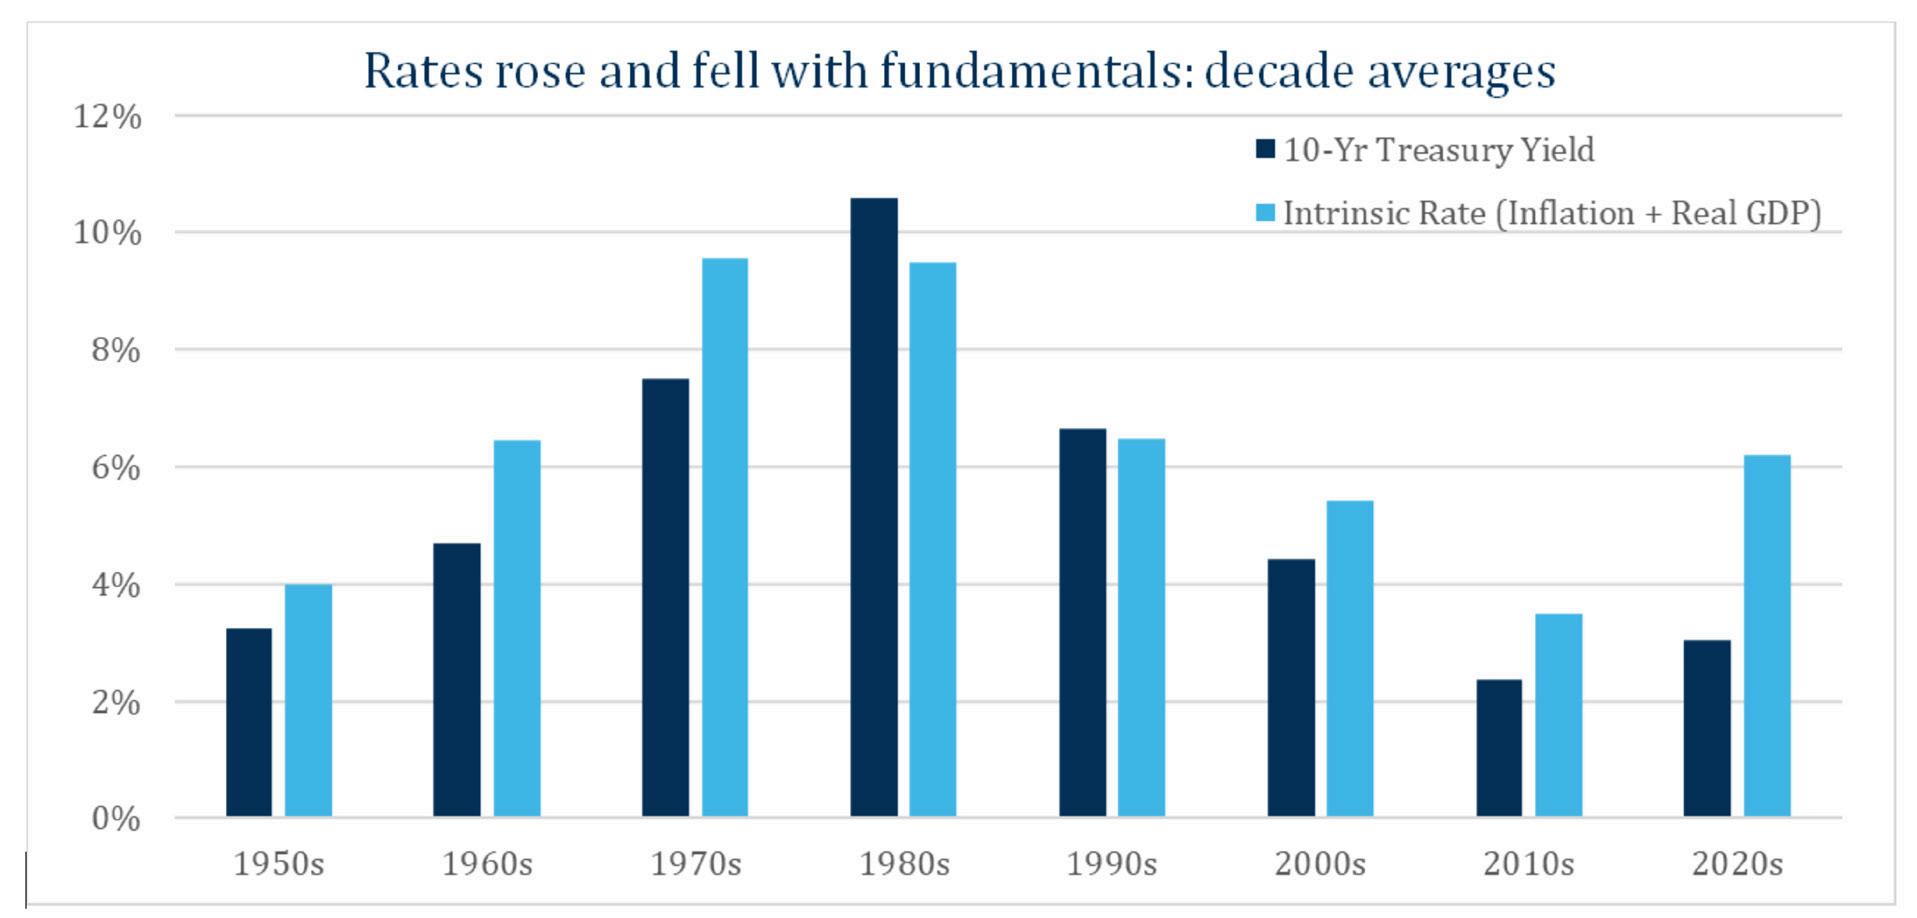
The single most important rate move of the modern era was the great bond bull market, where the 10-year yield fell from a peak of roughly 15.8% in September 1981 to a low near 0.5% in July 2020. That four-decade decline is usually narrated as a story of ever-more-accommodative central banks. The data tells a simpler story. Inflation and real growth fell, and rates fell with them. Look at the picture decade by decade:
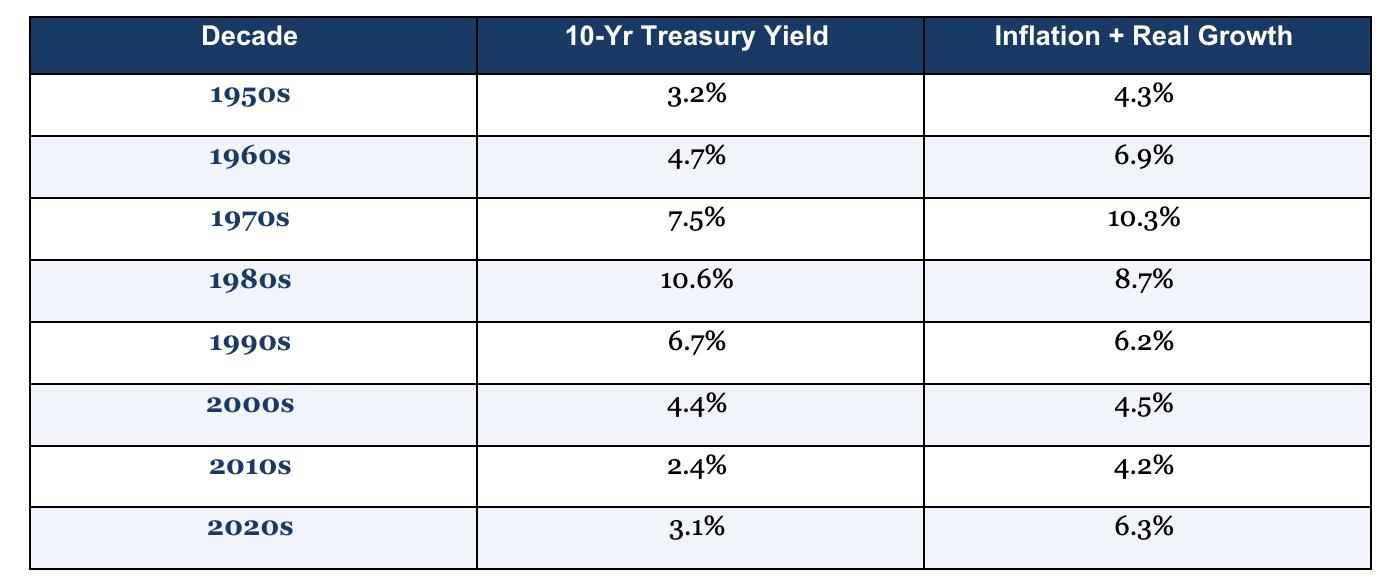
Source: FactSet. Decade averages of the 10-Year U.S. Treasury yield and of inflation (CPI) plus real GDP growth, 1953–2026. The 1950s reflect 1953–1959; the 2020s reflect data through mid-2026.
The relationship holds in nearly every decade. (One note on reading the table: realized inflation plus realized growth tends to run somewhat above yields, because realized CPI in spike years overstates the inflation investors actually expected at the time. The argument is the co-movement, not a perfect level match.)
The 1970s stand out for the wrong reasons: inflation surged, the intrinsic rate averaged above 10% and yields climbed to match. The 2010s saw yields sit well below fundamentals, the legacy of quantitative easing and a global glut of savings hunting for safe assets. Then came the 2020s: inflation returned with force and the 10year jumped from roughly 0.5% to about 4.4% today, not because the Fed willed it, but because the market repriced inflation and growth.
Rates rose and fell with fundamentals: decade averages
Source: FactSet. Decade averages, 10-Year Treasury yield versus inflation plus real GDP growth, 1953–2026.
The Tell: When the Fed Cut and Rates Rose
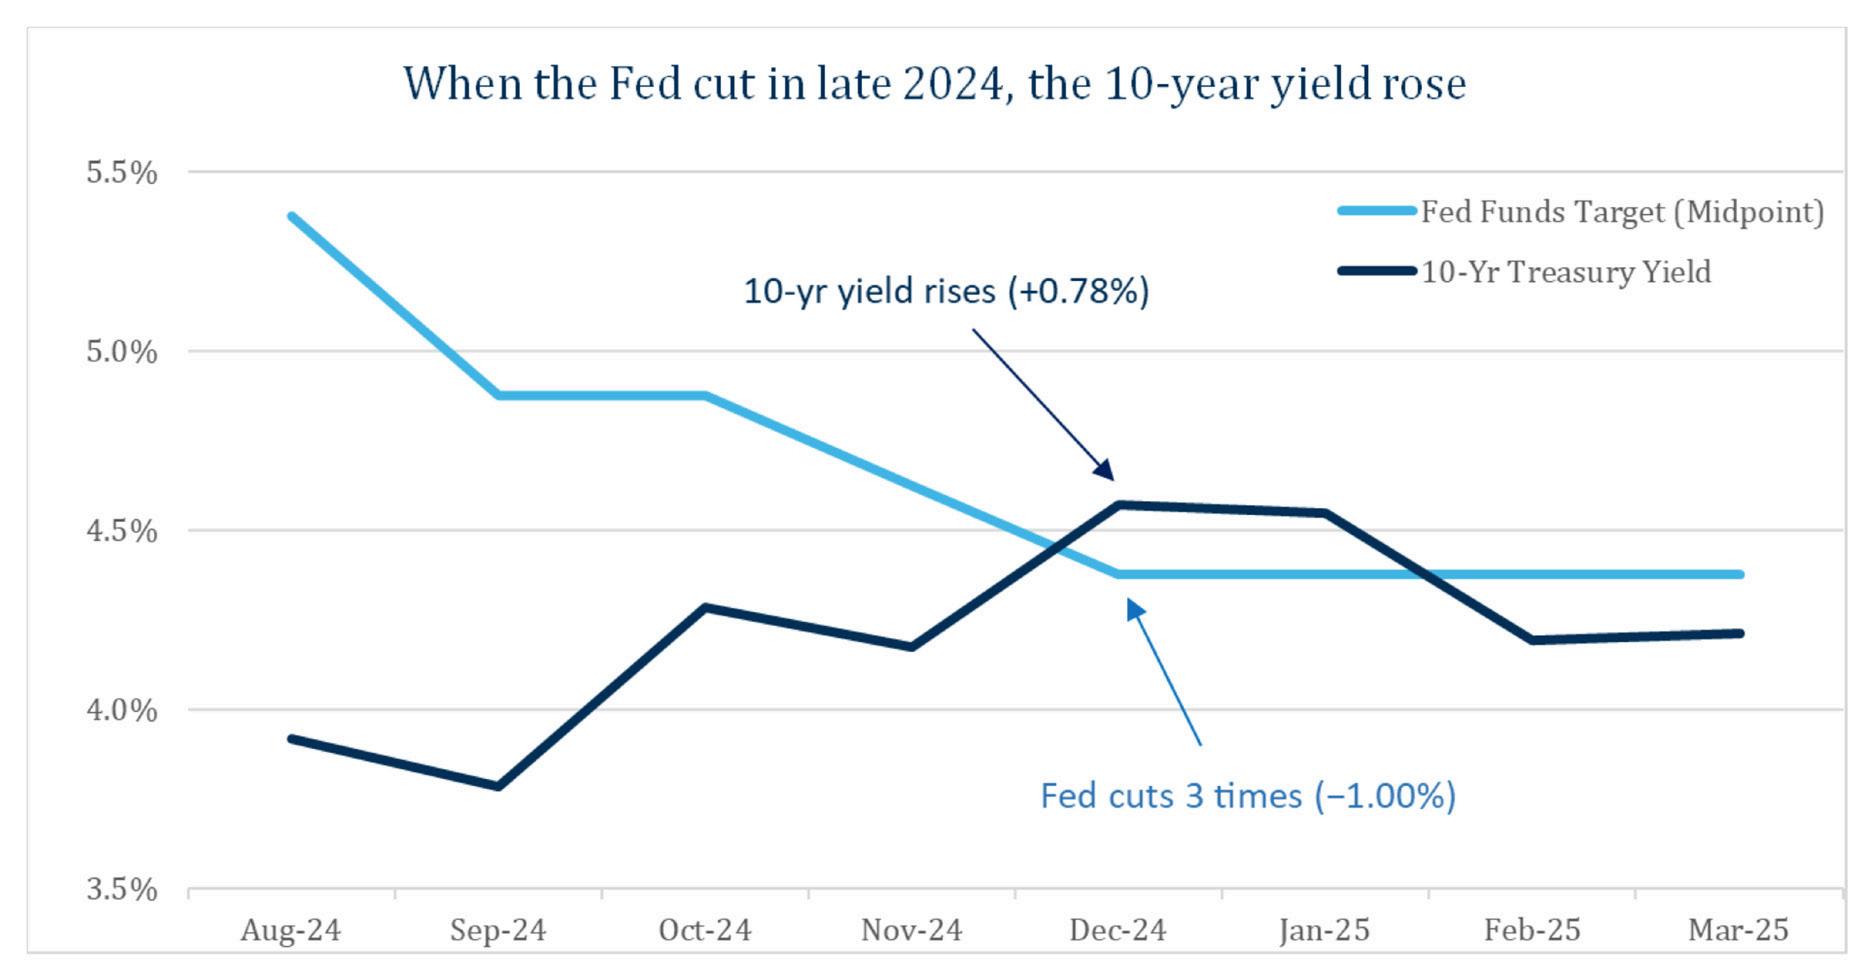
If you want a clean test of who controls long rates, the most recent example is the best. Beginning in September 2024, the Federal Reserve started cutting aggressively: a half-point reduction in September, followed by quarter-point cuts in both November and December – a full percentage point shaved off the policy rate in three months. If the Fed sets long-term rates, the 10-year should have fallen in lockstep.
Instead, it did the opposite. The 10-year Treasury yield rose from 3.79% at the end of September 2024 to 4.57% by year-end, a jump of nearly 0.8 percentage points, even as the Fed was easing. The reason is exactly what the intrinsic-rate framework predicts: over that same stretch, the market revised its expectations for growth and inflation higher. The Fed pushed down on the one lever it controls, and the rate that actually matters moved firmly in the other direction.
When the Fed cut in late 2024, the 10-year yield rose
Source: FactSet; Federal Reserve. Federal funds target rate (midpoint) and 10-Year Treasury yield, August 2024–March 2025.
So, Who Sets Rates?
Here is our honest answer to this question: The Fed sets the floor. It controls the overnight rate, it has real influence at the short end of the curve and through its signaling it shapes financial conditions. That power is genuine and worth respecting. But the 10-year yield, the rate embedded in your mortgage, your bond holdings and the valuation of every equity you own, is set by the market’s collective judgment about inflation and growth. Since 2022, it has been the market leading the Fed, not the other way around.
The past month is a case in point: a new Fed chair took office in May, yet the 10-year has traded on inflation prints and payroll surprises, not on the person at the podium.
Why do investors so consistently overestimate the Fed’s power? Partly because it is a single, visible, personified actor. You can put a Fed chair on television and watch their words move markets in real time. Inflation expectations and real growth, by contrast, are diffuse and abstract. There is nobody to interview. We are wired to attribute outcomes to identifiable agents rather than to distributed, impersonal forces. The Fed is simply a more satisfying character in the story than the aggregate expectations of millions of bond investors.
This has three practical implications. First, do not build a portfolio around trying to predict the Fed’s next move; even if you guess correctly, 2024 shows you still would not know what the 10-year would do. Second, if you genuinely want to anticipate where long rates are heading, watch inflation and growth expectations rather than the dot plot. Third, and most reassuring for long-term investors, rates are not subject to a committee’s whim. They are tethered to the real economy.
Today, the 10-year sits near 4.4%, below an intrinsic rate near 6.5% (inflation has climbed close to 4% in recent months, and real growth is around 2.7%).2 That is a market reasonably anchored to fundamentals, not one waiting to be rescued or punished by its central bank.
The Fed sets the overnight rate. The market, through inflation and growth, sets the rates that move your portfolio.
Keeping the Feedback Loop Open
It is entirely possible that you disagree with a variety of the assumptions in this article. Rather than dismiss alternative analyses as wrong, we are better served by keeping our feedback loop open. If you would like to share your opinion and/or critique ours, please feel free to share your thoughts. One of the great aspects of investing is that if you get something wrong, you always have the opportunity to change it. Refusing to change a narrative, just because it is yours, is nothing more than hubris.
Jordan Bancroft, CFA, CAIA® VP/Portfolio Manager Fargo | jbancroft@bell.bank
End Notes
1 Aswath Damodaran has written extensively on the intrinsic risk-free rate; see his Musings on Markets essays on interest rates. For our broader discussion of discount rates and valuation, see Bell Rational Reflections, Vol. 8, “The Shortcomings of Using Ratios in Valuation,” November 2025.
2 The intrinsic rate here uses the latest realized CPI reading, which climbed to roughly 4% by May 2026 from about 2.4% in January. When inflation is accelerating, realized CPI tends to run ahead of the inflation investors expect to persist, so the current gap between the 10-year and the intrinsic rate likely overstates the true distance. Either way, the move reflects the market repricing inflation, not the Fed.
Disclosures
This communication reflects the personal opinions, viewpoints and analyses of the Bell Institutional Investment Management (BIIM) employees providing such comments, and should not be regarded as a description of advisory services provided by BIIM or performance returns of any BIIM client.
The views reflected are subject to change at any time without notice. Nothing in this communication constitutes investment advice, performance data or any recommendation that any particular security, portfolio of securities, transaction or investment strategy is suitable for any specific person.
Any mention of a particular security and related performance data is not a recommendation to buy or sell that security. BIIM manages its clients’ accounts using a variety of investment techniques and strategies, which are not necessarily discussed in the commentary. Investments in securities involve the risk of loss. Past performance is no guarantee of future results.