

























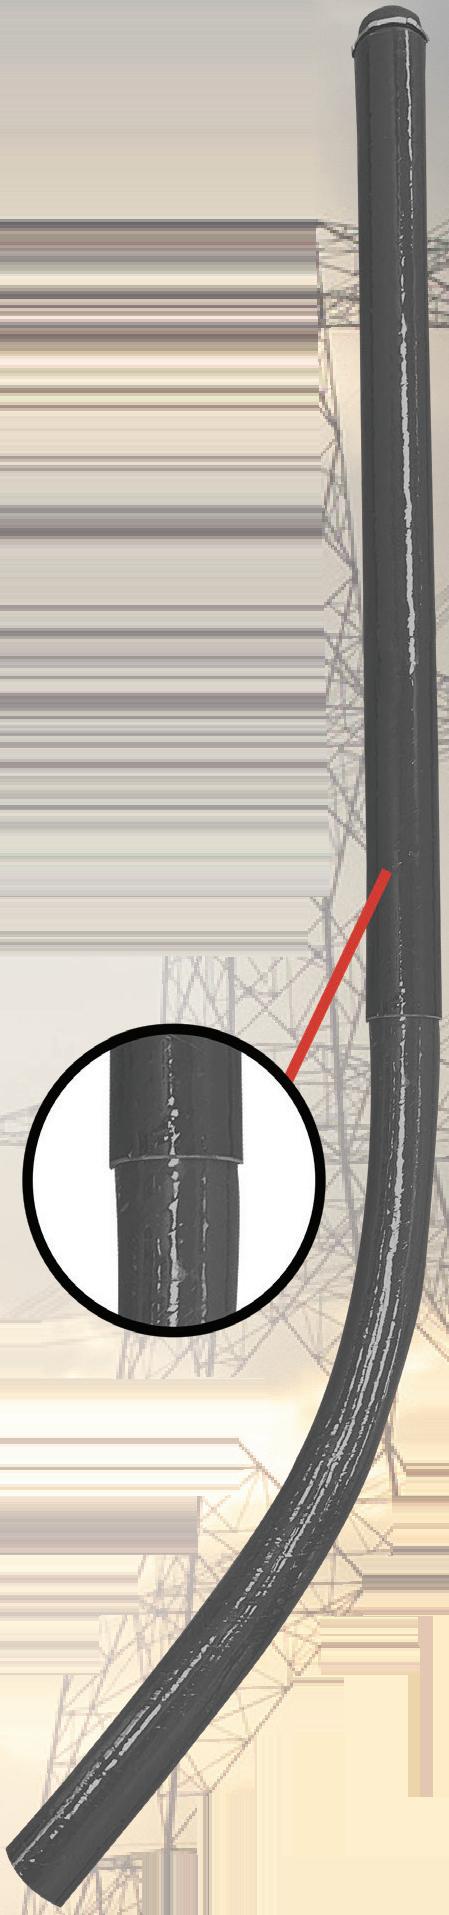
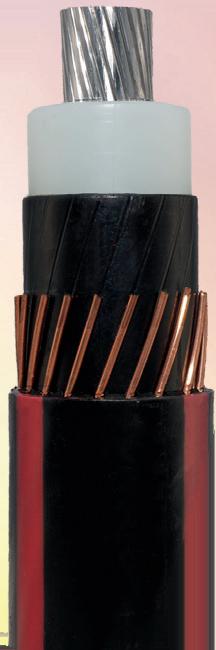
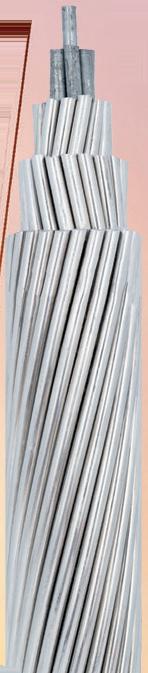
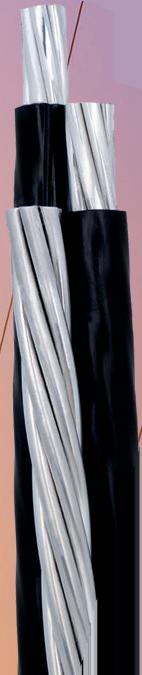
No burn-through eliminates elbow repairs
Lower material and installation costs
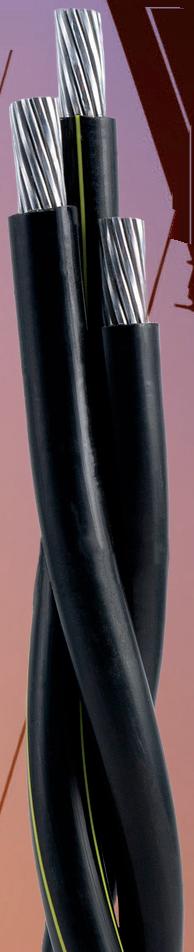
Mechanical strength protects conductors
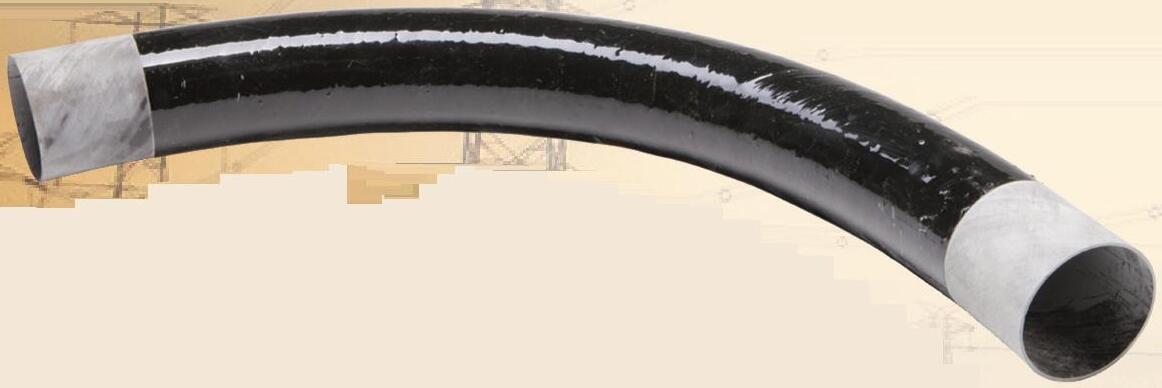
Low coefficient of friction for smooth pulls
Height adjustable utility risers
Operable in temperatures of -40° to +230°F















Part one of this two-part series explores eight electrical studies for extra-high-voltage transmission line design, with considerations for
























Visit the website daily for breaking news, videos and photo galleries. tdworld.com
Electric Utility Operations: LUMA to Install Largest Transformer in Puerto Rico’s History
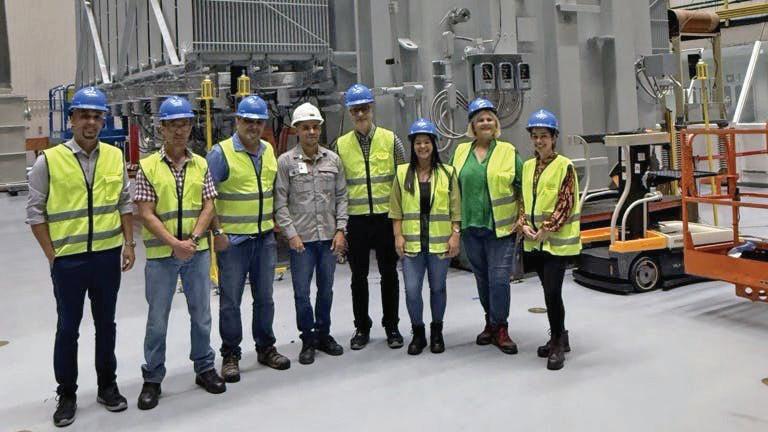
The high-capacity transformer will be installed at the Sabana Llana substation to improve grid reliability and resiliency. https://tdworld.com/ 55330506
Electric Utility Operations: Florida Power & Light Wins National Reliability Award
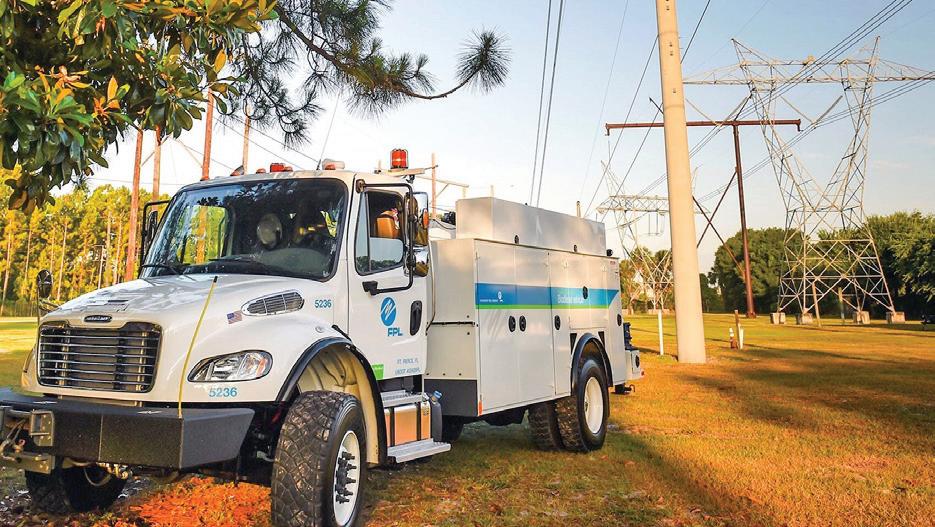
This marks the eighth time in 11 years FPL has earned the national reliability award and the first time it has won the national Reliability Value Award. https://tdworld.com/55330498
Overhead Distribution: Transforming Palau’s Power Grid: The Impact of Recloser Technology
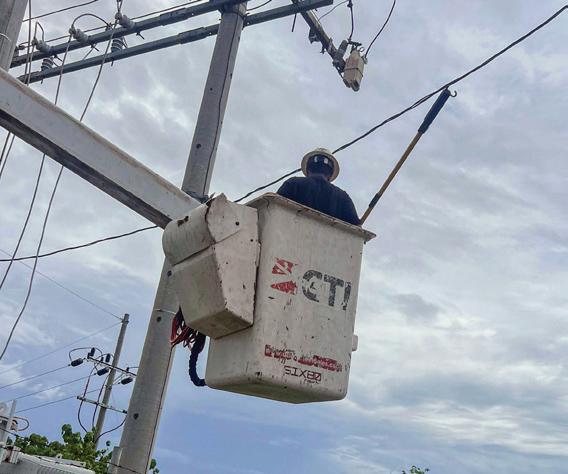
Facing severe weather and vegetation challenges, Palau’s utility adopted automated reclosers, leading to fewer outages, faster restoration, and a more resilient, environmentally friendly grid infrastructure. https://tdworld.com/55320315
Group Editorial Director Nikki Chandler nchandler@endeavorb2b.com
Managing Editor Jeff Postelwait jpostelwait@endeavorb2b.com
Senior Editor Christina Marsh cmarsh@endeavorb2b.com
Art Director Julie Whitty jwhitty@endeavorb2b.com
Field Editor Amy Fischbach EOUeditor@endeavorb2b.com
Technical Writer Gene Wolf GW_Engr@msn.com
Senior Editor-at-Large Geert de Lombaerde gdelombaerde@endeavorb2b.com
VP, Customer Marketing Angie Gates agates@endeavorb2b.com
Senior Production Operations Manager Greg Araujo garaujo@endeavorb2b.com
Ad Services Manager Shirley Gamboa sgamboa@endeavorb2b.com
Audience Marketing Manager Sonja Trent strent@endeavorb2b.com
Audience Development Manager James Marinaccio jmarinaccio@endeavorb2b.com
Endeavor Business Media, LLC
CEO: Chris Ferrell
COO: Patrick Rains
CRO: Paul Andrews
CDO: Jacquie Niemiec
CALO: Tracy Kane
CMO: Amanda Landsaw
EVP Endeavor Business Intelligence: Paul Mattioli
EVP Water & Energy Group
Diana Smith
VP of Content Strategy, Water & Energy Group Bob Crossen
T&D World (USPS Permit 795-660, ISSN 1087-0849 print, ISSN 2771-6651 online) is published 9 times a year (February to June, August to October and December) by Endeavor Business Media, LLC. 201 N Main St, 5th Floor, Fort Atkinson, WI 53538. Periodicals postage paid at Fort Atkinson, WI, and additional mailing offices. Canadian GST #R126431964.
POSTMASTER: Send address changes to T&D World, PO Box 3257, Northbrook, IL 60065-3257.
SUBSCRIPTIONS: Publisher reserves the right to reject non-qualified subscriptions. Subscription prices for 12 issues (9 print and 3 digital): U.S. ($137.50); Canada/Mexico ($170.00); All other countries ($210.00). All subscriptions are payable in U.S. funds.
Send subscription inquiries to T&DWorld, PO Box 3257, Northbrook, IL 600653257. Customer service can be reached toll-free at 877-382-9187 or at tdworld@ omeda. com for magazine subscription assistance or questions.
REPRINTS: To purchase custom reprints or e-prints of articles appearing in this publication, contact Reprints@endeavorb2b.com
PHOTOCOPIES: Authorization to photocopy articles for internal corporate, personal or instructional use may be obtained from the Copyright Clearance Center (CCC) at 978-750-8400. Obtain further information at copyright.com
PRIVACY POLICY: Your privacy is a priority to us. For a detailed policy statement about privacy and information dissemination practices related to Endeavor products, please visit our website at www.endeavorbusinessmedia.com
CORPORATE OFFICE: Endeavor Business Media, LLC, 30 Burton Hills Blvd, Ste. 185, Nashville, TN 37215, U.S.; www.endeavorbusinessmedia.com.
© Copyright 2026 Endeavor Business Media, LLC. All rights reserved.
Printed in the USA.

Each January, I like to look back at my editor’s notes and predictions from the year before to see what actually materialized and what quietly fizzled out. For this month’s Viewpoint, I want to briefly revisit last year’s predictions and then turn to what industry experts are collectively signaling for 2026.
My top prediction in January 2025 was that AI, particularly generative AI, would continue to gain traction across utility operations. That largely proved true. Most utilities now view AI as a strategic priority, and 42% plan targeted AI deployments over the next two years, according to the National Grid Partners Utility Innovation Survey released in October. Many utilities spent 2025 experimenting with or piloting AI applications for predictive maintenance, load forecasting, out age management, and customer analytics.

My second prediction was that utilities would get creative in addressing the rapid growth of data centers. Load growth dominated industry conversations throughout the year, but how utilities will ultimately meet that demand remains an open question. Much of the required generation and transmission buildout is still in planning, regulatory review, or early construction. However, we did see early creativity emerge through rate structure proposals, cost-sharing mechanisms, and regulatory discussions.
My final 2025 prediction was that utilities would continue pursuing “intelligent” undergrounding, a trend that steadily advanced throughout the year. California continues to lead due to wildfire mitigation needs, with PG&E energizing approximately 1,000 miles of underground powerlines in 2025.
For 2026, I approached predictions a bit differently. Over the past month I received a steady stream of forecasts — from analyst reports to expert commentary — offering views on where the industry is headed. I reviewed and compared several of these perspectives to see where consensus exists and where opinions diverge. While the overarching themes were not surprising, differences in priorities and solutions were telling.
Across nearly all sources, several shared predictions stood out.
1. Demand growth will strain the grid. Every expert I heard from frames 2026 as a tipping point driven by AI and hyperscale data centers, electrification across transportation, buildings, and industry, and the accelerated retirement of legacy generation. There is broad agreement that this is no longer a future concern. Utilities are already operating in what many described as a “decade of demand arriving all at once,” with planning timelines shrinking from years to months.
2. Reliability and resilience will dominate decision-making. Key focus areas include grid hardening, risk-averse operations, targeted wildfire mitigation instead of blanket shutoffs, faster restoration, and predictive outage management. At the same
time, utilities face mounting pressure from ratepayers as reliability expectations rise. Firms including West Monroe, Oracle, AspenTech, and Itron converge on a central idea: utilities will be judged first on whether the lights stay on, not solely on decarbonization progress.
3. Digital grid technologies will scale rapidly. Nearly every forecast emphasized the need for real-time situational awareness, accurate and continuously updated network models, and advanced controls such as DERMS, REMS, VPPs, and AI-enabled control rooms. There is growing consensus that software, analytics, and data governance are now as mission-critical as physical infrastructure, with cybersecurity implications closely following.
4. Utilities must operate faster. Experts repeatedly cited compressed planning and execution cycles, accelerated interconnection and permitting, and speed-to-market becoming a competitive advantage. Achieving this speed is not just about deploying technology; it requires organizational change, crossfunctional collaboration, and new operating models.
Where predictions diverged was in how utilities should meet rising demand. Some experts emphasized an infrastructure-first approach, pointing to the need for new transmission, domestic transformer manufacturing, and large-scale generation. Others argued that grid optimization — through grid-enhancing technologies, storage, advanced controls, and DERs or VPPs — could deliver relief faster.
Generation remains a particularly contentious topic. A couple of experts pointed to renewables paired with storage as the fastest and most cost-effective path to meeting demand. More cautious voices acknowledged nuclear’s political momentum but framed it as a longer-term solution. Others focused less on generation type and more on operability, flexibility, and market participation.
Despite these differences, the core message is clear: 2026 will not be about incremental change. It will test whether utilities can adapt fast enough without sacrificing reliability, affordability, or public trust.
Still, I remain optimistic. Having spent long enough in this industry, I have deep confidence in its ability to navigate complexity, adapt under pressure, and deliver when it matters most.
Editor’s Note: Thank you to the following companies and individuals for contributing their perspectives: Oracle; West Monroe; Emerson VP of AspenTech Digital Grid Management Sally Jacquemin; Switched Source CEO Charles Murray; Aligned Climate Capital CEO Peter Davidson; Fourth Power CEO Arvin Ganesan; Itron Distributed Energy Management Director of Product Nick Tumilowicz; and ProcureAbility CEO Conrad Snover. Visit tdworld.com for more in-depth trend coverage from our contributors.
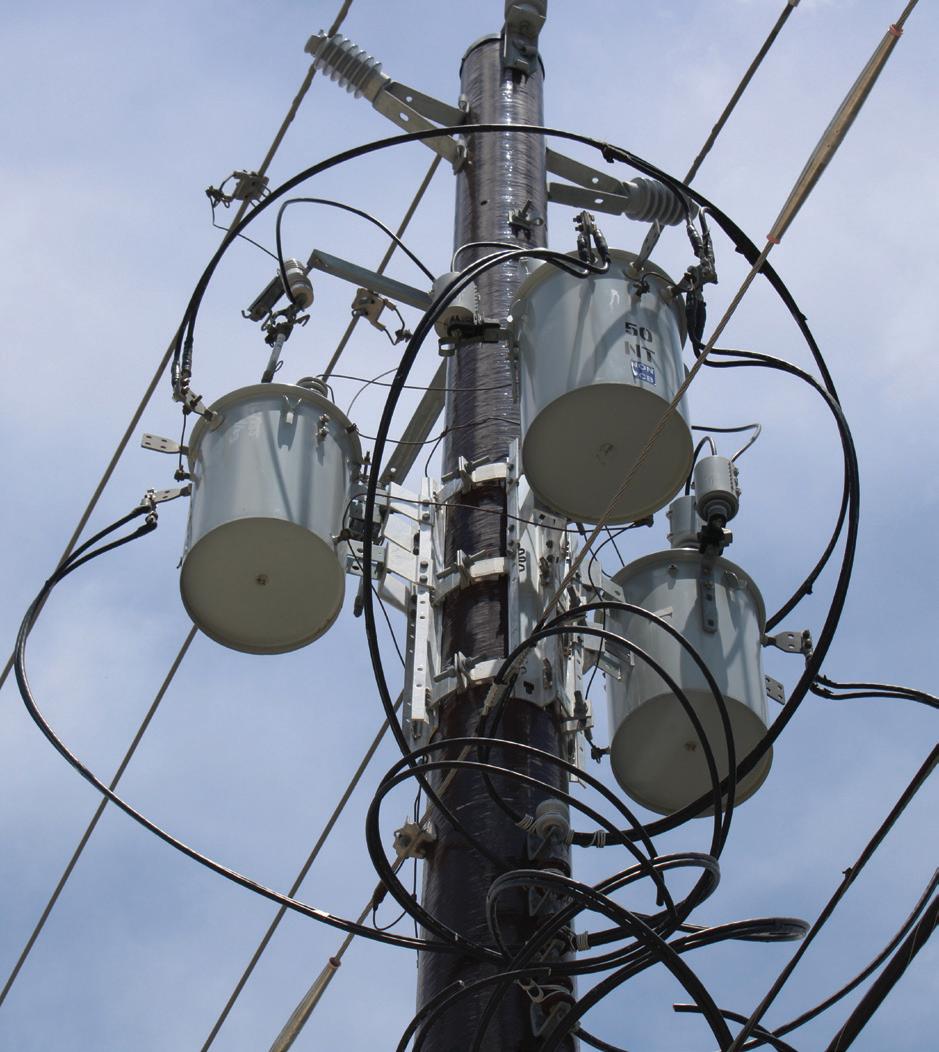
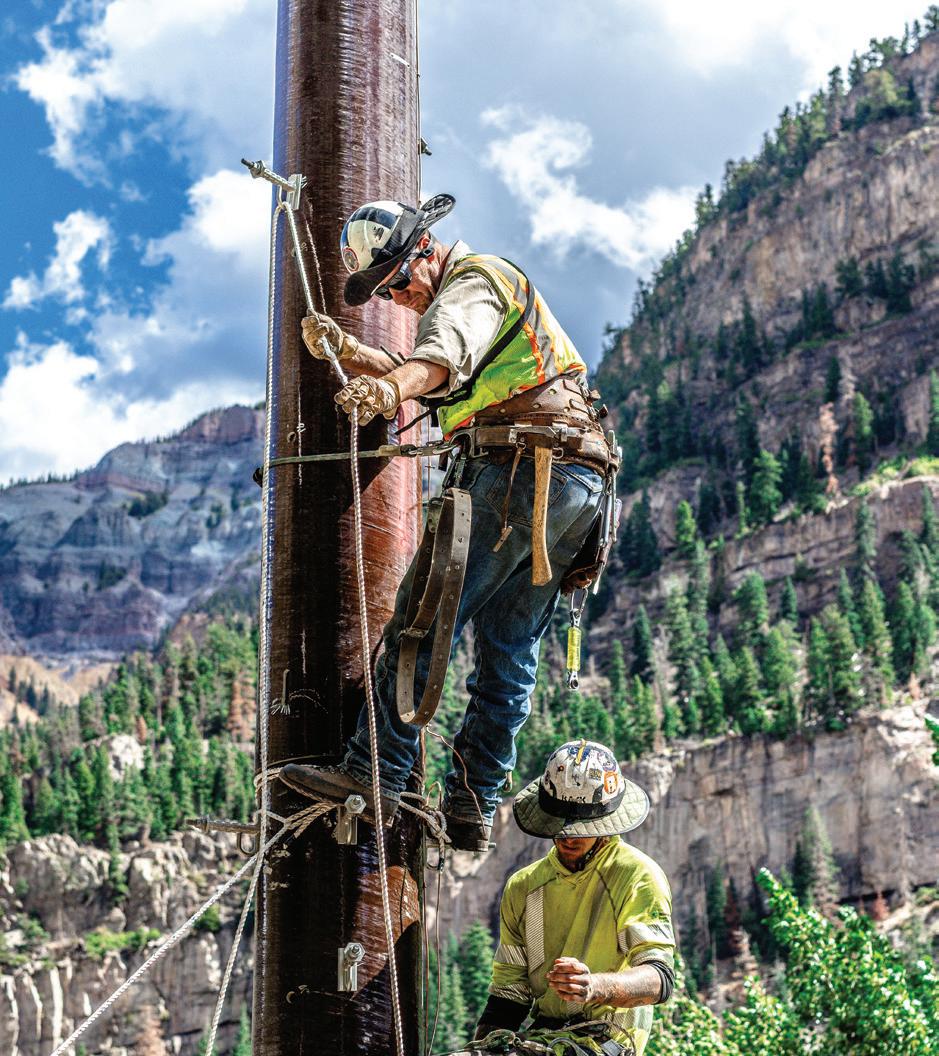
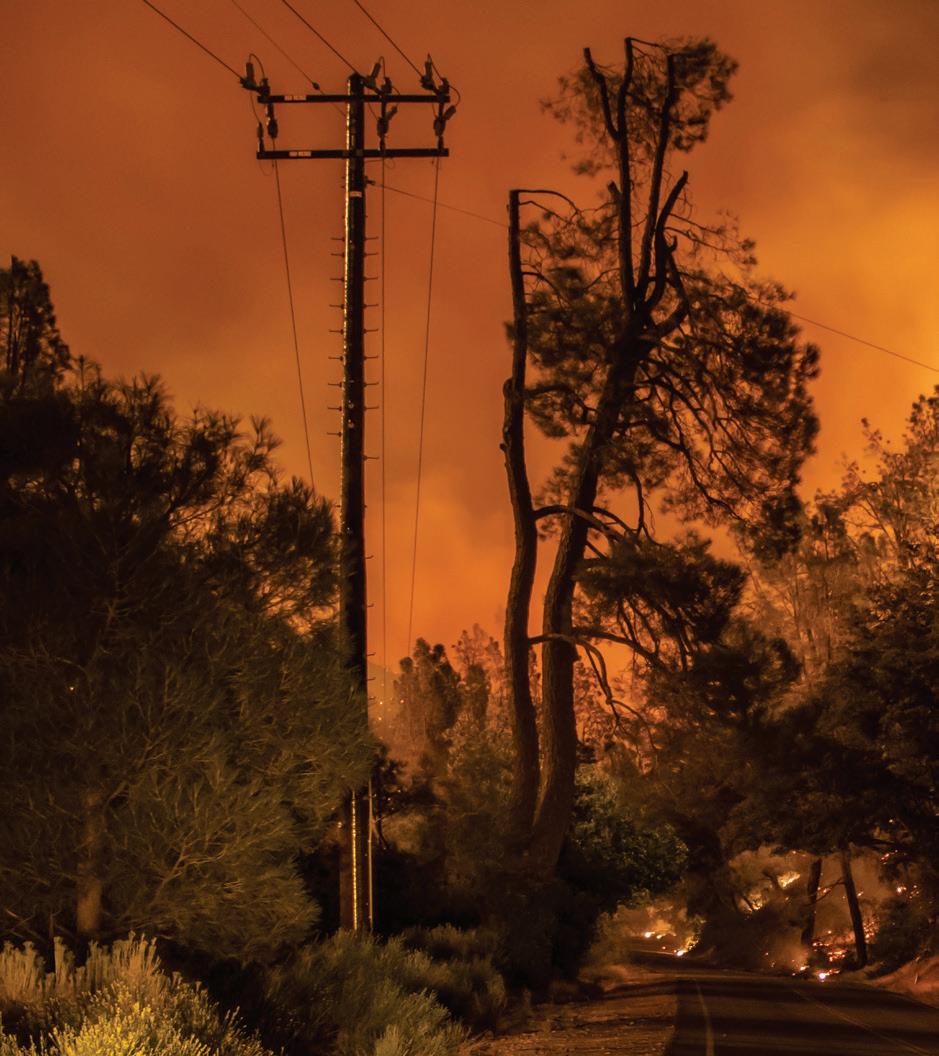
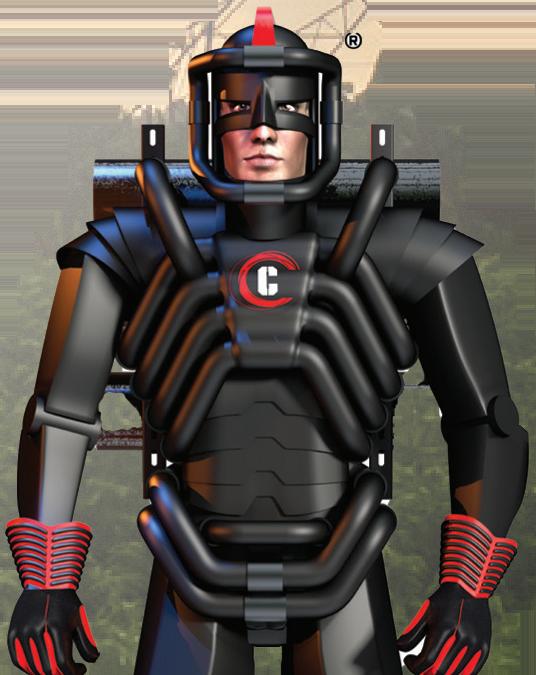
The reliability of the world’s electric power grid is tested time and again by extreme weather, challenging remote locations, or the use of inferior materials for supporting critical structures and circuits. These events can disrupt communities, compromise infrastructure, and leave millions without power. Each disruption underscores how essential it is to maintain strong, resilient connections.
RS | Resilient Structures is a global leader in advanced composite utility poles, trusted by 500+ utilities in 30+ countries to deliver reliable, resilient, cost-effective grid infrastructure.

As 2025 closed, the speculation of where the power delivery system is heading in 2026 picked up significantly. Studies, surveys, and papers focused on skyrocketing electric rates, surging power demands, and climbing infrastructure investments. None of these topics are new, but the factors driving them have gotten complicated. There are also more debates and questions with plenty of finger pointing concerning the causes. One of the biggest controversies is the rising electricity prices, which promises to be a catalyst in 2026, so let’s start there.
The popular media said electricity costs have risen at twice the rate of inflation nationally in the first three quarters of 2025, but a little digging shed more light on the subject. The New York Times ran a story about spiking electricity prices and found the pain is not equally shared. They discovered that “over the past six years the average retail price of electricity has risen faster than inflation in 26 states. But rates have stayed flat or even declined in the rest of the country.”
Here in New Mexico renewables make up 54.1% of the generation and the electric rates have dropped 6.5%. It turns out there are many factors involved when it comes to inflation fueled electricity prices. The cost of delivering electricity is one of the main components when it comes to determining electricity rates.
Utilities have been extremely busy improving the power grid’s infrastructure. Looking back at ASCE’s 2025 Report Card for America’s Infrastructure, it gave the energy sector a D+ and needs upgrading. The bottom line here is that infrastructure is nearing the end of its life span, which means spending money. Supporting this are a number of news releases such as the recent one from EEI (Edison Electric Institute). It stated that in the past decade, EEI members spent more than US$1.3 trillion to enhance critical grid infrastructure. It went on to say that members are planning to spend US$1.1 trillion more over the next five years to expand the power grid.
are blaming new hyperscale data center demand for the problem. They pointed out that new data centers can be built faster than power plants or transmission lines, which is a bottleneck that really drives up pricing.
Renewables are the cheapest and fastest generation option. It’s a proven fact that wind and solar power can be built much faster than fossil fuel plants. Utility-scale solar can be online in 6 to 21 months. Wind farms take longer but they’re quicker than fossil-fueled power plants. Still, fossil-fueled power plants and transmission lines can take decades, but there’s also a workaround. It’s the advanced transmission technologies that have been bred for this type of challenge.
These grid-enhancing technologies (GETs) are not strangers to “Charging Ahead,” since we have been talking about them for several years now. If you remember, GETs are off the shelf hardware and software that increase the capacity and efficiency of the transmission grid. They’re not stopgap measures, but rather near-term solutions that require far less time to install and alleviate critical issues like congestion, limited capacity, improve reliability, and meet rising demand. They come in two types; one provides fast-track installations while the other takes more time to deploy because they’re more complex.

For example, advanced conductors can be used to reconductor an existing transmission line without replacing structures and in many cases not requiring permits. There are examples of reconductored lines adding 50% to 110% to the power line’s capacity rating and it can be done in months rather than years. Another fast-track GET is the dynamic line rating technology. It’s hardware is installed on the transmission lines conductor and provides real-time loading data. Many operators see 25-30% or more unused capacity being made available. Long-term GETs include power electronics that can shift flows of power, balance overloading, and improve congestion.
Also we can’t overlook the old supply and demand equation and its impact on electricity pricing. A timely Deloitte paper projected that the U.S. peak demand would increase by approximately 26% by 2035. They went on to say, “In 2026, the challenge for utilities will be quickly delivering uninterrupted or “firm” capacity to stressed parts of the grid.” Some experts
It looks like 2026 is going keep us busy. There are power hungry hyper-datacenters popping up like mushrooms after a rainstorm, an aging infrastructure getting attention, and GETs poised to address issues traditional approaches can’t handle. These are interesting times indeed!









Power demand continues increasing, but traditional responses are too slow.
Last month “Charging Ahead” looked at the technological shift taking place in many industries called technology agnosticism” often referred to as tech-agnostic. It’s a technological approach that’s not tied to any single technology, platform or vendor. For more details, see “Is the Grid Going Tech-Agnostic” in the December 2025 issue of T&D World. Tech-agnostic makes a great deal of sense to the power delivery system with its extensive application of digital technologies. The main emphasis of the December discussion was the tech-agnostic approach being applied to distributed energy resource (DER) technologies and distributed energy resource management systems (DERMS).
Residential customers have welcomed DERs, which encouraged DERMS as rooftop solar plus storage gained prominence globally. Experts have been pointing out that these DERs and DERMS represent an untapped behind-the-meter (BTM) power source. But in the last few years the power industry has been discussing virtual power plants (VPPs). Especially when the focus shifts to skyrocketing power demands from hyperscale and colocation data centers. Last October, S&P Global reported their projections for data center grid-power demand. It’s expected to be about 61.8GW for 2025 and it’s anticipated that these users’ demand will continue climbing.
Interestingly, many utilities are increasingly turning to VPPs for a non-wires solution to increase the power supply quickly. DOE’s “Virtual Power Plants — 2025 Update” states that “VPPs are aggregations of DERs that can balance electricity demand and supply and provide utility-scale and utility-grade services.” One group emphasizes that modern VPPs take advantage of AI (artificial intelligence), cloud computing, and blockchain technology. It allows them to enhance DER input at extraordinary
scales. What’s the bottom line when it comes to BTM DER availability for aggregating into utility-scale capacities? Well, as 2025 closed, the magnitude of US DERs was projected to reach 397 gigawatts (GW).
Those 397GWs of BTM DERs consist of residential solar panels, battery storage systems, electric vehicles, smart thermostats, etc., which brings up another question. Does anyone have any idea how much of this BTM DER capacity is actually being used to power VPPs right now? Wood Mackenzie has one of the most comprehensive analysis on the subject with their “2025 North American Virtual Power Plant.” It found that between 2024 and 2025 the operational VPP capacity in North America increased from 33GW to 37.5GW. Sharp-eyed readers will say, technically that doesn’t answer the question.
They’re correct and reading further into the reports revealed that only about 10.2% or 3.8GW of the VPP wholesale market capacity can be attributed to the residential customers’ DERs. That is a small percentage because of barriers from regulators, policymakers, and the utilities themselves. These hurdles have impacted residential DERs from participating in VPPs, but it’s also opened these resources to third party aggregation. In effect, residential customers have pushed back by successfully contracting with companies like Sunrun, Renew Home, Stem Inc., and others.
Sunrun recently announced that 2025 saw a 400% growth in their VPP participation with enrollments of over 106,000 customers in 17 active VPP programs across the country. That brings their dispatchable battery capacity to approximately 3.7 gigawatt-hours for grid support. In 2024 Sunrun was able to
dispatch 416 megawatts across its VPP programs. That’s the equivalent of a pretty good size power plant, but it comes from thousands of residential customers and it’s all clean energy!
Stories like Sunrun’s give organizations like the Energy Policy Design Institute (EPDI) the facts and figures for their goal of, “overcoming policy barriers preventing large-scale VPP deployment.” EPDI stated that VPPs programs have a very successful track record, but there’s confusion and misunderstanding on the part of regulators and policymakers. EPDI has launched an effort to help state public utility commissions to “cut through the noise.” EPDI feels there’s a need for state commissions to make informed, evidence-based decisions. All that said, one way or another, VPPs are becoming grid infrastructure.
VP3 is the Virtual Power Plant Partnership; it’s a coalition led by RMI (formerly Rocky Mountain Institute). Like EPDI they are working to increase the numbers and sizes of VPPs by changing policies, regulations, and market rules. VP3 supports tech-agnostic applications as a way of doing this. There are a growing number of utilities, manufacturers, and suppliers who are taking part in the VP3 coalition. RMI’s VP3 Flipbook makes for some interesting reading. Its introduction reported that the members’ VPP projects “provide 1,500 megawatts of capacity from 3.9 million enrolled customers.
Experts are saying VPP technology’s future is tech-agnostic if VPPs are to compete with traditional power plants. According to Precedence Research the VPP global market size is about US$6.28 billion in 2025. It’s expected to grow to roughly US$39.31billion forecast to grow at a CAGR of 22.61% through 2034. In more tangible terms, Wood Mackenzie reported that active number of virtual power plant (VPP) deployments in North America reached 1,940 in 2025. That is a 33% increase from the 1459 deployments in 2024. That is good news because it suggests growing interest from new VPP participants and tech-agnostic VPPs are part of this activity.
The numbers of tech-agnostic VPPs that can be found on the power grid are growing as the playing field is flattened. In 2024, Portland General Electric (PGE), a VP3 member, collaborated with Enbala to develop a tech-agnostic VPP that aggregates and integrates DERs like solar panels, batteries and smart thermostats into a utility-scale power source. It utilizes APIs (Application Programing Interfaces) for broader integration of DERs from a wide selection of suppliers.
Several months ago, PG&E, SCE, and SDG&E made history in California according to one press release. It said these utilities “tapped 100,000 residential storage batteries to form a first of its kind VPP.” It went on to say, “those batteries supplied about 535 megawatts of electricity to the grid — enough to supply the electrical needs of hundreds of thousands of homes during peak demand.”
Green Mountain Power (GMP) has about 6,000 customer batteries throughout Vermont through two programs. A GMP press release reported these are the first, fully tariffed, home
battery programs in the country. These battery powered VPPs were utilized by GMP during the 2024 eclipse that darken New England skies. The VPPs’ 50 megawatts stabilized the grid while reducing customer energy costs during the event with its seamless backup power.
The challenges are growing, and the stakes are high. If expert projections are accurate, the balance of load to supply is getting more tricky every day and solutions like VPPs are essential. One school of thought believes those skyrocketing demands from hyperscale data centers are not going to slow down. They anticipate this load will continue and their 2030 expectations of roughly 134.4GW. Another school reminds us of the overbuilding that the grid experienced about 25 years ago with the dot-com bubble. They point out it was a situation much the same as we are experiencing today with AI and data centers potential demands and we can’t afford that overbuilding today. Whichever school is correct, tech-agnostic VPP technologies fit nicely with either scenario. The resources are there because our customers have embraced DERs to the point where we have hundreds of gigawatts of clean efficient electricity available on the distribution system. We don’t need to rush to overbuild the transmission system like happened with the dot-com fiasco. Also, there’s no reason to damage the environment by wasting time and resources trying to resuscitate dead or dying antiquated fossil-fuel power plants. The VPP tech-agnostic technology is available, it’s been proven, and it has the flexibility needed to balance the load versus supply. Last summer should have removed anyone’s doubt about the VPP’s viability.
Remember last June’s severe heat dome event? It was an event that many of the popular media outlets referred to as the “VPP rescue.” That heat dome settled over the eastern and midwestern US, driving the temperatures into triple digits. It resulted in demand reaching multi-year peaks. VPPs were credited with helping those areas of the US power grid avoid widespread blackouts. It also proved VPPs were capable of providing the grid with support and resilience. The “rescue VPPs” were a mixture of tech-specific and tech-agnostic approaches. Tech-agnostic compliant elements, however, are going to replace old-school tech-specific methodologies completely, it’s only logical.
Tech-agnostic VPP platforms give DERs the capability of acting collectively as a single flexible power plant with real-time dispatchability and producing revenue. With hundreds of untapped gigawatts, they can address many of the challenges facing today’s power grid like balancing load with adaptable supply or decarbonization. One group calls VPPs software-defined power that’s redefining the physical infrastructure.
By themselves, DERs address the customer’s energy budget and lessen power outages. Add tech-agnostic applications and they are aggregated into utility-scale VPPs addressing the grid’s load demands. Maybe that’s what makes it so fascinating. Using technology to shift thermostats, rooftop solar, and home batteries into a powerplant. That’s the future!
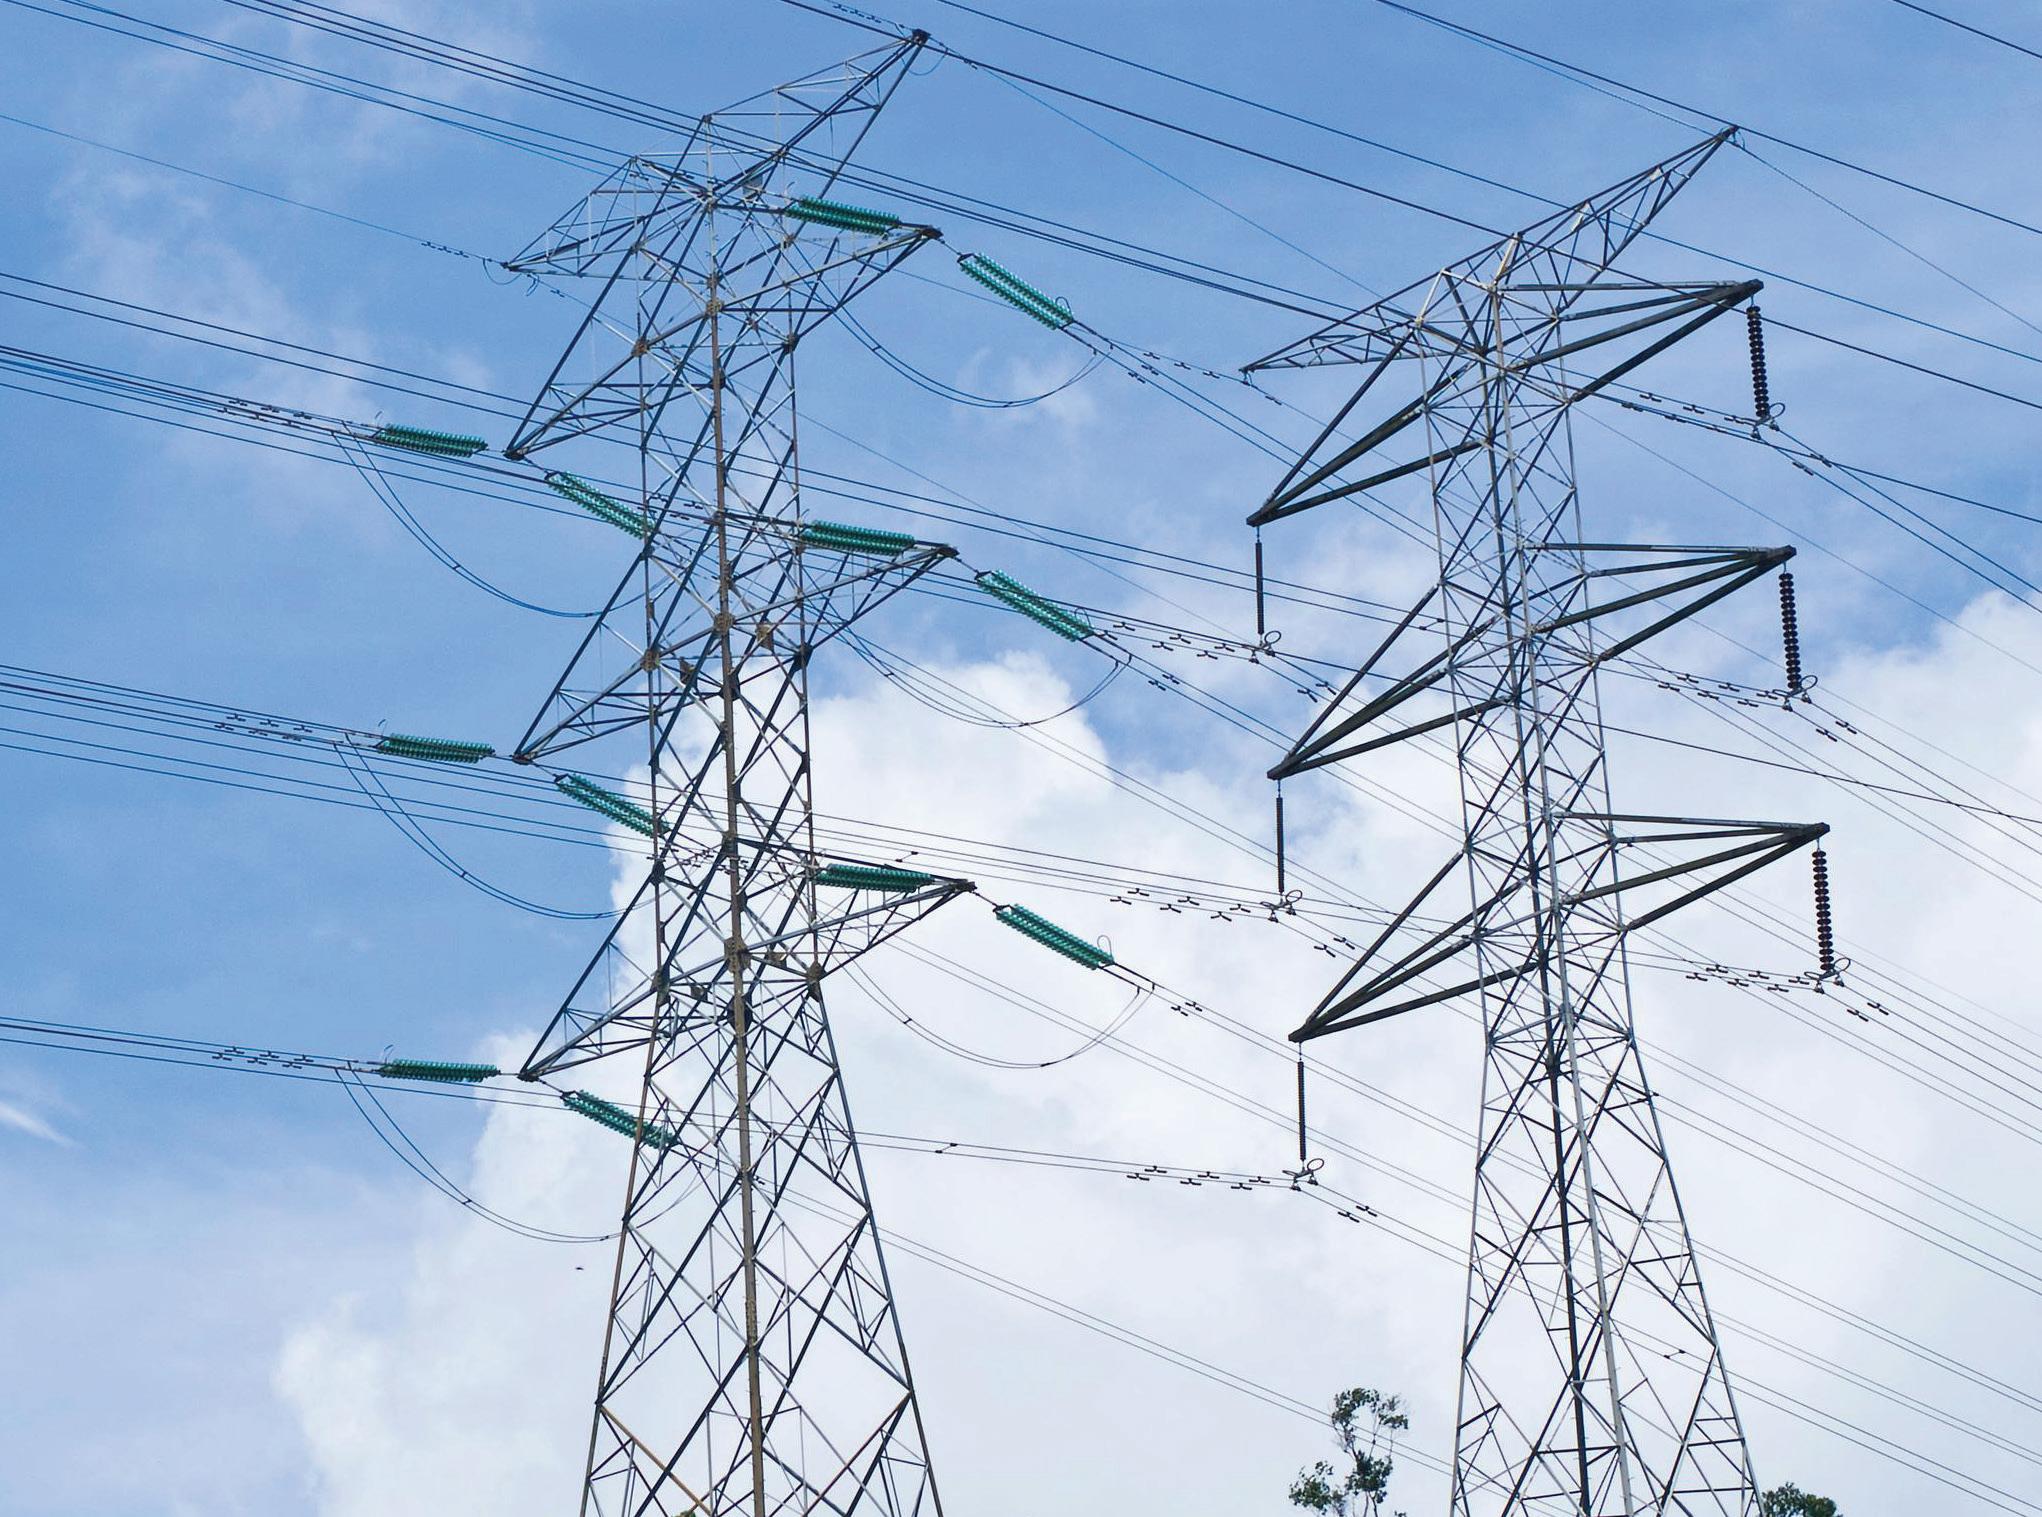
Georgia Power has outlined new transmission infrastructure projects in Coweta, Fayette, Fulton and Heard counties as part of its ongoing efforts to enhance the power grid and address future energy demand. The planned upgrades include the installation of advanced high-voltage transmission lines, improvements to existing substations, and the integration of smart grid technologies. According to the company, these enhancements are intended to support long-term reliability and system resiliency.
“As Georgia has grown, we’ve been here every step of the way—supporting new businesses and families with the energy they need,” said Melvin Roland, senior vice president of Transmission at Georgia Power. “These new transmission lines and infrastructure upgrades will help strengthen the grid, reduce outages, and build a more resilient energy future for our communities. Additionally, the new transmission lines will optimize electricity flow across the grid, improving efficiency and reliability for customers in South Metro Atlanta.”
Recent investments in South Metro Atlanta include the Ashley Park 500/230 kV substation and associated 230 kV transmission lines, which extend more than 10 miles through Fayette County and are expected to be completed in spring 2026. Georgia Power is also advancing the Ashley Park–Wansley 500 kV transmission line, one of the initial projects under the company’s latest 10-year transmission plan. The 35-mile line will connect the Ashley Park Substation north of Fayetteville to Plant Wansley near Roopville, where the company plans to develop new battery energy storage systems and natural gas generation. Survey work is underway, with clearing and grading scheduled for the first quarter of 2027, construction set for the third quarter of 2027, and project completion anticipated in the second quarter of 2028.
Georgia Power notes that its project development process is intended to be flexible and community-focused, with attention to maintaining reliability while limiting impacts on residents. The company conducts community meetings and shares project information through handouts, maps, letters, and postcards for landowners and nearby businesses.
“We understand that customers may have concerns about infrastructure near their homes, and we’re committed to listening and responding with care,” Roland said. “Our goal is to minimize disruption and be a trusted partner throughout every phase of these critical projects.”
The projects align with Georgia Power’s 2025 Integrated Resource Plan (IRP), approved by the Georgia Public Service Commission on July 15, 2025. The IRP includes a 10-year transmission roadmap featuring more than 1,000 miles of planned new transmission lines intended to support system efficiency, resiliency and the state’s growing energy needs.
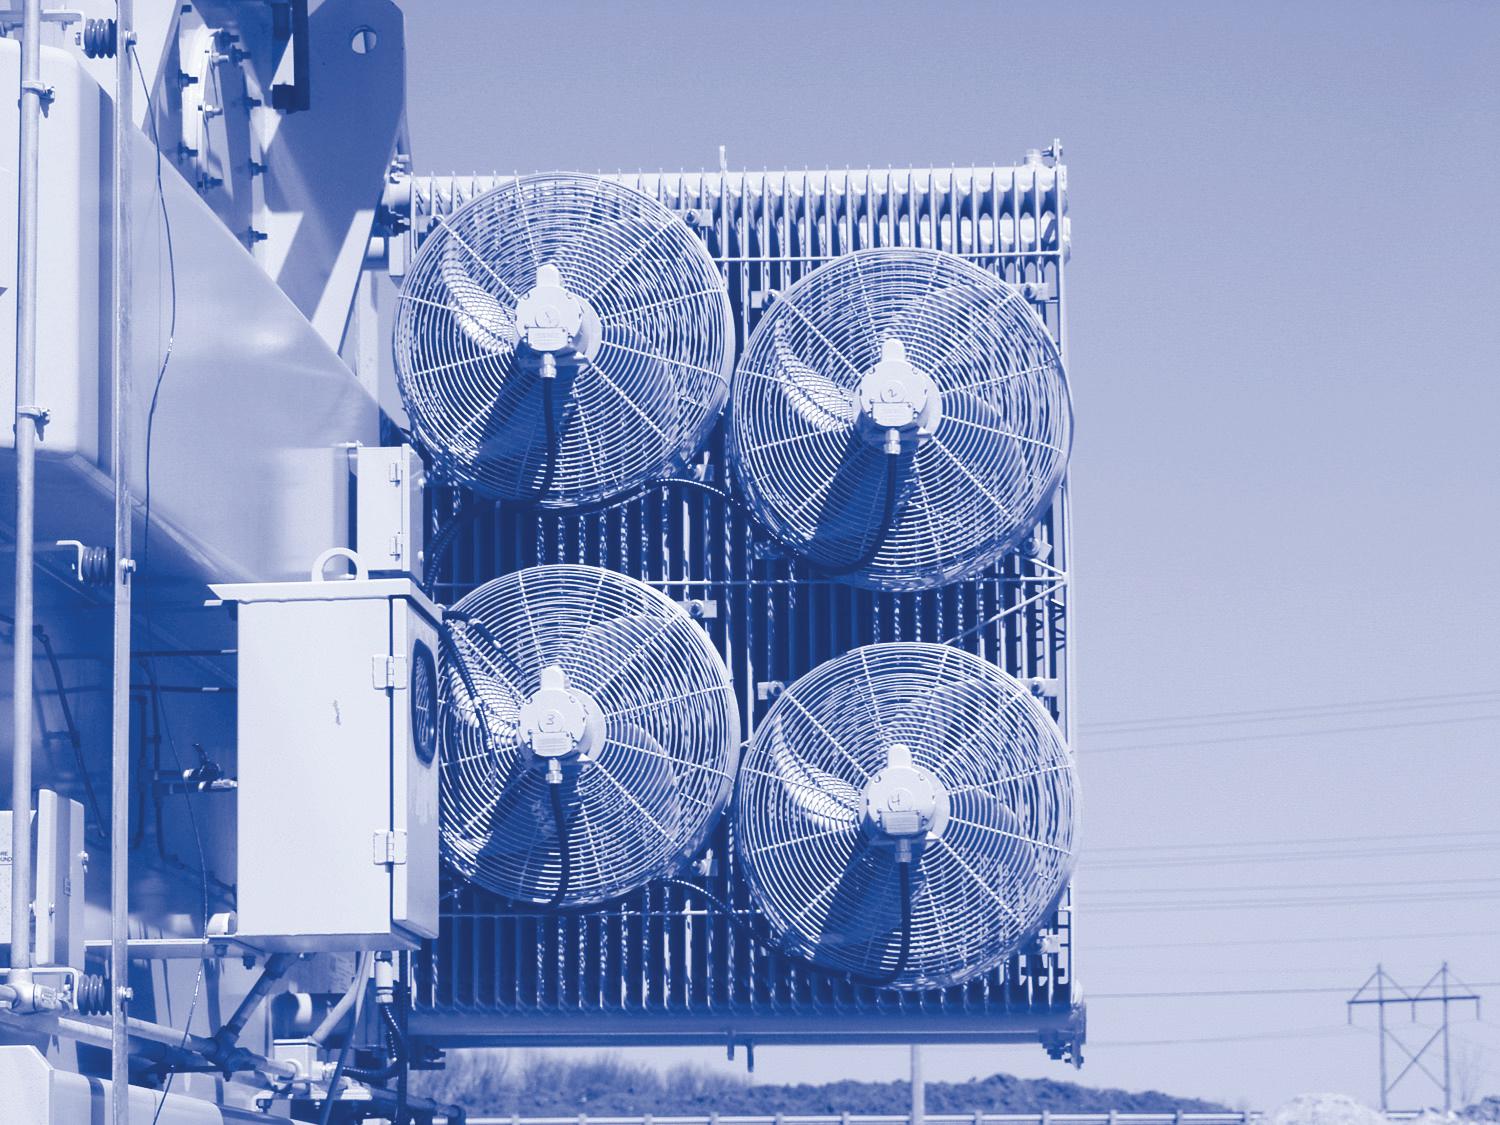
PJM Interconnection has recommended NextEra Energy Transmission and Exelon to deliver a critical energy infrastructure project as part of its 2025 Regional Transmission Expansion Plan.
The approximately 220-mile 765 kV high voltage transmission line is designed to support safe, reliable and affordable energy for families and communities across Pennsylvania and parts of West Virginia and spur economic growth. The transmission line is expected to connect to substations supplying electricity to residents and businesses across the region.
“Together with Exelon, we’re delivering a stronger, more resilient grid that improves access to low-cost energy for millions of families and businesses across Pennsylvania and West Virginia,” said John Ketchum, NextEra Energy chairman and CEO. “This critical project will power communities for decades to come, and we are committed to working closely with those communities along the proposed line to enable the many project benefits.”
“This project will help deliver abundant, reliable power to communities, stabilize electricity prices, create jobs and position us to power the types of investments announced at the Energy
and Innovation Summit in Pittsburgh earlier this year, which will drive our economic growth for decades to come,” said Senator Dave McCormick (R-PA).
765-kV lines transfer 2–3 times more power as compared to 500-kV lines while reducing transmission losses by 50%.
• Improved resilience during peak demand helps lower electricity costs.
• Smaller environmental footprint, as fewer towers are required compared with equivalent transmission structures.
The proposed bi-directional 765-kV superhighway is predicted to facilitate approximately 7 GW of power. The transmission line:
• Supports Pennsylvania’s $92 billion investment in new power generation across the Commonwealth as announced in early 2025 by President Trump, Senator McCormick and Governor Shapiro.
• Supports West Virginia Governor Morrisey’s 50 GW by 2050 plan to invest in coal, natural gas and workforce development. In November, Governor Morrisey announced $4.2 billion in investments toward his vision.
The PJM Board’s final vote to approve the transmission project is scheduled in early 2026.
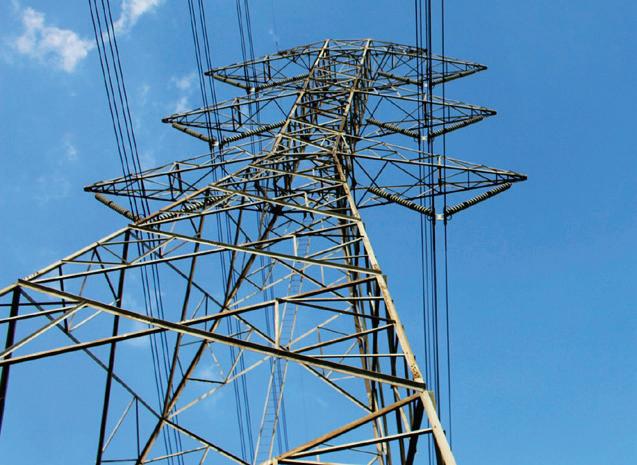
Xcel Energy and its subsidiary Southwestern Public Service Company along with Transource Energy have been awarded the Beckham County–Potter 345 kV transmission project by the Southwest Power Pool (SPP) Board of Directors.
The project is a key component of SPP’s 2024 Integrated Transmission Planning Assessment, which is designed to strengthen the regional grid and support growing electricity demand.
The new transmission line will cover approximately 128 miles, connecting Xcel Energy’s Potter County substation near Amarillo to Oklahoma Gas & Electric Company’s Beckham County substation in western Oklahoma. The investment will enhance electric reliability, improve
system resilience and enable future growth across the SPP footprint.
Project Highlights:
• Major Investment: Estimated cost of $222 million to expand extra-high voltage infrastructure in the region.
• New Transmission Line: Approximately 128 miles of 345 kV line linking Texas and Oklahoma.
• Timeline: Expected in-service date of November 2029.
“This project reinforces our commitment to delivering reliable, cost-effective energy to our customers while supporting the region’s long-term energy needs and growing economy,” said Jarred Cooley, Strategic Planning Director for Xcel Energy. “Partnering with Transource
allows us to combine not only expertise, but also resources to strengthen the grid for decades to come.”
The project is part of SPP’s ongoing efforts to modernize transmission infrastructure and ensure dependable service for communities experiencing increased electricity demand.
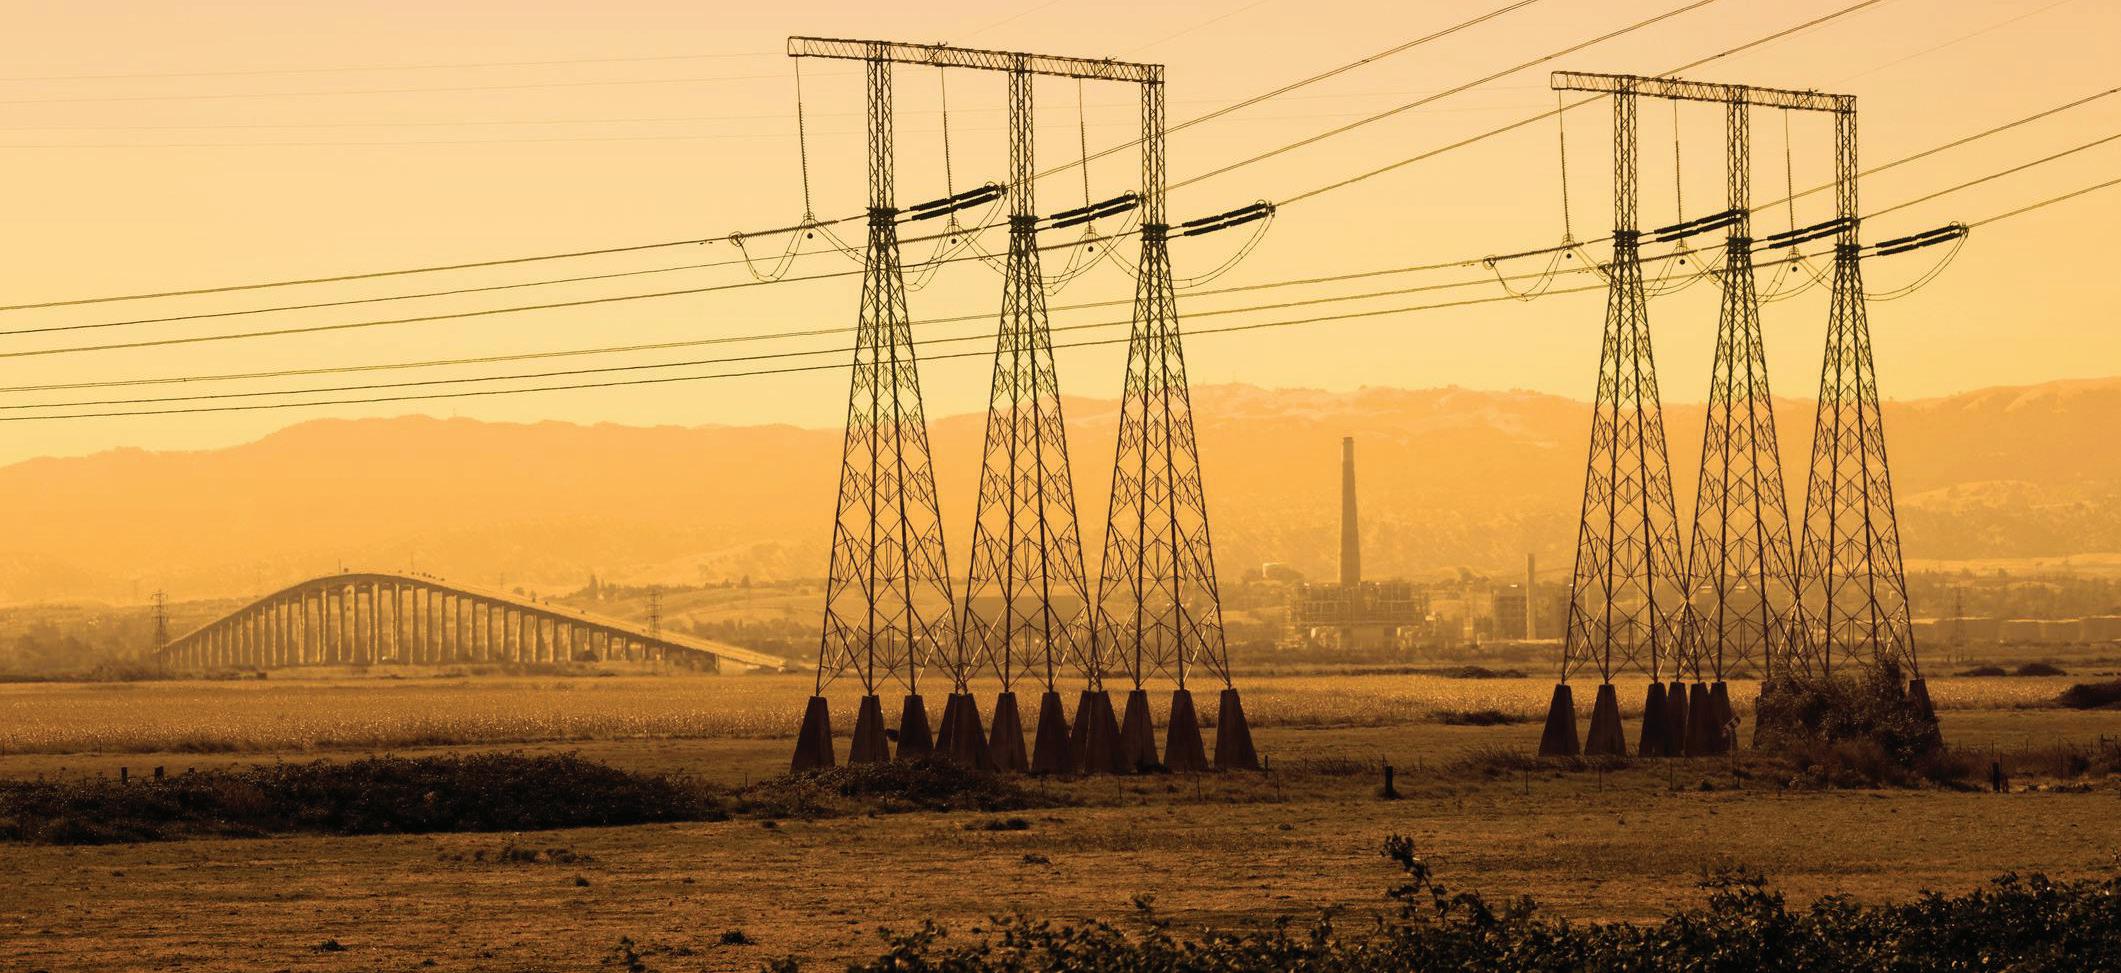
Pacific Gas and Electric Company (PG&E) is testing a new approach to transmission line monitoring that uses the utility’s existing fiber optic network to gather real-time data across challenging terrain in San Luis Obispo and Humboldt counties. The 18-month trial involves technology from Prisma Photonics and is designed to evaluate whether fiber already installed on the system
can serve as a comprehensive sensing platform for transmission operations.
The project focuses on three transmission corridors that run from coastal areas into mountainous regions—locations where installing traditional monitoring equipment would be difficult and costly. By turning embedded fiber into a sensing system, the utility aims to gain visibility into line temperature, strain, and environmental conditions that influence capacity and reliability.



California utilities face growing operational pressures from increasing electricity demand, expanding data center activity, more frequent extreme weather, and aging infrastructure. System operators have been exploring ways to extract more capacity from existing lines while managing risks and avoiding years-long installation timelines for additional equipment.
Prisma Photonics’ system is intended to provide Dynamic Line Rating (DLR) insights and broader asset-health information. Instead of deploying sensors at multiple tower sites, the approach requires only optical interrogation equipment installed at substations. Data collected from the fiber can be mapped to specific tower locations, which may help maintenance crews respond more quickly to emerging issues.
“Prisma Photonics serves as the Swiss Army knife for grid challenges, providing the right tools for a variety of circumstances, from dynamic line rating to resiliency to extreme weather monitoring,” said Dr. Eran Inbar, CEO of Prisma Photonics. “Our partnership with PG&E demonstrates how utilities can gain comprehensive grid monitoring capabilities while avoiding the traditional complexity and costs of sensor-based solutions.”
The trial reflects a wider industry interest in using existing infrastructure to support grid modernization as utilities respond to demand growth, operational constraints, and customer affordability concerns. Findings from the deployment will help PG&E assess how fiber-based sensing can support operational decision-making across its transmission network.


























Duke
Energy’s lineworkers look back on the response and restoration following last year’s hurricanes.
By AMY FISCHBACH, Field Editor
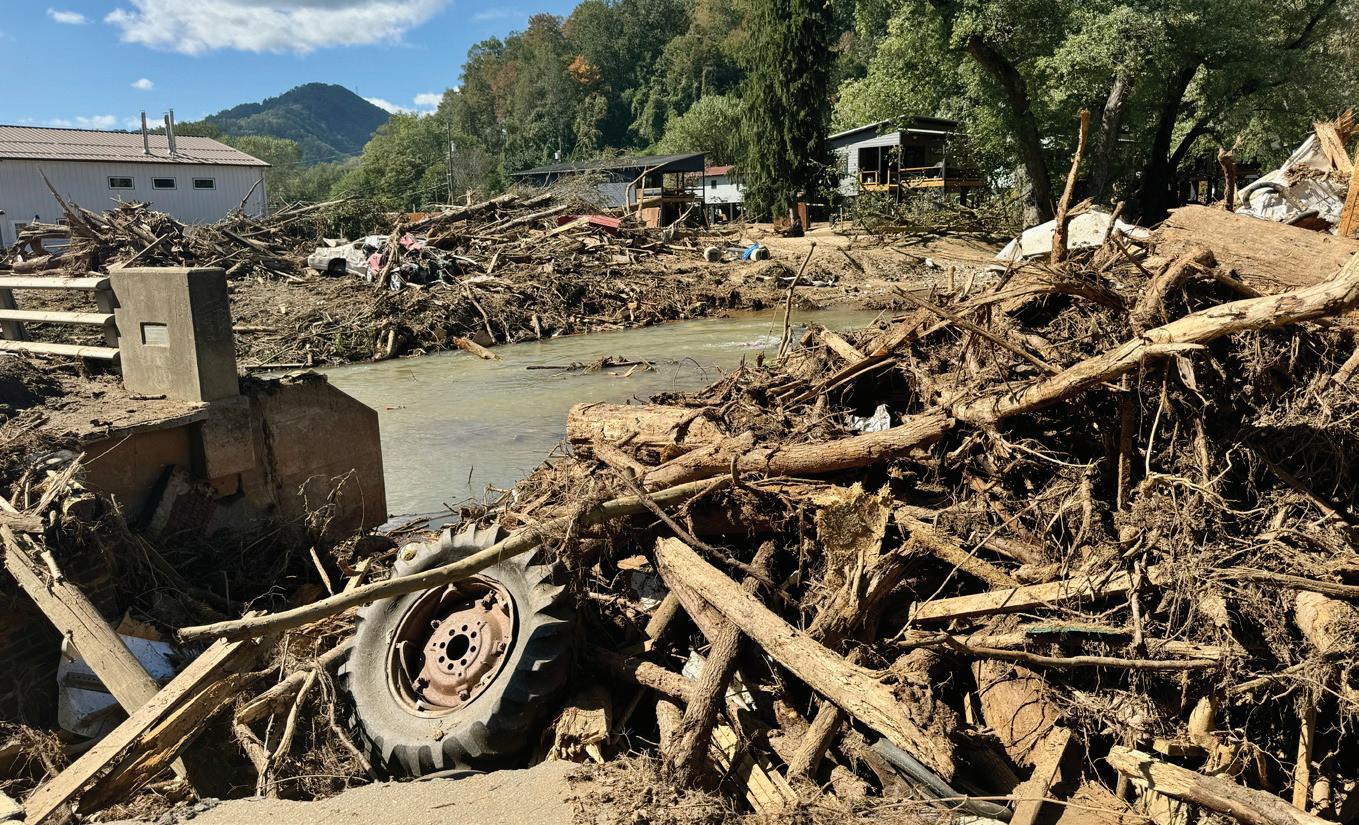
Hurricane-force winds, inland flooding and a deadly storm surge struck the southeastern United States and the southern Appalachians in September 2024. After Hurricane Helene made landfall as a Category 4 storm in Florida’s Big Bend region, the hurricane rapidly intensified, inflicting catastrophic damage and widespread power outages and leading to at least 250 fatalities, making it the deadliest hurricane in the United States since Hurricane Katrina 20 years ago.
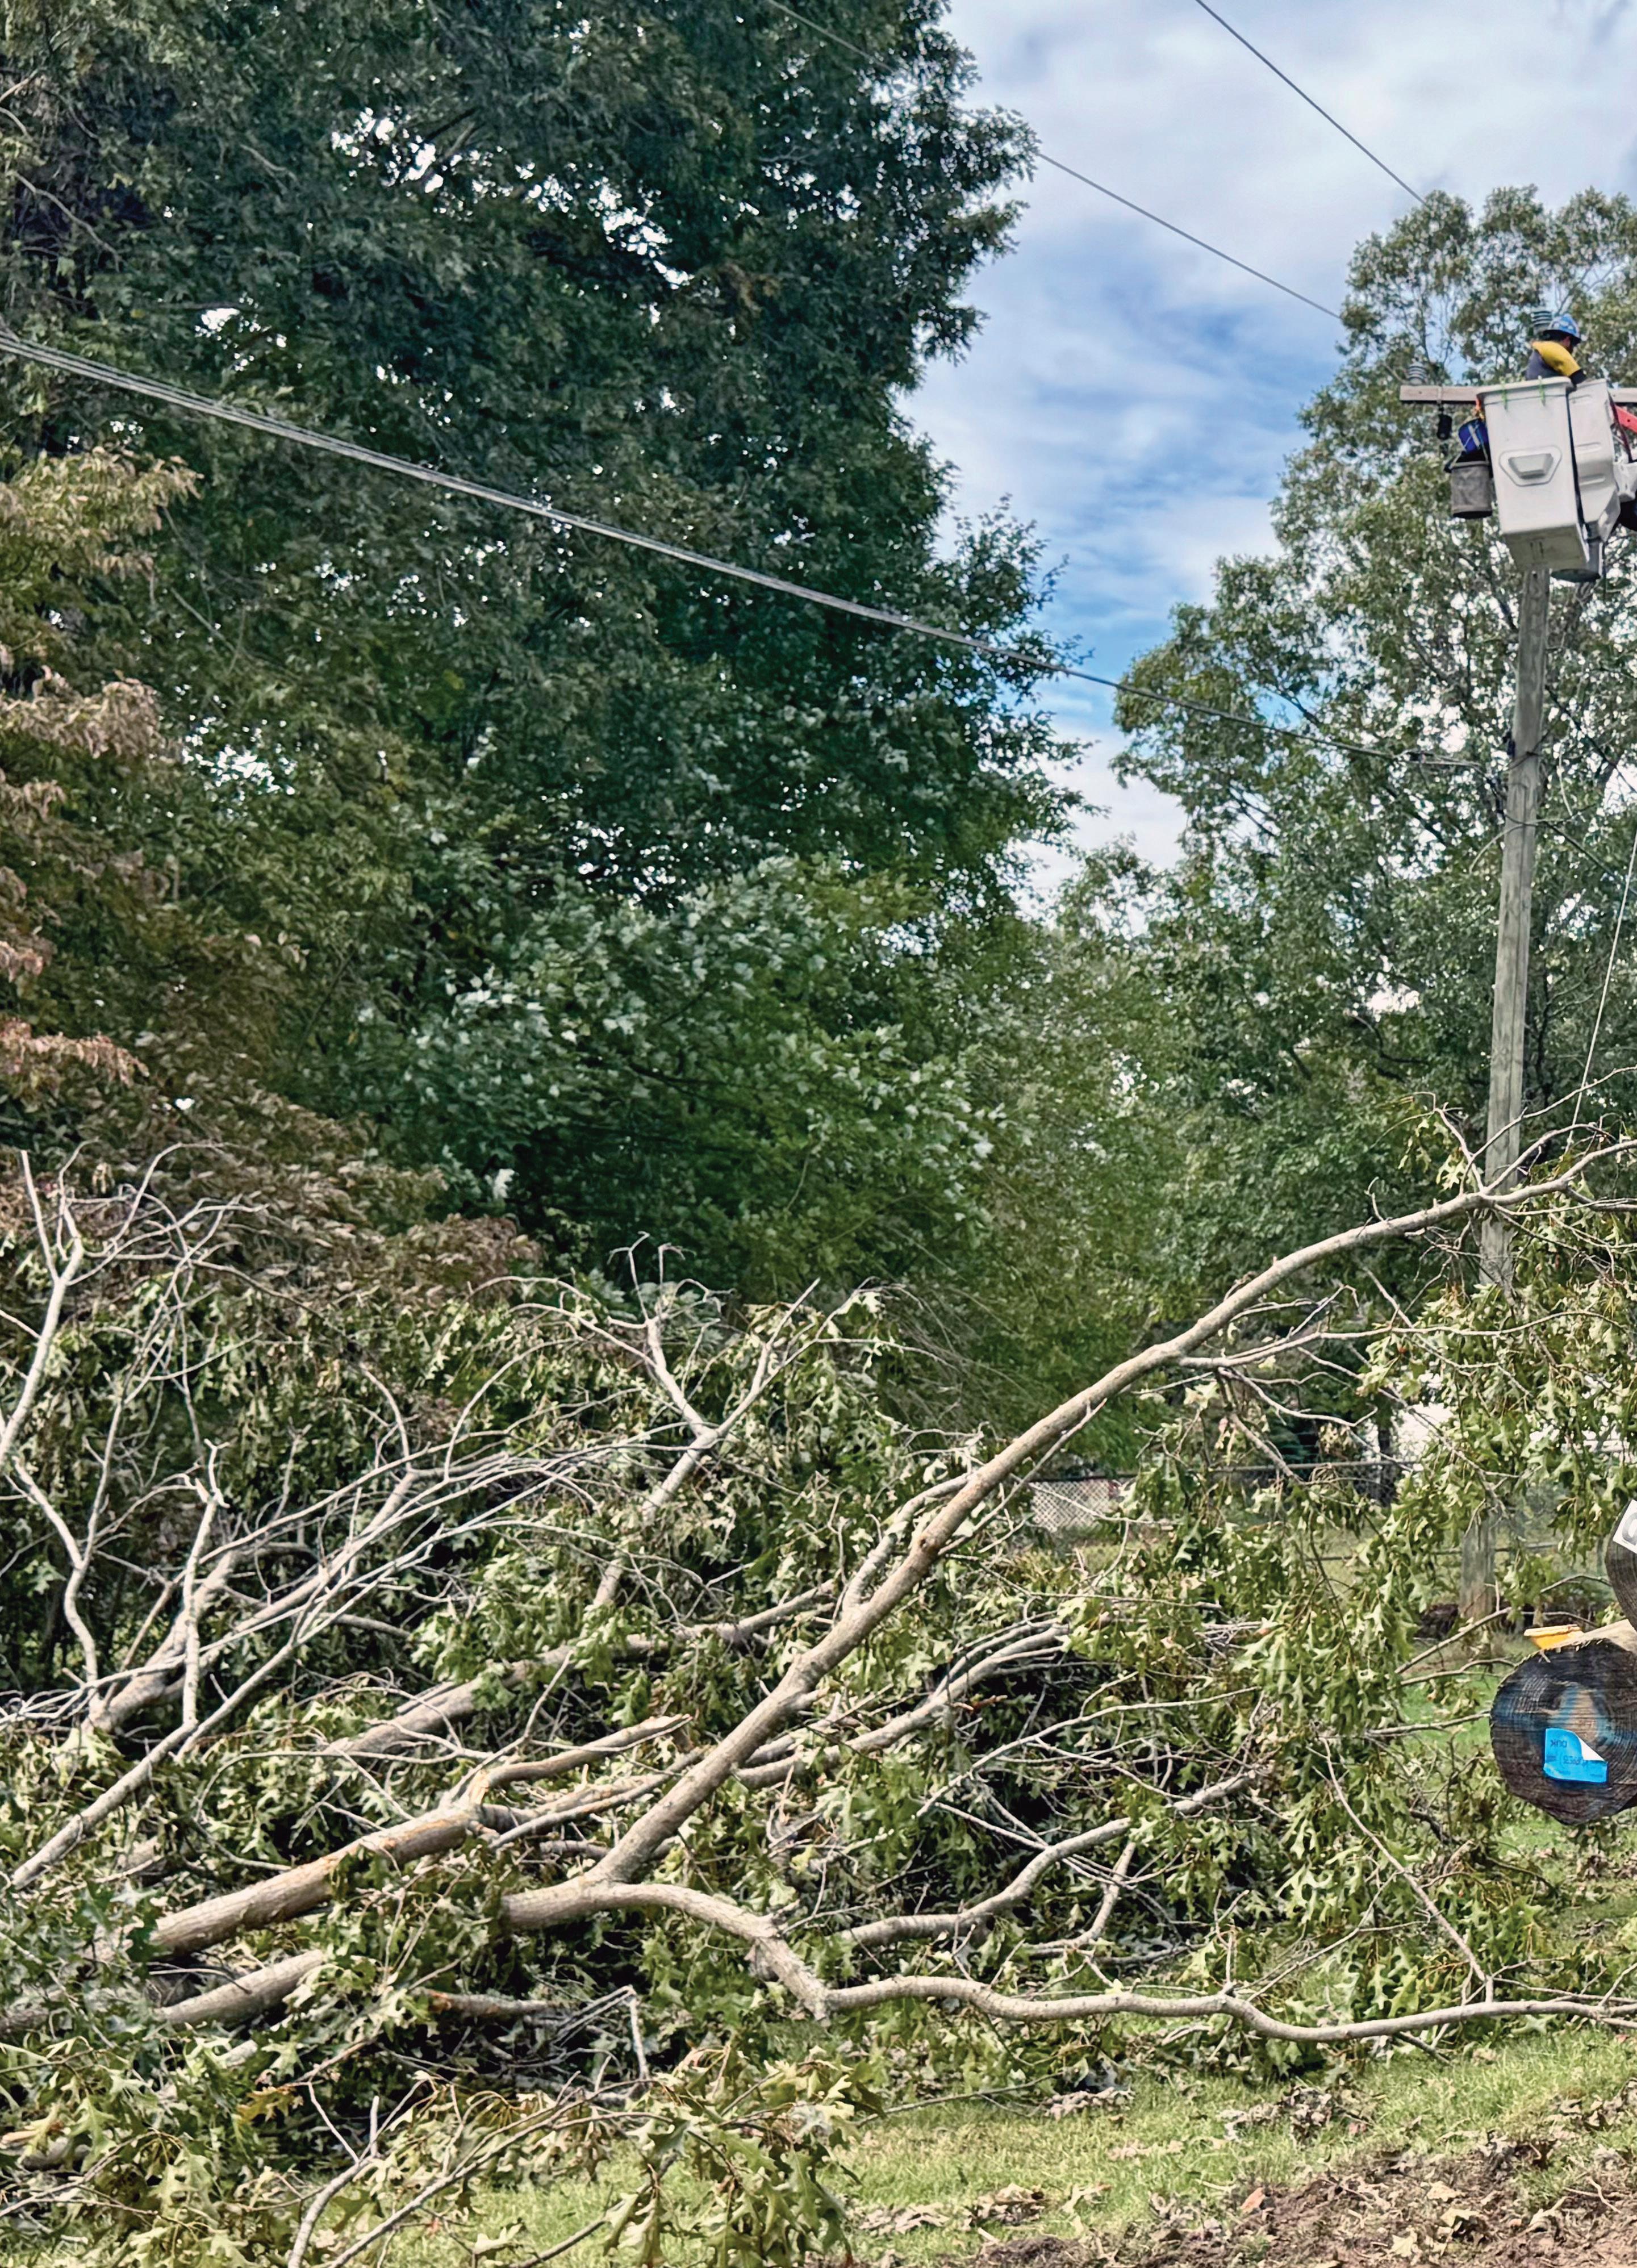
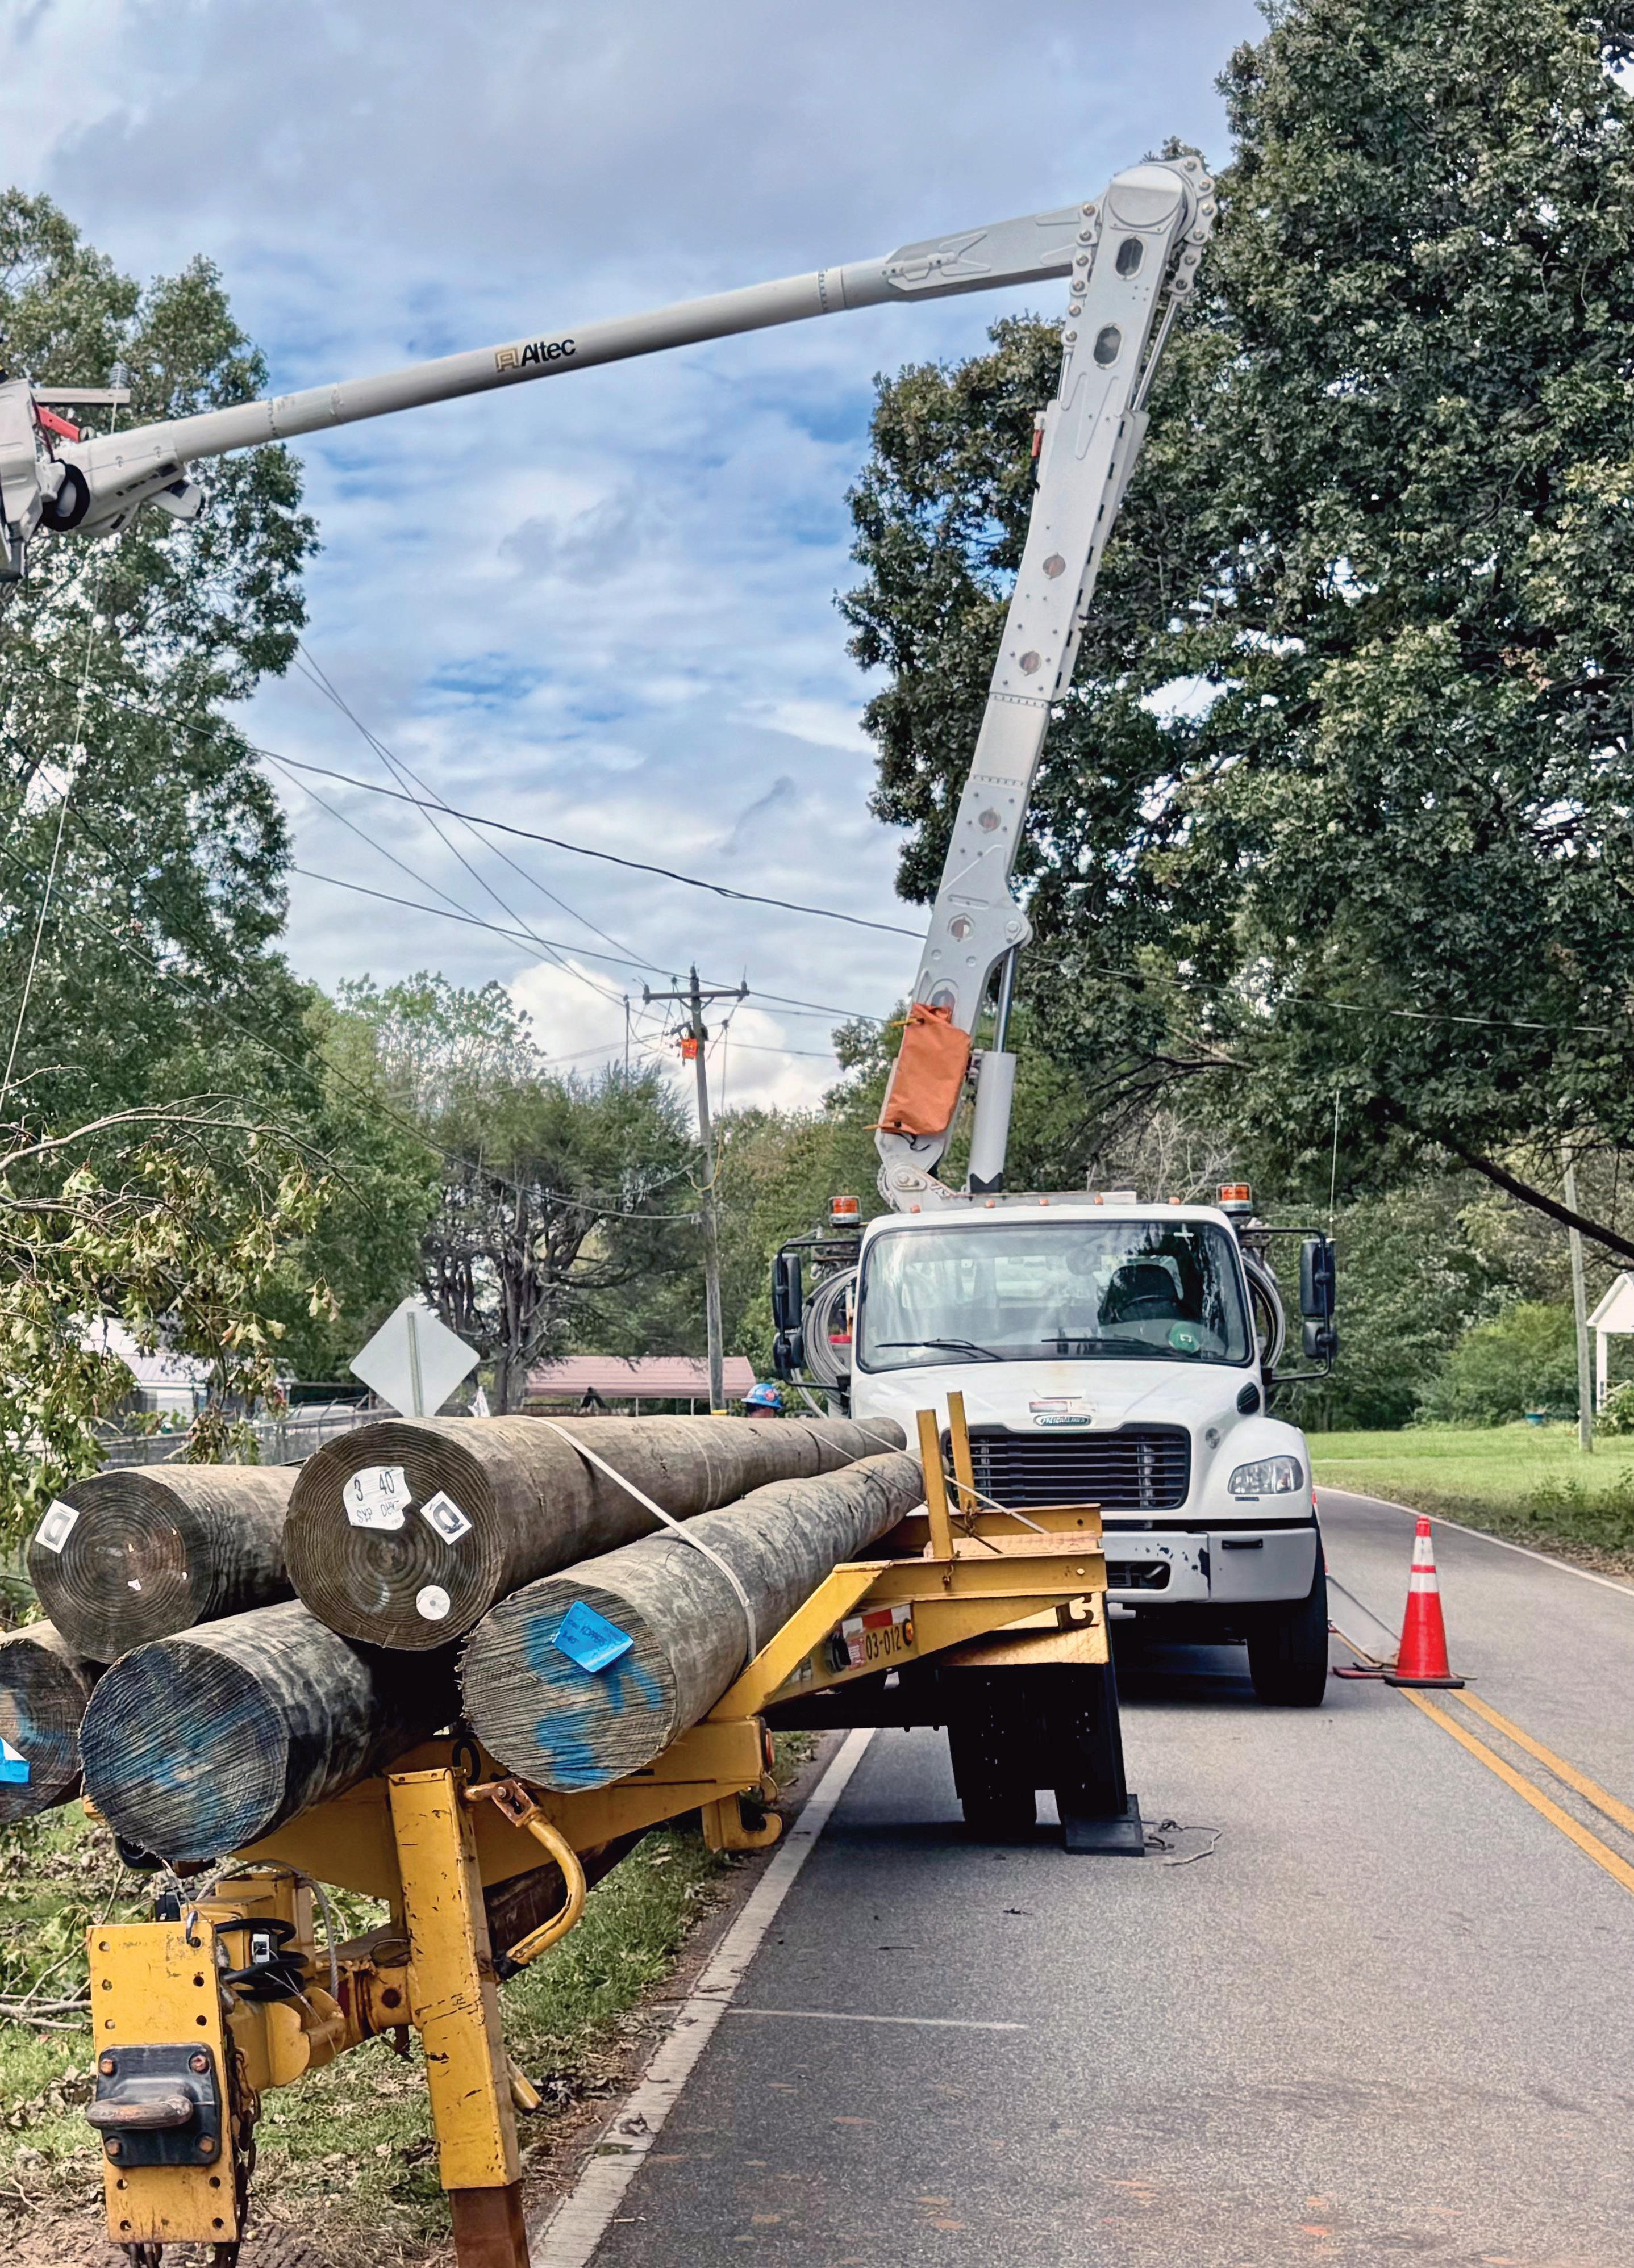
In the wake of the storm, lineworkers joined forces to restore power to the impacted communities and rebuild the damaged infrastructure. In Duke Energy’s service territory in the Carolinas, Hurricane Helene left 2 million customers in the dark. Less than 48 hours after the hurricane made landfall, however, the utility’s line crews and mutual assistance teams restored power to more than 1.1 million customers.
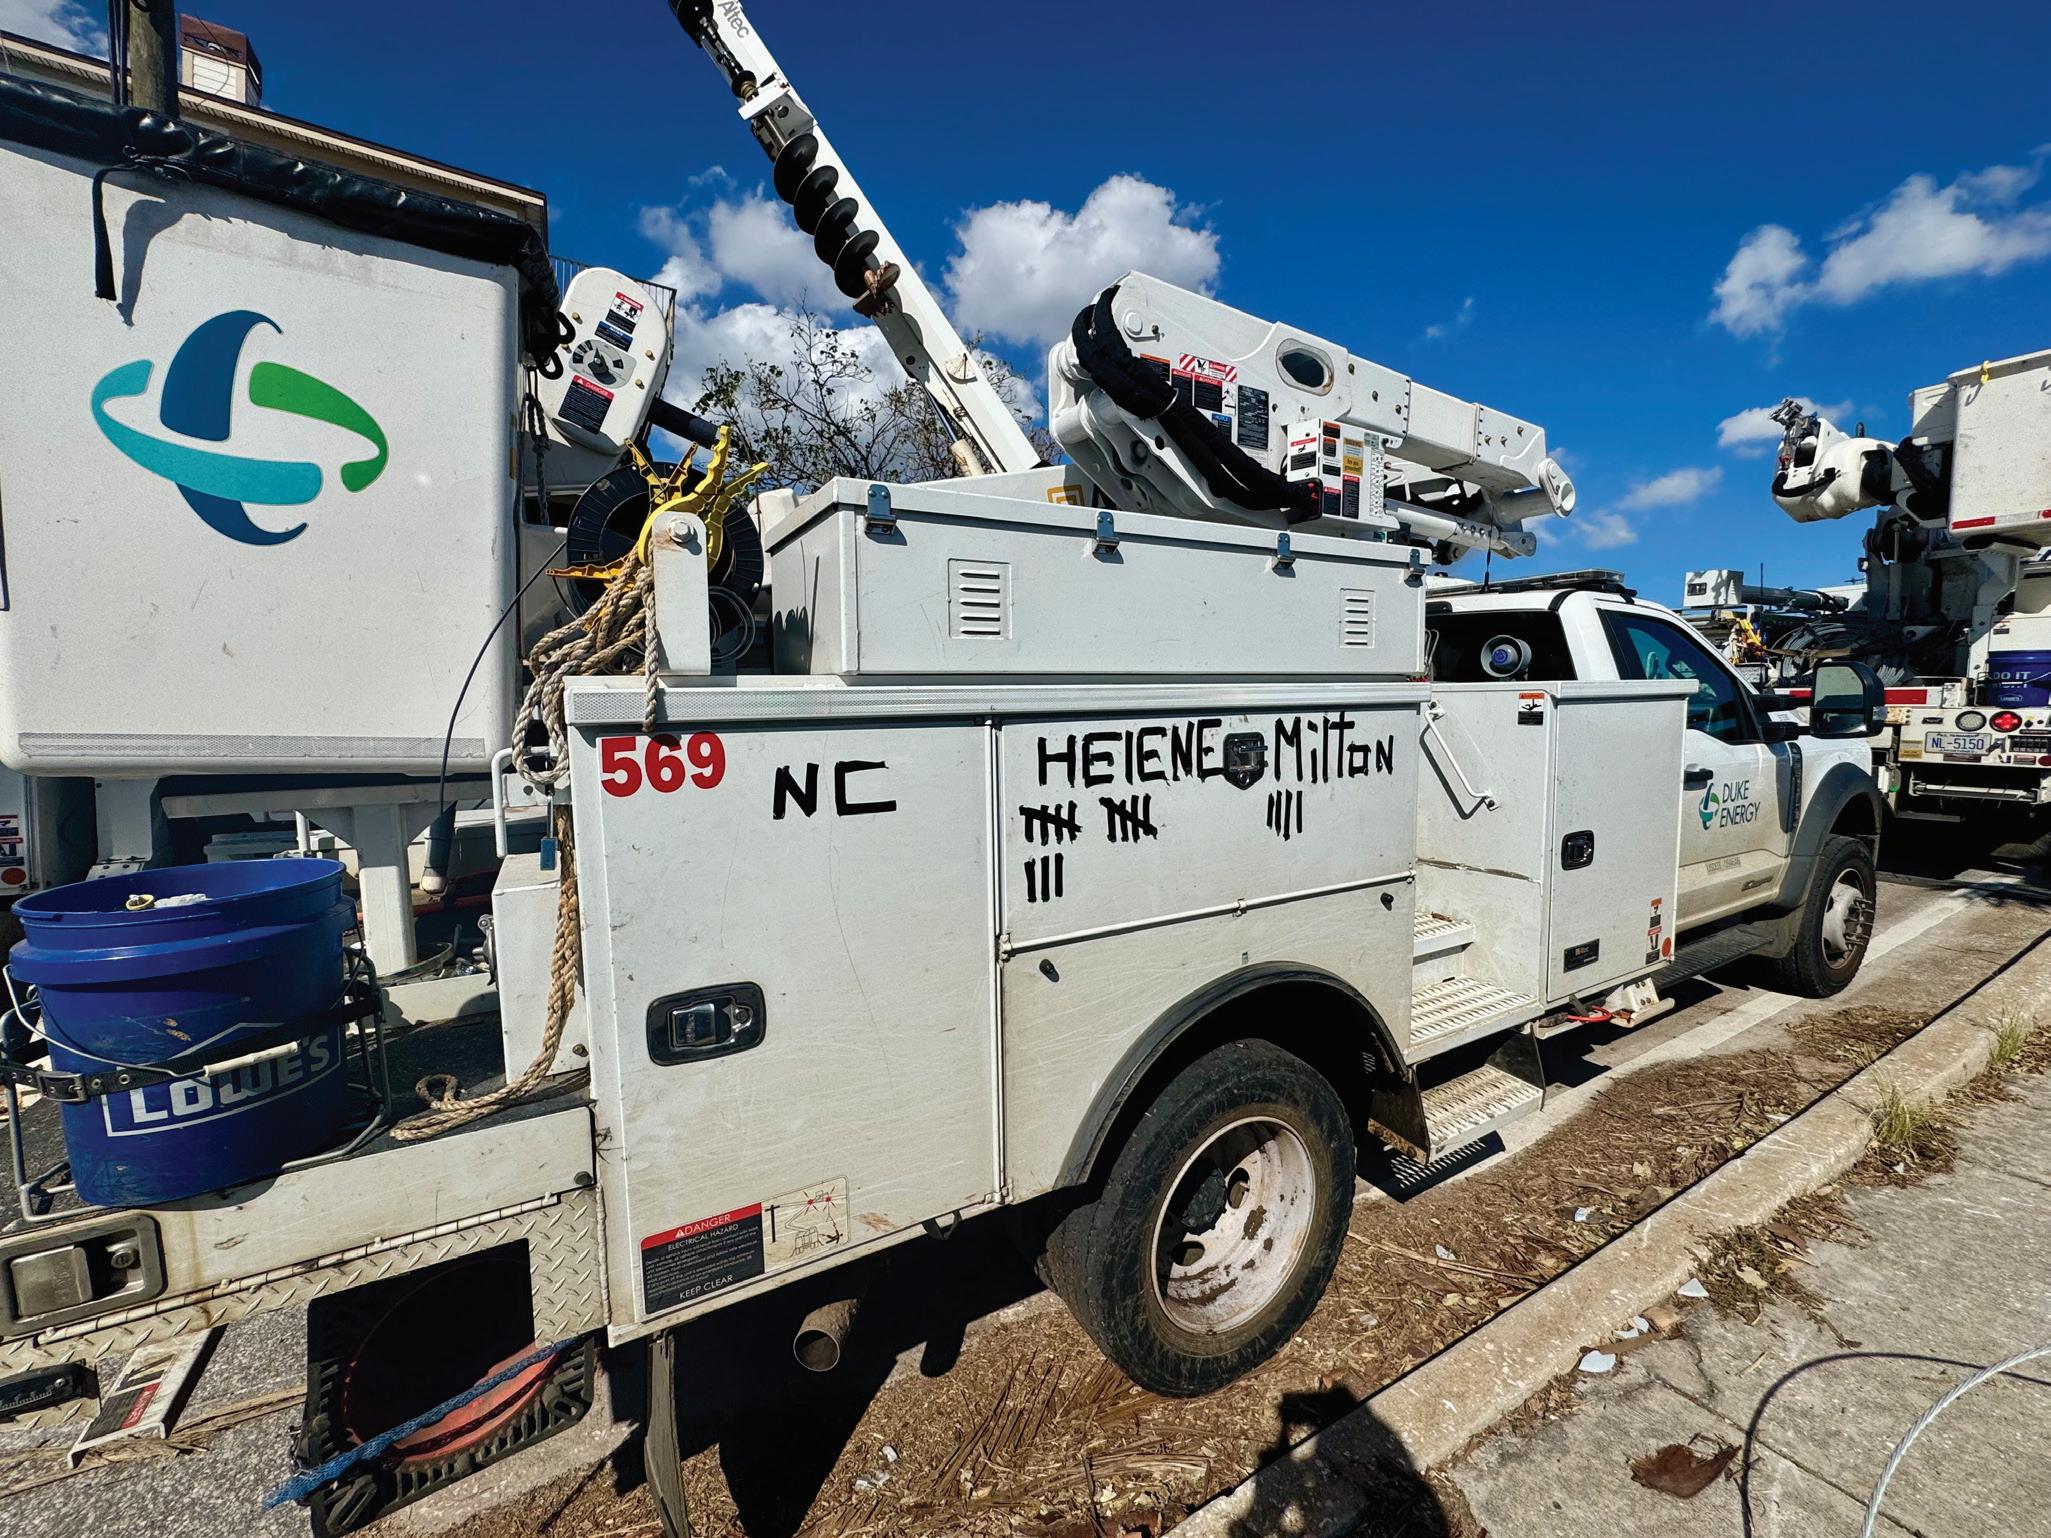
The Edison Electric Institute awarded Duke Energy Florida with the Emergency Response Award for its response following Hurricane Milton. EEI presents the awards to EEI member companies twice a year to recognize electric companies’ recovery and assistance efforts following service disruptions caused by extreme weather or other natural events.
“America’s electric companies and their dedicated workforces work tirelessly throughout the year to strengthen the energy grid and to restore power — and peace of mind — for American families
and businesses after extreme weather events and natural disasters,” said EEI president and CEO Drew Maloney. “EEI is proud to recognize Duke Energy Florida for its extraordinary response efforts following Hurricane Milton. This recovery award reflects Duke Energy Florida and its storm response team’s incredible commitment to the customers and communities they serve.”
Here are some fast facts on the hurricane:
• Hurricane Milton made landfall in Florida as a Category 3 storm on Oct. 9, 2024.About 96 hours later,
To expedite storm response, Duke Energy dispatched lineworkers to Spartanburg, Sumter and Lancaster, South Carolina, to support other crews with the restoration effort for several weeks. One of those lineworkers was Greyson Stewart, a Line Apprentice 4 for Duke Energy in Hartsville, South Carolina.
“Growing up in Florida, I’ve seen a lot of hurricanes and what they can do, but the devastation that happened across the Carolinas from Helene was something I’d never seen,” he said. “Western North Carolina was devastating, but even the amount of damage just driving to the Spartanburg Operations Center in South Carolina was heartbreaking. Hurricane Helene was one of the most significant events our company has
after mobilizing 16,000 resources, Duke Energy Florida restored 95% of the 1 million reported power outages. As part of its response, the company replaced damaged equipment, including 1,640 power poles, 1,350 transformers and nearly 1 million feet of wire and cable.
• Duke Energy Florida’s self-healing technology, which extends to about 80% of the company’s customers, saved 3.3 million hours of power outages during this storm by automatically detecting outages and rerouting power to other lines.
ever experienced and brought with it some highly complex challenges in the field.”
Tyler Nickols, a journeyman lineworker for Duke Energy, said it is very surreal to be a year out from the hurricane response.
“You drive through areas of the community, and you can still see signs of the aftermath,” he said. “The area will never be the same, but it’s good to see people healing and carrying on with their lives as best they can. It really hits your feelings to be able to hook up service to a home or temporary home to help get our community going again.”
A year after Hurricane Helene hit Duke Energy’s service territory — and Hurricane Milton came right in on its heels — the response team looks back on the restoration and response.
Nickols, who works out of Marion, North Carolina, recalls working calls all week leading into the storm. He has been working in the line trade for 19 years, and when the storm came in at around 7 a.m., he had already worked a 24-hour shift.
“I went home to get rest, and then as called back in to help within five years of being home,” he said. “I was amazed at the amount of damage the storm did in a short period of time. When I went to bed, we had minimum outages, but upon returning, almost the entire grid in our service area was down.”
Nickols described the impact to the Marion and Old Fort areas as some of the worst and widespread damage from any storm he’s ever been on.
“Flooding and tree damage was catastrophic to our area,” he said. “Damage to roadway infrastructure was a real issue for access for restoring service, and flooding was severe to many structures and homes along waterways. Our community was able to come together in a huge way and help each other. It was some of the best acts of volunteering that I’ve ever witnessed.”
During the restoration, he was responsible for patrolling for damage. He also performed switching to restore crucial infrastructure such as emergency services and retail to get food and gas services up and running again. He wound up working 40 straight 16- to 18-hour work days in the aftermath
of the storm, and many of the other lineworkers also put in 16-hour work days.
“We adjusted roles after a few days to leading out-of-town crews around to helping to get repairs made,” he said. “I adopted what role was needed to help get service going during the storm.”
Many of the local lineworkers stayed at their homes — most without power — for up to two weeks. Nickles said his home didn’t receive service for almost a two-week period.
“Having to work and then come home to no power was an issue,” he said. “There was limited cell service during the first week, so having to communicate via radio was a hard obstacle to deal with. Our updated radio system helped with communication during the storm.”
Due to access challenges in the service territory, the line crews relied on a lot of rigging, offroad equipment and track equipment to access the right of way. The tree crews and the North Carolina Department of Transportation also helped to open roadways and remove trees.
“Teamwork from our group, amazing support from our contract crews and work management kept the work rolling and helped to get restoration done,” he said.
Technology also played a role in the storm response. Once the line crews had signal, they could close feeders remotely on the SCADA-controlled switches.
Seeing the impact of the hurricane on his local community was very humbling, and he said he was glad to help the local community.
“Being able to make a difference to help friends, family and coworkers get their lights back on was amazing,” he said. “It was a great feeling to be able to give back to our community.”
Nickols said all of his friends and family were very supportive during the entire storm.
“My family was obviously worried the entire time because of the long hours,” he said. “I was able to call them when I could during the day. Most nights, my kids were already in bed when I came home, and I had to leave early in the morning. Getting to see them was a blessing when I could. My wife was super supportive the entire time.”
The community donated supplies to the operations center, and local schools gave the lineworkers thank you cards, which definitely brightened the days of the work group. The utility’s work management division coordinated the meals and used food trucks and a few restaurants to feed all the crews. In addition, local meals were provided a few times, and Nickols said it was some of the best food he had the entire time.
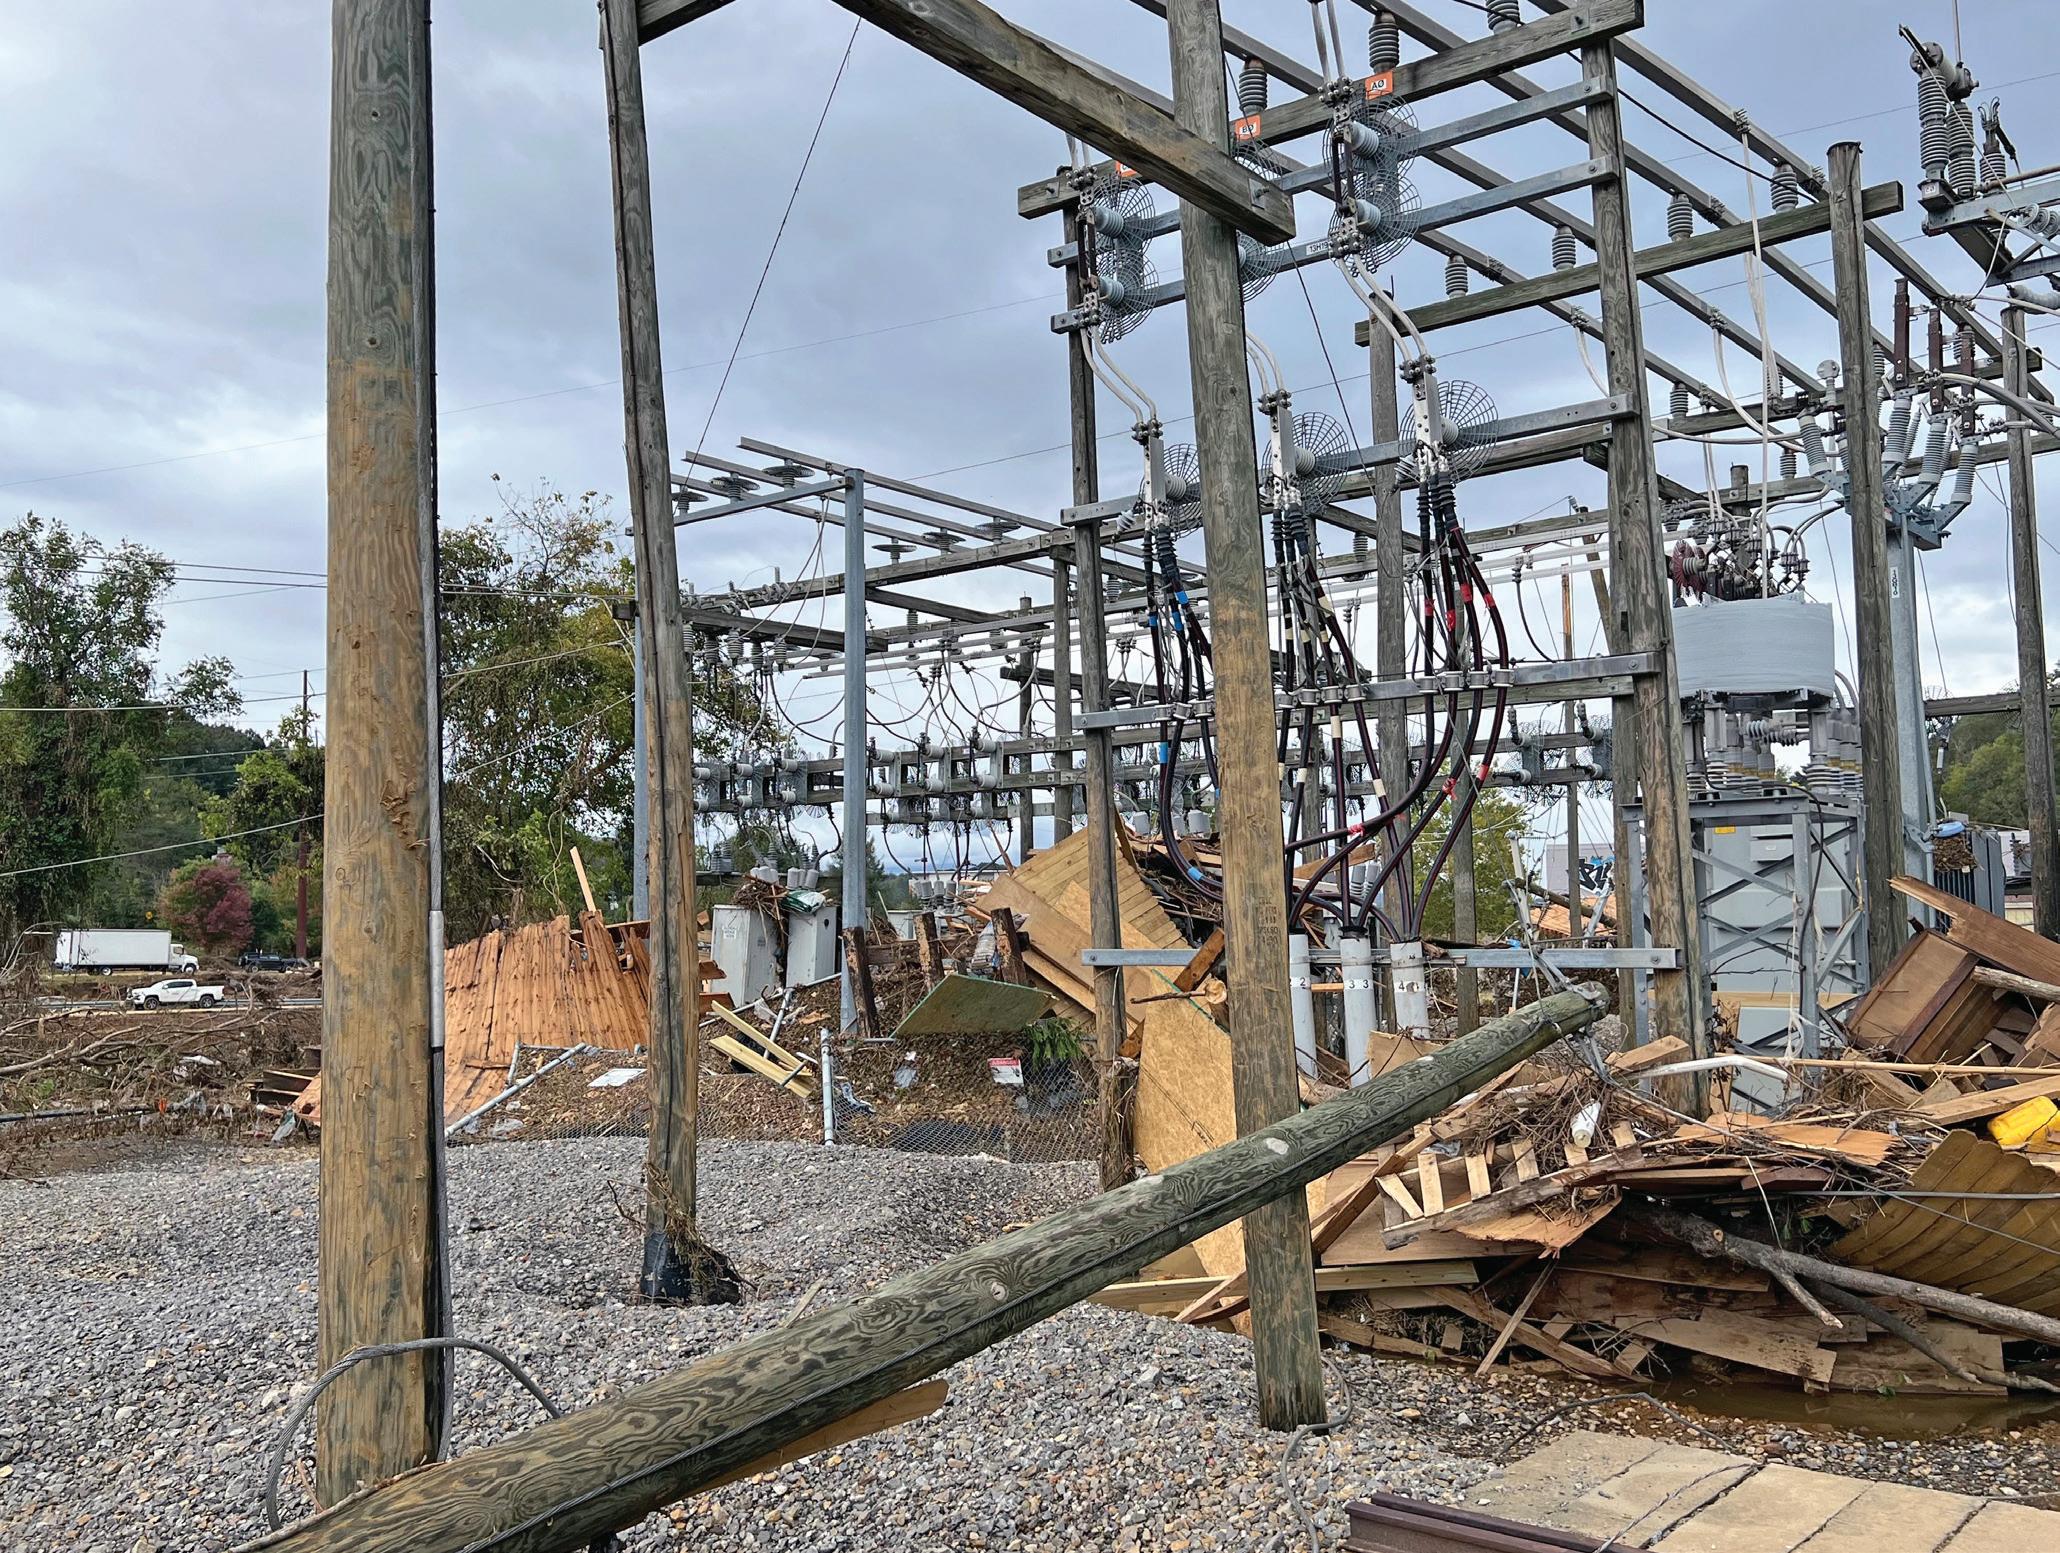
Duke Energy’s Biltmore Retail substation in Asheville, North Carolina, was one of three of the company’s substations in Asheville damaged or totally destroyed by Hurricane Helene.
“I am very thankful for our community and the people in it,” he said.
Nickols said one of the most memorable aspects of the restoration was the camaraderie of his 12-person work group.
“Pulling together to help our community made a huge difference in my eyes,” he said. “We were able to help the local people get their lights back on, and we had a lot of gratitude from our community. We got thank you cards from the local kids and schools thanking us for our service. Knowing that we made a true difference during the chaos after the storm was truly a humbling experience for me to help rebuild our community.”
Sandy Barnhill, a line tech and director of operations for Duke Energy in Raleigh, North Carolina, was working in his assigned location the day Hurricane Helene hit. As a 37-year veteran of the line trade, he spent the day working in his assigned location expecting some impact, but nothing too significant. Instead, the aftermath was unimaginable.
“I was part of a team who started in Charlotte and then went on to Spruce Pine, North Carolina,” he said. “Once in Spruce Pine, there were no lights, no cell phone service and no water in the entire area. The devastation was significant and beyond
Energy earned an
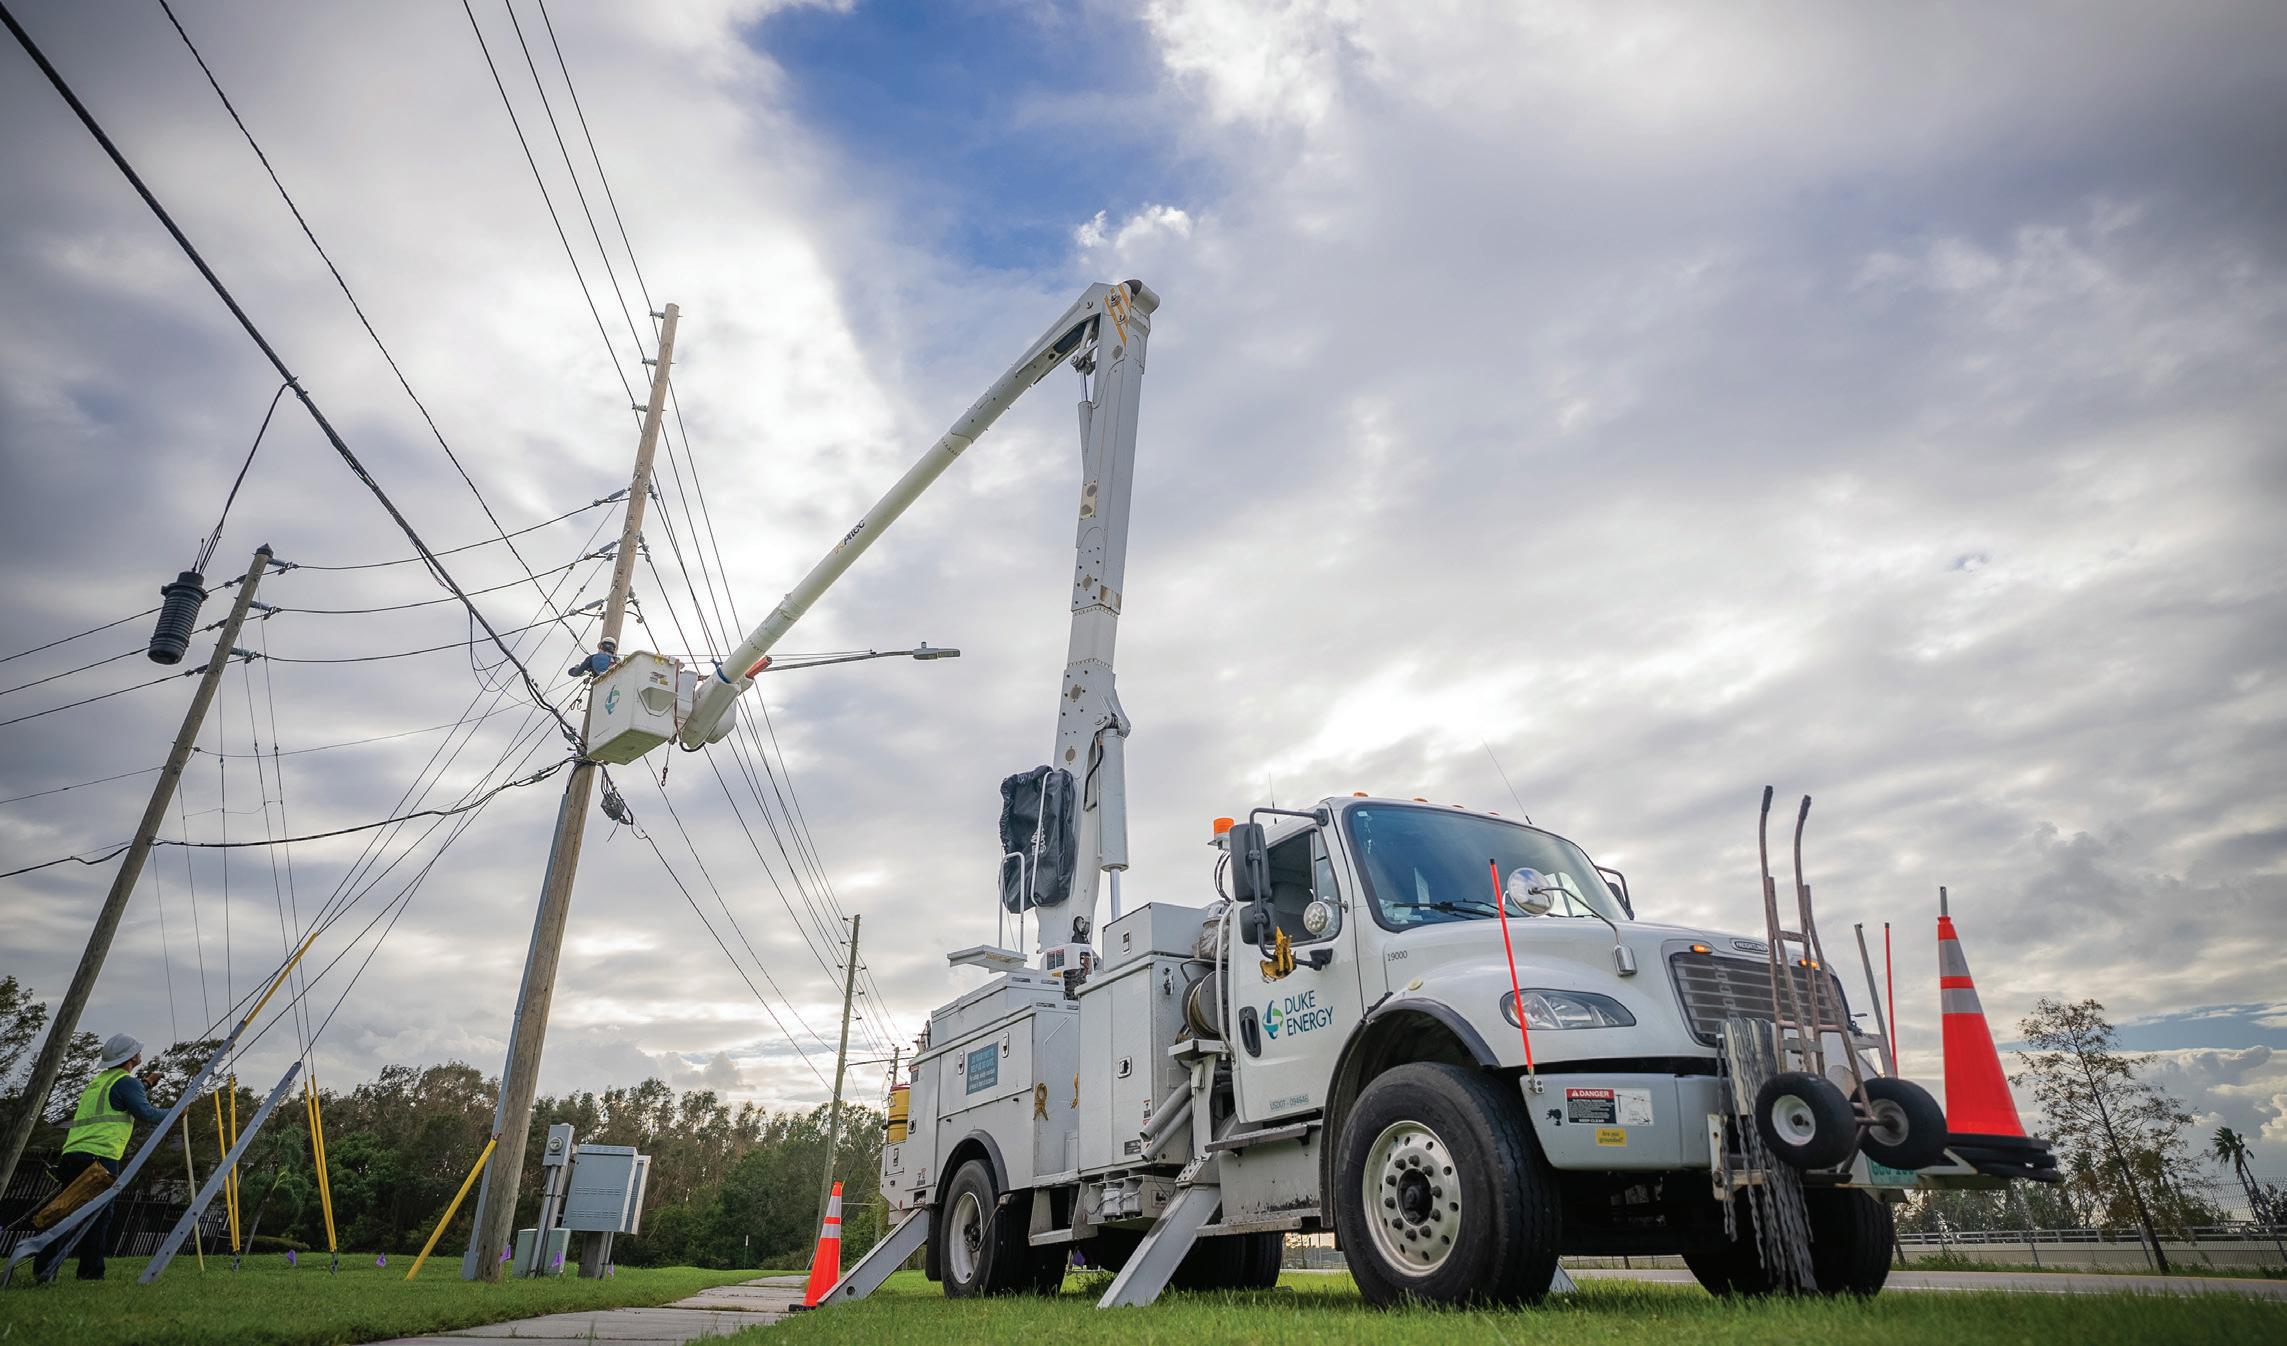
Now that Hurricanes Helene and Milton are in the rear-view mirror, Duke Energy’s line crews are already preparing for the 2025 hurricane season along with lineworkers from other utilities. Here are some of their tips to help their brothers and sisters in the trade to restore power safely and swiftly following a hurricane.
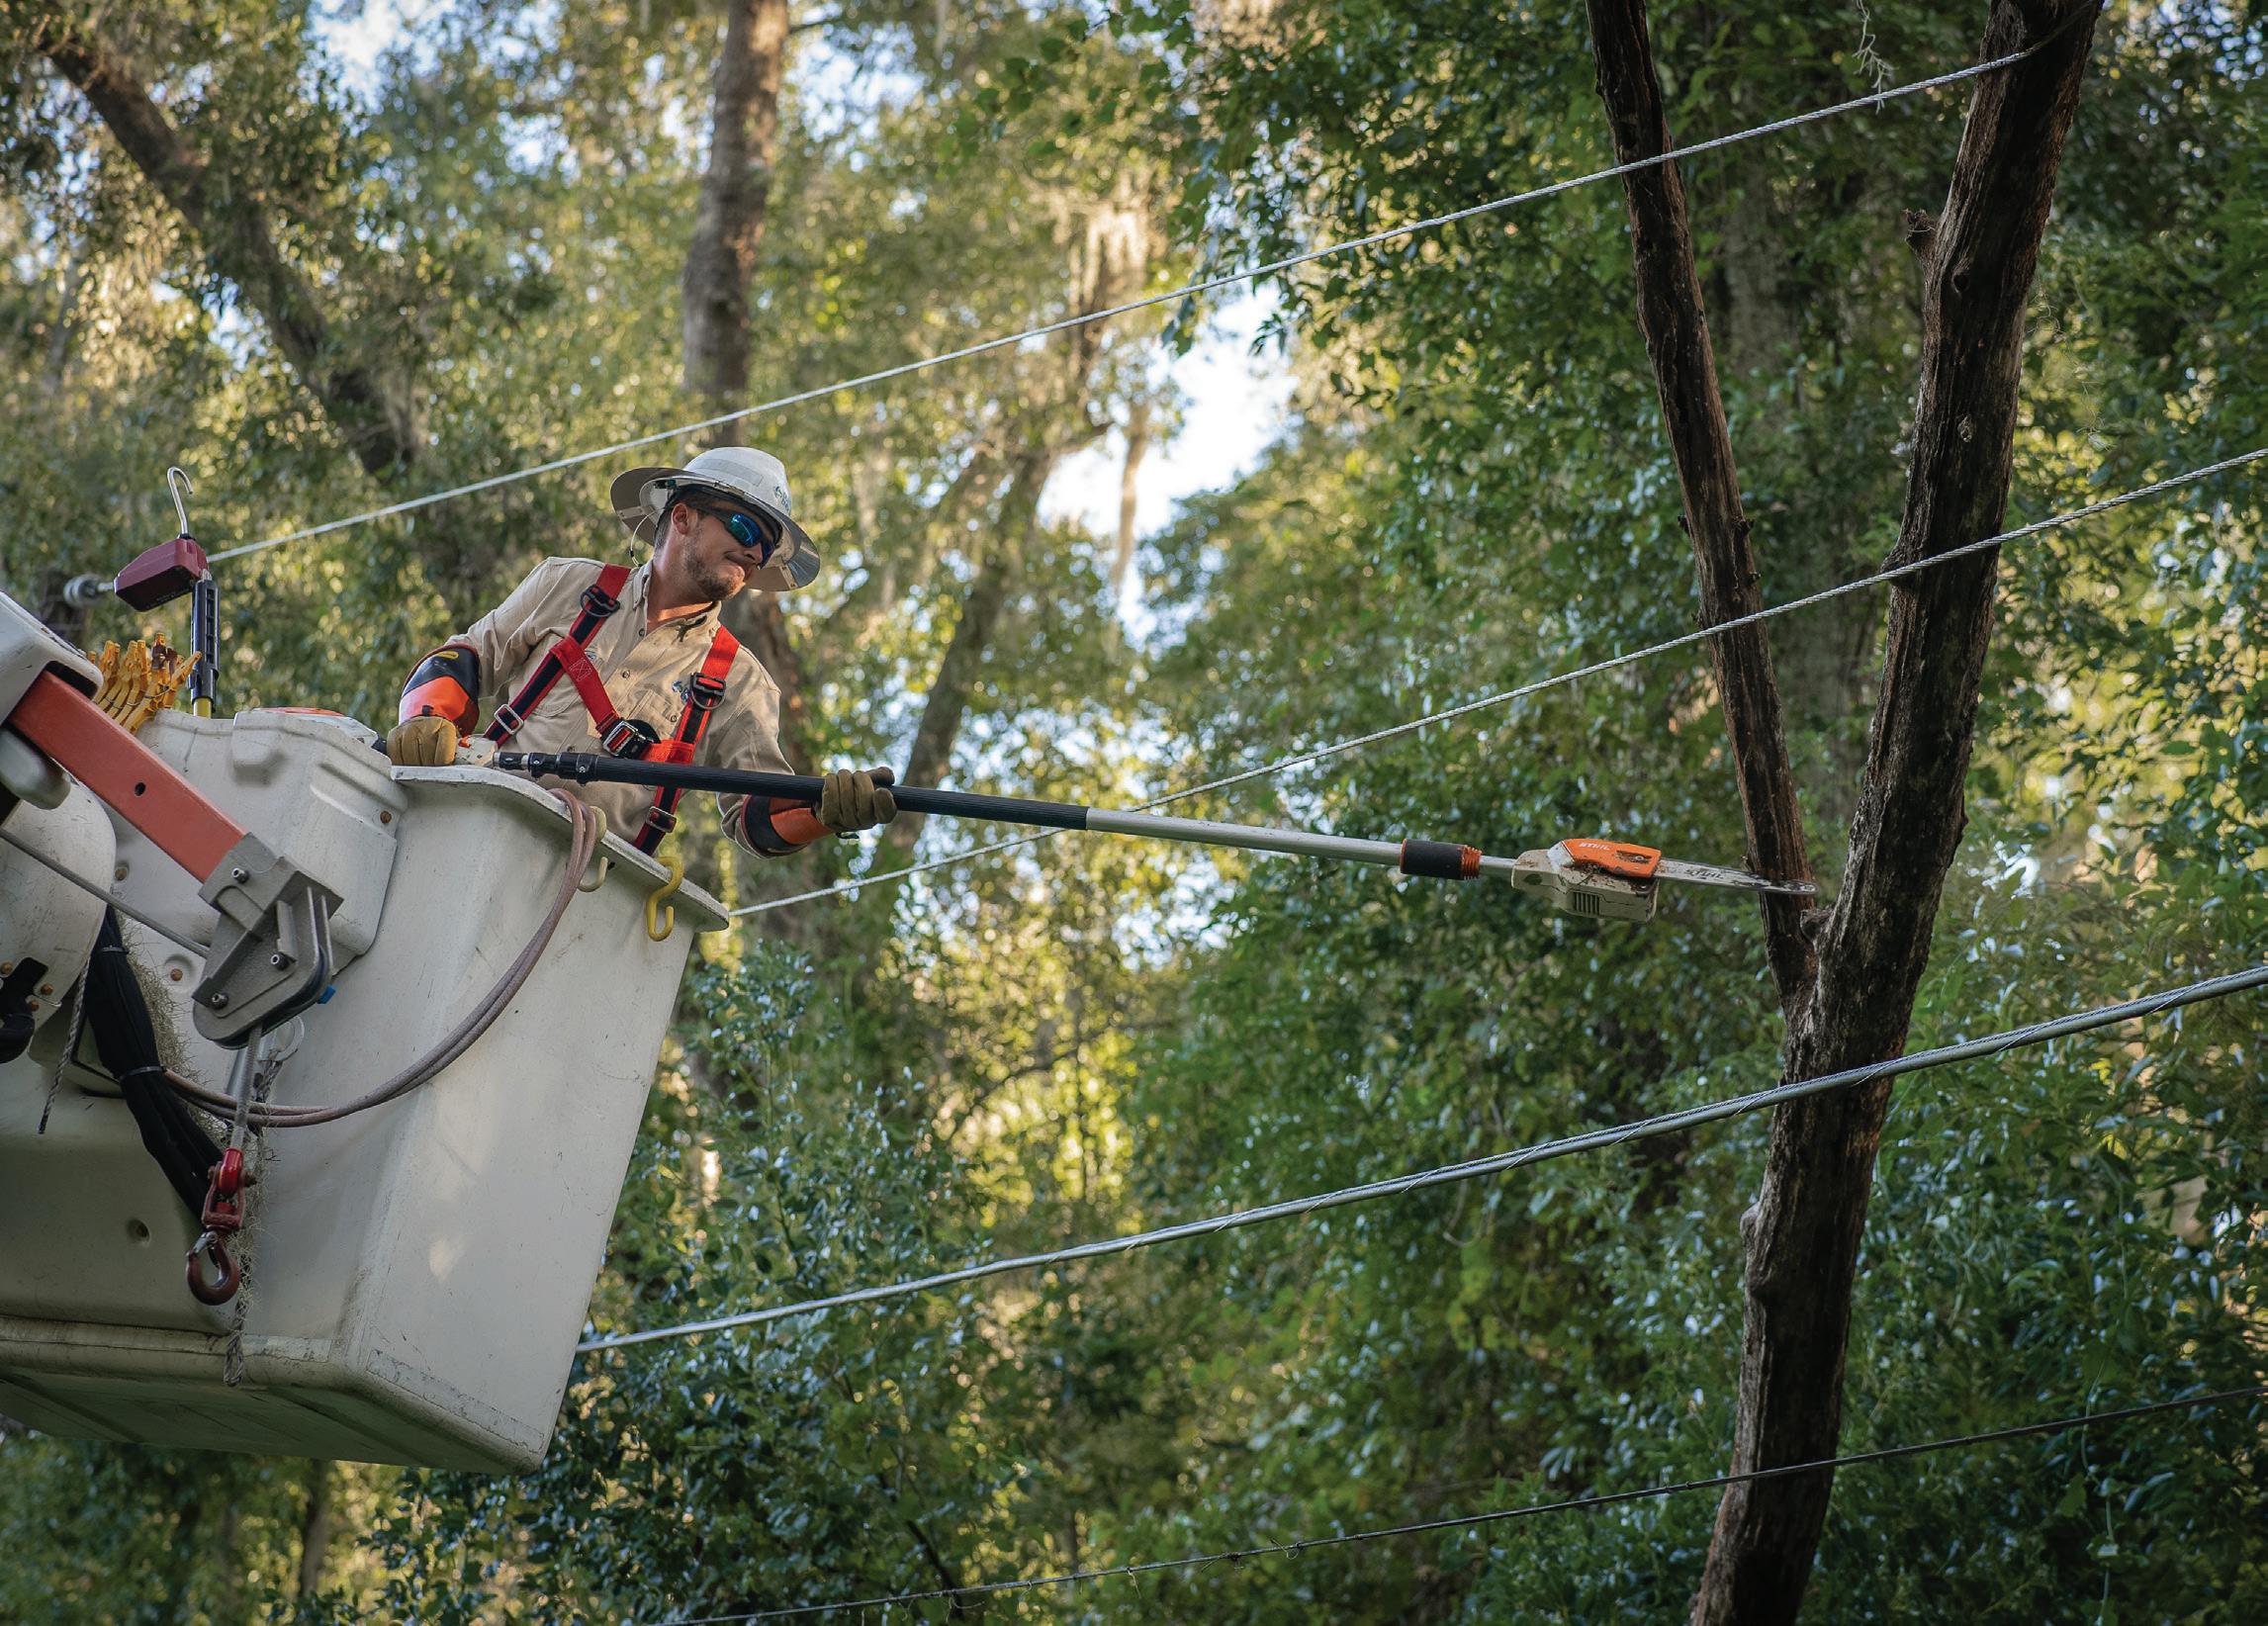
1. Start every day with a team meeting and pre-job briefing. Make sure everyone is connected and focused on the task at hand. Also, begin the day with a pre-job briefing to review the work to do and hazards faced, said Sandy Barnhill of Duke Energy. “All that leads to the focus on safety with every task performed, as every day, there should be no shortcuts,” he said.
2. Put safety first. Be patient and methodical in your response and always keep safety at the top of the priority list for restoration efforts, Barnhill added.
3. Always treat every wire as energized. Make sure you don’t assume a wire is de-energized until you can safely verify it and you can test and ground it, advised Suzy Macke of Duke Energy. In addition, watch out for the generators and take the time to check to see if you are working around one, Journeyman Lineworker Tyler Nickols added.
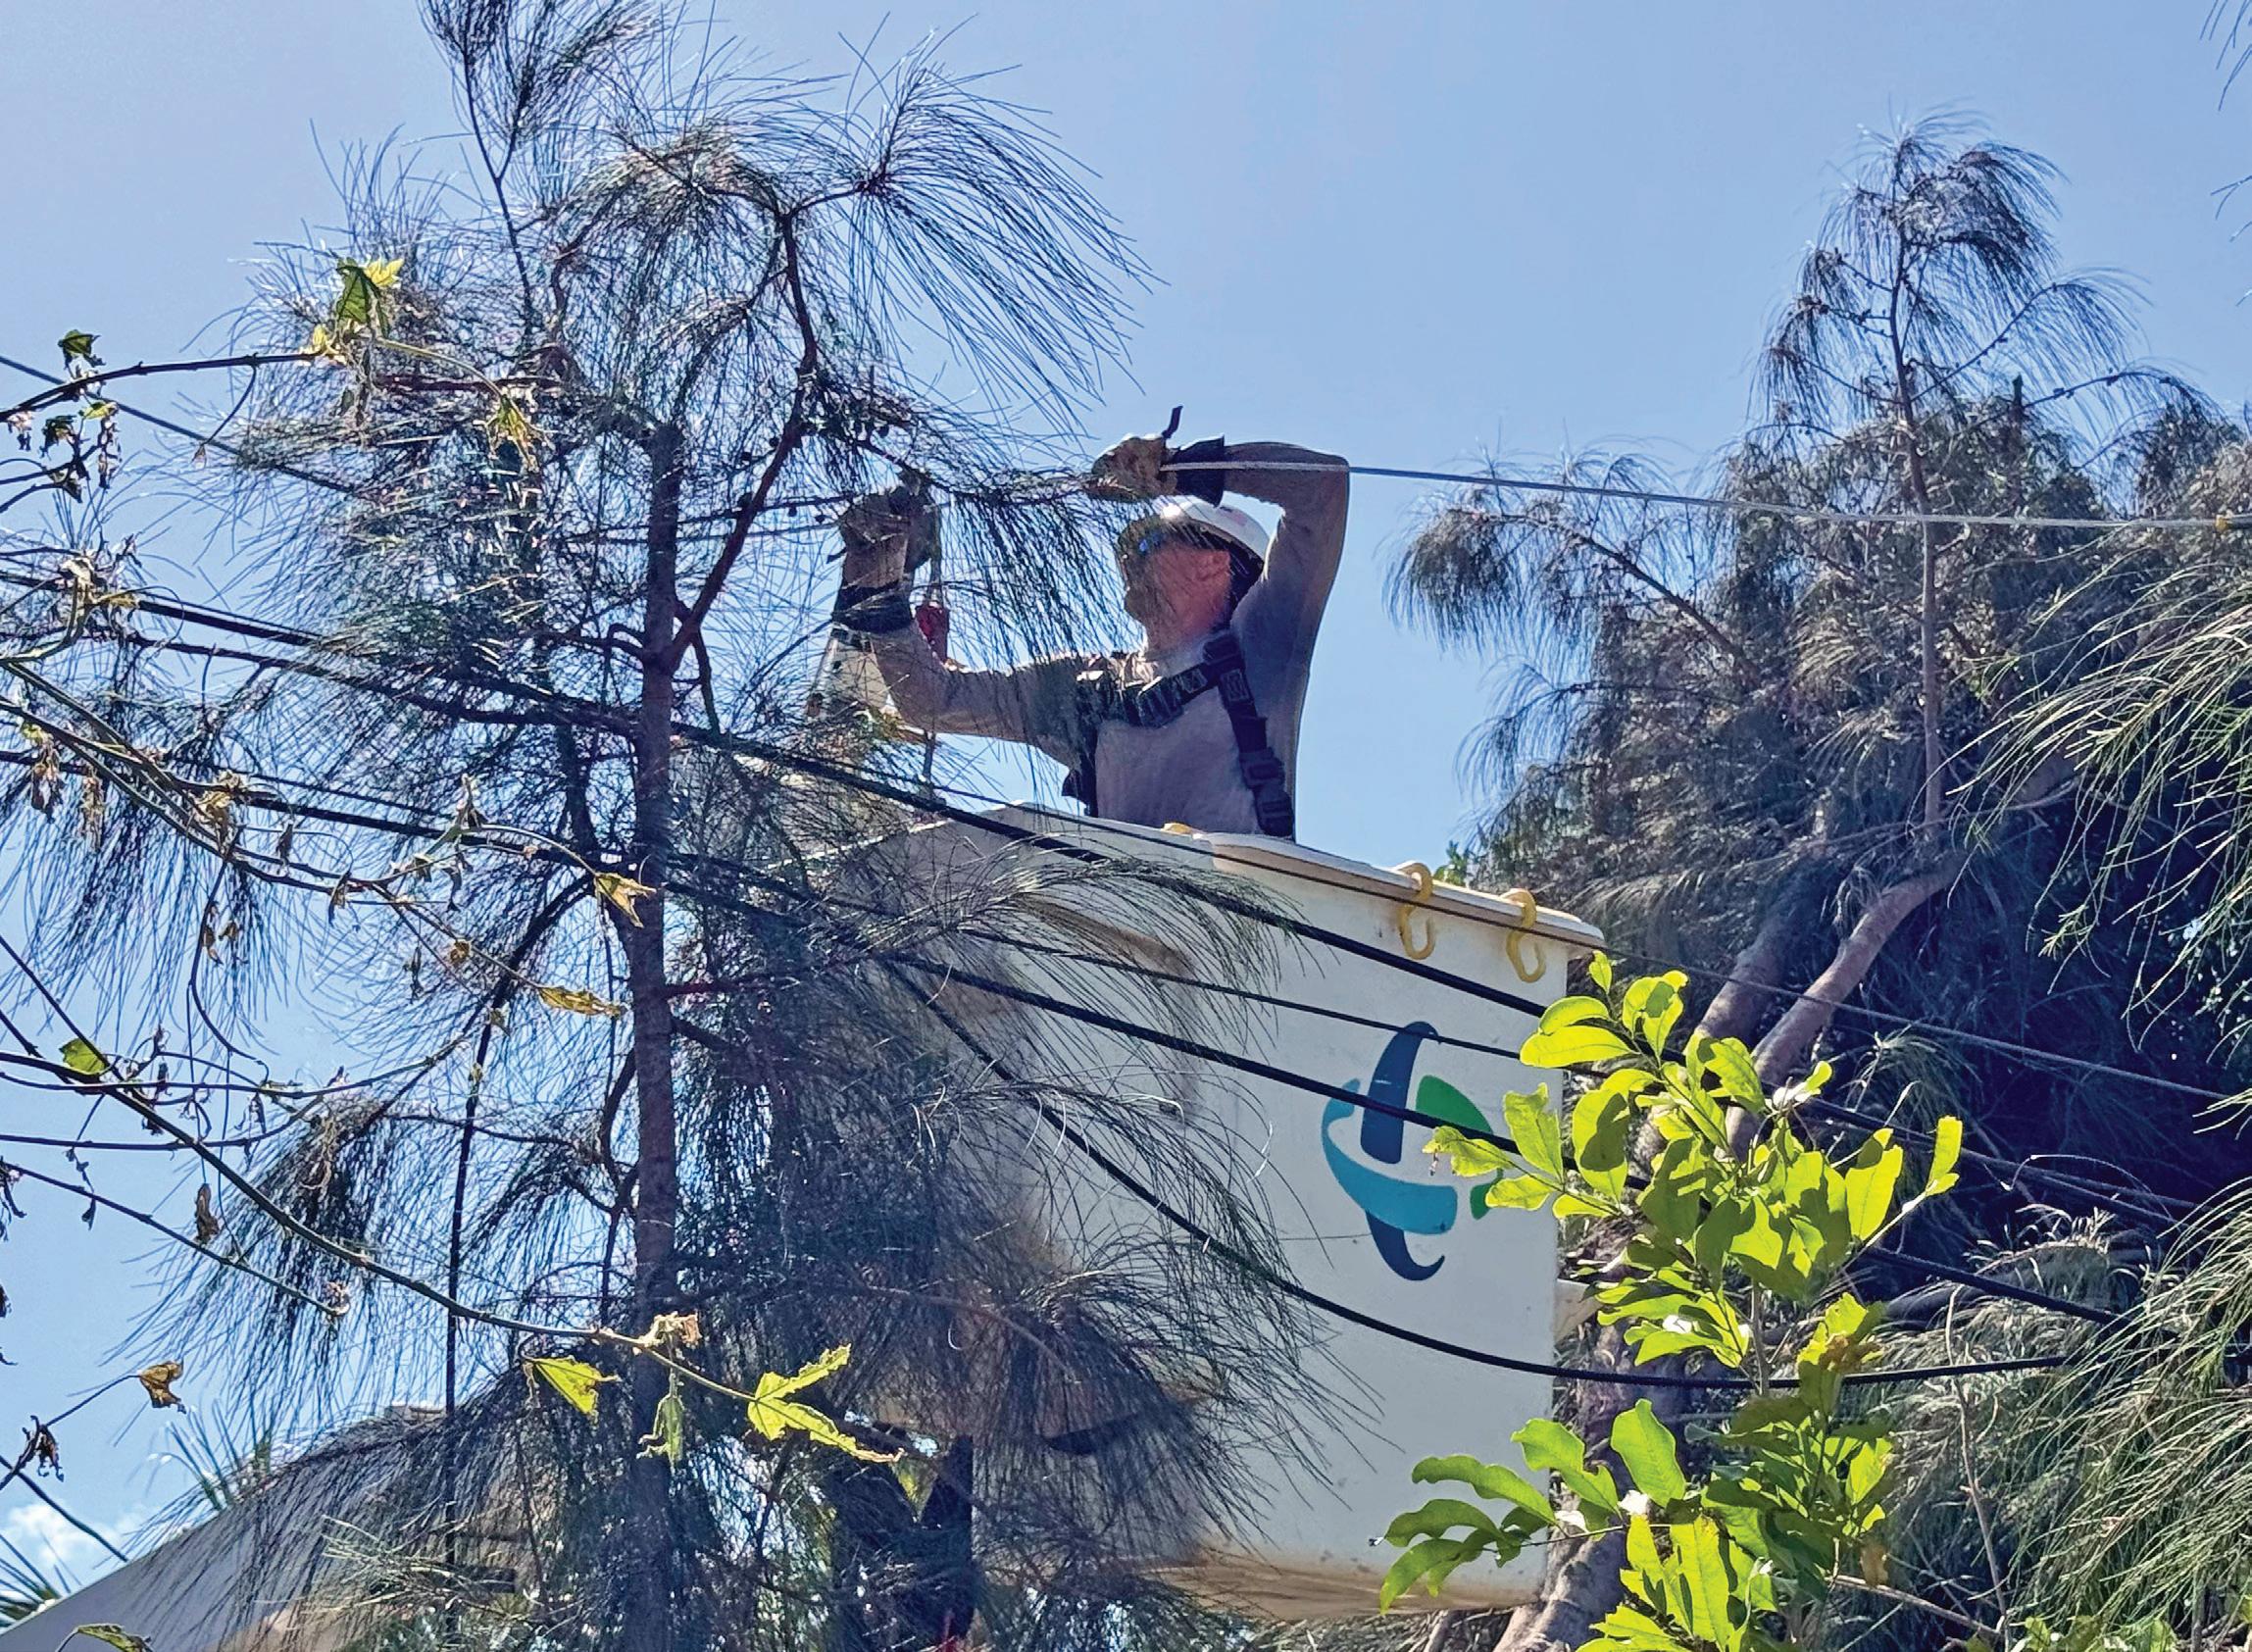
4. Keep your head on a swivel. “The danger isn’t always electrical,” Macke said. For example, after the recent
belief. The team was just over 300 strong, and we were gone about 21 days. No one wanted to leave until the job was complete, and we had helped everyone we could.”
During the restoration, the team faced challenges with communications, terrain and logistics for feeding the lineworkers, taking care of them and arranging bedding for the crews. Because
hurricanes, a lot of fences had blown down, leaving nails and broken wood sticking up and letting dogs out. Tree branches and other debris were also hanging everywhere, uprooted trees had left craters in the yards and broken sewer and water mains were creating sink holes.
5. Pack twice as many socks as you think you’ll need. “Hurricanes mean lots of flooded areas, and clean, dry socks are a must,” Macke said.
6. Watch out for yourself and your team. “The number one best practice is to look out for each other,” she said. “Being in an unfamiliar place on an unfamiliar system can be challenging.”
7. Always wear your PPE. “It will always save your life,” Nickols said.
8. Listen and ask questions. As a “local guy helping the out-of-town crews,” Nickols said he took the extra time to give maps and answer questions.
9. Pace yourself. Lineworkers should take care of themselves mentally and physically and know their limits, Nickols said.
10. Follow the safety rules and keep in mind your reason for working safely every day. “So you can go home to your loved ones, always keep that on your mind to do the job right,” Nickols said.
the lineworkers worked 16- to 18-hour days, the logistics teams prepared the meals at the base camp and delivered them to the field so there was as little lost time as possible.
To arrange the accommodations for such a large team, Duke Energy housed the workers in base camps with sleep trailers or local hotels with or without power.
“We tried to make the best of it,” he said. “There was also a night or two spent in the trucks. Everyone was very flexible and willing to be inconvenienced under the circumstances.”
Because the restoration lasted longer than a typical storm response, he said the lineworkers’ families were worried, yet supportive and glad their loved ones were able to help.
“Knowing that we made a true difference during the chaos after the storm was truly a humbling experience for me to help rebuild our community.”
“The deployment was longer than normal, but this was not a normal storm,” he said. “Families were a bit relieved once communications were re-established, and we could check in and let them know everyone was OK.”
He said the team came together and solved problems as they came up.
“We figured out a path for communicating so everyone could stay on the same page and be safe,” he said. “We used special
equipment to overcome terrain issues and took care of each other with what we had or could get together.”
For example, the line crews used drones, helicopters, bulldozers, track hoes and other specialized track and off-road equipment.
“I believe all avenues were explored to get communities restored,” he said.
He said the local Asheville, North Carolina, team did a great job with logistics and supplies.
“It was all part of a much larger effort by teams all over the company that we may not have even known were working to help,” he said. “Every employee had a job to do in the effort.”
Case in point: Duke Energy’s employees made special trips with supplies to make sure the line crews had everything they needed. The members of the impacted communities also showed their appreciation in many ways, and he said he and the other lineworkers were glad to have been able to help so many people return to some level of normalcy.
“A bottle of water or a pack of crackers as a snack was their way of saying thank you for coming to help,” he said. “The communities we worked in had so many who had lost everything. They were still helping their neighbors by having patience and giving them a shoulder to cry on or someone to talk to.”
While Barnhill relocated about two years ago, he and his family lived in Western North Carolina for more than 22 years. He has lifelong friendships that will never be broken with people in
the community, and his relationships with co-workers in all the operations centers across the area will always be special to him.
“As I returned, I was glad to know the area and where things were at, but my heart was broken to see the devastation and the lives impacted,” he said. “That storm will be part of my memory for the rest of my life.”
One year later, it hopes it will never happen again. He and his team qualified to compete for the 2024 International Lineman’s Rodeo, but had to miss it to work on the storm.
“Priorities must be kept in check, and our customers were in need,” he said. “Our team is excited and looking forward to returning.”
Suzy Macke, a troubleman for the Walsingham Yard for Duke Energy in Largo, Florida, recalls restoring power to the beach communities last fall after Hurricane Helene’s extreme storm surge. At that point in time, she realized that Hurricane Milton was on its way and was looking like it may be a direct hit to the Tampa Bay, Florida, area.
“We had already been working crazy long hours and trying to put our community back together,” she said. “To hear that we were about to be hit even harder was heartbreaking and scary, but we didn’t have a lot of time to dwell on it. We just had to keep going and get as prepared as we could.”
While Hurricane Helene caused extreme flooding to a lot of the coastal areas, Milton brought heavy winds, breaking poles, downing trees and scattering debris across the service area.
“Wind gusts of over 100 mph ripped the roof off of Tropicana Field, our baseball stadium,” she said. “Fifteen to 20 in. of rain caused flooding in areas that had not experienced that before. The ground was already saturated from the previous storm, so with 100 mph winds, whole trees were uprooted. Some broke poles and brought down overhead lines and others tossed pad-mounted transformers on our underground system. Trampolines, fences and roofs hung from overhead lines. At every turn, there was a new destruction to discover.”
Macke said she worked under storm duty for Hurricane Milton for about two weeks, and nearly a year later, she is still finding uprooting trees that are finally falling the rest of the way.
“So as part of the local utility, our storm restoration efforts have extended past the official end of the declared storm,” she said. “Just trying to keep going day after day and night after night was challenging,” she said. “We just worked as a team and knew that the work we were doing was important and we would see all the lights back on soon as long as we worked safely.”
As with any storm, she said it was important to take every job one step at a time.
“A lot of it was hazard recognition due to the amount of debris and downed trees and lines,” she said. “Just trying to access some of the neighborhoods was challenging. It was difficult to figure out how to remove a trampoline from a pole in the backyard when it was nearly impossible to even get your truck down the street.”
She said she would never forget how quickly she and the other line crews were able to restore power to the community through
their hard work and the help of other utilities and contractors that came to assist. She said everyone in the community was very grateful for the efforts of the line crews.
“My neighbors were amazing,” she said. “Even though we had no power in our neighborhood, they cleared debris from the street so that I would have a place to park my truck when I came home to sleep for a few hours between shifts.”
She was also able to experience how the whole community came together in the aftermath of the storm.
“One call took us down a street where several people had set up an entire outdoor kitchen and were grilling and feeding anyone who needed it,” she said. “It really showed the best of people.”
Macke said living in Florida on the coast has given her a completely different perspective on storm restoration.
“When I started in line work in Ohio, we would travel to where hurricanes hit, knowing we would go home in a couple of weeks. Living here, I’ve seen that when all the outside help leaves, the work doesn’t stop for the home utility. We spend months helping our community rebuild.”
Because she lived where the storm hit, she was able to sleep in her own bed, but it also meant that she was trying to assess damage to her house and go without electricity just like her neighbors.
“We were working 16-hour shifts, and I was working the overnight shift, so my sleep time was during daylight hours,” she said. “I had people drop thank you cards off, and my neighbors were all outside to say thanks the morning after we finally restored power to my neighborhood.”
Duke Energy’s team provided the line crews with meals at the yard to keep them well-nourished during the restoration.
“The crews I was working with would come in, have dinner for breakfast and breakfast before we even went home to go to bed,” she said. “Honestly, we were just happy to have something hot to eat.”
She said it’s surreal that it has already been a year since Hurricanes Helene and Milton caused destruction in Duke Energy’s service territory.
“We are back in hurricane season, and it almost feels like Milton was just yesterday,” she said. “I was working locally for both storms. It was a lot, but we got it done.”
Todd Fountain, storm director for Duke Energy Florida, said Hurricane Milton left much of Florida’s west-central coast in the dark, but the team’s strategic response helped to expedite restoration to customers.
“It allowed them to focus on what really matters, like their families and businesses, and begin to pick up pieces of their lives,” he said. “We know they depend on us for that, and it’s a responsibility that we take extremely seriously — not just during hurricane season — but all year long.”
AMY FISCHBACH (amyfischbach@gmail.com) is the Field Editor for T&D World magazine and the host of the Line Life Podcast.
Editor’s Note: To listen to three of Duke Energy’s lineworkers talk about the response to Hurricane Helene, tune in at linelife.podbean.com. Also, look for a follow-up article featuring these responders in a future issue of T&D World
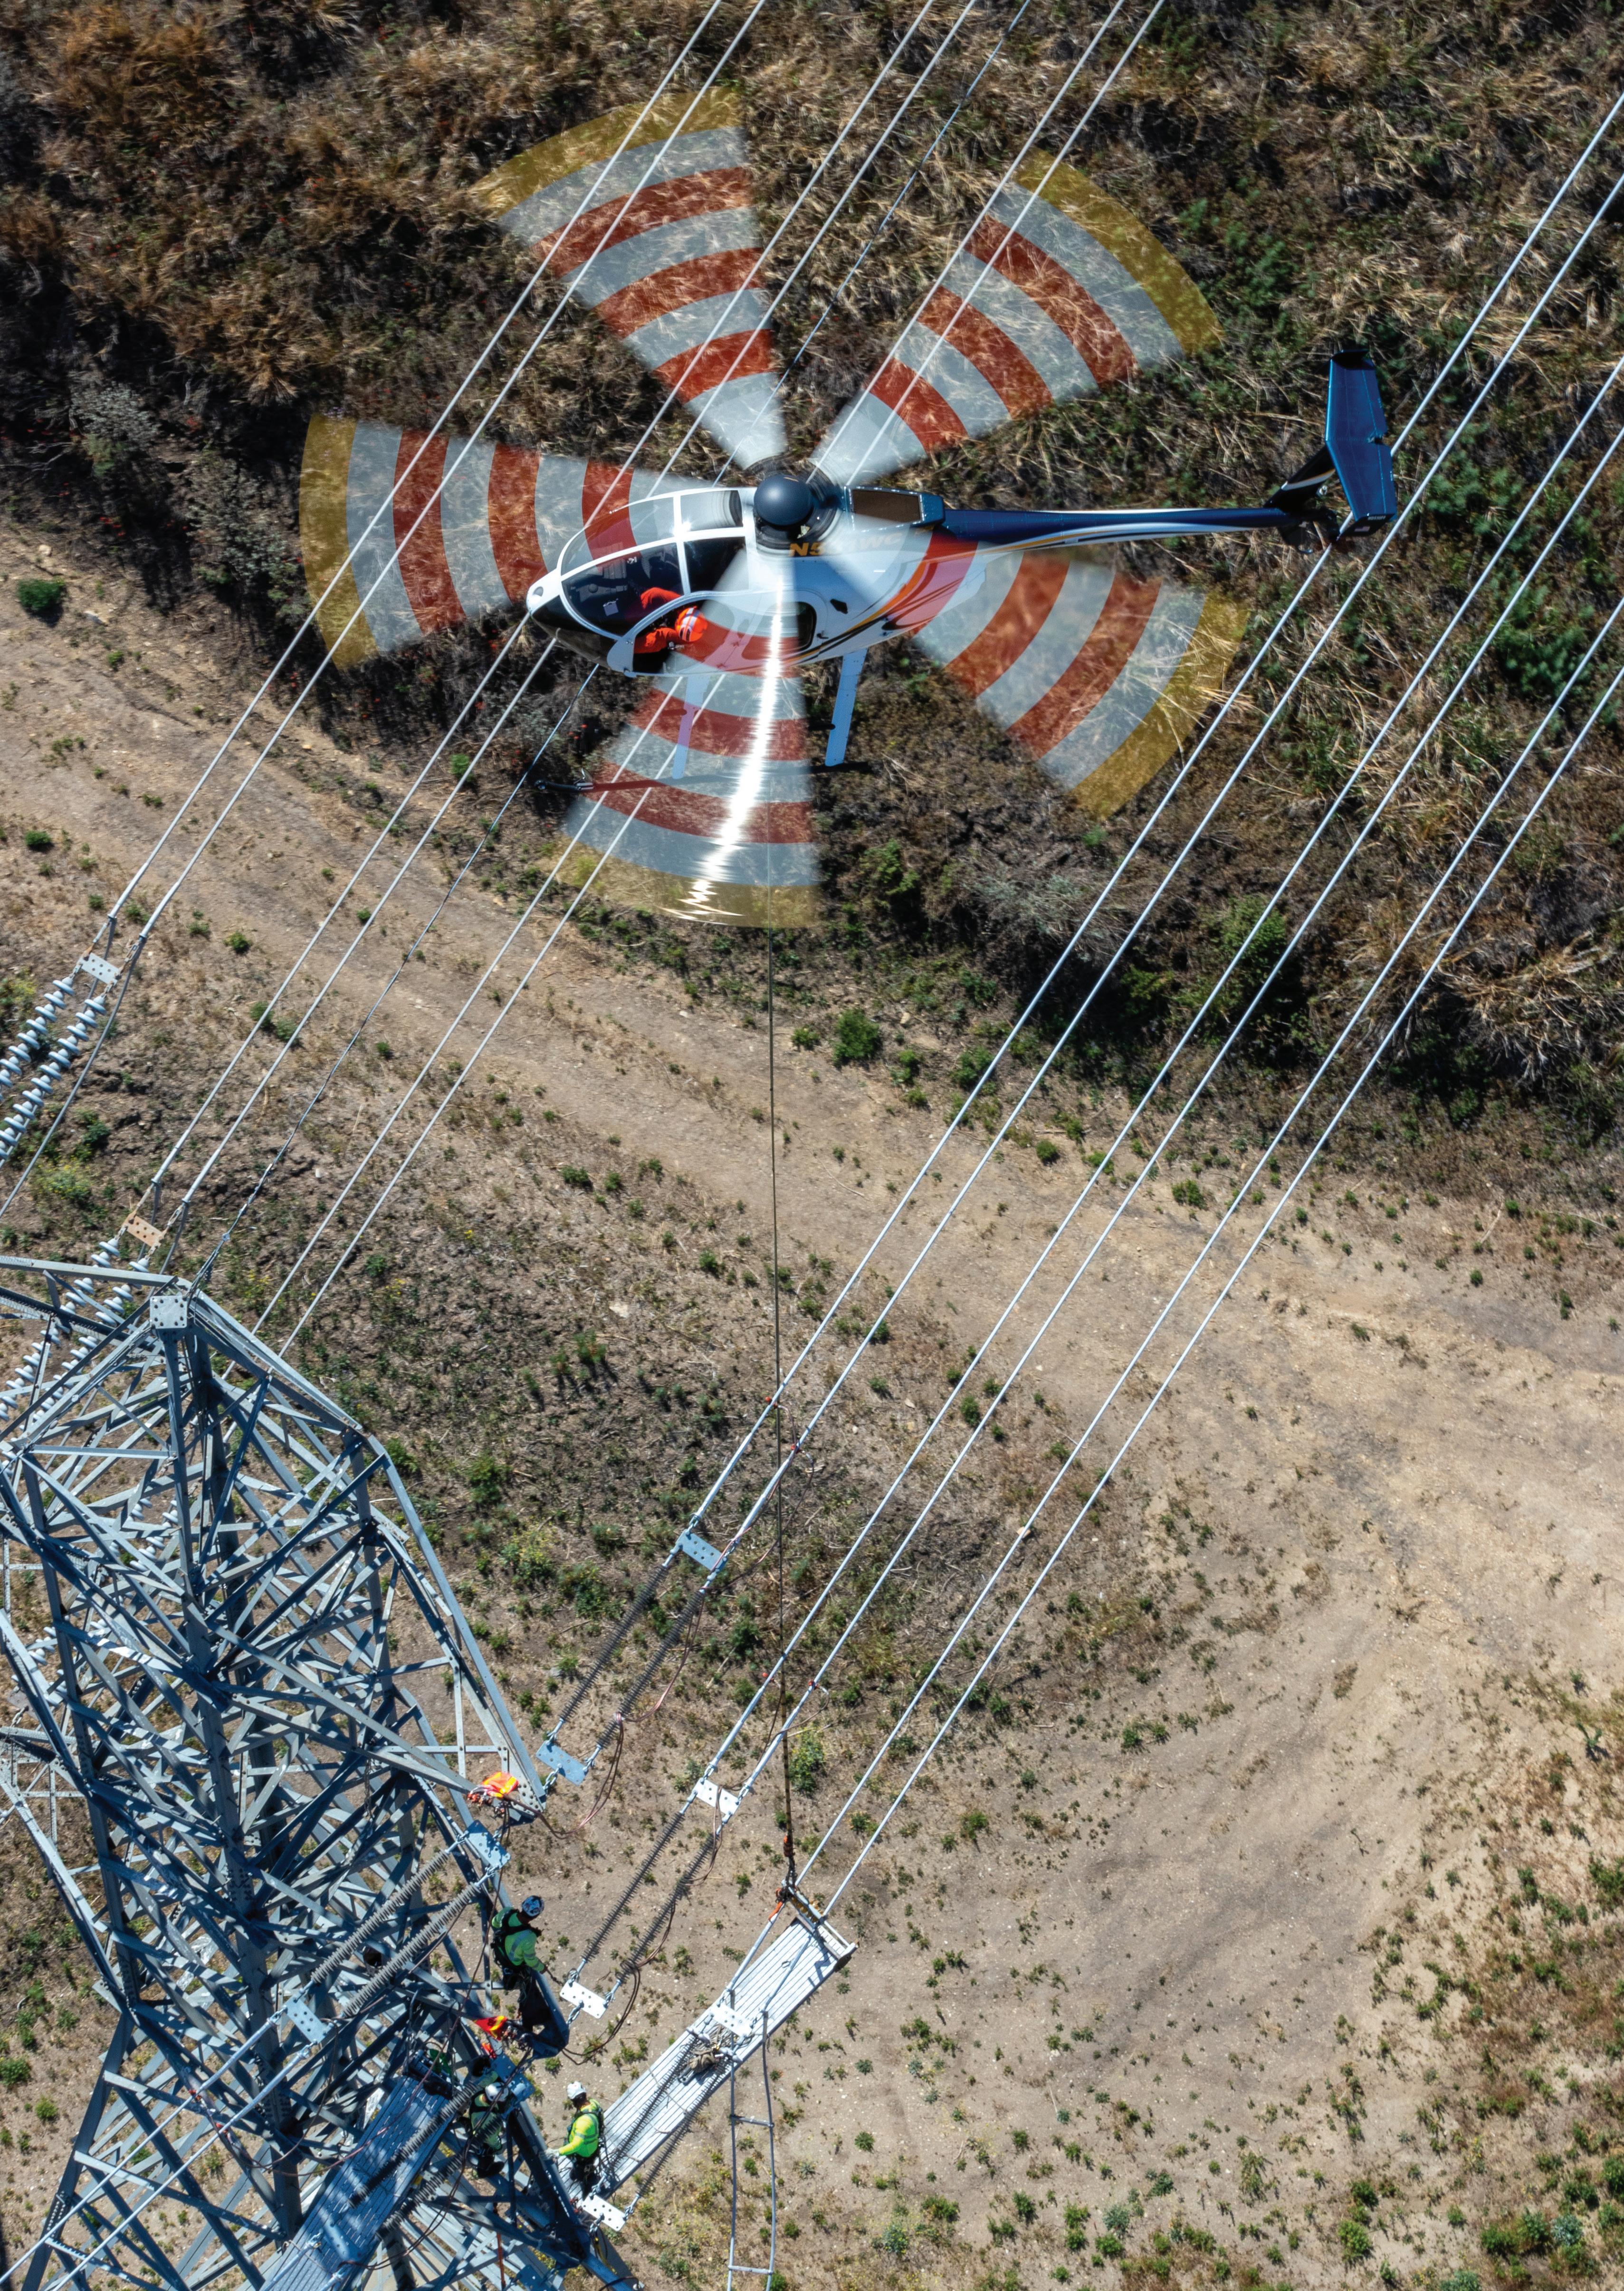
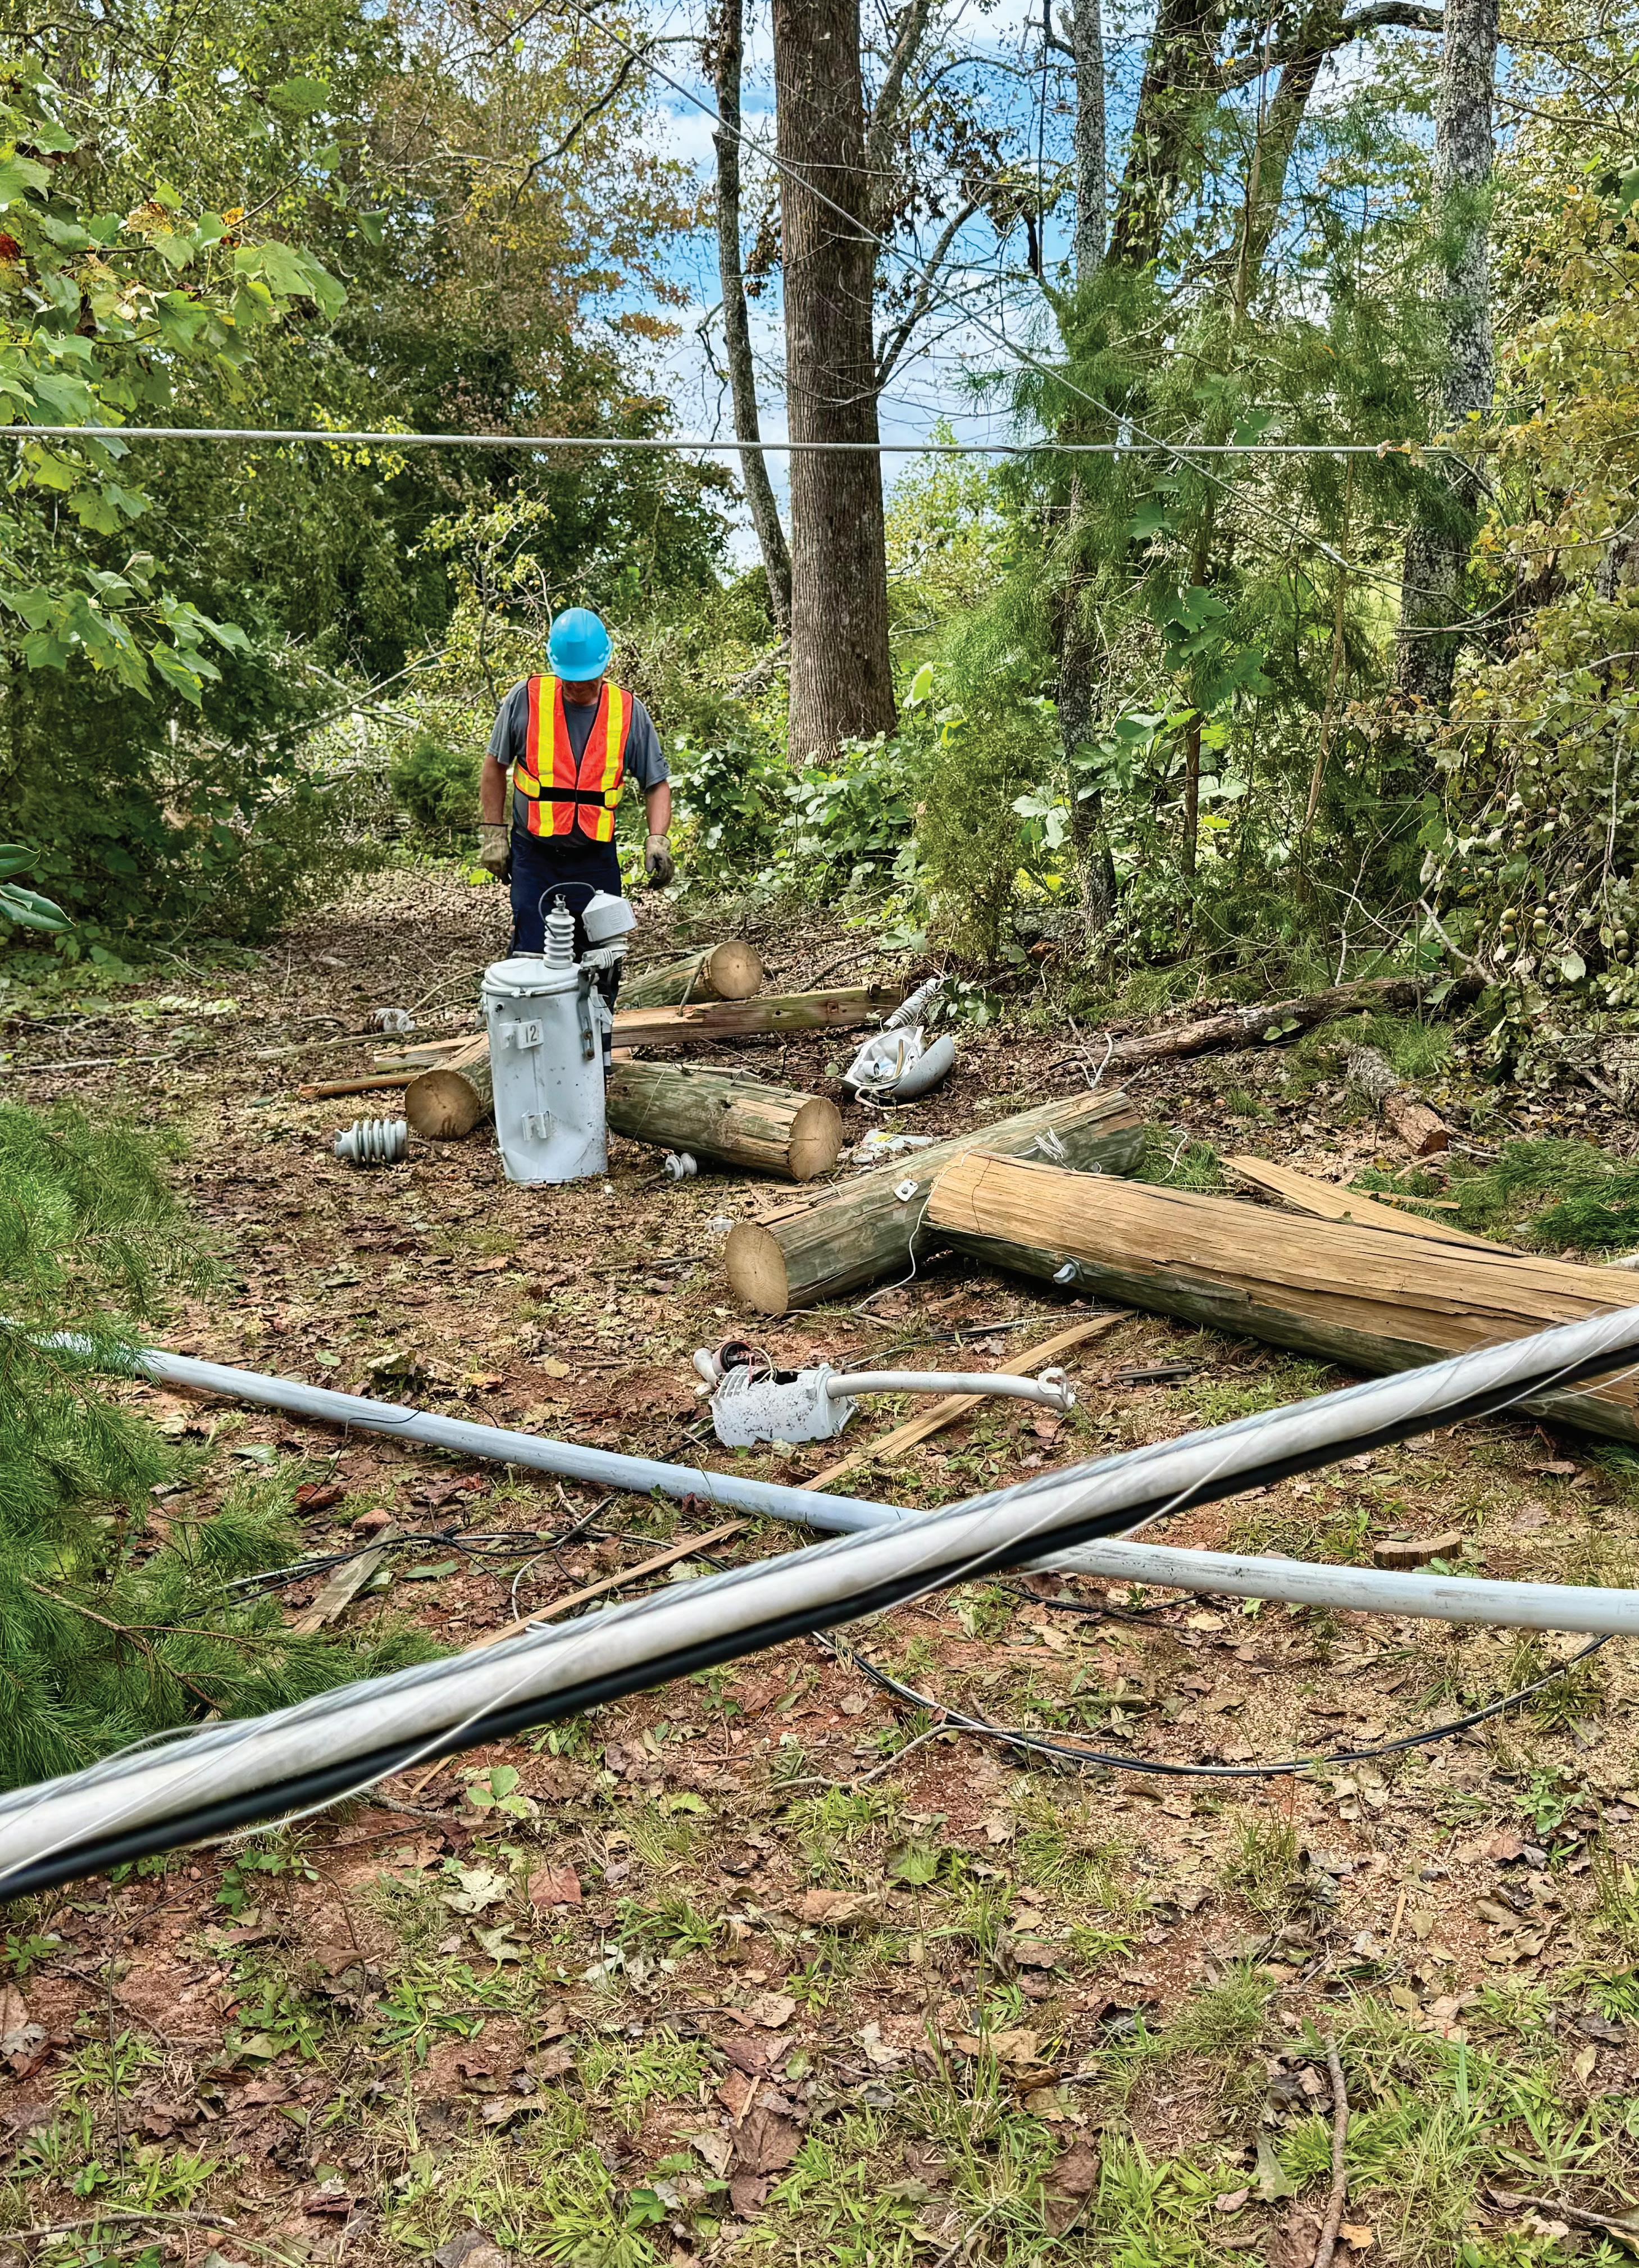
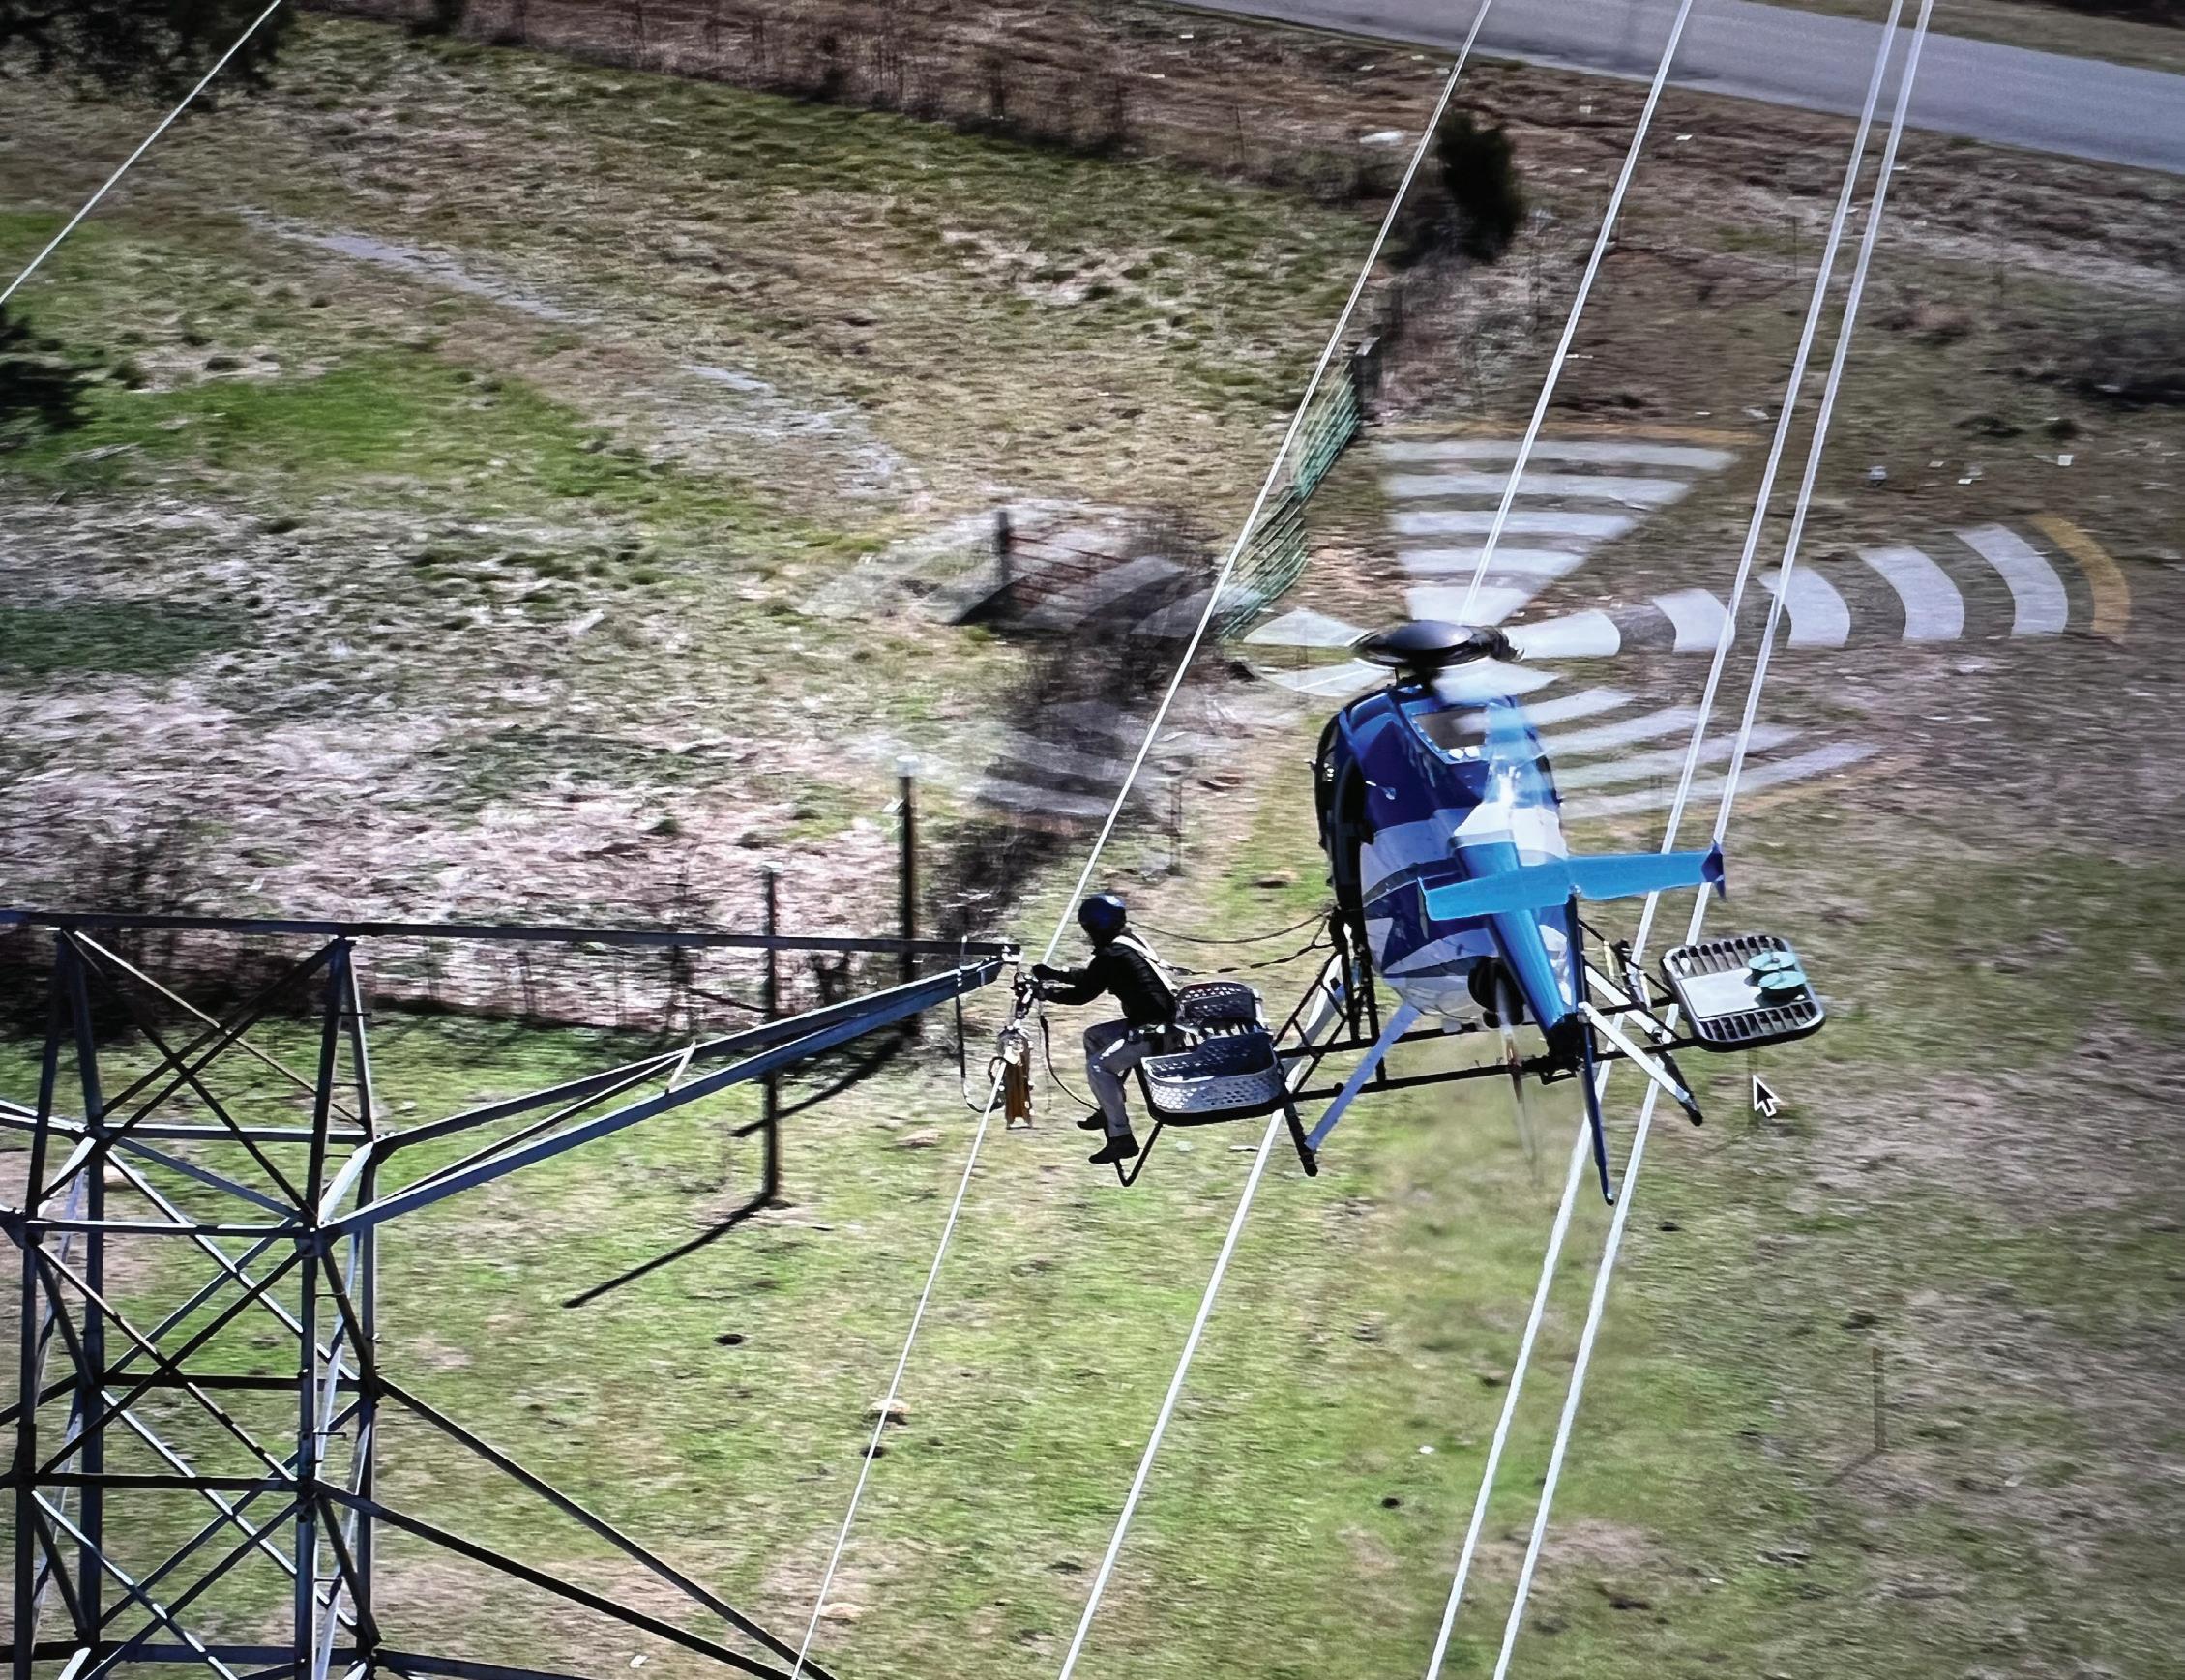
The FAA’s proposed regulations grant unmanned aircraft access to the same airspace occupied by helicopters used in line work.
By MIKE STARNER, National Electrical Contractors Association, and HEATHER MORAN, Level Ascent Solutions
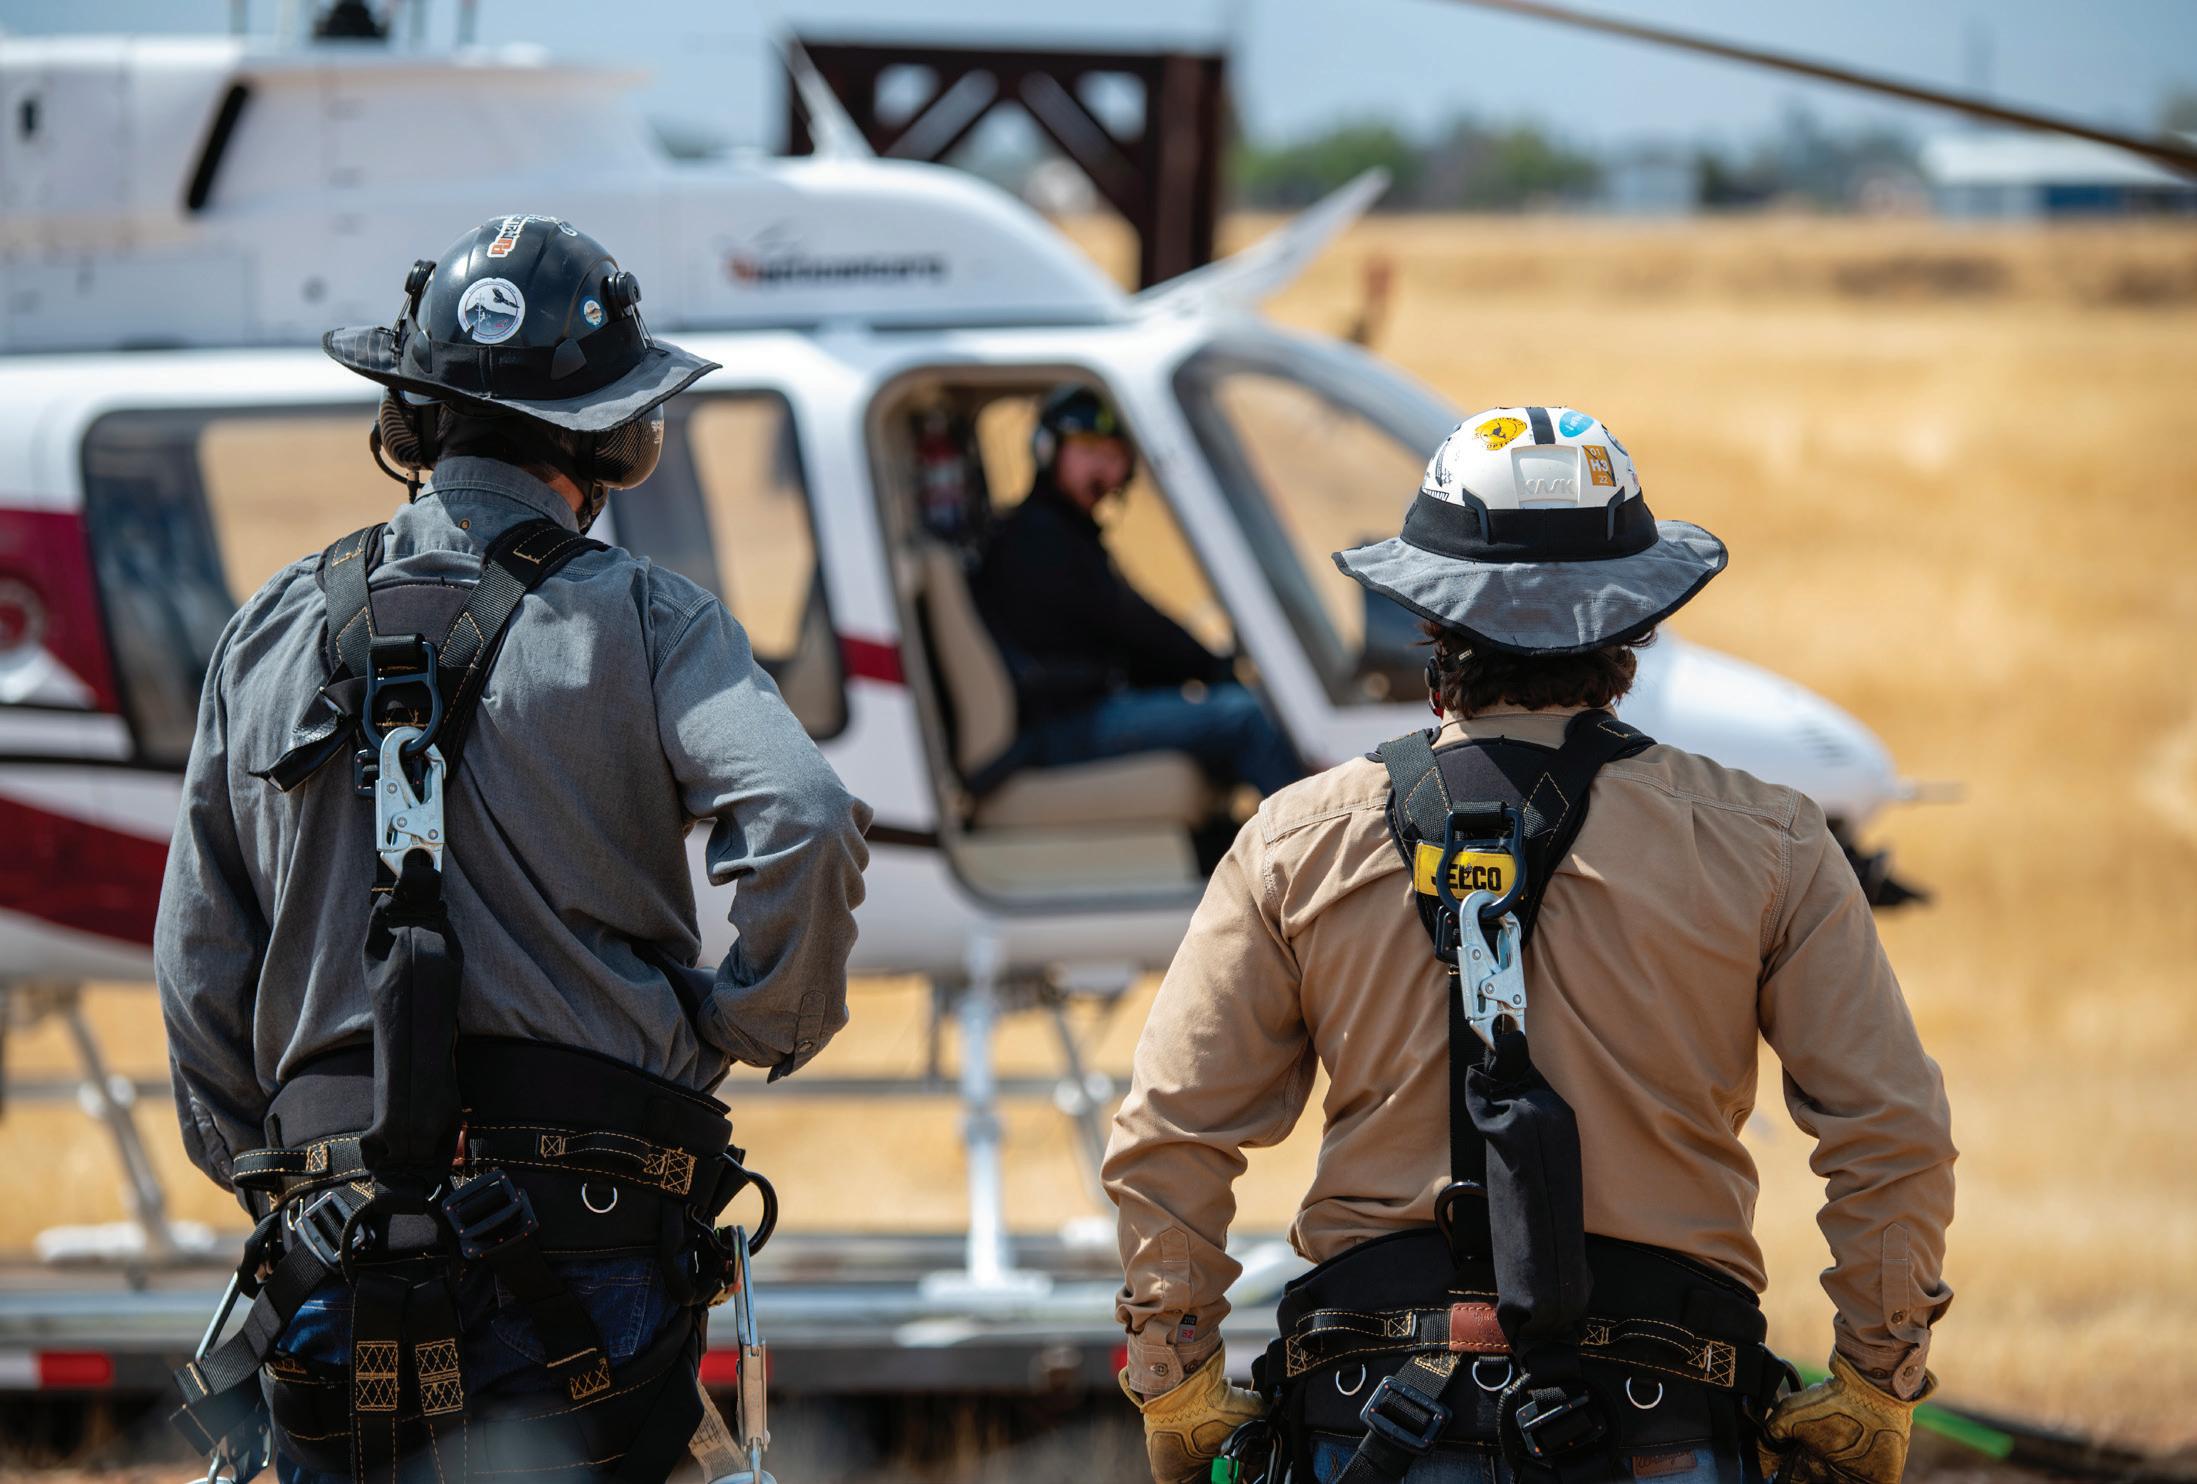
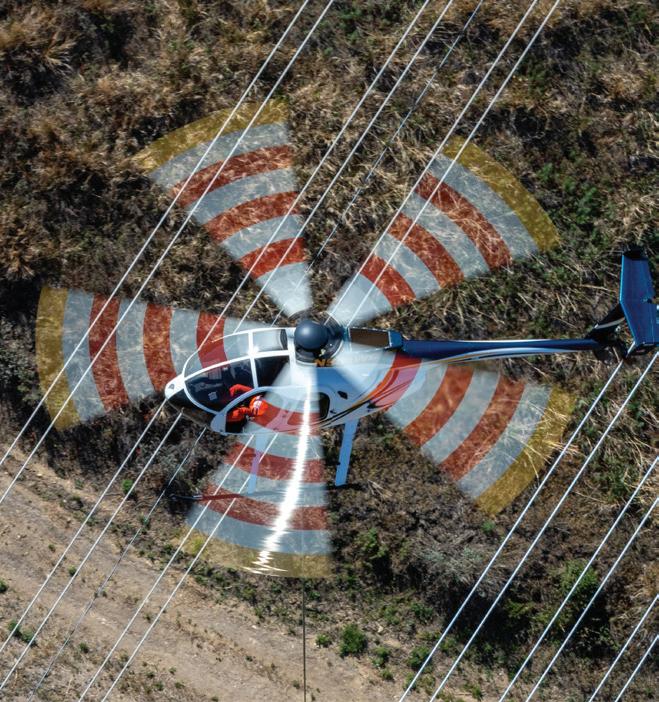
The wire environment is a workplace few see up close. Utility helicopters operate in these corridors every day, performing a wide array of activity, including construction, maintenance and inspection tasks. For lineworkers and pilots, working “inside the wires” means constant vigilance, decisive teamwork and reliance on experience and skilled flying.
The Federal Aviation Administration (FAA) proposed Docket FAA 2025 1908 marks a new chapter for these corridors. Parts 108 and 146 introduce rules for routine drone access, granting unmanned aircraft a significant presence in shielded airspace, the same space traditionally occupied by helicopters engaged in line work. The intent is to create modernization and efficiency, but for those who work on the lines, the biggest question is how these changes will impact daily operations and safety.
A single day on a transmission corridor highlights the risks — helicopter pilots hover close to lines, sometimes with lineworkers positioned on long lines or working directly from the skid of the aircraft. Even minor distractions, small objects, birds or a shifted wind can pose immediate danger. The addition of unmanned aircraft in these spaces, especially under assumptions that shielded areas are low risk, raises new concerns for avoidance, coordination and worker safety.
Shielded zones may look empty on a map, but they’re busy with activity, loading and unloading, tool drops, hardware installation and maneuvers that require a clear and distraction free space around the helicopter. For these missions, right of way is not an abstract concept, but a practical necessity to ensure safe flight and personal safety.
A key element of the FAA’s new proposal is a shift in right-of-way rules within
shielded areas. Traditionally, aviation rules have prioritized the safety of manned aircraft, particularly those with limited maneuverability and highrisk missions. Utility helicopters carrying external loads or supporting line crews have almost no ability to quickly evade obstacles, making clear right of way vital.
The proposal to give drones right of way in these corridors means more than changing airspace charts. It affects real people suspended above the ground. While automation and digital notification systems are promising, they cannot replace the need for visible, immediate awareness and human judgment in dynamic, risk-filled environments. In moments of confusion or surprise, technology alone is not enough.
Most helicopter operations currently rely on direct coordination: radio calls, visual checks, pre-mission briefings and
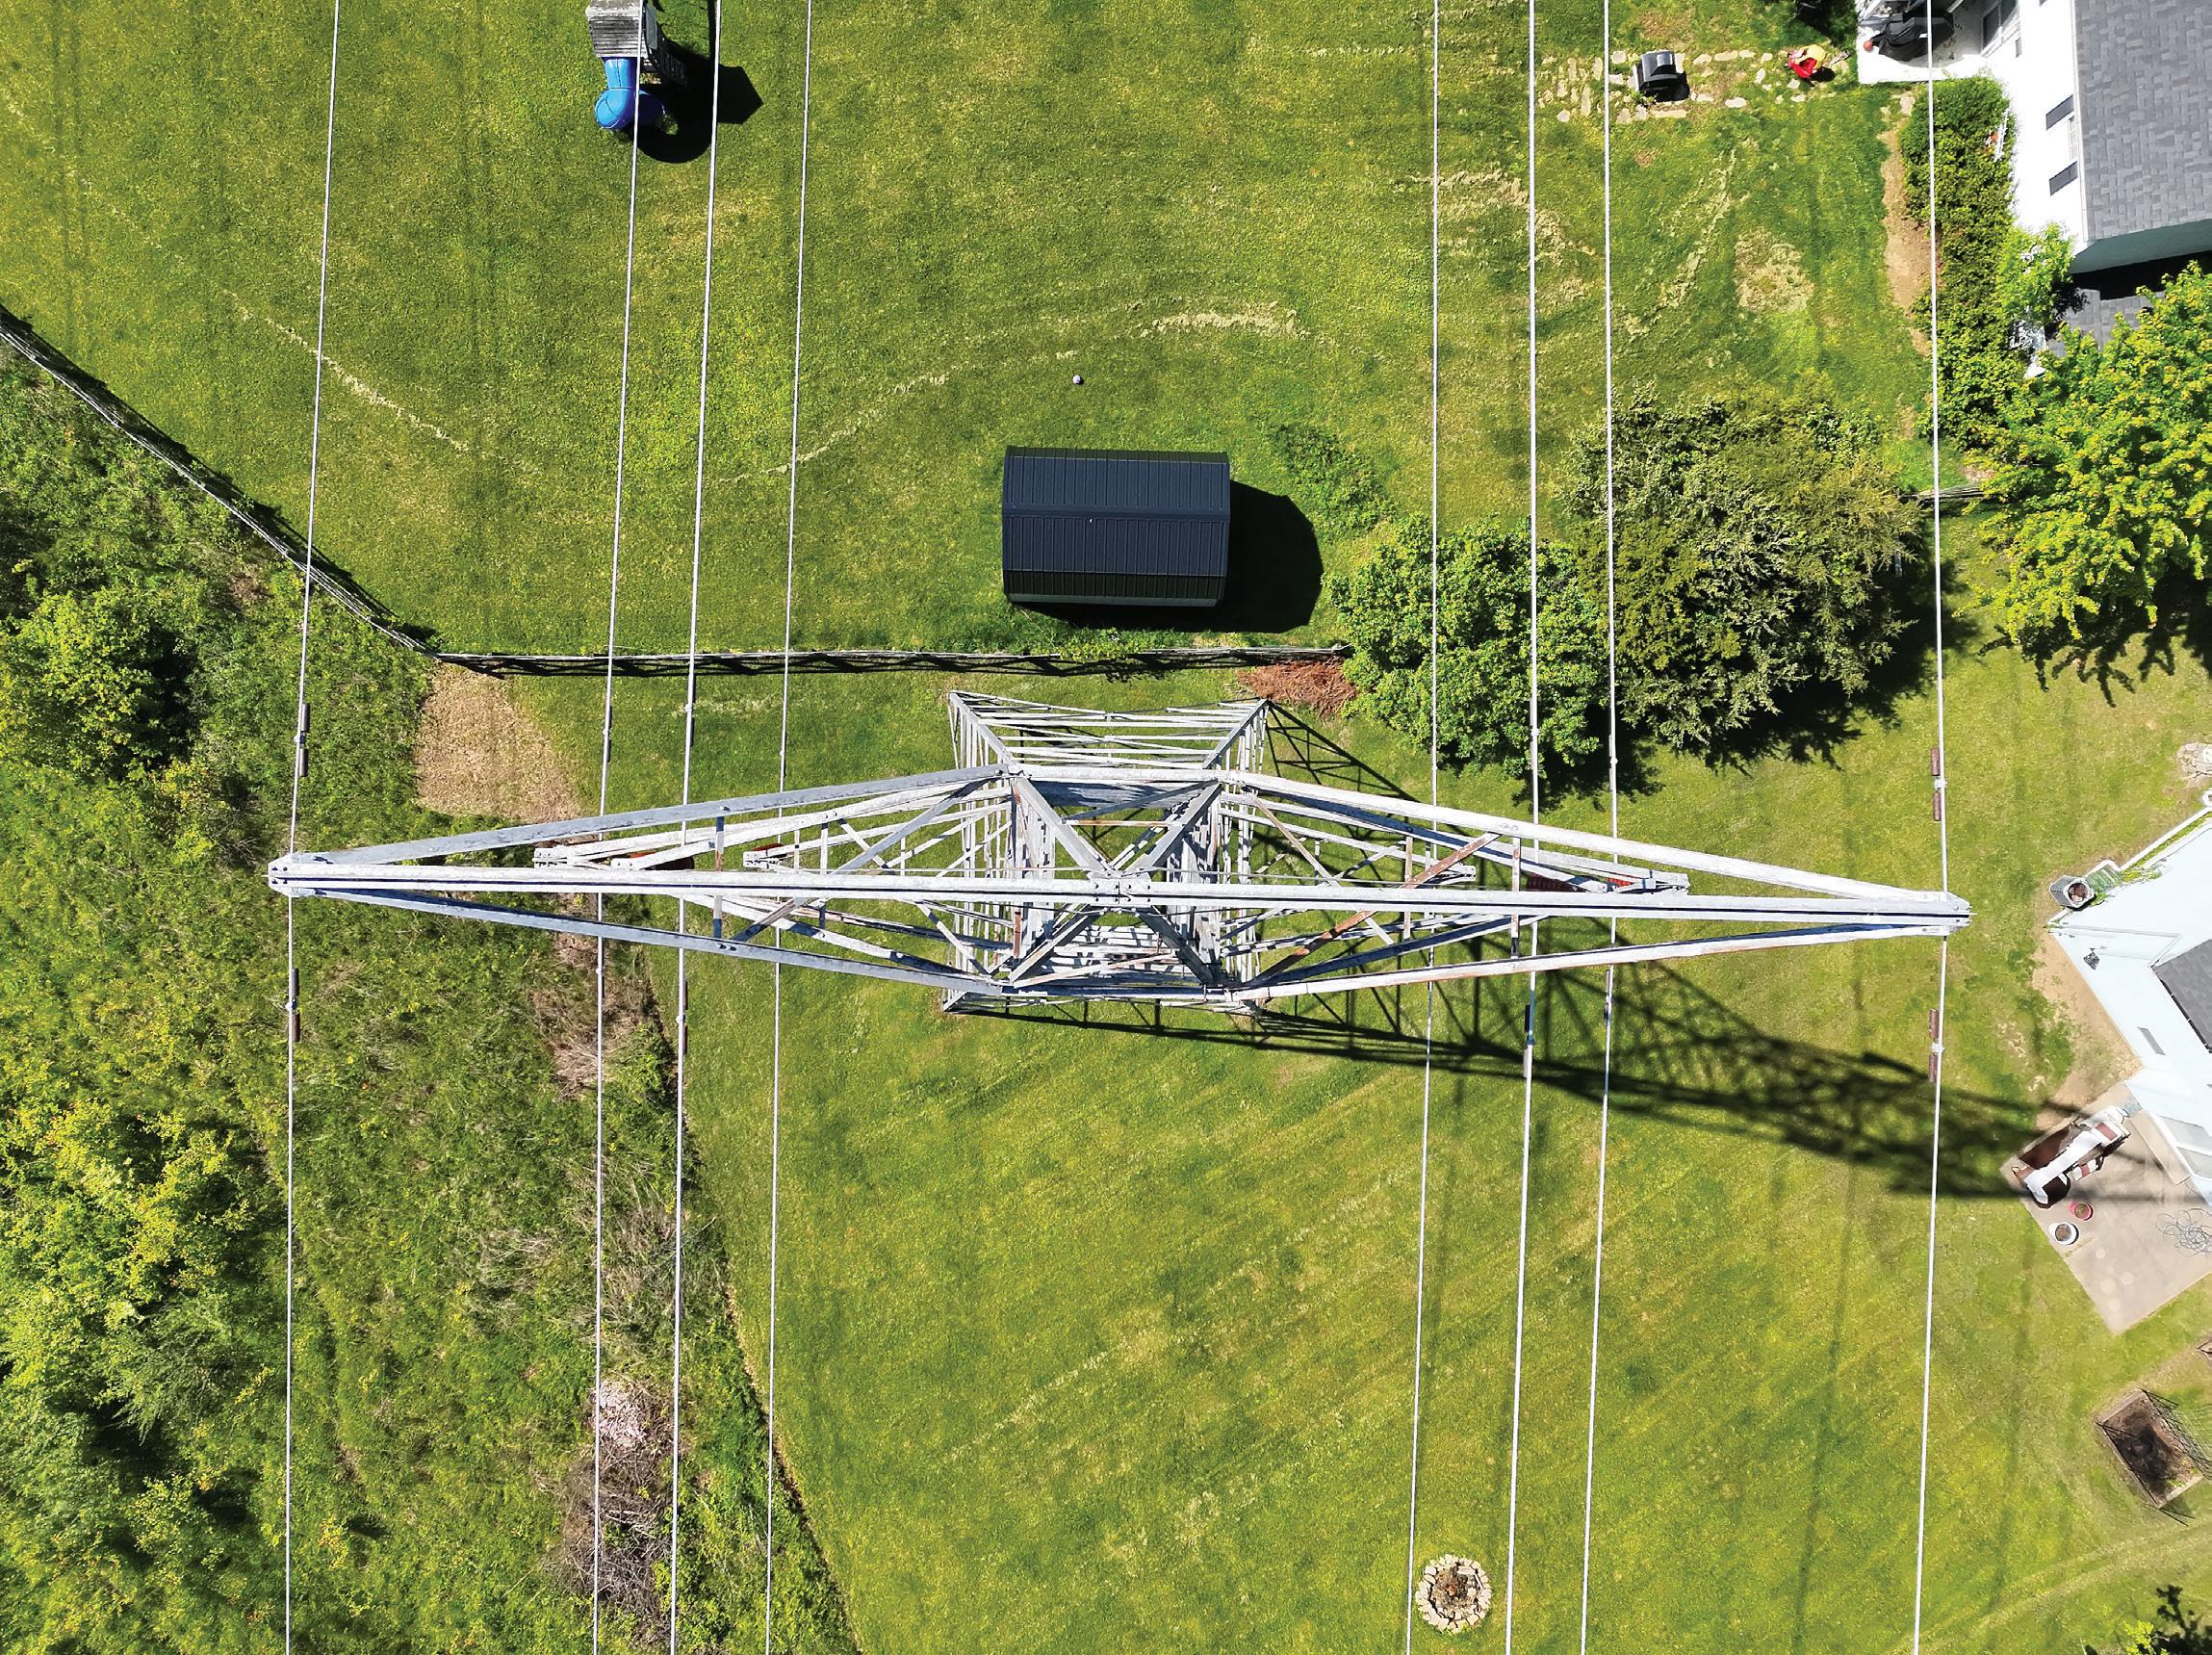
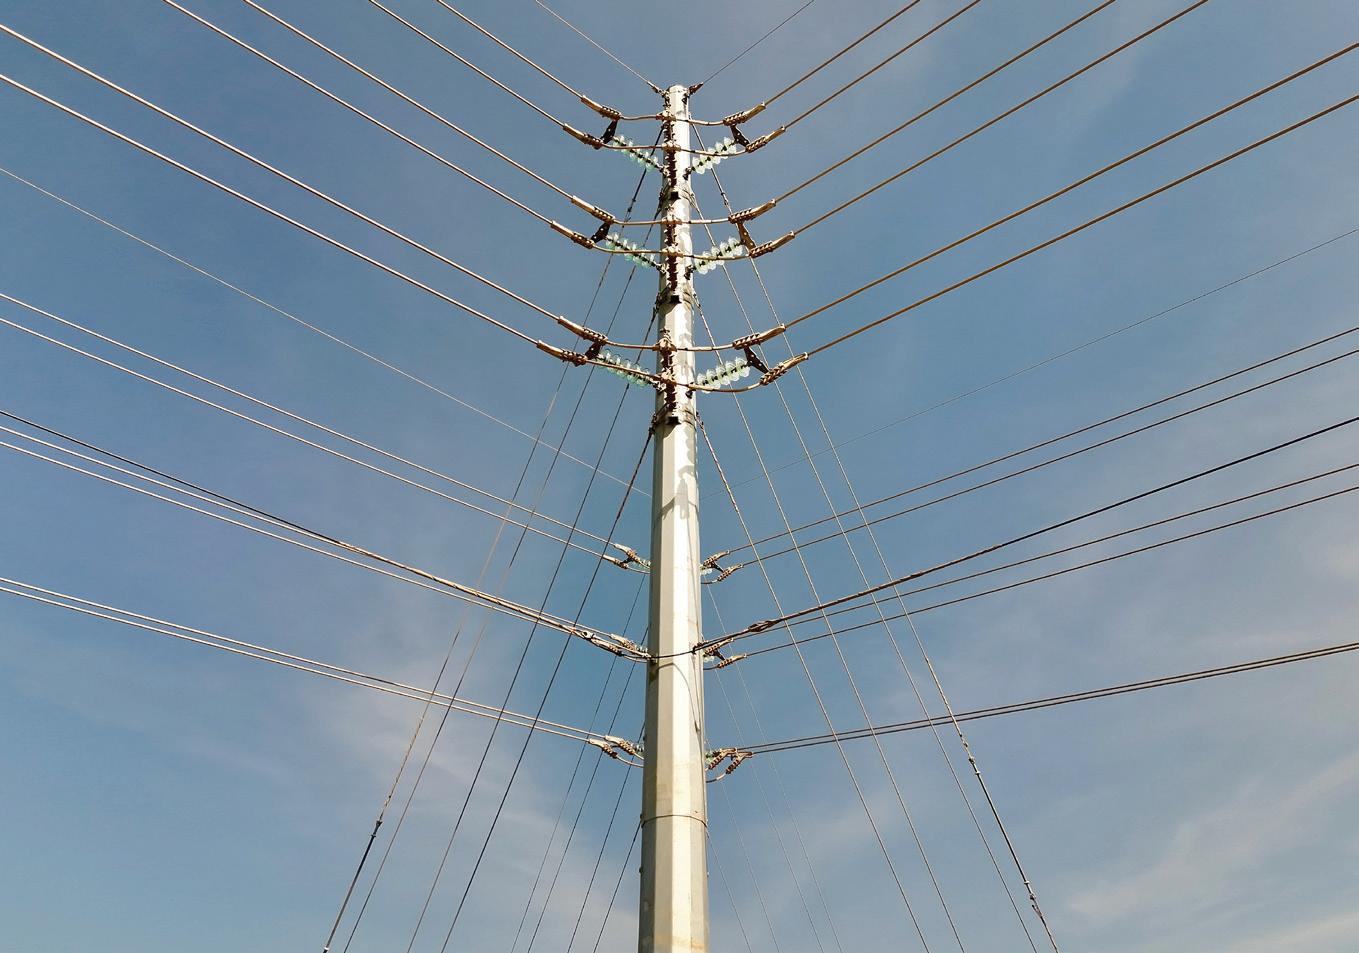
situational awareness built on decades of best practice. Integrating digital protocols with these tried-and-true methods is an ongoing challenge, and effective safety will depend on systems that immediately clear drones from corridors in use by manned aircraft.
Technology like geofencing, Automatic Dependent Surveillance-Broadcast (ADSB) and real-time coordination tools could form part of the solution, but only if designed to support on-the-ground realities. The goal is not resistance to progress, but pragmatic, layered communication that
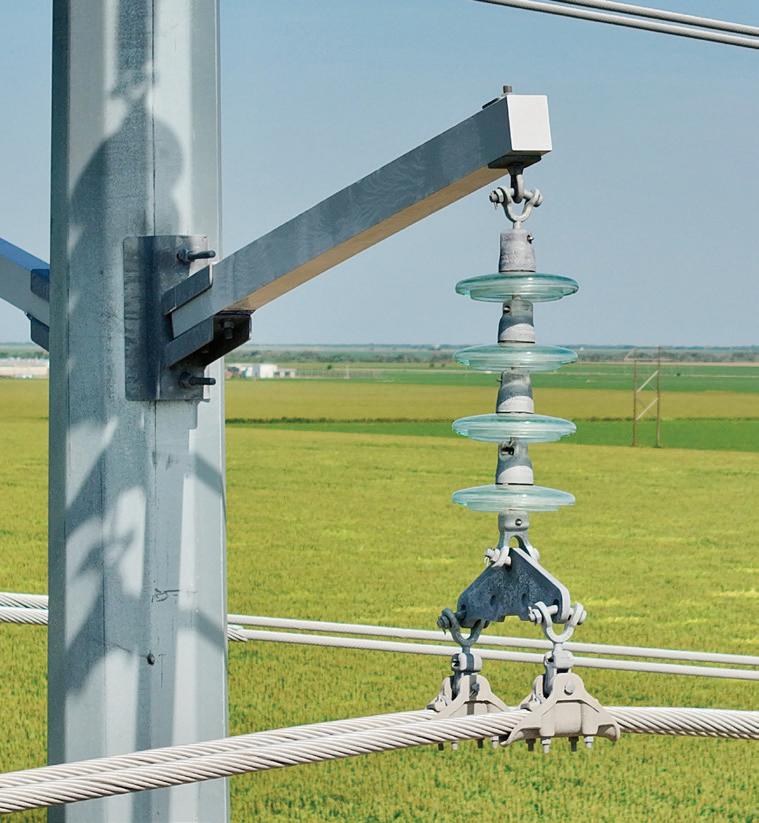
keeps the workplace above the wires as safe as possible.
Risk models for shielded drone operations often overlook the persistent, unpredictable hazards line crews manage
daily. The margin for error is slim, and every uncoordinated intrusion into active work zones is a serious concern. Aviation safety history is filled with incidents where obstacles, unexpected activity or a gap in communication led to injury or loss.
“Shared airspace is possible and necessary, but technology and policy must serve, not supplant, the human factor.”
For policy to protect lineworkers and helicopter crews, it must begin with deep respect for practical experience and the lessons learned from decades of utility aviation. Rules and technology both
work best when they empower, rather than bypass, the expertise and teamwork of those maintaining essential infrastructure.
The future of utility aviation is not about resisting change, but rather shaping modernization to ensure safety is a top priority. Right of way, rapid communication and robust deconfliction tools remain the cornerstone of every safe operation. When policymakers and technology developers prioritize human presence and risk, innovation and tradition can move forward together.
One of the greatest challenges as a drone operator in the United States is regulatory uncertainty. In the civil/commercial sector, drones are relatively new to the
airspace. In 2012 Congress passed the FAA Modernization and Reform Act, which set the initial framework for FAA drone rulemaking. From 2012 to 2016, the FAA began planning and designating test sites to study operations, detect-and-avoid, command and control and other integration challenges. This roadmap guided development of performance standards and identified technical gaps.
Operation and Certification of Small Unmanned Aircraft Systems, Part 107 was finalized in 2016. This created a clear, scalable regulatory path for routine civil/commercial operations of drones (<55lb). The rule included remote pilot certificate, visual line of sight limits, altitude and speed ceilings, daylight operations and a process to request waivers for operations outside standard limits.
In 2017, UAS Integration Pilot Program launched (IPP). IPP paired state and local governments with industry to safely test higher-risk operations (in real communities): night, flights over people, beyond visual line of sight and package delivery. IPP concluded in 2020 and was replaced with BEYOND to continue addressing integration challenges.
The FAA has actively been working towards Part 108 and 146 rulemaking since 2017. All the while, drone technology has evolved at an extremely quick pace. These technological advancements will allow for the necessary safety measures to be put in place for shared airspace. Drones can now be equipped with multi-directional sensors for obstacle avoidance, LiDAR and AI to avoid dynamic obstacles with GPS and ADS-B In to deconflict with manned aircraft in the area. The next hurdle is getting the framework and rulemaking right the first time.
It’s more than technology that needs to be implemented. Just like any well-run team, communication is key. Leaning into our options for communication and providing a standardized framework to increase safety is top priority. UAS Traffic Management systems, ADS-B In capable drones, geofencing during low altitude helicopter flights and continued use of LAANC with NOTAMs and TFRs can bridge this communication gap.
Traditional inspection methods force workers into hazardous environments. Drones significantly decrease this risk. What do part 108 and 146 mean to drone operators in infrastructure? It’s a huge step in the right direction to allow those who are equipped with the right technology, experience and knowledge to advance the industry. It allows one individual with one drone to:
• Perform around 80 miles of routine linear patrol and inspection on transmission and distribution lines in one day
• Conduct post-storm damage assessment quicker and more efficiently than ever before
• Scan infrastructure to see beyond the human eye with LiDAR and infrared for many miles at a time.
According to the June 30, 2025, report by the U.S. Department of Transportation Office of Inspector General, the FAA has issued 190 waivers specifically for Beyond Visual Line of Sight (BVLOS) operations as of October 2024. AUVSI reports 657+ active BVLOS waivers as of August 2025. These waivers are granted only after rigorous safety assessments, requiring detailed risk mitigation procedures, redundant communication/navigation systems and proven detect-and-avoid capabilities.
The successful implementation of these operations, with no major safety incidents reported under FAA-approved BVLOS waivers, demonstrates that BVLOS can be conducted safely when supported by modern technologies. Just as there are many different types of helicopter pilots, the same can be said for drone operators.
When looking to the future of these new FAA rules, every scenario needs to be explored to ensure safety is our number one priority. The general right-of-way rules for manned aircraft currently give priority to those with the least amount of maneuverability. Even in shielded operations, this needs to stay a priority.
The implementation of future regulations, specifically Part 108 and 146, represents a crucial step for infrastructure inspection, enabling a single operator to perform complex tasks like linear patrol and post-storm damage assessment far more efficiently and safely than traditional methods. These regulations must have a standardized form of communication between drone operators and manned aircraft.
We have the technology and the road map and now we need implementation to allow for safe, shared airspace. Listening to those already in this airspace will be crucial to safe implementation, specifically in shielded areas. BVLOS can greenlight a new era of safer, more efficient, and more reliable infrastructure management for all.
As airspace policy evolves, the voices of those working inside the wires and those flying above it must unite in shaping the
future. Shared airspace is possible and necessary, but technology and policy must serve, not supplant, the human factor. When the next outage strikes, the next inspection is due, or the next drone mission launches, the focus must remain on safety, collaboration, and respect for whoever is “inside the wires.”
Moving forward, a culture of proactive communication must be built, with regular dialogue between drone operators, helicopter crews, regulators and utility safety professionals. Mutual understanding, ongoing training, and continuous engagement in the development of standards will empower all parties to anticipate risks and respond rapidly when the unexpected occurs.
The corridor above our power lines is not just a workspace, it’s a place where innovation and expertise intersect for the public good. By fostering this spirit of partnership, we can ensure that progress in technology fully supports, rather than compromises, the essential work that keeps our communities connected and safe.
MIKE STARNER (Mike.Starner@necanet.org) CUSP, CHST and CLCP is the executive director, Outside Line Safety for the National Electrical Contractors Association (NECA). He is a journeyman lineman and member of IBEW Local Union 70 in Washington, D.C. He brings more than 30 years of experience spanning field operations, management and industry leadership. In his current role, he leads initiatives that shape safety standards and best practices impacting thousands of electrical contractors nationwide. He served as the co-chair of the EEI Joint Contractor Safety Task Force and a member of the executive subcommittee for the National Electrical Safety Code (NESC). He also contributed to national safety policy through the OSHA ET&D Partnership Steering Committee and served on the boards of the Electrical Safety Foundation International (ESFI), the Electrical Industry Certification Association (EICA) and the National Cable Splicing Certification Board (NCSCB).
HEATHER MORAN (h.moran@levelascentsolutions. com) is the owner of Level Ascent Solutions, which uses unmanned aircraft systems (UAS) to offer aerial data solutions to improve efficiency, safety and speed, empowering businesses across industries. Heather obtained her sUAS level 1 Thermography certification and earned her undergraduate and doctorate degree at the University of Cincinnati.


































































An electrical engineer for Ameren Illinois shares his journey earning his naturalist certification.
By BRIAN BRETSCH, Ameren Illinois
In the world of electric distribution, safety, precision and reliability are paramount. But for Joey Anthony, East Region managing engineer for Ameren Illinois, the job doesn’t end
when the voltage stabilizes. Beyond the substations, power line extensions and smart grid technology, Anthony is also a certified master naturalist through the University of Illinois Extension — a role

that brings ecological awareness into the heart of infrastructure planning.
Anthony’s journey began at the University of Illinois Urbana-Champaign, where he earned his electrical engineering degree in 2011. He joined Ameren Illinois the following year at its Paxton Operating Center, diving into the technical challenges of grid modernization and system reliability. But engineering wasn’t always smooth sailing.
“I wasn’t a straight-A student in college,” Anthony admits. “It was humbling. You go from being one of the smartest kids in high school to realizing you’re surrounded by brilliant minds.”

He credits perseverance, coffee and a late-blooming study group for helping him push through. His time as a saxophone section leader in
the Marching Illini also gave him a creative outlet and a much-needed balance to the rigors of engineering.
Anthony’s love for nature wasn’t inherited — it was instinctive. Childhood days spent exploring creeks and catching frogs near the Kankakee River planted the seeds of curiosity. But it wasn’t until the COVID-19 pandemic that those instinctive roots truly took hold.
“Suddenly, everything was shut down,” he recalls. “So, we started hiking — more that year than I had in the previous decade.” That outdoor immersion led him to discover the University of Illinois Extension’s Master Naturalist program, inspired in part by a neighbor and master gardener named Carlo.
Despite working full-time at Ameren Illinois, Anthony completed the hybrid certification program in 2021, attending Zoom lectures and Saturday field days. He studied Illinois’ diverse bioregions — prairies, wetlands, forests — and completed 60 hours of volunteer work to earn his badge. He now maintains his certification with ongoing education and service.
Anthony’s world as an engineer and naturalist often intersect in unexpected ways. One standout example involved a line extension project in Urbana, Illinois, where a maple tree designated for trimming housed a thriving beehive.
“The easy answer was to remove the hive,” he says. “But I knew that wasn’t right.”
Drawing on his naturalist training, Anthony coordinated with the Champaign County Beekeeping Society to safely relocate the bees, preserving both the ecosystem and the project timeline.
“It’s about being aware of what’s around you,” he says. “Even in utility work, you can make choices that respect the environment.”
Anthony’s conservation efforts extend beyond his day job. As president of the Upper Sangamon River Conservancy, he leads the Nest Box Committee, building

Anthony’s garden is a living testament to biodiversity, designed not just for beauty but for ecological impact. Here are some of his favorite species.
Favorite Tree: White Oak.As Illinois’ state tree, the white oak holds a special place in Joey Anthony’s heart—and in the ecosystem.
“Oaks are keystone species. They support hundreds of caterpillars, moths and butterflies. They feed birds, turkeys and all kinds of ground critters. Everyone should want to plant oak trees.”
Favorite Prairie Plant: Pale Purple Coneflower. Among the rich tapestry of Illinois’ tallgrass prairie, Anthony finds himself drawn to the pale purple coneflower. “It’s a great nectar source from May through July, and it’s beautiful all season. I leave it standing through winter—it adds texture to the garden and feeds finches long after the blooms fade.”
Honorable Mentions:
Prairie Dock—admired for its towering presence and deep roots.
Common Milkweed—essential host plant for monarch caterpillars.
habitats for declining species like bluebirds and wood ducks. When a transmission upgrade replaced old cedar poles, Anthony saw an opportunity.
“I asked the foreman to leave me a few sections,” he explains.
With help from his father-in-law, a skilled woodworker, and a local mill, those poles were transformed into Peterson-style bluebird houses and wood duck boxes — crafted from the very power poles that once carried electricity.
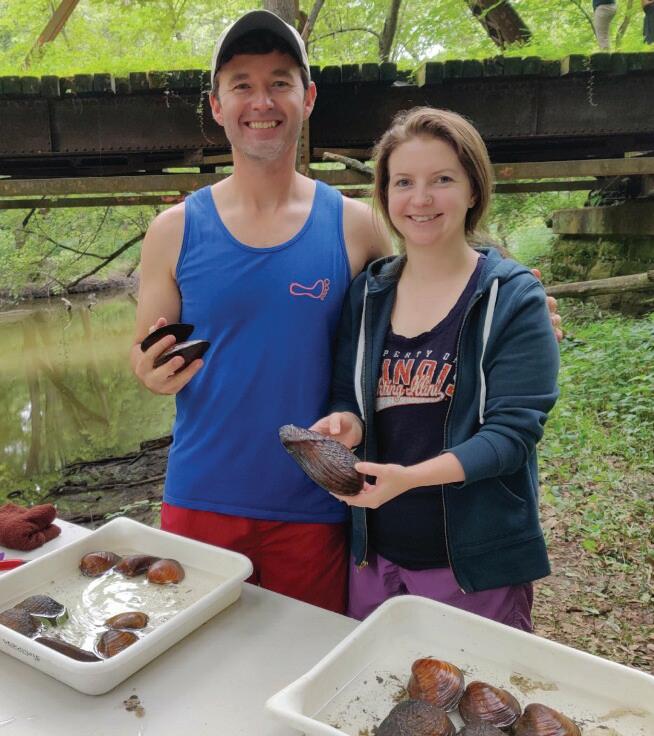
Among his favorite projects is the annual freshwater mussel survey in the Upper Sangamon River, where volunteers identify species that serve as indicators of water quality.
“We’ve found about 25 species,” Anthony says. “If they’re thriving, it means our ecosystem is healthy — for wildlife and for people.”
His favorite moment as a master naturalist occurred in 2023. He was with a group doing some citizen science work collecting mussels to measure and tag when he added one to his bag that he knew was special. However, the malacologist was a bit stunned by his discovery. Anthony found a slipper shell mussel — a species that hadn’t been recorded in the Sangamon River since 1991 and a state of Illinois
Species in Greatest Conservation Need.
“That find was thrilling,” he says. He also participates in macroinvertebrate surveys, studying aquatic insects that reveal the health of local streams. These efforts reflect a broader philosophy: that stewardship and science go hand in hand.
Anthony’s story is a reminder that engineering and environmentalism aren’t opposing forces — they’re complementary disciplines. Whether he’s designing a line extension or surveying river mussels, Anthony brings a holistic mindset to every challenge.
“I’m always thinking about natural history,” he says. “It’s part of how I see the world now.”
He adds, “I would encourage all people to be curious and to try and learn the names of things in nature around us. It’s easier to love something when you know its name. Also, everyone can make an impact … just start small and dream big.”
In an era where sustainability is no longer optional, professionals like Anthony are leading the charge — proving that the grid can be green, and that even a transmission pole can find new life as a home for a bluebird.
BRIAN BRETSCH (BBretsch@ameren.com) is the public and media relations manager for Ameren.
If you haven’t been following nuclear news lately, there is a lot to catch up on!
By JEFF POSTELWAIT, Managing Editor
There was a time when the U.S. was the leader in the peaceful uses of nuclear power, and since then, France, Russia, Japan and China have, at various points, taken leadership roles in the worldwide nuclear industry. However, for longer than I have been writing about energy, there have been those wishing to see the U.S. take a leading role in fission yet again.
Back in 2008, when I first started out writing in this industry, my mentor editors explained how things had slowed to a crawl after Three Mile Island, but the then-incoming President Barack Obama and the 2009 American Recovery and Reinvestment Act (ARRA) and its loan guarantee programs for big capital projects for the power grid seemed to hold some promise for a long-awaited “Nuclear Renaissance.”
Over time, I heard that term less and less as new nuclear was slow to get started and smaller nuclear projects with newer technologies failed to materialize. In the meantime, the Fukushima accident and the accompanying German Energiewende served to further tarnish the nuclear power brand. Southern Co. and Plant Vogtle Units 3 and 4 were the lone examples of success nuclear advocates could point to. The
reactors were built — the first new reactors in the U.S. for 7 years, and with the new Westinghouse AP1000 reactors to boot — but it was a mixed success. Cost overruns, company bankruptcies and construction delays dogged the project. Certainly not a Nuclear Renaissance, at least not yet.
If you haven’t been following nuclear news lately, there is a lot to catch up on. In November 2025, something approaching unthinkable to the late 20th century mind occurred when a deal was struck to restart a retired nuclear reactor at Three Mile Island — that is, Unit 1, not Unit 2, the one that partially melted down in the 1970s.
In this deal, the DOE offered a $1 billion loan to Constellation Energy Generation to restart the renamed Crane Clean Energy Center. The unit was shut down a few years ago, but tech giant Microsoft breathed new life into the project by signing a 20-year power purchase agreement in a deal worth an estimated $27 billion. That is a big bet by anyone’s counting in today’s economic picture.
Constellation also signed a deal with Meta, Facebook’s parent company, to buy nuclear power from the nuclear Clinton
Power Station in Illinois, in a deal that ensured the relicensing and continued operation of the 1092 MW plant for another two decades.
Google signed deals with NextEra Energy to help restart the 615-MW nuclear powered Duane Arnold Energy Center near Cedar Rapids, Iowa. As with the other deals between tech companies and power producers, Google wants this power for its cloud-based and AI infrastructure.
Likewise, the Palisades Nuclear Plant, which shut down in May 2022, may also be restarted after receiving a $400 million investment from the state of Michigan, $1.52 billion in DOE loan guarantees and more than $1.3 billion from the Department of Agriculture. This project would also see two advanced SMRs built as part of the plant.
It is worth remembering that before these predicted spikes in energy demand, the economic picture was not looking so good for nuclear power plants, which were until recently viewed by some utilities as too expensive to keep running.
No SMR plants have yet been built in the US, but federal agencies agreed to look into proposed projects by NuScale Power, X-Energy Reactor Corp. and others.
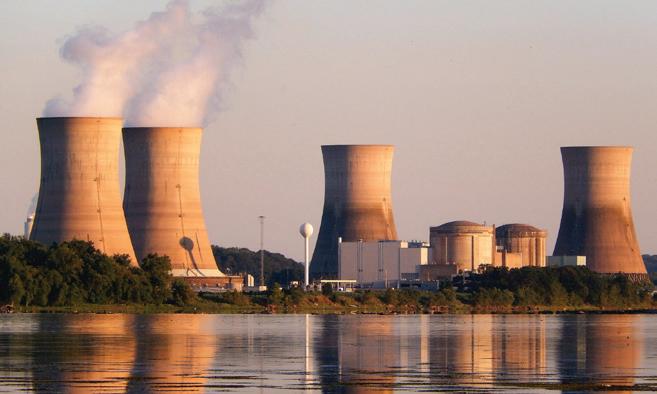
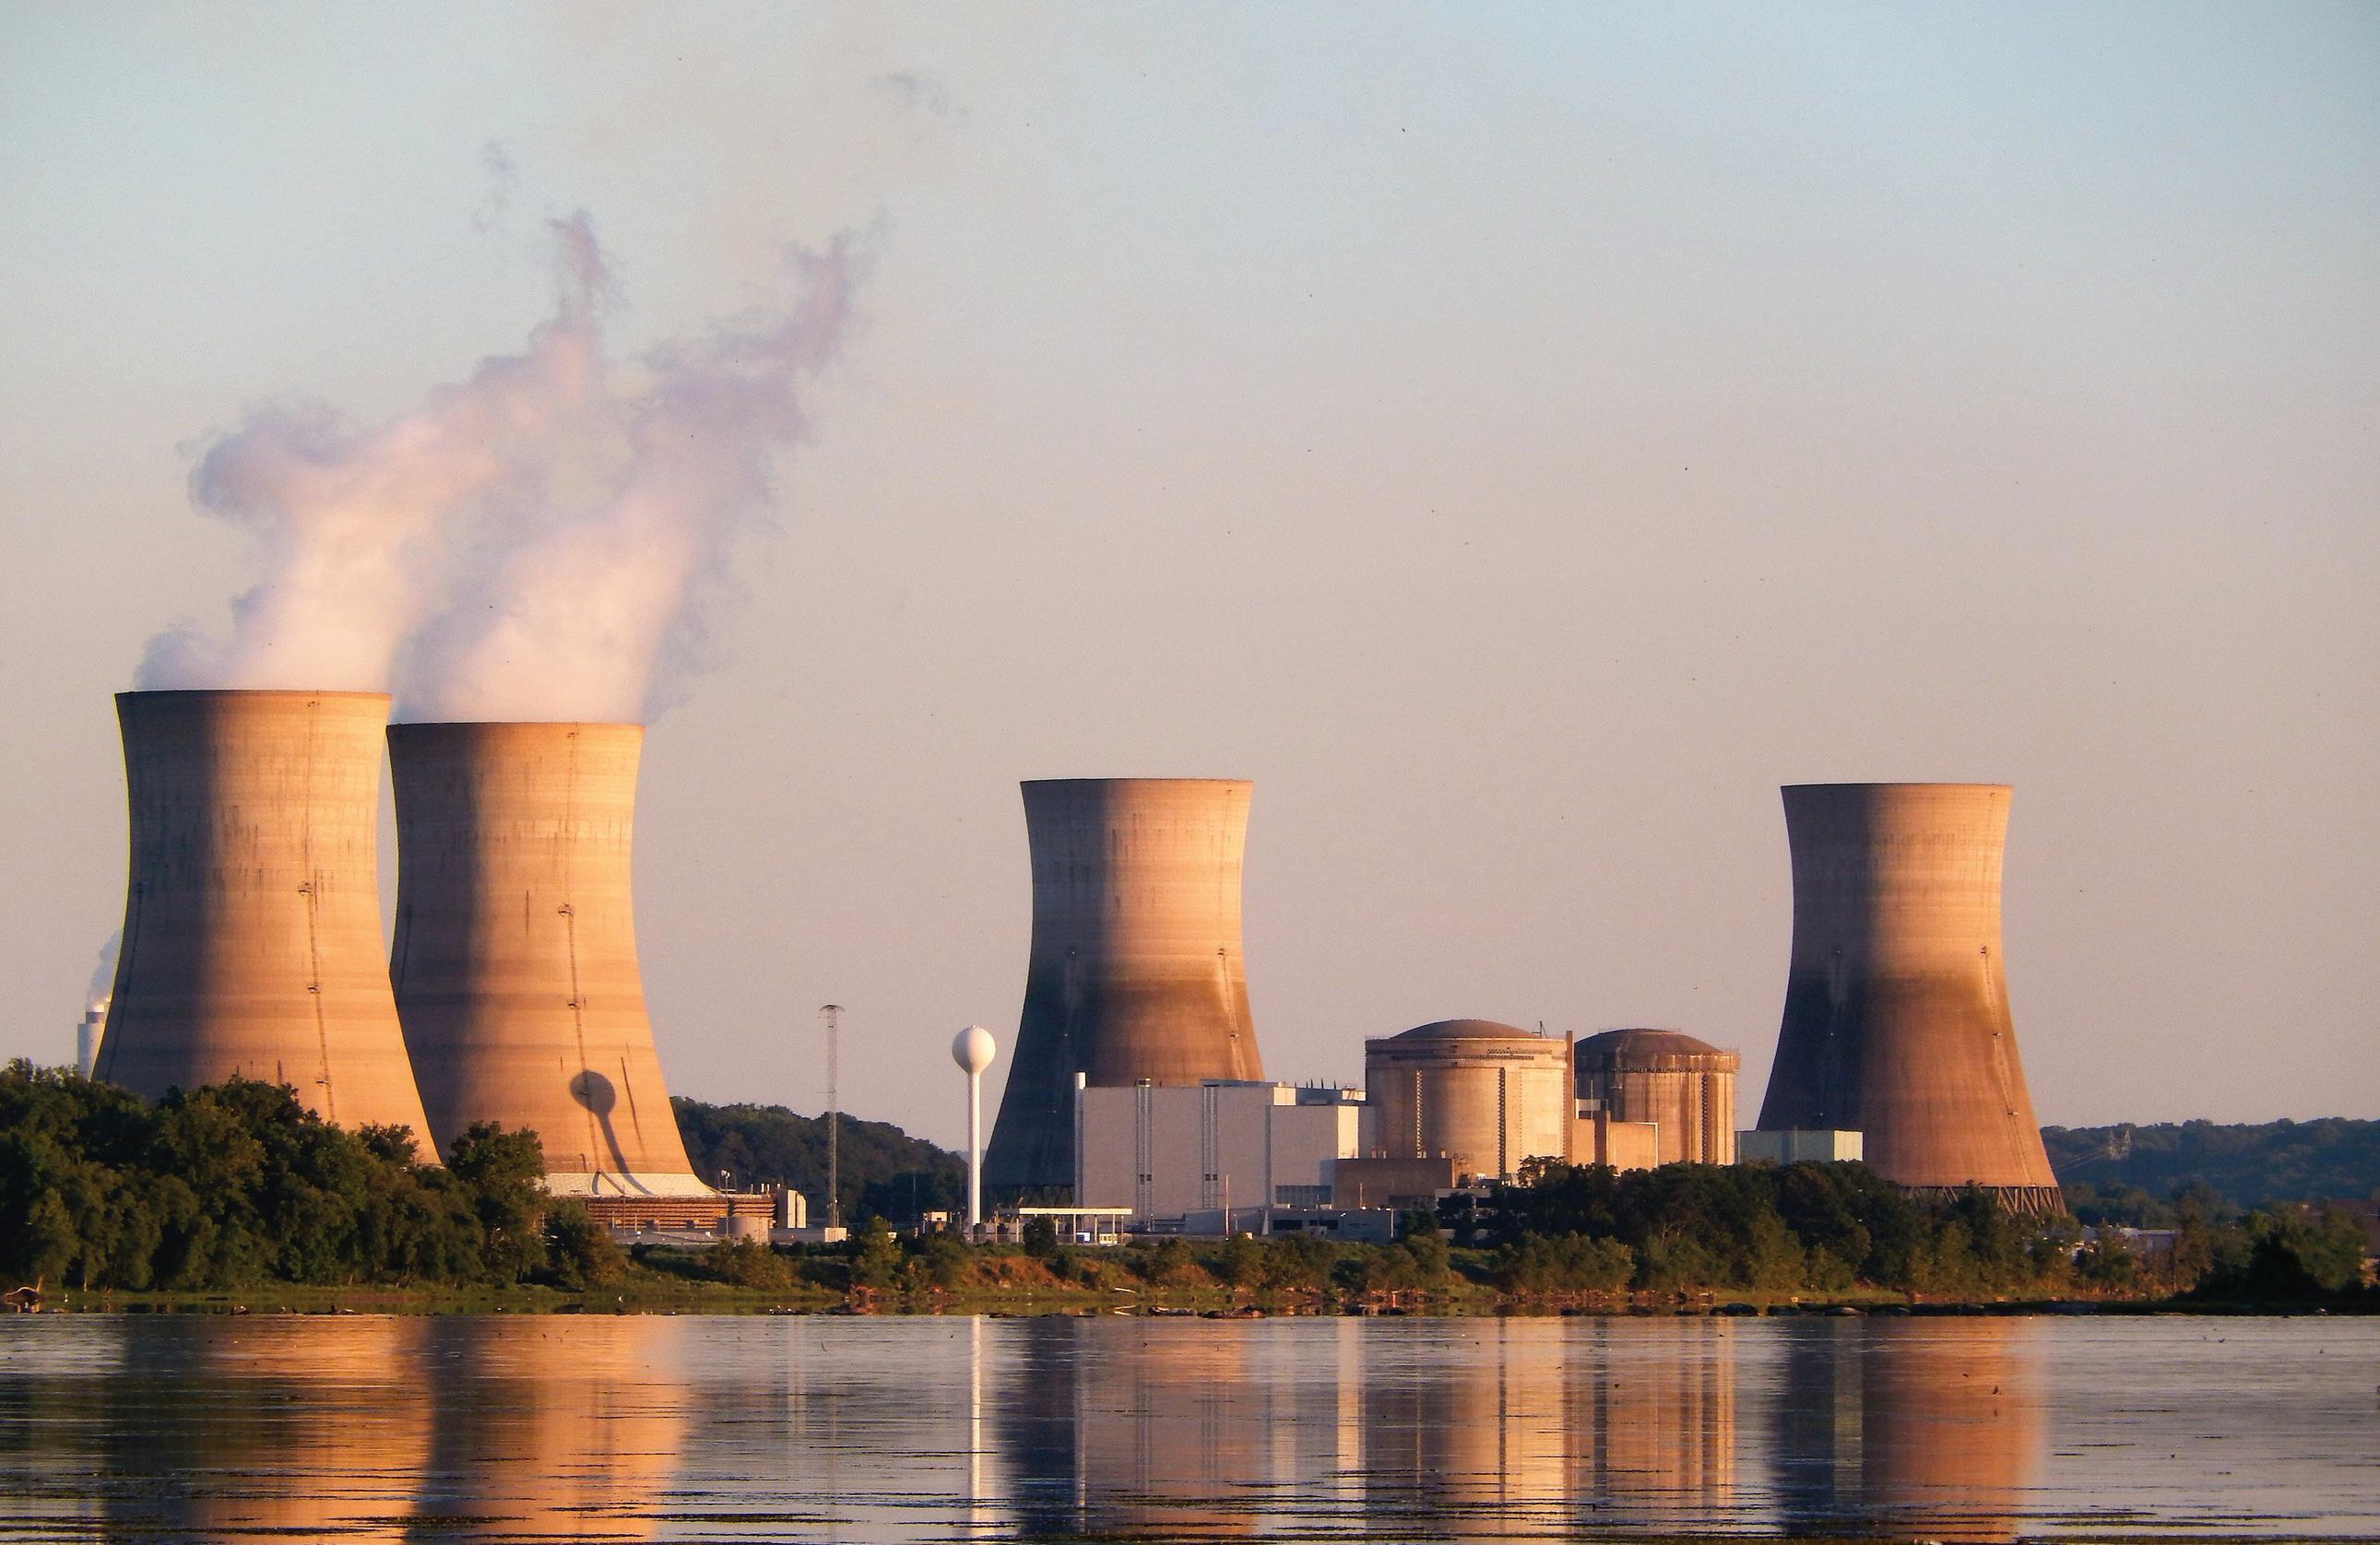
A view of Three Mile Island Nuclear Generating Station. The DOE offered a $1 billion loan to Constellation Energy Generation to restart the renamed Crane Clean Energy Center. ID 89413941 © Vicki Been | Dreamstime.com
The X-Energy project, planned with support from Dow Chemical and Amazon, began building its advanced nuclear fuel fabrication facility with Oak Ridge National Laboratory in Tennessee. The Rockville, Maryland-based reactor design company develops several reactor concepts, but wants to use the Xe-100 modular, pebble-bed reactor in planned
as fuel for fusion reactors derived from the utility’s CANDU reactors, which are an original reactor design developed in Canada.
Meanwhile, Amazon Web Services along with the Compute for Climate Fellowship supported the work of New Jersey-based nuclear fusion firm Thea Energy, which hope to commercialize a
Because it is a capital intensive way to make power as well as being regulated so strictly, nuclear power is even more concerned with energy policy than some other forms of generation. Just as one example, 11 states have restrictions in place on building new nuclear power plants, ranging from outright moratoriums, such as Min-
























construction, to requiring high level waste disposal or reprocessing, as California, Oregon and others do.
The past three US presidents have talked about increasing nuclear capacity, with Democrats hailing a net-zero emissions strategy and Republicans calling for a more energy independent country. President Donald Trump entered his second term specifically calling for the much-delayed Nuclear Renaissance, and his White House has issued a flurry of executive orders aimed at bolstering the nuclear sector. Broadly, his administration has favored relicensing existing reactors, streamlining reactor testing, revisiting nuclear regulations, exploring nuclear fuel recycling, boosting domestic fuel production and restoring the manufacturing base for nuclear power plants.
One of the main ways the federal government can directly support new nuclear construction is through the DOE’s Loan Guarantee Office (LPO). Applicants to the LPO have proposed projects including advanced nuclear reactors, micro reactors, nuclear fuel cycle, nuclear supply chain, nuclear uprates and upgrades, and SMRs.
Greg Beard, Senior Advisor to the LPO, said the office was created with nuclear power specifically in mind, adding that reinvigorating nuclear power in the US is the office’s top priority.
“[The LPO] is a powerful tool for deploying new nuclear and is open for business for reactors of all sizes. Following the passage of the One Big Beautiful Bill, LPO’s Title 17 has about $260 billion in loan authority and about $1 billion in credit subsidy; nuclear is eligible for those funds. As directed by the executive order ‘Reinvigorating the Nuclear Industrial Base,’ LPO is prioritizing getting 10 large reactors under construction by 2030,” Beard said.
Besides this executive order, there were others directing the Nuclear Regulatory Commission (NRC) to speed approvals of newly DOE-tested reactor designs, revising the DOE’s review process for reactor projects it oversees, deploying reactors at military bases, processing surplus plutonium for use in advanced nuclear fuel fabrication, participating in nuclear-related education programs and assessing the spent nuclear fuel management cycle.
The long-term goal is to add 300 GW of new nuclear capacity by 2050.
Its most recent success story is Plant Vogtle, which Beard said has saved Georgia ratepayers more than $3 billion in interest costs, as well as making the nuclear plant the largest generator of electricity in the US. However, this is just the beginning.
“LPO is currently providing an up to $1.52 billion loan to Palisades, the first restart of a nuclear reactor that had entered decommissioning status. Once complete, the plant will generate 800 MW of affordable and reliable baseload power, helping to increase grid reliability in Michigan. As of September 16, $491,056,853 of loan funds have been disbursed,” he said.
Private investors have been loath to back nuclear power so far, but the LPO is able to fund up to 80% of eligible project costs. Beard said his office is the only lender with sufficient capital availability, expertise, patience and a mandate to reinvigorate the US nuclear industrial base.
Beard said Energy Secretary Chris Wright, whose pre-DOE work including serving on the board of California-based SMR designer Oklo, Inc., is a strong supporter of nuclear expansion. Wright’s initial secretarial order carried nine action points for DOE to bolster commercial nuclear power.
“The long-awaited American Nuclear Renaissance must launch during President Trump’s administration. As global energy demand continues to grow, America must lead the
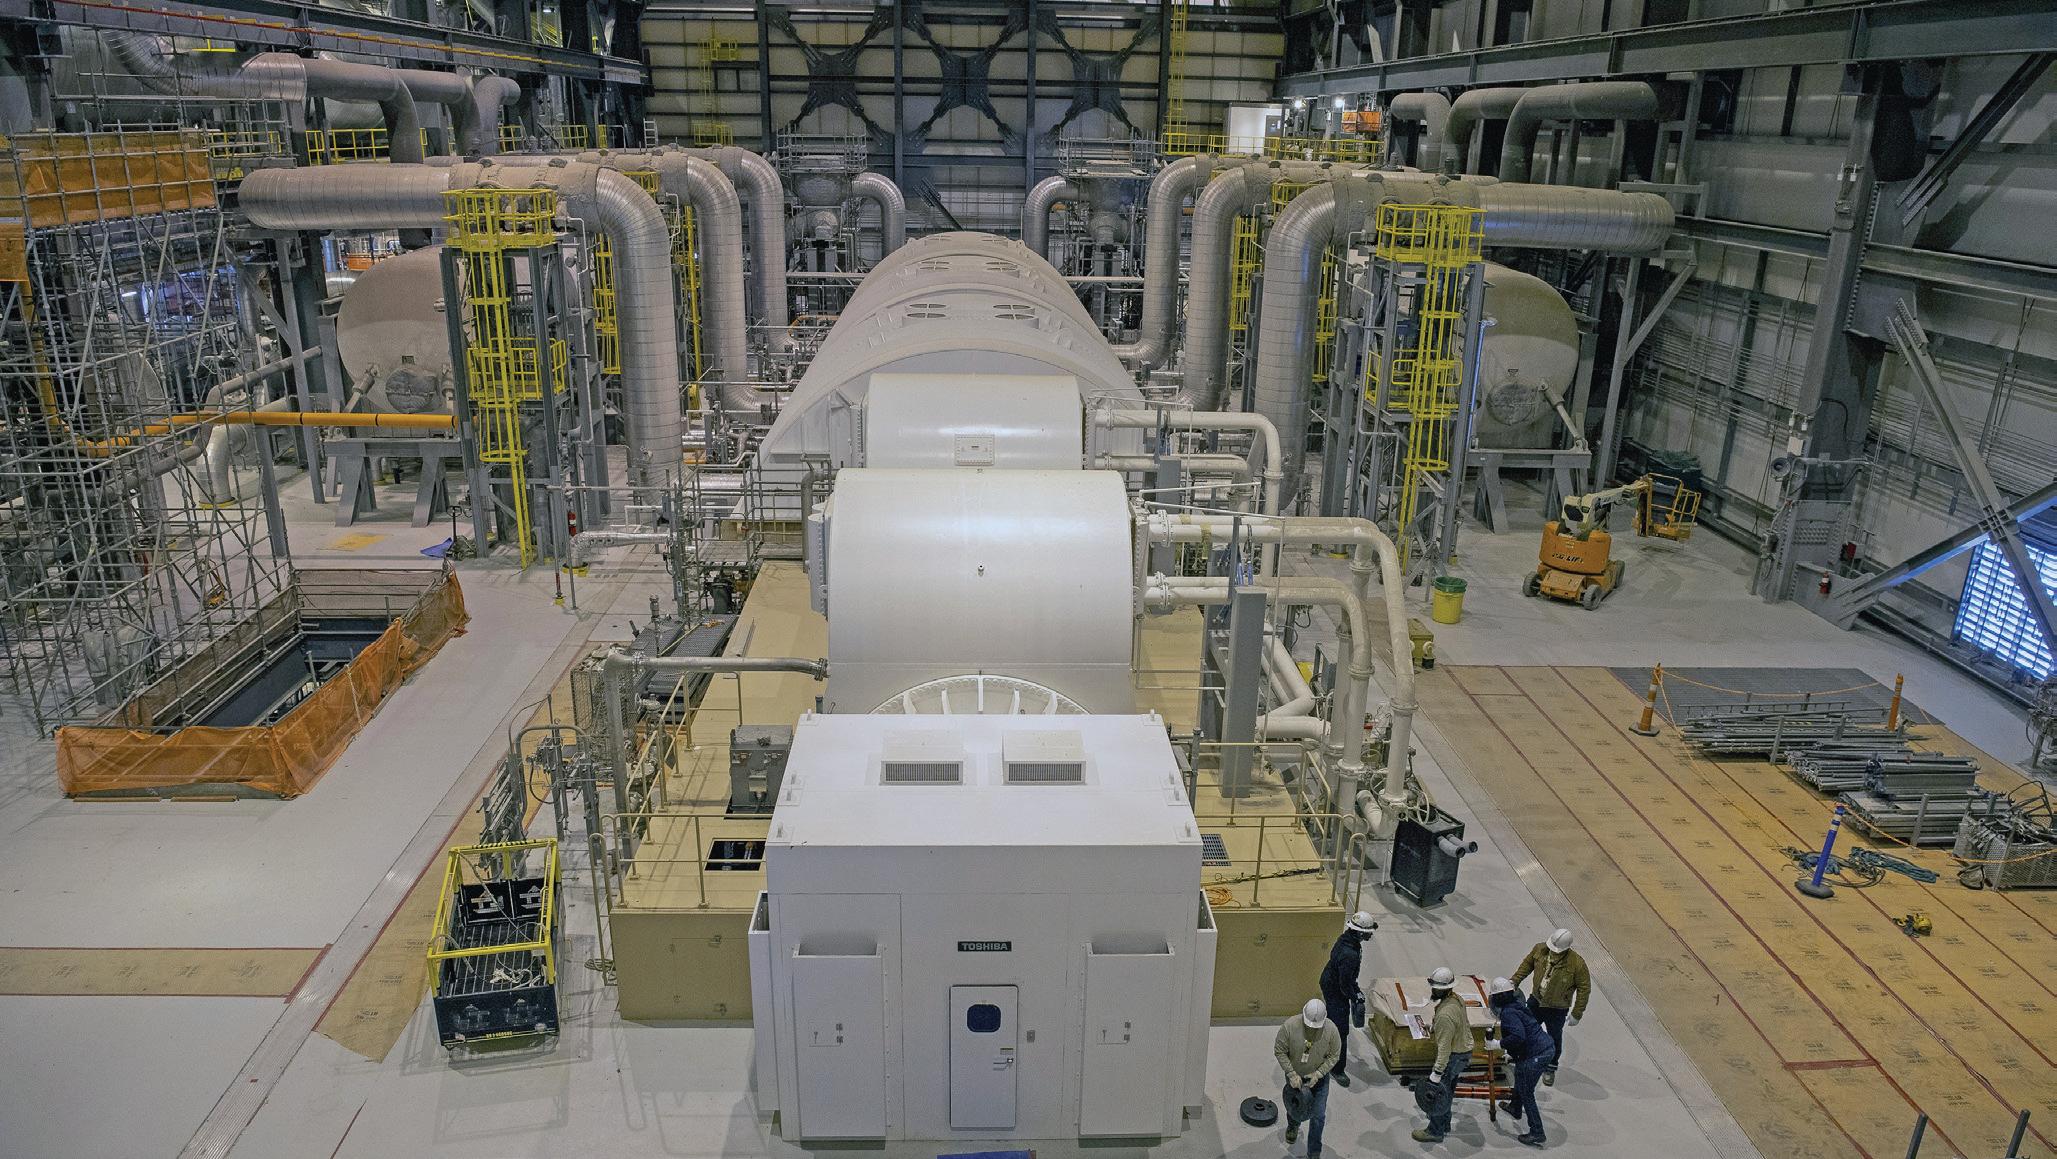
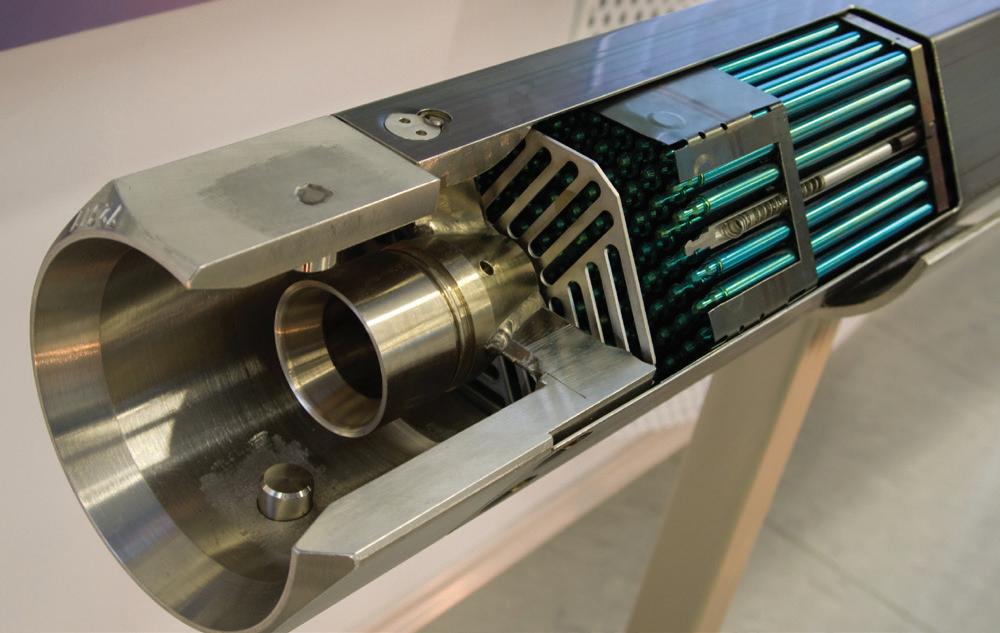
commercialization of affordable and abundant nuclear energy. As such, the Department will work diligently and creatively to enable the rapid deployment and export of next-generation nuclear technology, according to Wright’s order.
When asked about the barriers that exist today for nuclear power, Beard said cost and cost overruns are a common reservation for stakeholders.
“Cost overrun is not a monolith: costs are divisible for sharing among stakeholders who are able to manage project risks and who stand to benefit from project completion. Consortium arrangements and partnerships can reduce the financial exposure of any individual participant. If customers buy plants separately, then there is a disadvantage in being the first customer, so most potential customers express that they would ‘prefer to be fifth’ and take advantage of the lower cost,” Beard said. “However, no one can be fifth if no one leans in to be first, second, third and fourth. Consortium approaches allow customers to all be ‘one fifth’ of the orderbook versus ‘waiting to be fifth.’”
Nuclear energy can compete with other generation technologies on a cost-per-megawatt basis. This is evident, he said, from the wave of subsequent license renewals to keep reactors operating for 80 years, along with announced power uprates and restarts of reactors that had ceased operations.
“Nuclear provides a unique value proposition that is increasingly valued in a market that is pricing in an increasing need for 24/7 power amidst unprecedented demand growth,” he said, adding that large reactors provide economies of scale that drive a cheaper per-MW cost.
Repeating construction of the same or similar reactor designs will push costs down further, he said, adding that from Plant Vogtle Unit 3 to Unit 4, project partners saw around 20% in cost reductions.
“By coordinating across 10 large reactors of the same design, the United States has the opportunity to scale-up domestic manufacturing that would not be possible for one-off builds,” he said.
US publicly owned utility companies own and operate, or at least draw power from, many plants in the existing nuclear fleet. Scott Corwin, President and CEO of the American Public
Power Association (APPA), said the recent talk about a Nuclear Renaissance would be beneficial to utilities.
“There has been a lot of talk about new nuclear lately, and then support from the federal government as well. Public power is involved in several of the projects, so there is a lot of momentum in that respect for the potential for nuclear into the future and specifically among public power entities,” Corwin said.
He added that SMRs could play a role in helping keep the power grid balanced by providing predictable, baseload power.
“The designs are focused in part with that specifically in mind. The ability to ramp up and down with a little more flexibility and application. It is a bit more in the future still, but as you see some of these models start to become the standardized version and become replicated, the idea is you will be able to use them in a lot of applications, and also the cost will come down,” Corwin said.
To get started building the next generation of the US nuclear fleet, it will be crucial to build on what momentum already exists, Beard said. Reactor designs like the AP1000 now have fully completed designs and experienced supply chains (and a trained workforce).
“If we wait too long to move forward on our next project, this supply chain infrastructure may diminish,” Beard said. “The best way to build the workforce is to build projects. As with the supply chain, it is key to sign contracts for projects now so that the experienced workers from Vogtle (and Palisades) do not disperse back into other industries.”
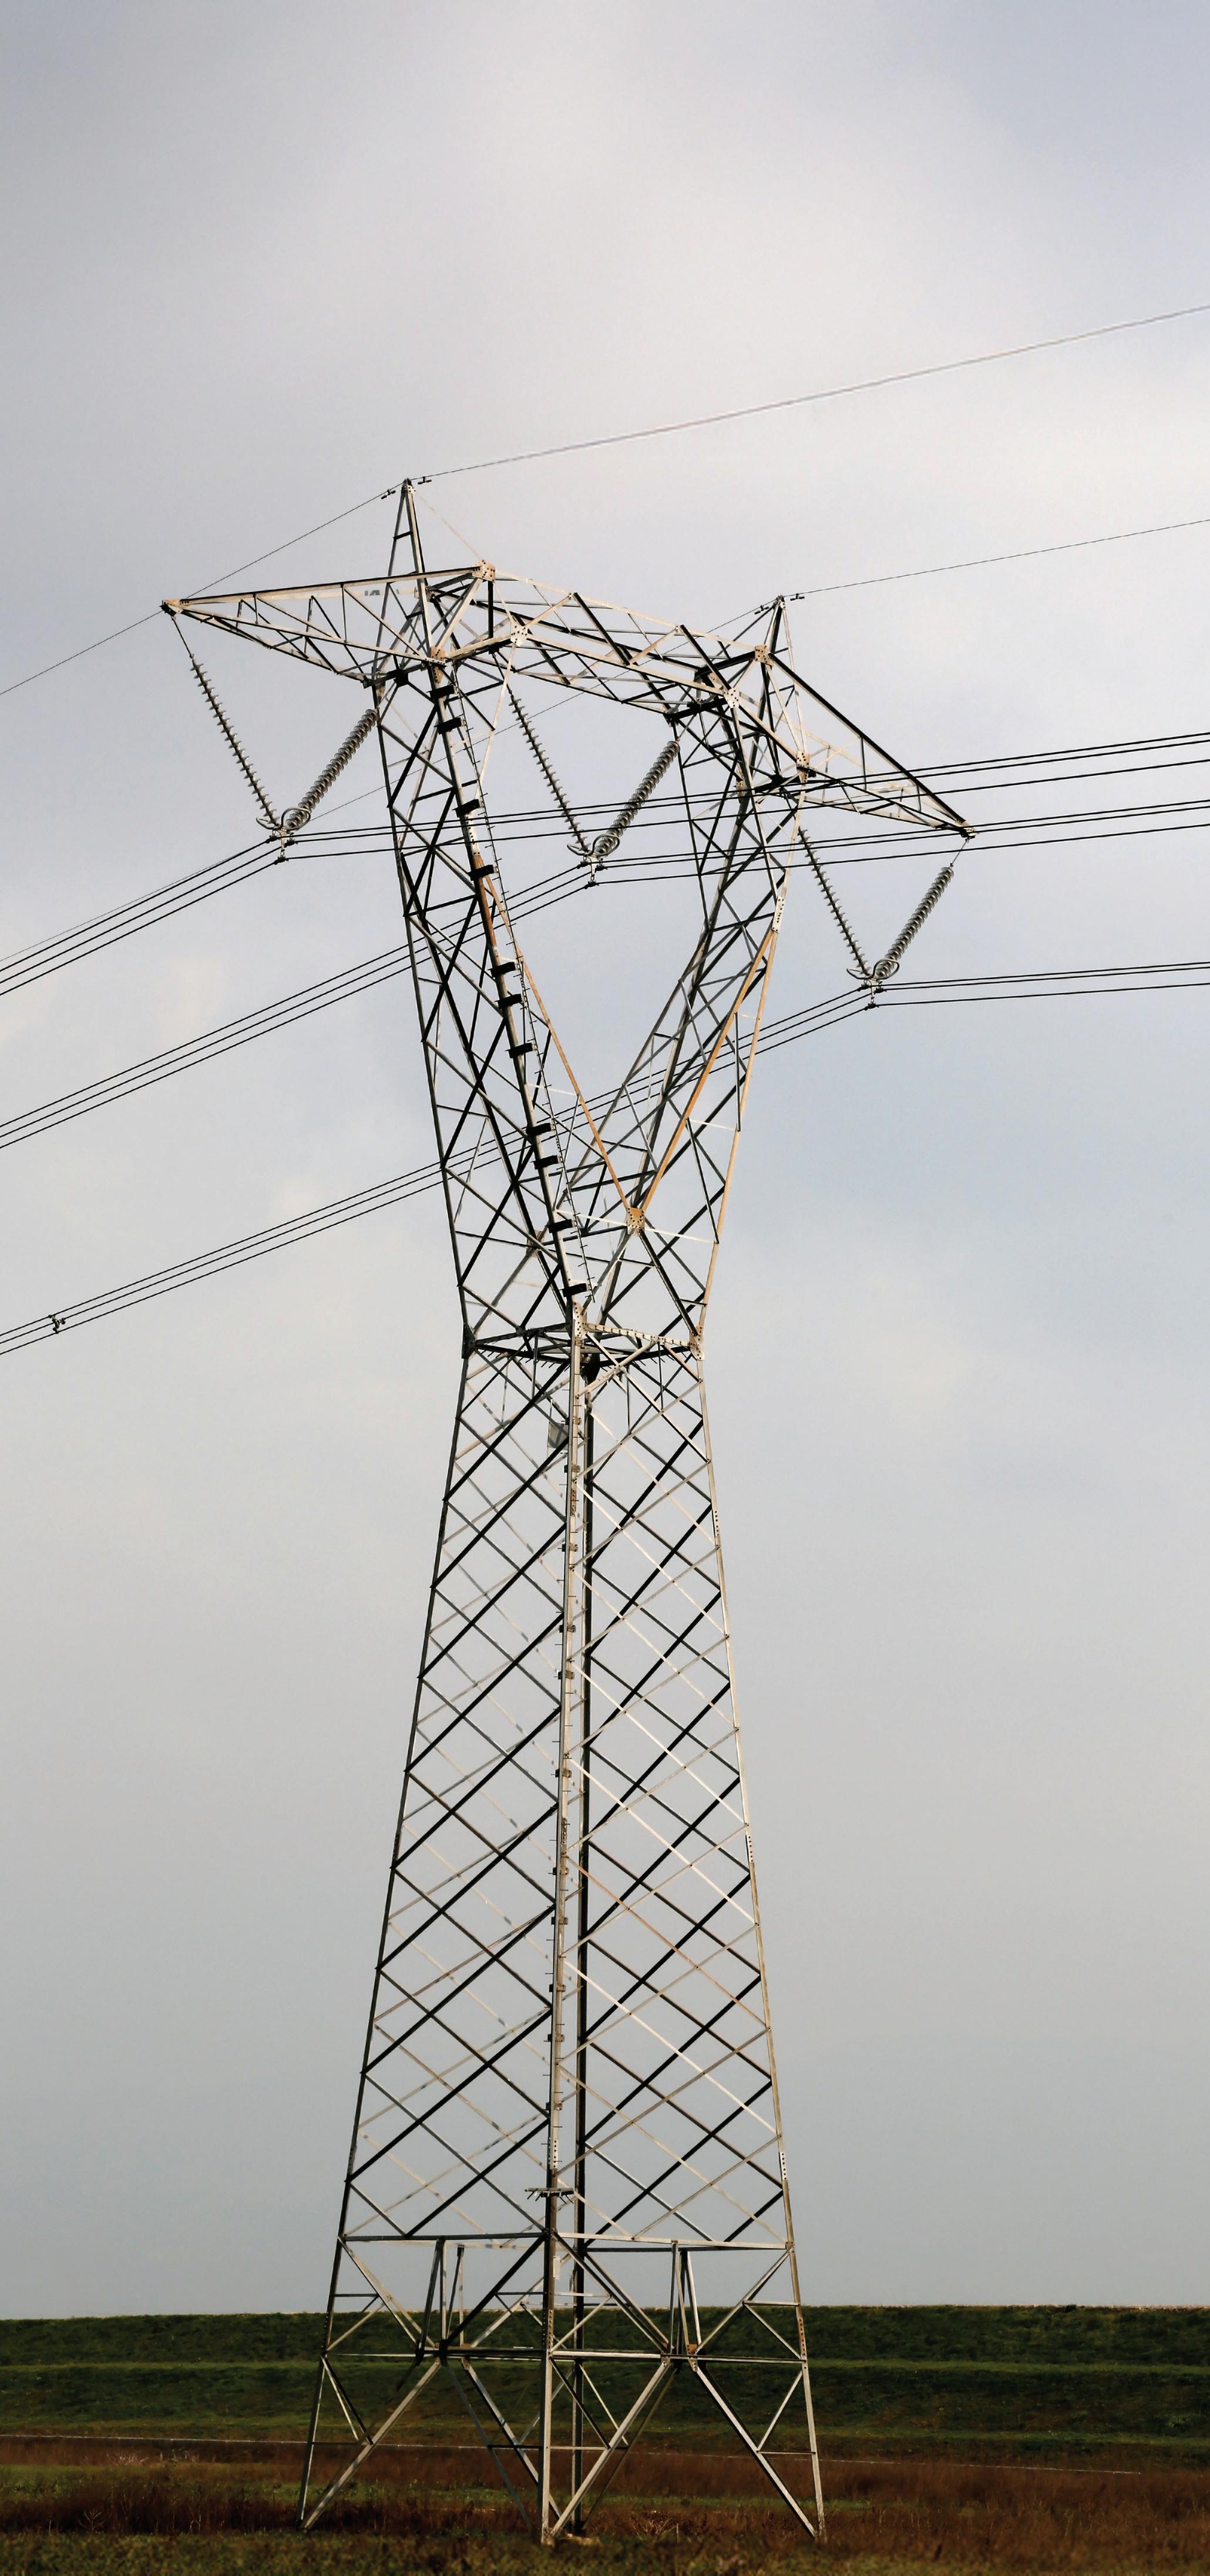
Part one of this two-part series explores eight electrical studies for extra-high-voltage transmission line design, with considerations for 765 kV.
By JON T. LEMAN, Power Electromagnetics Consulting PLLC, and ROBERT G. OLSEN, Washington State University
Arising need for high-voltage transmission in North America has led to plans for additional 345-kV and 500-kV ac lines as well as significant expansion of the 765-kV transmission network. Designing transmission lines requires significant collaboration between civil, structural and electrical engineering teams. However, electrical aspects of design tend to be overlooked more often than other aspects of design.
The high cost and custom nature of most transmission projects at 345 kV and higher — particularly 765 kV — warrant careful attention to electrical aspects of design by way of electrical studies. Even projects with voltages lower than 345 kV would benefit from more intentional and early consideration of these studies, even if only to justify and document which studies are not needed.
This article lists key transmission line electrical studies that should be considered. Each of the study descriptions provides a brief executive summary and includes one or more of the following:
1. 765-kV considerations related to the study.

2. A list of transmission line design activities or components linked to the respective study. This includes civil/structural design activities, line maintenance or related electrical studies.

3. Suggestions regarding tools or methods that can be used for the study, with a focus on sharing unique or lesser-known tools or methods. More important than the specific tool used is the need to understand the fundamental principles and to have the experience and ability to check the reasonableness of results obtained from any tool used.

4. Resources and standards where more information can be found about the study. The focus of these references is on practicality and applicability rather than
being a list of generally related peer-reviewed literature. 5. SPECIAL CONSIDERATIONS on concepts or practices that are not well known, are often misunderstood, or require more care and planning.
Part one of this two-part series explores the following studies: transmission line constants, electrical loss analysis, thermal capacity, short-circuit and protection, insulation coordination, overhead shield wire lightning withstand, minimum approach distance calculations, and expected unbalance and mitigation.
This study establishes the circuit parameters of the line, including series resistance, series inductance and shunt capacitance. These calculations are updated at various times as the design advances and are used in other electrical studies such as loss analysis, transient studies and short-circuit studies. A final line constants calculation is performed at the end of the project for record purposes, including for use in planning models managed by regional coordinating authorities.
Calculation of line constants for 765-kV transmission is the same as for any other voltage level.
Line constants are linked with conductor selection, loss analysis, transient studies (insulation coordination), shortcircuit analysis, and transmission planning model records. The level of detail required for calculation of transmission line constants depends on the length of the line and the type of study for which the results will be used. Lumped series inductance and resistance with shunt capacitance (pi model) may be adequate for modeling short- or medium-length lines. More detailed distributed parameter models may be necessary for longer lines or situations in which it becomes important to resolve wave propagation. Line constants models used for transient studies may need to be frequency dependent (such as the JMarti model) or be initialized at a dominant frequency of interest (such as the Bergeron model) to properly represent conductor resistance properties. For example, the dominant frequency range for switching transients is typically between 2000 Hz and 5000 Hz. A new method that has begun to be incorporated into many transient programs is called the Method of Moments Surface Operator (MoM-SO). This method is considered more accurate over a wide range of line configurations, without a significant increase in computation burden, than traditional line constants methods. This method is particularly beneficial when dealing with conductors that are close together or surrounded by partially conductive media (such as underground cable installations).
This is an economic study that compares the up-front material and construction costs to the long-term cost of electrical losses. Most losses are in the form of heating caused by conductor resistance and load current (I ² R losses), but in some cases (for example, high voltage or high altitude), corona losses can be significant. Also, in some cases, resistive losses due to induced current circulating in shield wires can be important. Sometimes loss analysis might consider cost of lost transfer capacity if the
conductor size would constrain line capacity to levels below that which the system could otherwise accommodate. Economic studies frequently show it is favorable to spend more on initial material costs (that is, larger conductors with lower resistance) to reduce the long-term cost of losses.
Transmitting energy at higher voltages helps to reduce series losses. However, corona losses can increase with voltage, so care must be taken with conductor selection. The larger clearances around 765-kV phase conductors tend to reduce circulating currents and corresponding losses in grounded shield wire systems.
Loss analysis is linked to conductor selection, to shield wire configuration (continuous vs. segmented/insulated systems), thermal rating (that is. ampacity) studies and economic studies. Electrical loss analysis methods should account for series (I2R) losses in the conductors and shield wires, corona losses and losses due to earth resistivity. The associated phase and earth resistances typically are generated through line constants calculations. Corona losses can be calculated using formulas developed by the Bonneville Power Administration (BPA). Similar equations were developed by EPRI. Corona losses are different in dry weather and wet weather. Consequently, a detailed approach to electrical losses might include an estimate of the percentage of time the line is exposed to dry and wet weather.
The thermal limit (that is, ampacity) of a transmission line is the maximum current that can be supported before one of two constraints are reached: sag limits or conductor damage. Thermal studies determine the maximum operating temperature based on heating from series losses and solar radiation as well as cooling given conductor thermal emission properties and ambient conditions such as temperature and wind.
Civil engineers then use these temperatures as inputs for conductor sag and clearance calculations (including ground clearance), and to ensure temperatures will not be high enough to reduce conductor strength through annealing. Some projects use high-temperature conditions to establish an overall thermal rating. Other projects use dynamic line rating (DLR) that involves near-real-time calculation of thermal limits based on actual load and ambient conditions to maximize thermal rating at any given time. It is common for lines to have a steady-state thermal limit and one or more emergency ratings, higher than the steady-state limit, but which can only be maintained for a few hours.
It is important to note that overall transfer capacity of a line also can be constrained by system limits, which may be more restrictive than thermal limits. Shorter lines — for example, roughly less than 200 miles (322 km) — tend to be thermally limited while long lines — roughly greater than 400 miles (644 km) — will generally be stability limited due to line impedance characteristics and system control dynamics. In some cases, the capacity of transmission lines with long or medium length will be limited by voltage regulation. Voltage regulation or system stability constraints will be established in the aforementioned planning studies but should be compared to ampacity results from thermal studies to establish the overall picture of transmission line capacity.
Calculation of thermal ratings for 765 kV transmission is the same as for any other voltage level.
Thermal capacity analysis is linked to conductor selection, sag and tensions calculations, clearances, structure height, and insulator hardware.
References include IEEE Standard for Calculating the Current-Temperature Relationship of Bare Overhead Conductors in IEEE Std 738-2023 and IEC Technical Report 61597 Overhead Electrical Conductors — Calculation methods for stranded bare conductors.
Short-circuit studies inform conductor and shield wire specifications. They also are an important prerequisite of protective relaying studies. By the time a transmission line is ready to be energized for the first time, the protection scheme must be commissioned. Key aspects of these studies include:
1. Circuit breaker selection — The circuit breakers at transmission line terminals play a critical role in transmission line operation and protection. The speed of the circuit breaker contributes to the total fault clearing time, which is needed for calculations to verify conductor and shield wire short-circuit ratings. Circuit breaker trip-close characteristics also affect transmission line transient overvoltage severity. Some circuit breakers use close timing control or pre-insertion impedance techniques to reduce switching overvoltages. This information is needed for transmission line insulation coordination studies.
2. Short-circuit analysis and relay settings — Shortcircuit studies calculate the behavior of current during
electrical faults. This includes transient (asymmetrical) and steady-state (symmetrical) characteristics. The protective relaying scheme and settings determine the expected total fault clearing time, which is used to assess conductor short-term energy handling adequacy. Typical high-voltage transmission line protection schemes include fast communication-aided tripping and slower backup protection schemes. Total fault clearing time may need to include the contributions from failed reclose attempts. Reclose is often disabled for threephase faults and when workers are doing live-line work. Short-circuit current asymmetrical and symmetrical data also can influence conductor fault energy exposure for comparison to conductor damage curves. Of particular interest are the short-circuit heating effects on optical ground wires (OPGW) because the optical fibers can be damaged at lower temperatures (see special considerations on page 40). Insulator arcing horns in segmented shield wire systems should have gaps set to flashover during faulted conditions.
3. Single-pole trip and reclose — Extra-high-voltage and ultra-high-voltage transmission lines often make use of single pole tripping and reclosing to clear single line-toground faults. This helps system stability by maintaining a partial connection between substations via the two healthy phases and minimizing the number of customers affected by outages. However, electromagnetic coupling between the two healthy phases and the faulted phase can complicate fault clearing. Studies are performed to assess the severity of this coupling and to evaluate
Segmented shield wire systems are used to eliminate shield wire losses due to circulating currents from voltages induced by magnetic fields from the phase conductors. Such arrangements involve alternating grounded and insulated splices. Insulators
should have arcing horns with gaps sized to flashover during ground faults to avoid negatively affecting protection schemes. Arcing horn gaps should not flashover because of induced voltages during normal operation.
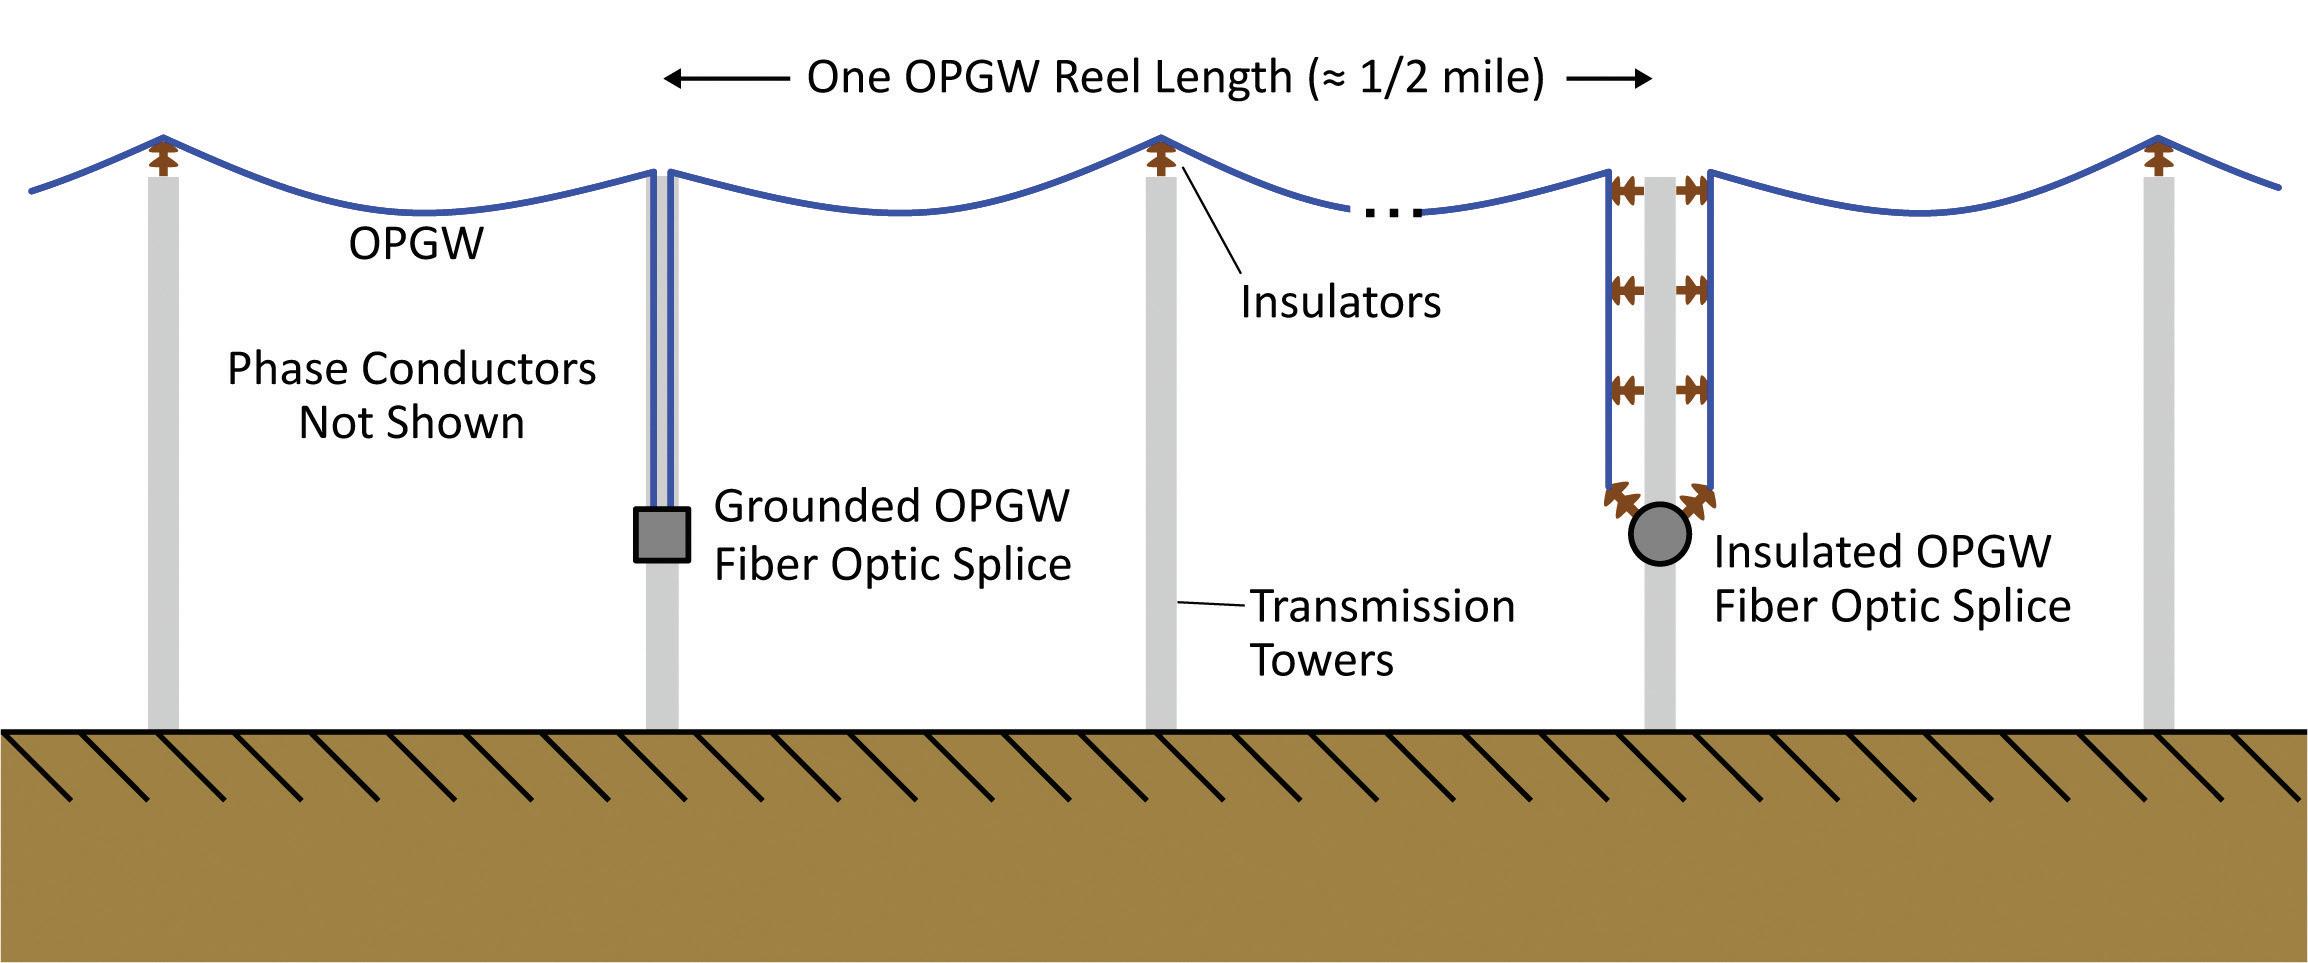
The thermal rating of OPGW is often constrained by optical fiber damage, which typically has a threshold of 210°C (410°F). To assist designers with thermal rating selection, manufacturers publish a corresponding kA-sec rating (I2t, current squared multiplied by time) for each OPGW product. Here, the current is a symmetrical fault current, and time is the total fault duration. Some mistakenly assume it is adequate to take the substation single line-to-ground fault current from short-circuit studies and multiply by the fault clearing time from protective relay studies. However, this simple approach can be inadequate.
The following considerations complicate the matter:
What fault current should be used? It seems to be common practice to use the substation single line-to-ground symmetrical fault currents, as these are readily available. On the one hand, this may oversize the OPGW beyond some distance from the substation since fault current decreases due to transmission line impedance. On the other hand, use of symmetrical fault currents neglects the effect of dc offset, which could make heating effects close to the substation even worse. Some projects use two sizes of OPGW. A larger one provides adequate fault current rating close to the substation, and a smaller one is used for the rest of the line. Studies can determine the distance at which the transition between the two sizes could occur.
Another consideration is whether there is a parallel path for fault current that reduces flow on any one OPGW. Engineers can calculate the fault current split between shield wires (there is often more than one) and also the earth via the tower and footing resistances. A severe situation that could occur is if one shield wire breaks, falls onto the phase conductors and causes a fault that forces all current back onto the remaining OPGW. The use of parallel paths can be an intentional mitigation strategy to reduce OPGW thermal ratings near substations.
Finally, OPGW has a useful asset life of about 40 years. It is important to consider whether fault currents will change during that time. If fault currents are expected to increase, then it is prudent to select a short circuit rating with some margin so the OPGW can accommodate that increase.
What clearing time should be used? Fast primary protection schemes can clear a fault in a matter of a few cycles. However, it is common to have one or more high-speed reclose attempts that can double or triple the thermal exposure if the fault fails to clear. Reclose delays are typically much shorter than conductor cooling time constants, so the thermal impact of multiple shots of fault current is effectively cumulative. Additionally, primary protection schemes sometimes fail. Backup protection schemes can result in fault durations of 20 cycles or more but would not typically allow a reclose attempt. Reviewing the protection scheme and listing the possible primary and backup scenarios can be a helpful
exercise when determining OPGW short-circuit ratings.
Direct-current (dc) offset. Faults tend to initiate near a voltage peak. Because of system inductance, it is common for the total asymmetrical fault current to include a dc component. This dc component (or offset) decays relatively quickly but can still contribute significant energy to a fault. Calculations can be completed to determine an effective symmetrical fault current value that has the same heating effect as the asymmetrical fault current.
All these factors can significantly impact the required thermal rating. It is up to the engineer to assess how critical the OPGW path is and how many of the factors should be combined in calculating a short-circuit thermal rating.
Consider the following example, which illustrates the kind of impact these factors can have. A protection scheme for a transmission line with a single OPGW has the following data:
• Present day symmetrical single line-to-ground fault current close to the substation: 25 kA
• Future fault current after predicted growth of 20% during asset life: 30 kA
• System X/R ratio: 8
• Primary fault current clearing time: 5 cycles
• Reclose attempts before lockout: 1
• Backup protection fault current clearing time: 20 cycles
• Fiber critical usage? Yes, serves as the path for communication aided tripping scheme.
The following table lists short-circuit thermal rating (kA 2-sec) results calculated for the aforementioned cases and considerations.
The wide range of results shows the importance of assessing project-specific conditions to determine well-reasoned criteria for OPGW short-circuit thermal rating. The 52.1-kA 2-sec result from the first row would be a common outcome from design studies, but it is clear from this typical example there are credible cases producing significantly higher fault energy exposure.
A free OPGW kA²-sec short-circuit rating calculator with additional information is available at: www.electricutilitytools.com/opgwscrating [online, accessed Oct. 31, 2025].
mitigation methods such as shunt reactors, grounding switches or adjusting reclose intervals.
The larger bundles of 765-kV transmission (usually driven by corona issues) are unlikely to experience fault current conditions that exceed conductor thermal ratings because of the number of parallel paths. Calculation of OPGW and overhead shield wire (OHSW) short-circuit withstand ratings is the same as for other transmission voltages.
Short-circuit and protection studies are linked to conductor selection, shield wire specification (particularly OPGW), arcing horn specification in segmented shield wire systems, switching transient studies, parallel circuit interactions (induced voltages in parallel facilities are worse during shortcircuit events), tower grounding, and tower step and touch potential calculations, where applicable. Short-circuit forces may need to be considered for certain designs involving atypical bundle spacer intervals or small phase-to-phase spacing.
The goal of insulation coordination studies is to select air gaps (clearances) and insulators that achieve the desired balance between reliability and structure costs. It also informs the specification of transmission line arresters and tower footing resistances. Three key elements of insulation coordination are: 1.) lightning withstand, 2.) switching overvoltage withstand, and 3.) power frequency withstand.
Switching transients and lightning are short duration events that can significantly increase the voltage for a short period of time, resulting in a higher risk of flashover. Lightning flashovers are classified as being caused by shielding failure (lightning bypasses any shield wires and directly strikes the phase conductors) or back-flashover (lightning strikes the shield wires or tower, raising their voltage enough to flashover to the phase conductors). Switching and lightning severity are the primary determinants of AC transmission insulator strike distance which is the shortest distance between energized and grounded metal parts of an air gap or insulator assembly, including corona rings.
Power frequency flashover is more of an issue with DC lines, but it can be an issue for AC lines as well. This type of flashover can occur when surface contaminants on insulators become moist from weather conditions such as fog or light rain (heavy rain tends to wash off the contamination). This produces a conductive film that results in the concentration of voltage across any dry bands on the insulator surface. Partial breakdown across these dry bands can progress along the length of the insulator until complete flashover occurs. This can all take place during normal (power frequency) operation. This is the primary determinant of insulator creepage distance. Silicone polymer or silicone coated insulators tend to perform better in higher contamination environments because of their ability to shed water and minimize formation of the conductive surface film.
Overall, the longer the insulators, the more likely the line is to withstand any of the above stressors. However, longer insulators result in larger, more expensive structures. Industry standards provide guidelines for acceptable levels of flashover
Transient studies are performed to develop a statistical distribution of the overvoltages due to switching operations of a transmission line. These studies often consider line energization, reclosing into trapped charge and fault clearing. Trapped charge reclosing tends to produce the highest transients. Fault clearing tends to produce the lowest switching transients unless series-compensated lines are involved. Models usually include the line being designed as well as interconnected lines of the same voltage out to at least one substation removed from the line terminal substations. This allows more accurate modeling of wave propagation and reflections that affect the transient overvoltage profile of the line being designed.
Actual system topology will influence the decision about what portion of the system to model. Engineers should assess the system and determine the actual extent of the system to model. The worst switching voltages tend to occur within two travel times (that is, the time it takes a voltage wave to travel the length of the line), which includes time for the reflected wave to return to the point of switching. Consequently, it is often unnecessary to use extensive models for such studies.
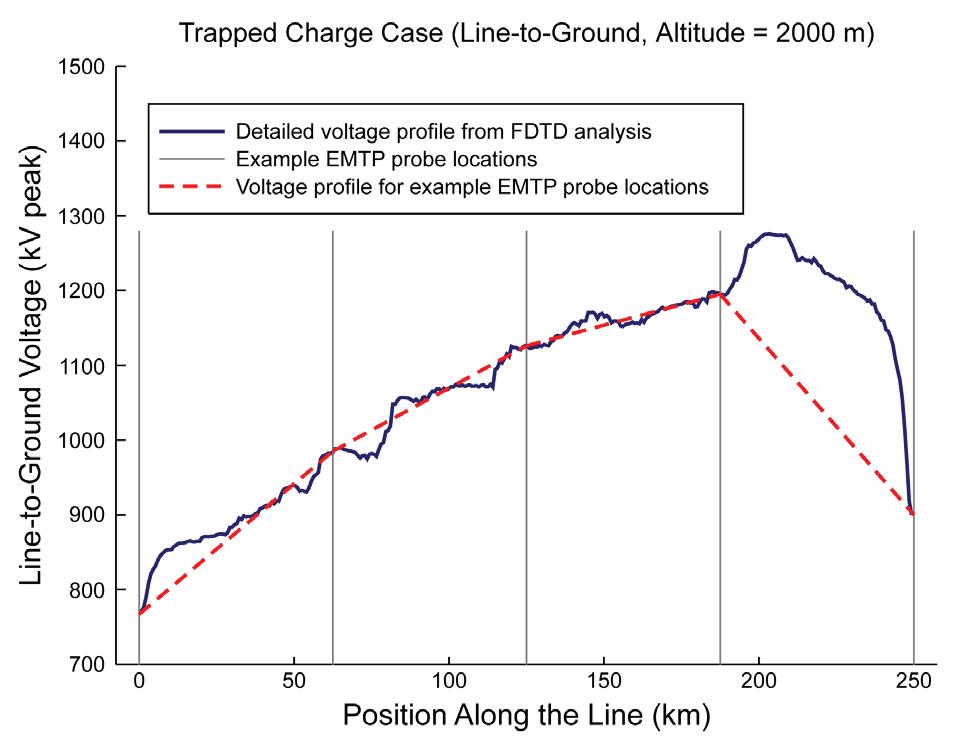
risk which give engineers opportunity to optimize reliability against structure costs. Insulation coordination studies for EHV and UHV lines typically involve more detailed statistical analysis rather than the simple deterministic approach common with lower voltage transmission lines. It is up to the design team to identify extremes together with their likelihood and then determine if the line will be designed to accommodate those extremes.
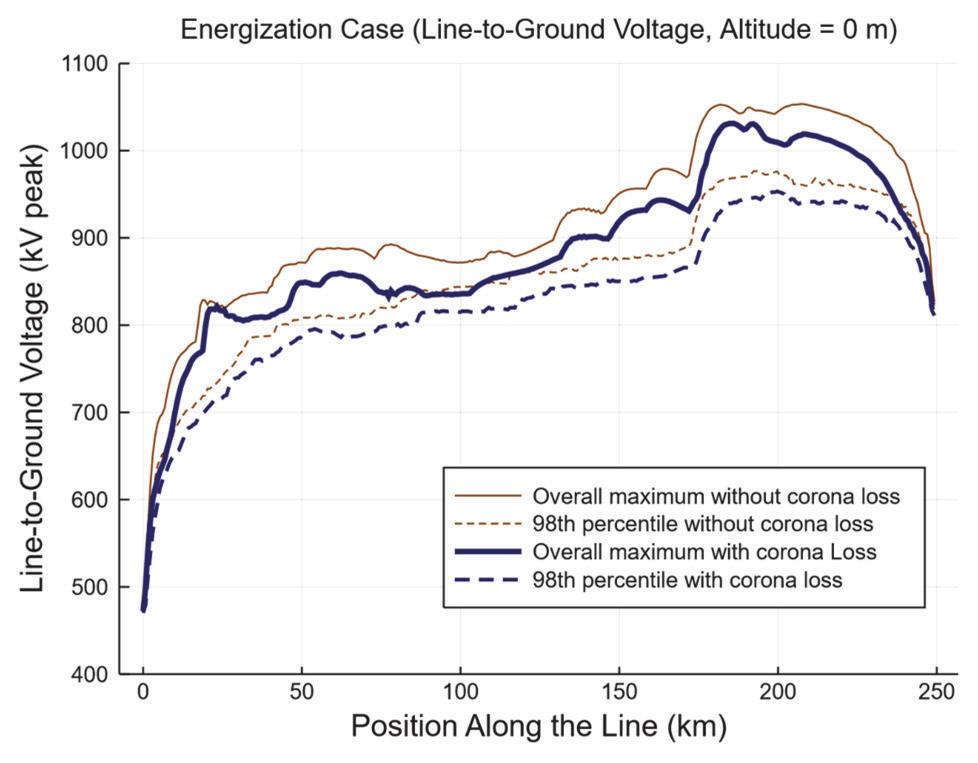
Fig. 2 Simulated result showing impact of corona losses on a transient overvoltage profile of a 500-kV transmission line. (Source: Leman, Jon T., and Robert G. Olsen. “Bulk FDTD Simulation of Distributed Corona Effects and Overvoltage Profiles for HSIL Transmission Line Design.” Energies, vol. 13, 2020, p. 2474.)
Large-scale models may require sacrificing time-step or spatial measurement resolution, which can lead to inadequate results.
A typical time-domain model includes selection of locations along the line where voltage data are recorded. It can be important to select enough locations to correctly capture the complexities of phase- and ground-mode wave propagation and reflection. It is common to select between 4 and 6 measurement locations, but this may be inadequate. Consider the example switching overvoltage profile of Fig. 1 for a 500 kV transmission line with line-end arresters. The solid line is from a detailed finite difference time domain (FDTD) model which exported data every ½ kilometer. The dashed line shows the results that would be obtained using 5 probe locations equally spaced along the line. As can be seen, the latter approach entirely misses the region of highest transient overvoltages. Extra care should be taken when selecting locations for simulation probes to be sure that important data is not missed.
Advanced switching overvoltage studies can take advantage of the distributed effects of corona losses, which tend to reduce the severity of the overvoltage profile. Including this effect can be important when trying to improve the accuracy of models for high-surge impedance lines that seek to maximize power transfer through unique bundle configurations and compact phase spacing (Fig. 2).
Despite the fact that taller structures tend to attract more lightning, the inherently longer insulators of 765 kV tend to make lightning flashover less of a design constraint than for lower voltage transmission lines. However, switching surge severity tends to increase with voltage class. Consequently, it is common to use controlled switching or pre-insertion resistors to limit transient severity in 765 kV transmission lines. Corona losses also help limit switching overvoltage severity, though
Switching transient and power frequency studies should consider the maximum operating voltage of the line, which can change with position along the line and with time due to daily or seasonal load and capacitive effects (informed by transmission planning studies). Line open-end cases (line energized, but open at one end) during seasonal light load conditions may produce the highest steady-state voltages, depending on the connected reactive compensation.
A key part of high-voltage insulation design is the determination of the critical flashover voltage (CFO) for lightning and switching transients. These are the voltages at which there is a 50% chance of flashover. Calculation of the switching surge CFO tends to be more complex than that of lightning. Determining the switching surge CFO is especially important for new stability limited lines designed to have high surge impedance loading.
Often these designs use larger, nonregular conductor bundles and compact phase spacing. This is a problem since empirical formulas developed for determining critical flashover are based on regular bundles and more traditional designs. Consequently, it may be necessary to either calculate critical flashover using more detailed methods (see “On Calculating the Phase-to-Phase CFO of Overhead Transmission Lines Based on the Spatial Minimum Electric Field” by Jon T. Leman and Robert G. Olsen, published in October 2022 in IEEE Transactions on Power Deliver, vol. 37, no. 5, pp. 3698-3708) and perform critical flashover tests in a highvoltage laboratory. Most of the time, line design only needs to consider phase-to-ground CFO values. However, compact designs may require calculation of the phase-to-phase CFO in order to analyze phase-to-phase flashover risk.
Another important issue with the newer high-surge impedance loading designs is that power capacity (for stability limited lines) and critical flashover are inversely related. In other words, design changes that increase power capacity tend to reduce CFO, which can impact reliability.
historically these have not usually been accounted for in transient overvoltage studies.
Activities and studies linked to insulation coordination include tower top geometry specification (including tower height, shielding angle, phase-to-phase, and phase-to-tower clearances), OSHA minimum approach distance (MAD) clearances, insulator strike distance, insulator creepage distance, insulator type selection, tower grounding (i.e. footing resistance), determining the need for and specification of line-connected arresters (including optimal placement), and development of transmission line switching orders.
Right-of-way procurement challenges occasionally result in routing proposed high-voltage transmission lines in the existing right-of-way of lower-voltage transmission or distribution lines. One solution for joint routing is to move the existing line onto the new transmission structures as underbuild. The typical performance criteria for such an arrangement require that the reliability of the existing circuit be unaffected. However, the tendency is to install the underbuild using insulators with the same rating as those previous. This can be a problem as there are now new exposures to be considered, such as the following:
1. The taller towers will attract more lightning, possibly increasing the risk of back-flashovers on the underbuilt line.
2. Short circuits and switching transients on the high voltage induce voltage on the underbuilt line through electromagnetic coupling.
Increased insulation and arresters may be necessary to mitigate increased flashover risk from these exposures.
References include the IEEE Guide for the Application of Insulation Coordination in Std 1313.2-1999, IEC 60071 Series Insulation Co-ordination — All Parts and “Insulation Coordination for Power Systems” by A.R. Hileman.
Lightning strikes can damage and break the outer strands of overhead shield wires. Studies examine the nature of lightning in the region of a transmission project to estimate an appropriate Coulomb rating, which affects strand survivability under various levels of lightning severity.
Of particular concern are lightning strikes with long continuing current, which is a lower magnitude (a few hundred amps)
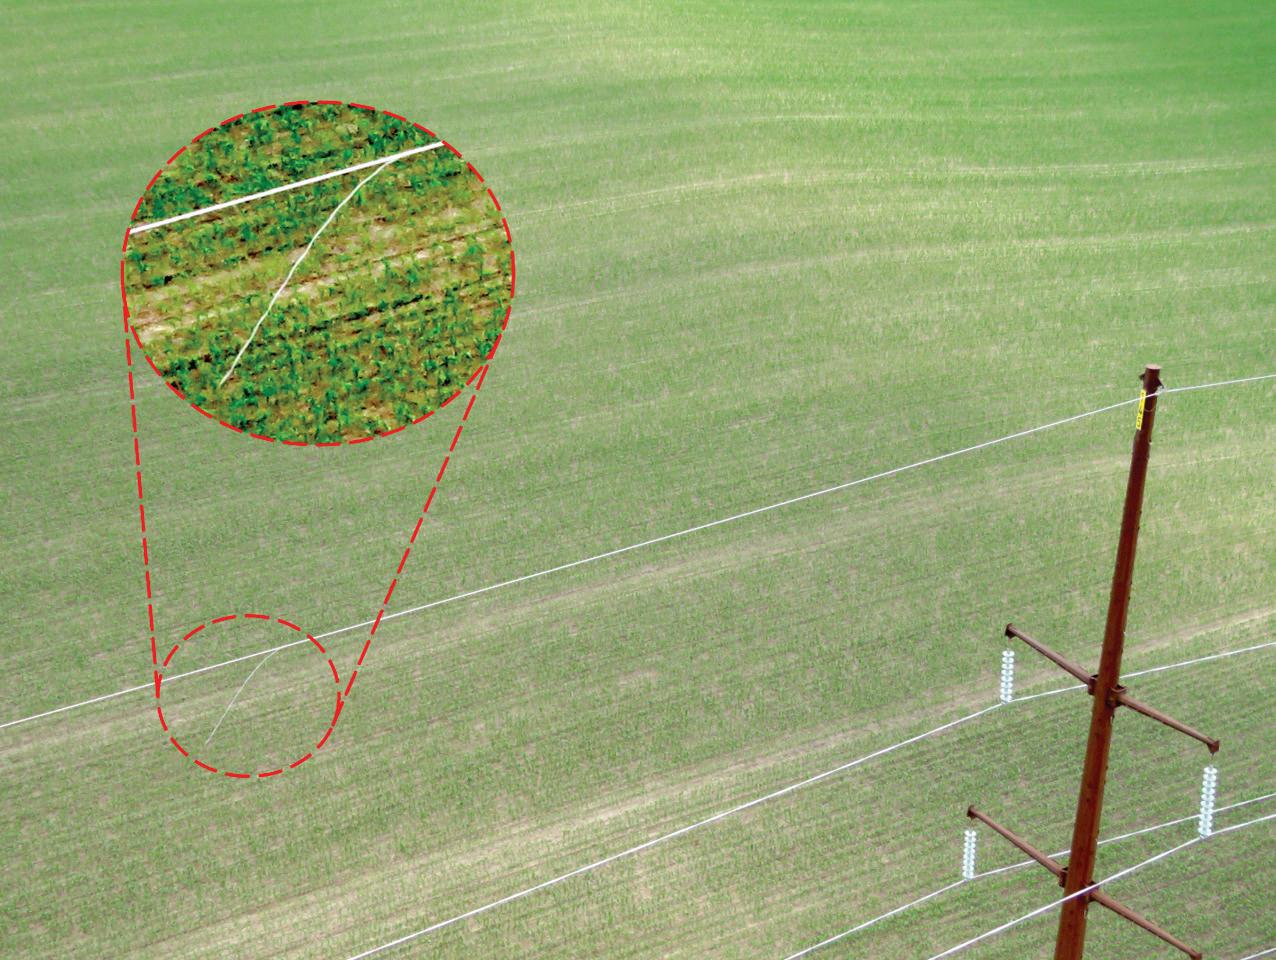
but longer duration portion of a lightning strike that flows in the ionized air channel following the initial high magnitude impulse (several thousand amps). Continuing current tends to contribute more to strand heating and damage than the initial impulse. Regions with higher probability of positive polarity lightning tend to have greater continuing current exposure. This includes higher altitude regions and areas in the Midwest U.S.
In some regions, lightning severity is low enough that shield wires may not be needed for lightning protection. However, having no shield wires could impact communications, ground fault current distribution, substation ground grid design (particularly for substations with high fault currents) and protection system designs. These should be evaluated before choosing to eliminate shield wires based solely on lightning.
Taller structures tend to attract more lightning (including positive polarity lightning). Consequently, studies may show that a higher OPGW Coulomb rating is recommended for 765-kV transmission lines than shorter structures for lowervoltage classes in the same region.
Related design activities include shield wire specification.
The minimum approach distance (MAD) study establishes minimum worker approach distances dictated by the Occupational Safety and Health Administration (OSHA). They are based on expected transient overvoltage levels, which could increase risk of flashover during live-line maintenance. Studies can use default overvoltage values specified by OSHA, or they can be calculated using an engineering study. The default OSHA values tend to result in longer insulators, but not always. Consequently, it is generally recommended to complete engineering studies to better optimize the design and characterize live-line risks as part of a utility’s worker safety program.
The approach for calculating the minimum approach distance for 765-kV transmission lines is the same as other voltage classes, though the higher voltage will result in larger approach distances. The OSHA assumed maximum transient overvoltage is 2.5 per unit. Pre-insertion resistors or controlled close timing often result in smaller overvoltages than this, so performing an engineering study to calculate transient overvoltage is usually worth it.
Related design activities include selection of phase spacing, design of tower climbing and working space, and transient overvoltage studies.
An OSHA minimum approach distance calculator is available at: www.osha.gov/power-generation/rulemaking/ madcalculator.
References include U.S. OSHA 29 CFR 1910.269 Electric power generation, transmission, and distribution; U.S. OSHA 29 CFR Part 1926, Subpart V, Electric Power Transmission and Distribution; and IEEE Guide for Maintenance Methods on Energized Power Lines, in IEEE Std 516-2021.

Geometric asymmetry can produce asymmetry in transmission line electrical parameters, particularly capacitance and inductance. If imbalance is excessive, it can have harmful impacts such as increased electromagnetic coupling with external facilities (pipelines, railroads, communication circuits), added stress to rotating machinery, and possible impacts on protective relaying sensitivity and selectivity. A typical method for limiting imbalance is to include periodic transposition structures, so that phases alternate positions along the length of the line. Electrical studies establish the need for and recommended locations of transpositions.
There is no difference in how unbalance studies are approached for 765-kV transmission vs. other voltage classes. Related design activities include determining the number and locations of transposition structures to limit imbalance.
Foundational electrical studies like these can enable utilities to be more thorough in project planning, developing proposal requests and reviewing proposal responses when designing transmission lines. Ultimately, this will lead to improved line reliability and design consistency.
The second part of this two-part series will explore studies on electric and magnetic field (EMF) calculations and surveys, corona effects (audible noise, radio noise), hardware corona testing, ac interference with adjacent facilities, induced current
studies (NESC 5-mA rule or microshocks), NESC electrical clearances, communications interference, touch and step potential analysis, delayed zero crossing and parallel line resonance.
JON T. LEMAN (jtl@poweremf.com) is an electrical engineer with over 20 years of experience in AC and DC overhead and underground transmission line design studies. He is currently the owner and principal engineer of Power Electromagnetics Consulting, PLLC and a partner at Electric Utility Design Tools, LLC, a provider of transmission line design software. Dr. Leman’s Ph.D. research at Washington State University involved application of electromagnetics to optimize high-voltage overhead transmission line design. He is a member of CIGRE and a senior member of IEEE.
ROBERT G. OLSEN (bgolsen@wsu.edu) received the B.S.E.E. degree from Rutgers University, New Brunswick, NJ, USA, in 1968, and the M.S. and Ph.D. degrees from the University of Colorado, Boulder, CO, USA, in 1970 and 1974, respectively. Since 1973, he has been with Washington State University, Pullman, WA, USA. Other positions include Senior Scientist with Westinghouse Georesearch Laboratory, NSF Faculty Fellow with GTE Laboratories, and Visiting Scientist with ABB Corporate Research and EPRI. His research interest is application of electromagnetic theory to high-voltage transmission systems. He has nearly 100 publications in refereed journals. He is one of the authors of the AC Transmission Line Reference Book — 200 kV and Above (EPRI, 2005). Dr. Olsen is an Honorary Life Member of the IEEE Electromagnetic Compatibility (EMC) Society. He is also past USNC representative to CIGRE Study Committee 36 (EMC) and Past Chair of the IEEE Power Engineering Society AC Fields and Corona Effects Working Groups. In addition, he is also the Past Associate Editor for the IEEE Transactions on Electromagnetic Compatibility and Radio Science
OUR WUNPEECE TRANSMISSION SPACERS REDEFINE THE INDUSTRY STANDARD FOR UNDERGROUND POWER TRANSMISSION INSTALLATIONS. WITH PRECISION ENGINEERING AND UNMATCHED QUALITY,
The Midwest Energy journeyman lineworker became the PLP Armor Rod Install Challenge champion at the 2025 International Lineman’s Expo.
Keaton Augustine, journeyman lineman for Midwest Energy, installed a set of armor rods and a distribution tie in 33.50 seconds in the final round of the PLP Armor Rod Install Challenge at the 2025 International Lineman’s Expo. Visit linemenworld on Instagram to watch the video of him competing in the challenge.
• Born in Hays, Kansas, and has one little sister.
• Married to his wife, Kenzie, and they have three kids: Ry, 7; Brecken, 2 and Kampton, seven months.
• Enjoys working on house projects, having cookouts with friends and family, going on beach vacations and getting involved in his kids’ activities and events.
• Working on global tested and rotten poles as well as FEMA rebuild projects.
• Competed at the International Lineman’s Rodeo on a journeyman team with Nathan Schippers and Grant Weinhold and finished 55th out of 290 teams.
• Was the third competitor from Midwest Energy to win the PLP challenge in the history of the competition. Install Challenge at the International Lineman’s Rodeo.
include mentoring two apprentices. I am the bucket guy on our crew and work to make sure the young guys are involved and learning while getting work done safely and efficiently.
Keaton Augustine, journeyman lineman for Midwest Energy, installed a set of armor rods and a distribution tie in 33.50 seconds in the final round of the PLP Armor Rod Install Challenge at the 2025 International Lineman’s Expo. Visit linemenworld on Instagram to watch the video of him competing in the challenge.
In our service territory in Kansas, we get a lot of different kinds of weather, and our line crews must be able to handle different conditions. We also have a lot of young guys on our crews, and I am responsible for helping to train them and instilling strong safety values in them.
After working many different storms, handling hot work scenarios and needing to adapt to situations around me, it has made a tremendous impact on how important safety is day in and day out. There’s nothing more important than making sure everyone goes home at the end of every day.
We had a fire come through our territory in December of 2021. It burned more than 400,000 acres, and we lost 1000+ poles. This storm lasted for months.
I became aware of the industry when I was in eighth grade, and I started my pursuit from there. My Uncle Matt gave me insight after he started a job doing mapping and GIS at Midwest Energy. We both are still employed here at Midwest Energy.
I started as a lineman intern at Midwest Energy. My current job title is journeyman lineman, and my main responsibilities
I can’t live without battery-powered crimpers and cutters. The tools provide an immense amount of control in hot work situations and can save wear and tear on your body.
I would go into the power industry again. The amount of opportunity, relationships you make, satisfaction of completing a job and pay are things you don’t get in every field. I plan to continue doing the things I am currently doing while being the best leader I can be and always looking to grow in my career.
MEDIA SALES
Account Manager
Brent Eklund
Phone: 303-888-8492
Email: beklund@endeavorb2b.com
Account Executive
Andreja Williamson
Phone: 630-721-0712
Email: awilliamson@endeavorb2b.com
INTERNATIONAL SALES
Europe
Sarah Howell
Phone: +44 7935 299 884
Email: showell@endeavorb2b.com
South America, Central America
Fernanda Vega
Phone: +55 21 97673-9692
Email: fvega@endeavorb2b.com
Middle East, India, Asia, Australia, Africa
Saurabh Kapoor
Email: skapoor@endeavorb2b.com
EVENT SALES
Account Manager
John Blackwell
Phone: 518-339-4511
Email: jblackwell@endeavorb2b.com
Account Manager
Denne Johnson
Phone: 607-644-2050
Email: djohnson@endeavorb2b.com
International Linemen’s Rodeo, and Events
Sam Posa
Phone: 913-515-6604
Email: sposa@endeavorb2b.com
MEMBERSHIP SALES
UTILITY ANALYTICS INSTITUTE
Membership Development Manager
James Wingate
Phone: 404-226-3756
Email: jwingate@endeavorb2b.com
Utility Analytics Institute, Smart Utility Summit and Smart Water Summit
For decades, many utilities relied on a simple formula for resilience: hardening the grid. Stronger poles, bigger wires and reinforced substations were the go-to solutions for storms that were considered rare, “100-year” events.
Extreme weather is now common — ice storms hit the South, wildfires burn in the West, windstorms sweep the East, and heat waves affect the entire country. Climate-driven events are frequent and intense.

As extreme weather events continue to increase, electric utilities remain committed to providing resilient and reliable power to their customers. While adapting to industry demands, much of the U.S. power grid continues to struggle with rising base load needs and climate change impacts. This shift demands more than stronger steel; it requires a cultural transformation in how utilities think about resilience.
The Black & Veatch 2025 Electric Report surveys 500 electric industry stakeholders; 50% of respondents noted that resiliency is being given more consideration in their investment decision making. However, even with significant investments aimed at reducing recovery times, resilience cannot be acquired solely through expenditure; it must be fundamentally integrated into strategy, planning, deployment, maintenance and operations.
The traditional “fortress grid” approach relied on strong infrastructure to handle rare, predictable threats. With climate change, utilities now see resilience as the ability to adapt, shifting from merely defending systems to making them flexible enough to withstand new challenges.
Adapting to the effects of climate change looks like making real updates to modernize a utility’s grid, taking measures that may look like:
• Installing smart devices to automatically isolate and reroute power during outages;
• Moving lines to improve access and speed up maintenance;
• Strengthening lines to improve reliability;
• Installation of underground distribution lines to mitigate environmental impact.
Utility crews are now operating in a world where flexibility is as critical as strength. During prolonged heat waves, for example, operators must balance load across stressed assets while preventing further failures. In regions unaccustomed to ice storms, crews must work to restore service while learning new restoration techniques. These scenarios highlight the need for operational agility supported by advanced tools.
Predictive analytics is one such tool. By leveraging weather models, asset health data and historical performance, utilities can anticipate stress points before they fail. This proactive approach allows crews to pre-position resources and implement load-shedding strategies that minimize outages.
Grid modernization involves more than just software; architecture is key. Microgrids and Distributed Energy Resource Management Systems (DERMS) are redefining resilience by decentralizing power. When a storm knocks out transmission lines, a community microgrid powered by solar and battery storage can keep critical facilities running. Local resilience lessens reliance on a single system and prevents catastrophic failures.
“Utilities
should prioritize predictive analytics, DERMS integration, and workforce training for climate emergencies, while collaborating with regulators and communities on solutions beyond traditional infrastructure.”
Integration thus becomes a daily grind. Supervisory Control and Data Acquisition (SCADA) must coordinate DERMS. Operational technology (OT) cybersecurity needs to mesh with communications infrastructure. Data systems must normalize information from legacy platforms and new edge sensors in real time. It all breaks down fast when organizational charts don’t match the architecture.
Some utilities are breaking down silos by creating teams that combine operations, IT and engineering. Their focus is on collaboration, not just new technology.
Grid modernization requires a fundamental shift in approach. Utilities should prioritize predictive analytics, DERMS integration, and workforce training for climate emergencies, while collaborating with regulators and communities on solutions beyond traditional infrastructure.
As extreme weather becomes the new normal, the question isn’t whether utilities can build a stronger grid — it’s whether they can build a smarter, more adaptive one. Resilience means adapting to change, not opposing it.
TODD EDSALL is president of Power Providers, Black & Veatch.