Accelerating surface analysis automation... and much more
Coplanarity and warpage analysis for reliable electronic assemblies
APPLICATION
APPLICATION
Force spectroscopy:
Bringing next-generation head-up displays to life
Strengthening polylactic acid polymers by calcification
HOW TO
FEATURE SPOTLIGHT
Improve particle segmentation in electron microscopy images with artificial intelligence
Welcome to the fascinating world of fiber analysis
SURFACE METROLOGY
SURFACE METROLOGY
Q&A
Q&A What can I do with a freeform surface?
What cut-off value should I use?
EVENTS & SOCIAL Trade show review
What’s hot online
NEWS & SOCIAL Events highlights What’s hot online
As electronic assemblies shrink, tiny geometric deviations can cause major failures. Coplanarity and warpage analysis brings precision to quality control through accurate 3D metrology. With solutions such as Mountains® software, manufacturers can detect solder ball issues early and automate defect detection, improving yield, preventing failures and strengthening reliability in semiconductor and advanced electronic packaging applications.
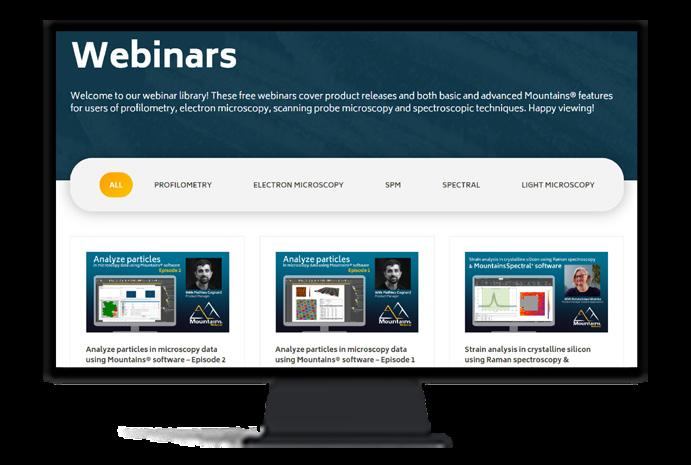
Did you know there is a whole host of free webinars waiting for you on the Digital Surf website?
Head on over to our Webinar Library & become a Mountains® software expert in no time!
Check it out: www.digitalsurf.com/learning/webinars/
COPLANARITY AND WARPAGE ANALYSIS FOR RELIABLE ELECTRONIC ASSEMBLIES
As electronic devices continue to shrink while increasing in complexity, ensuring the reliability of interconnections has become a critical challenge for manufacturers. In semiconductor packaging, particularly in ball grid array (BGA) packages and other high-density assemblies, small geometric deviations can have significant consequences on performance and durability. Two parameters are especially critical: coplanarity and warpage. Claire Kayser, product manager for profilometry applications at Digital Surf, explores the subject and explains how advanced surface analysis can help manufacturers ensure quality and reliability.
Coplanarity refers to the relative height of solder ball terminations. For a reliable electrical connection, all solder balls must make uniform contact with the PCB. Even slight variations can result in weak or intermittent connections.
Warpage, on the other hand, describes the deformation of the substrate, often caused by thermal cycles and mechanical stress during manufacturing. Excessive warpage can prevent proper contact, leading to immediate or latent failures. These issues are not limited to semiconductor manufacturing. They are equally relevant in high-reliability sectors such as aerospace, medical devices and defense electronics, where failure is not an option.
FROM VISUAL INSPECTION TO QUANTITATIVE ANALYSIS
Traditionally, inspection methods have relied on visual checks or limited measurements, which can be time-consuming and insufficient for detecting subtle defects across large arrays of components. As assemblies become more complex, there is a growing need for automated, quantitative approaches capable of analyzing entire datasets.
Modern surface metrology solutions now enable engineers to go beyond simple observation. Using 3D surface data, it is possible to measure substrate deformation, calculate coplanarity across hundreds or thousands of solder balls and identify deviations with micrometer-level accuracy. These tools also allow for the detection of common defects such as bridging between solder balls, misalignment and irregular geometries.
By combining geometric analysis with statistical evaluation, manufacturers can establish clear acceptance criteria and quickly determine whether a component meets specifications.
EARLY DEFECT DETECTION FOR BETTER PROCESS CONTROL
One of the key advantages of advanced coplanarity and warpage analysis is the ability to detect defects early in the production process. This has a direct impact on yield and cost.
Short-term risks such as short circuits, overheating or functional failures can be mitigated before assembly. At the same time, long-term reliability issues, often caused by mechanical stress or uneven contact, can be significantly reduced.
Automated workflows further enhance efficiency by enabling fast, repeatable analysis.
In some cases, AI-assisted detection can help identify patterns or anomalies that might other-
wise go unnoticed. This not only saves time but also improves consistency across inspection batches.
INTEGRATING ANALYSIS INTO INDUSTRIAL WORKFLOWS
To be effective, these capabilities must integrate seamlessly into existing production and quality control processes. This includes the ability to define tolerances, apply pass/fail criteria, and generate traceable reports for process monitoring and compliance.
Beyond measurement and detection, robust analysis also relies on the ability to structure and organize data consistently. In the case of ball grid array components and similar assemblies, this
often involves defining a regular grid of features and assigning a stable index to each termination. Such indexing ensures that each solder ball can be tracked and compared across multiple samples, even in the presence of misalignment, missing elements or local defects.
Solutions such as MountainsMap® software provide dedicated tools for coplanarity and warpage analysis, allowing users to combine advanced surface metrology with intuitive visualization and reporting tools. MountainsMap® also ensures engineers have constant access to the latest standardized parameters (ISO, JEDEC), allowing them to guarantee compliance with industry specifications.
Read full article: bit.ly/coplanarity-warpage
TRY COPLANARITY AND WARPAGE ANALYSIS ON YOUR DATA
Want to better understand coplanarity and warpage in your components? Download a free trial of MountainsMap® software and evaluate these parameters on your own measurement data: www.digitalsurf.com/free-trial
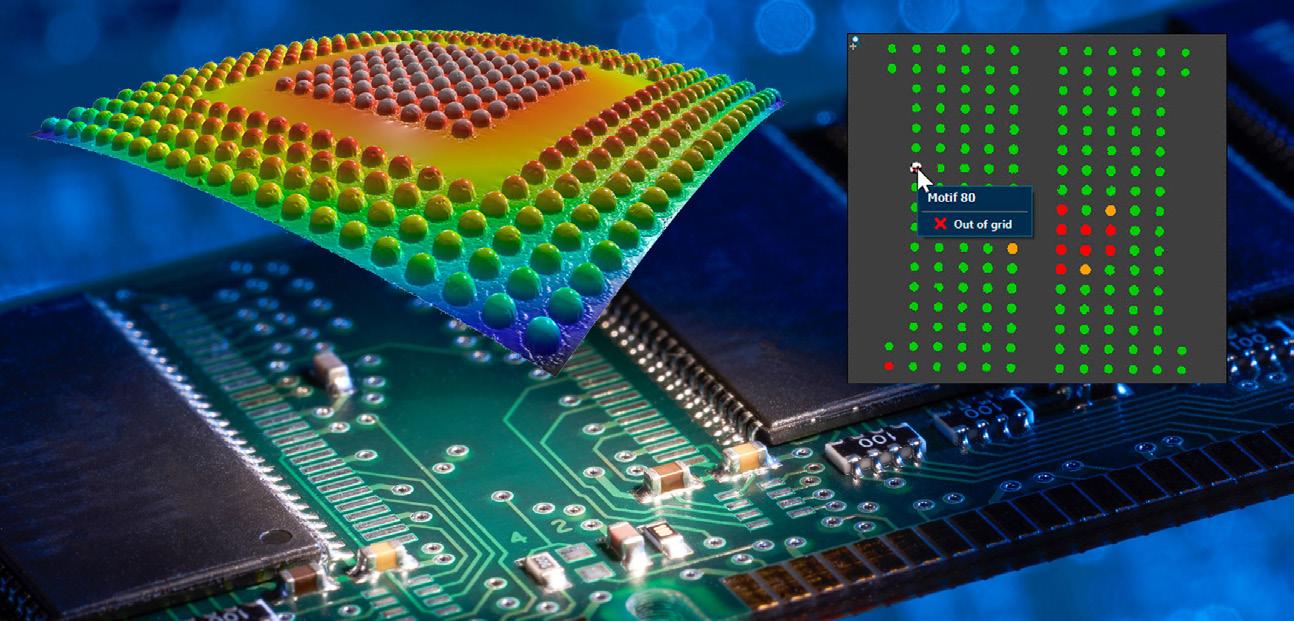
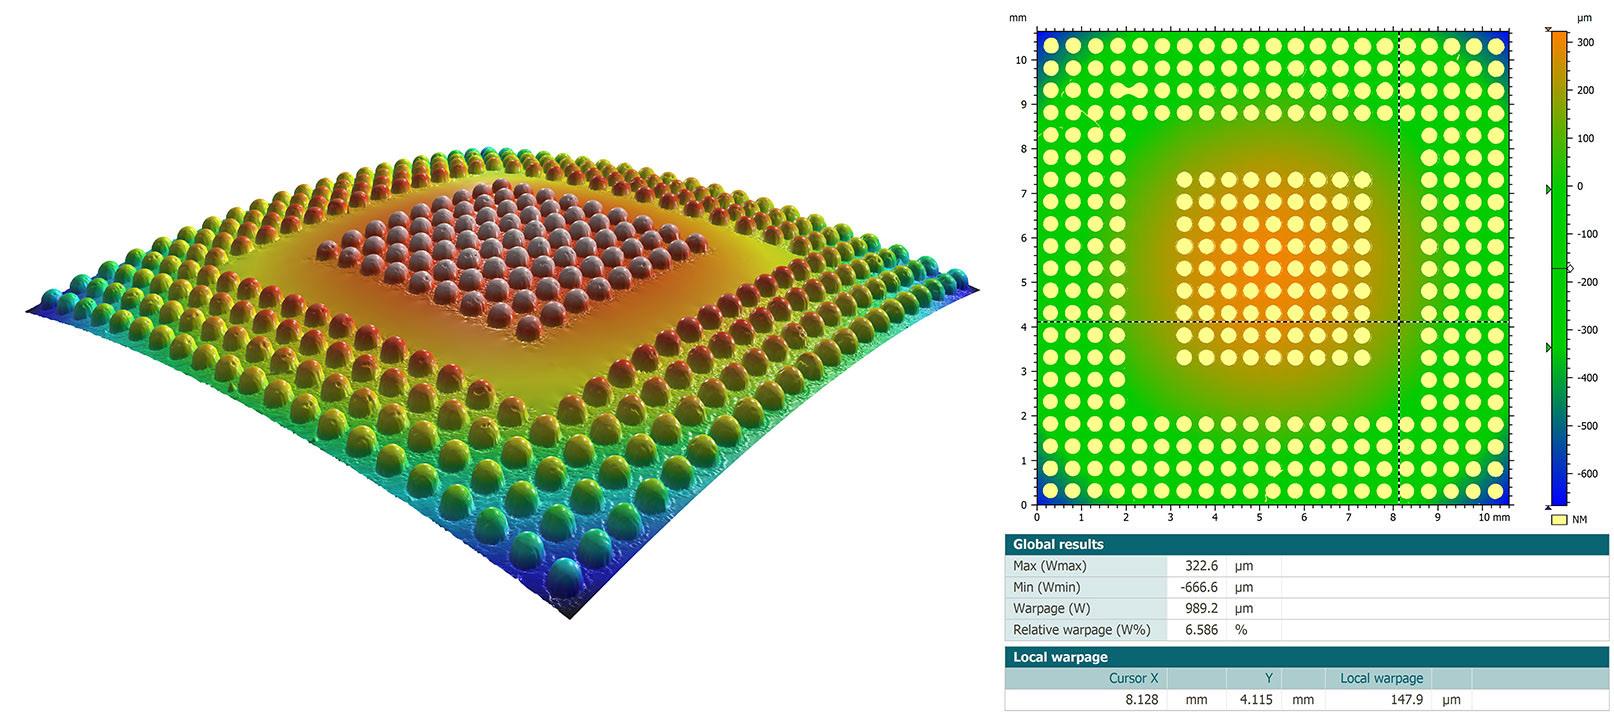
Above. Substrate deformation (warpage) visualized using 3D surface metrology.
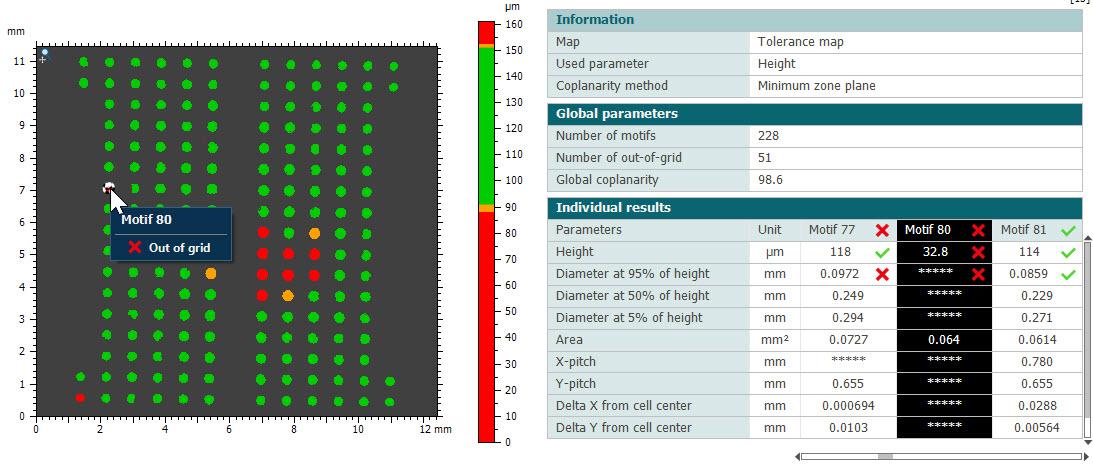
Above. Coplanarity: use AI-assisted structure detection, set tolerance limits for parameters and visualize maps of pass/fail statuses
BRINGING NEXT-GENERATION HEAD-UP DISPLAYS TO LIFE
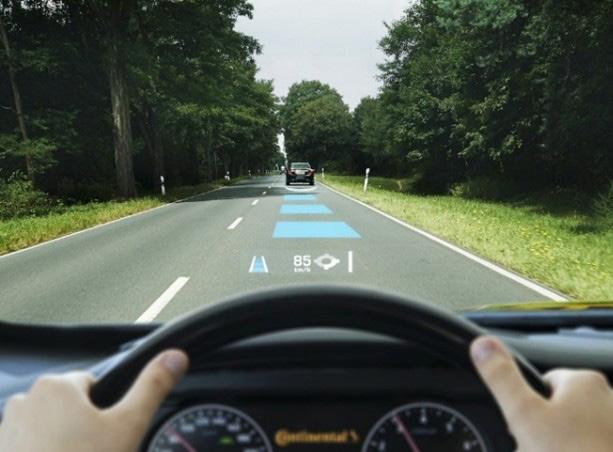
Head-up displays, widely used in aviation and increasingly in automotive dashboards, traditionally require several optical elements to fold and relay the image from the display to the driver’s or pilot’s line of sight. This makes them bulky, power-hungry and sensitive to alignment errors.
The Huddersfield team set out to design a HUD that eliminates this complexity. Their solution: a single, carefully shaped freeform mirror that both redirects the image and corrects for off-axis aberrations.
FROM CONCEPT TO MIRROR
Using optical design software, the researchers optimized a freeform mirror shape capable of delivering a wide, stable “eyebox” i.e. the volume in which the observer’s eye can move while still seeing the full image.
The next challenge was fabrication. The mirror was produced using ultra-precision single-point diamond turning, with on-machine metrology providing feedback during cutting. This allowed the team to achieve sub-micron form accuracy and nanometer-scale surface finish, prerequisites for high optical performance.
Researchers from the Future Metrology Hub at the University of Huddersfield have developed a radically simplified head-up display (HUD) system that relies on just one freeform mirror.
While conducting this study, they turned to MountainsMap® software to verify the critical surface quality of the optical component.
MOUNTAINSMAP® FOR VERIFICATION
To validate the mirror surface, the team used MountainsMap® software for post-measurement analysis. Surface data collected during and after machining was imported into MountainsMap®, where leveling and form removal were performed. This enabled the researchers to isolate the residual roughness and assess whether the manufactured surface matched the intended design.
According to Dr. Wenhan Zeng, one of the researchers involved in the study, this step was essential: “By quantifying roughness parameters and visualizing the deviations, we were able to confirm that the freeform mirror would deliver the required optical quality.”
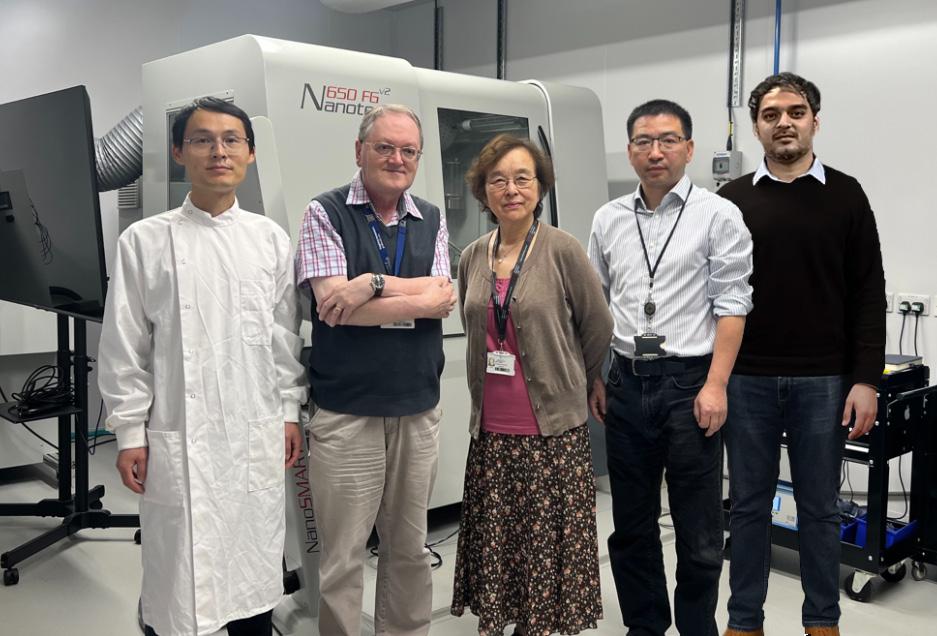
Right. The Huddersfield team involved in the study. From left to right: Dr. Wenbin Zhong, Prof. Paul Scott, Prof. Dame Xiangqian Jiang, Dr. Wenhan Zeng, Dr. Sumit Kumar.
COMPACT, ROBUST AND PROMISING
The prototype HUD showed excellent performance. Despite using only one mirror, the system delivered sharp imagery across a wide eyebox, maintaining image quality even when the observer’s head height varied. The simplified design also reduces alignment sensitivity and eliminates moving parts, promising a more compact and energy-efficient HUD.
This case study illustrates not only the potential of freeform optics in reshaping display systems, but also the indispensable role of surface analysis tools like MountainsMap® in bridging the gap between theoretical design and functional devices.
INSTRUMENTS & SOFTWARE USED
Confocal microscope & MountainsMap® software
READ MORE
The Future Metrology Hub at the University of Huddersfield (UK) is a center of excellence for advanced measurement science, supporting research, industry collaboration and innovation.
Equipped with cutting-edge instrumentation and analysis tools such as Mountains® software, it is helping bridge the gap between academic research and real-world manufacturing challenges.
Learn more: fmh.hud.ac.uk
Sumit Kumar, Wenbin Zhong, James Williamson, Prashant Kumar, Thomas Furness, Shan Lou, Wenhan Zeng, Xiangqian Jiang, Design, fabrication, and testing of freeform mirror-based head-up display system, Optics & Laser Technology, Volume 186, 2025, 112653, ISSN 0030-3992, doi.org/10.1016/j. optlastec.2025.112653
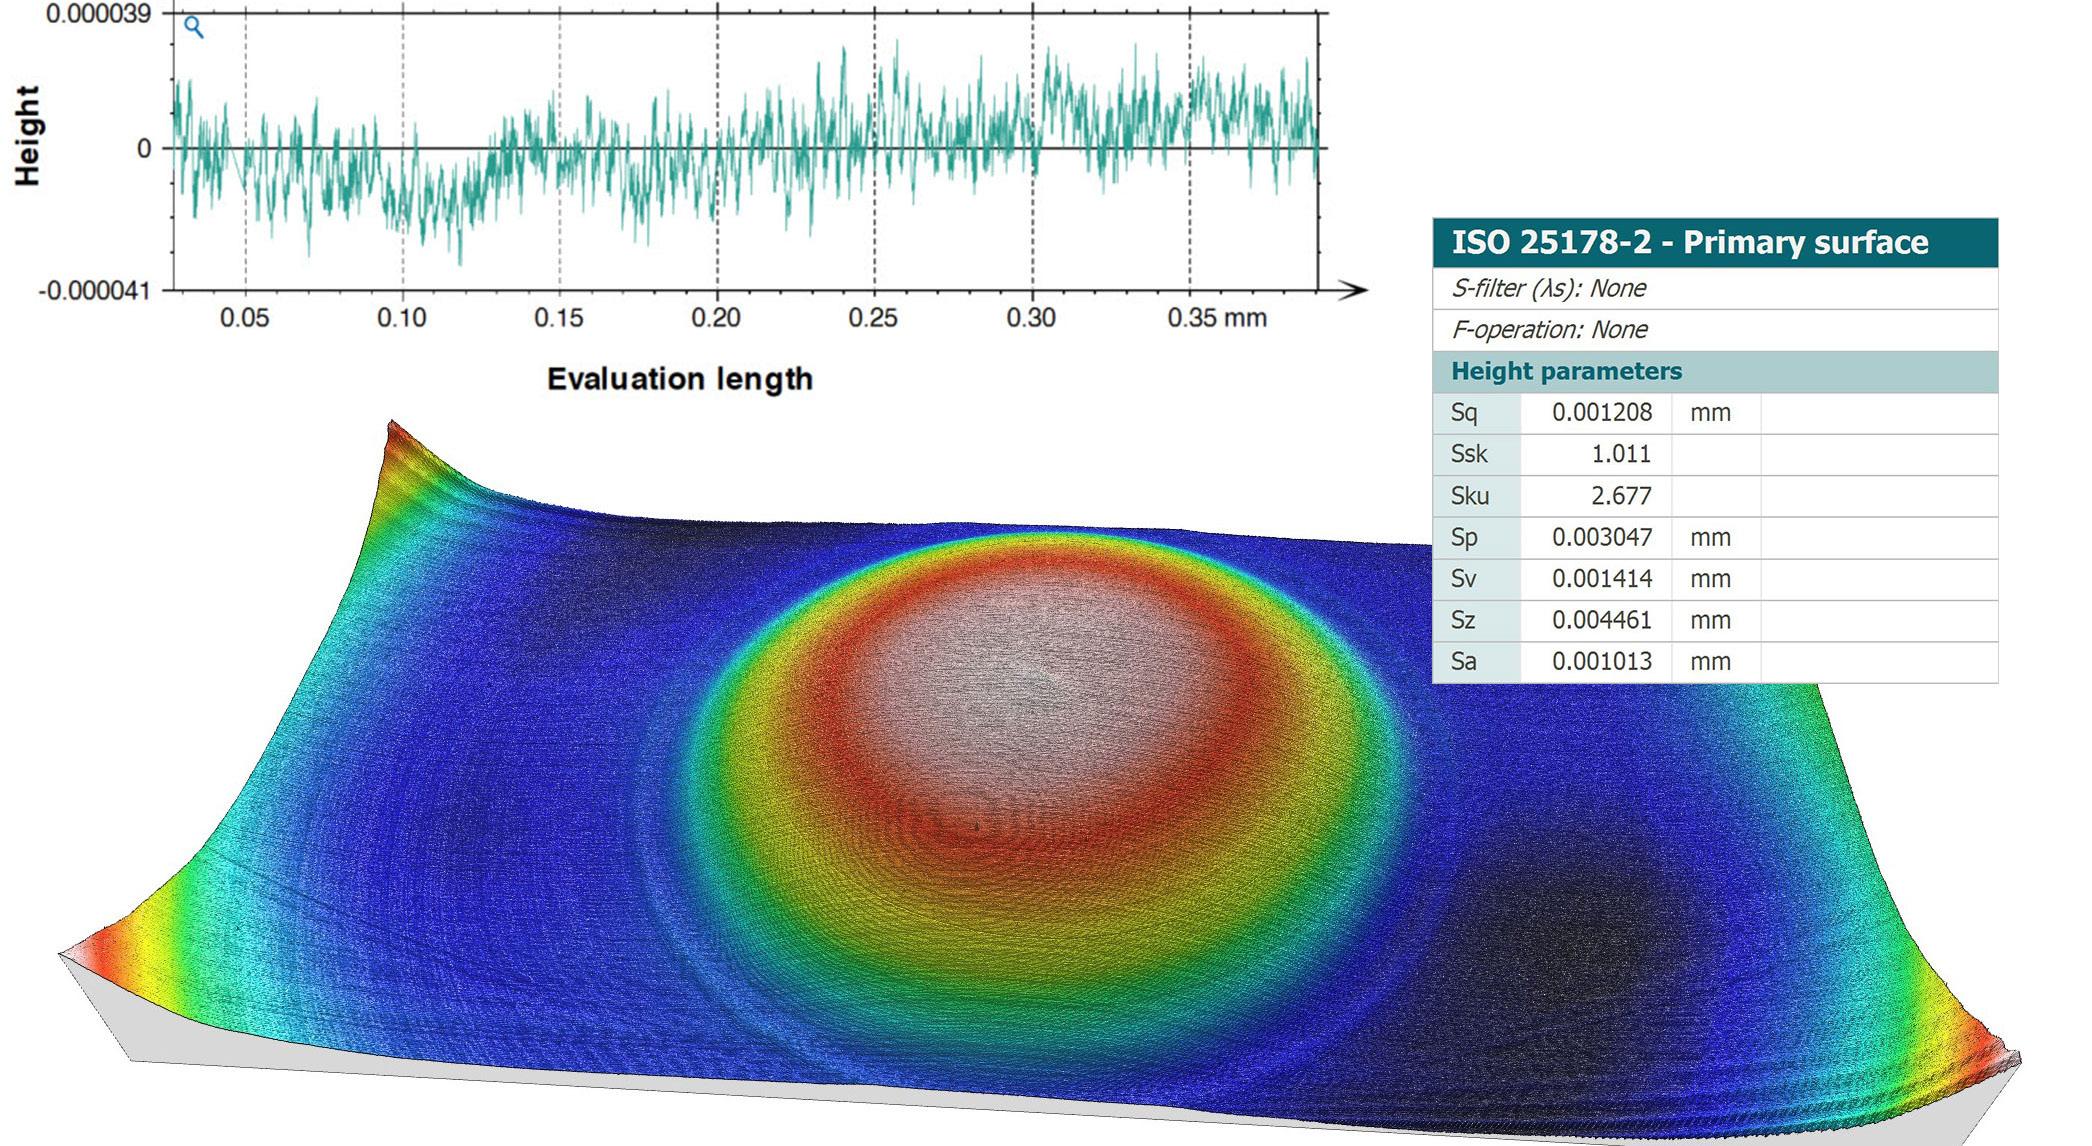
Above. Surface roughness plot and form error (shown in 3D view with corresponding parameters table) of one of the freeform mirror prototypes developed as part of the study.
IMPROVE PARTICLE SEGMENTATION IN ELECTRON MICROSCOPY IMAGES WITH ARTIFICIAL INTELLIGENCE
Particle analysis is a common task in electron microscopy, in both research or industrial applications. Accurately detecting and measuring particles can provide critical insights into material properties, quality control or process optimization. However, segmenting particles in images is often a time-consuming and delicate process. Traditional methods may require careful parameter tuning, manual corrections or complex workflows, especially when dealing with agglomerates or noisy images.
Recent advances in artificial intelligence are changing this landscape. Benoit Zupancic, product manager for SEM applications at Digital Surf explores how AI segmentation can simplify particle analysis and how it can be applied effectively in real-world microscopy images.
WHY USE AI FOR PARTICLE SEGMENTATION?
AI-based segmentation brings significant advantages compared to traditional image processing approaches.
First, it dramatically reduces the time required to obtain reliable results. Instead of manually adjusting thresholds or filters, users can apply a trained model to detect particles automatically.
Second, AI improves consistency. Because segmentation relies on trained models rather than manual parameter adjustments, it delivers more consistent and reproducible results across different images and users.
Finally, AI can better handle complex situations such as agglomerated particles or variations in contrast.
From a user perspective, one of the key benefits is simplicity. Modern AI tools are designed to be accessible, allowing users to perform advanced segmentation with minimal training.
HOW TO PERFORM AI-BASED PARTICLE SEGMENTATION
Using AI segmentation in your workflow can be straightforward. A typical process involves only a few steps:
▶ Import your microscopy image (obtained with electron microscopy or other types of microscopy or profilometry)
▶ Apply an AI segmentation tool to automatically detect particles
▶ Review the segmentation result and adjust if necessary
▶ Extract particle measurements such as size, distribution or morphology
In many cases, the segmentation can be performed in just a few clicks, making it accessible even to non-expert users.
For advanced users, additional options may be available to refine the segmentation or adapt it to specific datasets.
WHEN DOES AI SEGMENTATION WORK BEST?
AI segmentation is particularly effective in a number of common scenarios.
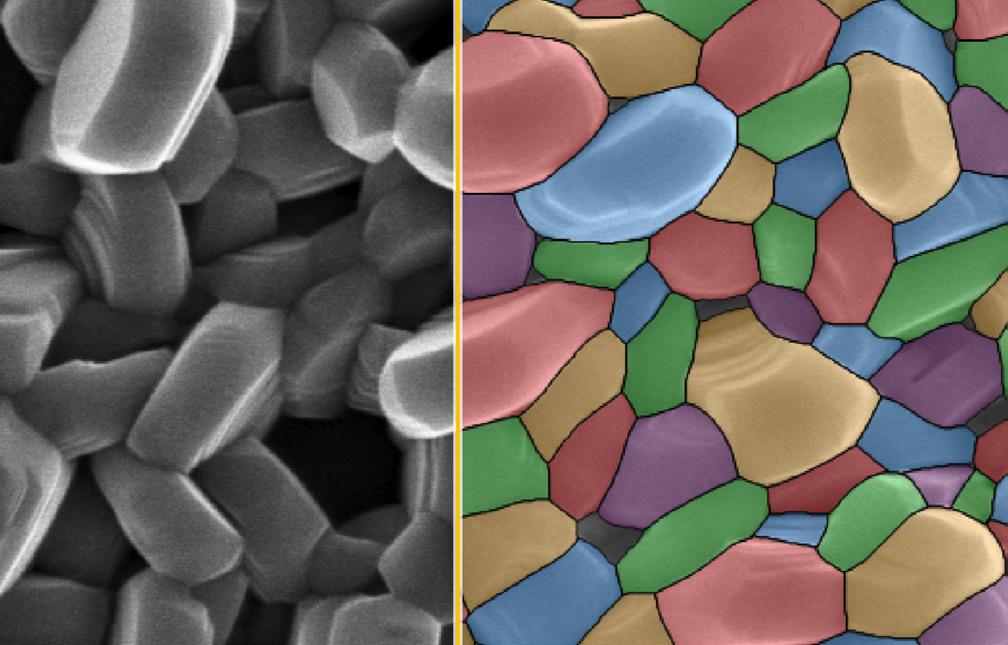
Above. AI-powered segmentation enables faster, more reliable particle detection.
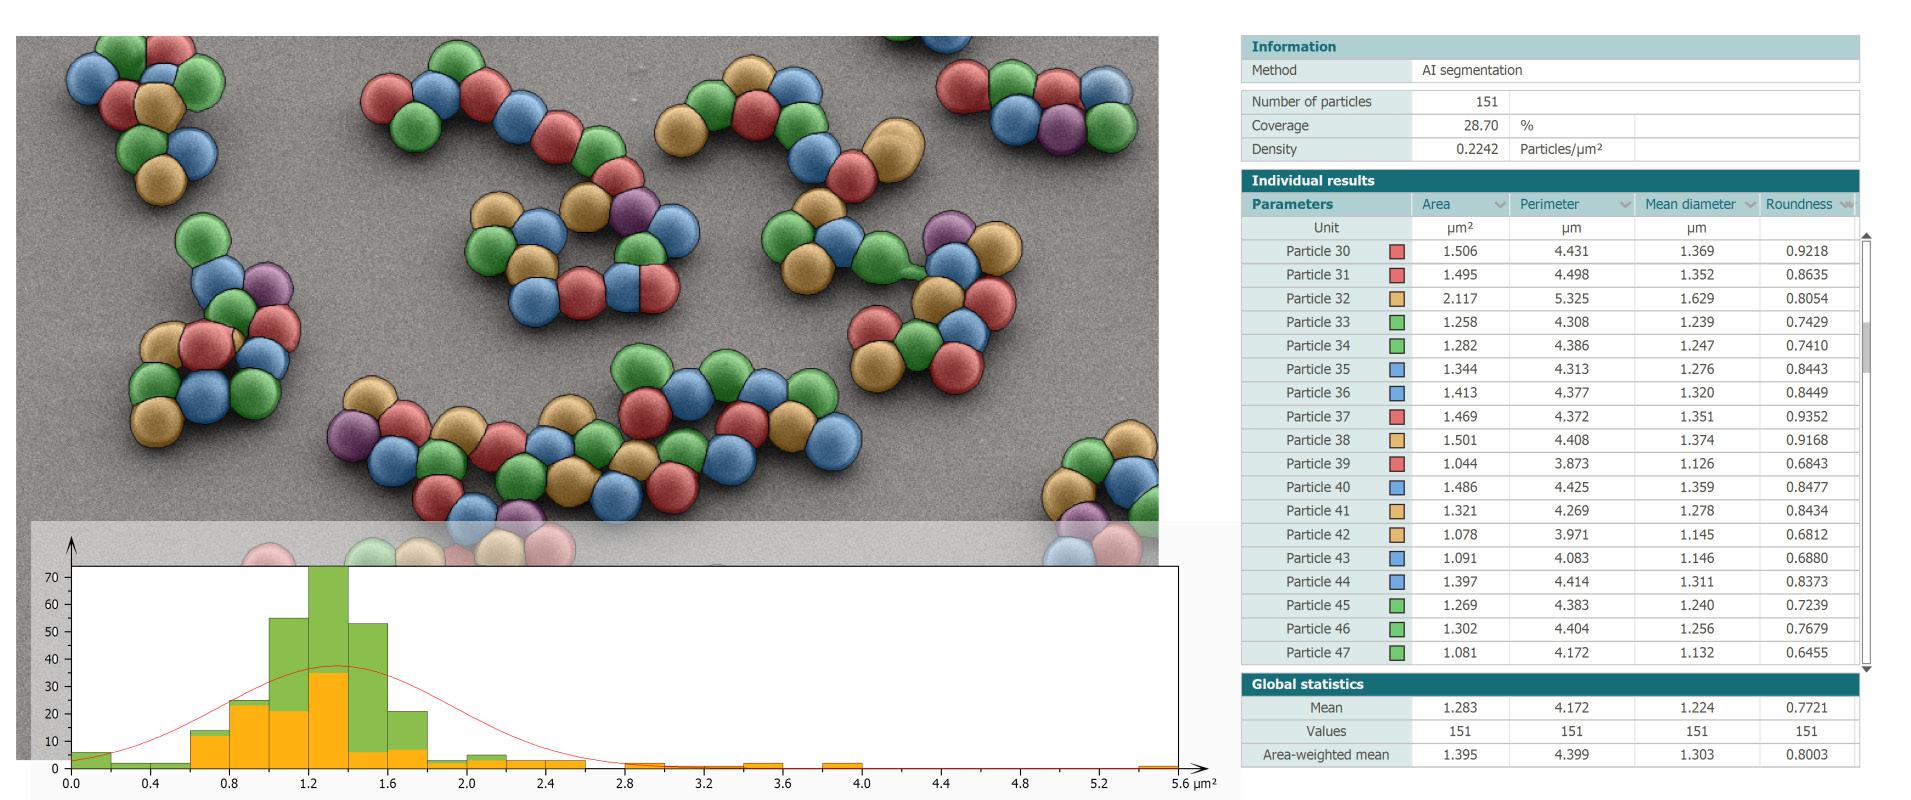
Above. Calculate particle metrics such as size, distribution and morphology and generate statistics.
It performs very well when analyzing homogeneous particle populations, where particles share similar sizes and shapes. It is also well suited for moderately agglomerated particles, where boundaries remain partially distinguishable.
These situations are frequently encountered in materials science and industrial quality control.
LIMITATIONS AND PRACTICAL CONSIDERATIONS
While AI segmentation is highly efficient, it is important to understand its limitations.
Performance may decrease when dealing with highly polydisperse samples, where particle sizes vary significantly. Similarly, very elongated or irregular (oblong) particles can be more difficult for the model to segment accurately. In such cases, combining AI segmentation with manual correction or complementary image processing tools can help achieve optimal results.
Being aware of these limitations allows users to apply AI segmentation more effectively.
KEY BENEFITS FOR YOUR WORKFLOW
Integrating AI segmentation into your particle analysis workflow offers several tangible benefits:
▶ Ease of use: perform complex segmentation with minimal setup
▶ Time saving: reduce analysis time from minutes to seconds
TRY IT OUT YOURSELF
▶ Reproducibility: obtain consistent results across datasets and users
▶ Efficiency: focus on interpreting results rather than preparing data
These advantages make AI segmentation an attractive solution for both routine analysis and more advanced applications.
CONCLUSION
AI-powered segmentation is transforming the way particles are detected and analyzed in electron microscopy. By combining speed, robustness and ease of use, it enables more efficient workflows while maintaining high-quality results. Although it may not replace traditional methods in every situation, it provides a powerful and accessible tool for a wide range of applications.
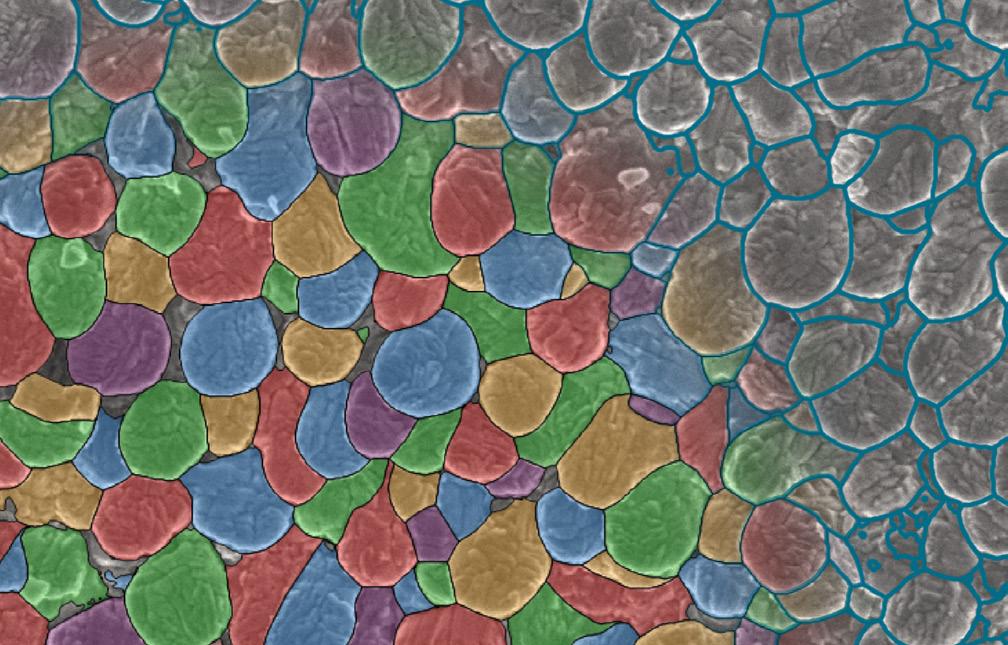
Above. AI-driven segmentation delivers accurate detection of both round and irregular particles, even in images with uneven lighting, contrast variations or overlapping features.
Want to see how AI segmentation can improve your particle analysis workflow? Download a free trial of our software to test it on your own images: www.digitalsurf.com/free-trial
WHAT CAN I DO WITH A FREEFORM SURFACE?
Freeform surfaces (or shells) are transforming how complex geometries are measured and analyzed, especially in advanced manufacturing. In this article, François Blateyron, Digital Surf’s senior surface metrology expert, explains how shell-based approaches enable deeper insight into surface texture, form and deviations, thus unlocking new possibilities for accurate, nondestructive characterization across a wide range of applications.
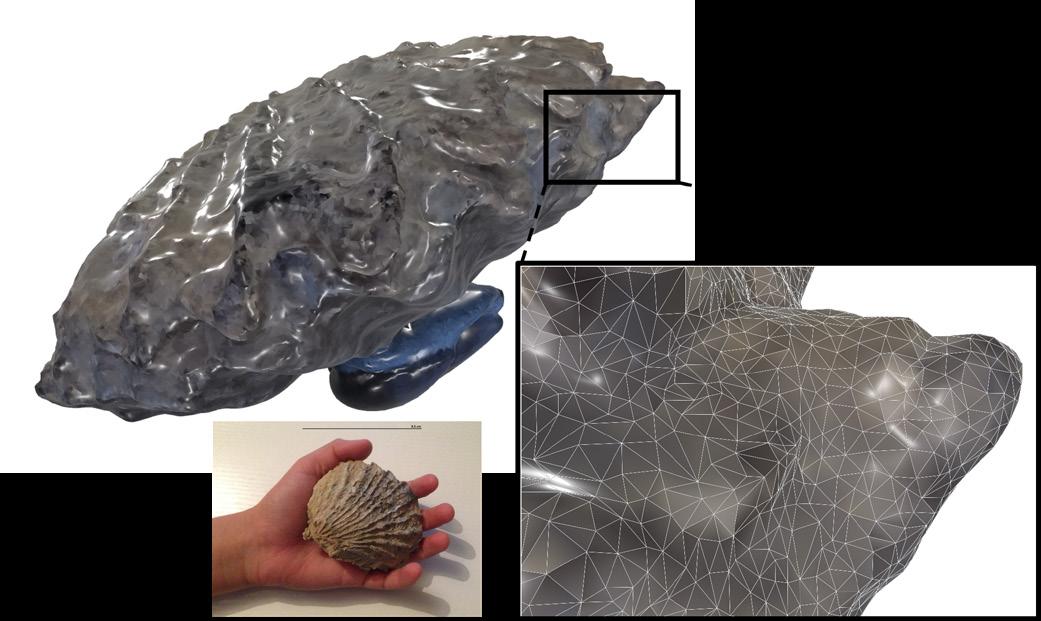
A freeform surface is represented by a mesh which is a connected set of triangles built from a 3D point cloud. In Mountains®, this is called a shell. It can be imported from STL, OBJ or PLY files or generated from CAD data, point clouds or by assembling multiple surfaces.
This type of representation captures complex or non-planar surfaces that cannot be described using the conventional surface model z=f(x,y). It opens up new possibilities for analyzing surface texture and form deviations on mechanical components and structured textures such as those produced by additive manufacturing.
MESH REPRESENTATION
A shell consists of a 3D point cloud (x, y, z), where points are connected by triangles to form a mesh. This mesh must satisfy several requirements, called the manifold conditions, among which: edges can belong to only one or two triangles, triangles cannot intersect each other and elements cannot be isolated.
CHARACTERIZE INTERNAL SURFACES
With traditional subtractive machining methods (grinding, lapping, milling etc.), each component is controlled before assembly. In contrast, additive manufacturing enables the production of complex, fully assembled parts, including internal features.
These internal structures can be analyzed either destructively (by cutting the part) or nondestructively using X-ray computed tomography (XCT). XCT produces a volumetric dataset from which material boundaries (e.g. metal vs air) can be extracted as a shell.
The Shell Extension module in Mountains® 11 allows direct surface extraction from XCT data without requiring third-party software.
CHARACTERIZE SURFACES AROUND AN OBJECT
Some optical profilers include motorized rotary stages, enabling multi-angle measurements (sometimes referred to as 5-axis profilometry).
By combining measurements taken at different orientations, a complete or partial shell of an object, such as a drill or worm gear, can be reconstructed and analyzed.
The Shell Topography module in Mountains® 11 assembles multiple surfaces into a shell and computes surface texture parameters directly on it. Cross-sectional profiles can also be extracted by intersecting the shell with a plane, enabling dimensional and form analysis (GD&T) using the Advanced Contour module.
If only a point cloud is available, Mountains® provides meshing tools to generate a shell.
Above. Surface of a fossil captured by LiDAR, producing both a shell (mesh) and a color image. The triangular mesh can be overlaid on the shell (see zoomed detail).
CHECK DEVIATIONS FROM A NOMINAL MODEL
Once a measured shell (the “actual” surface) is obtained, it can be compared to a CAD model (the “nominal” surface) using the Shell CAD Compare module.
Supported CAD formats (STEP, IGES, DXF) are converted into shells, aligned with the measured data, and used to calculate form deviations. These deviations are visualized as color maps, with quantitative indicators such as PV and RMS values.
VISUALIZING LOCAL CURVATURE
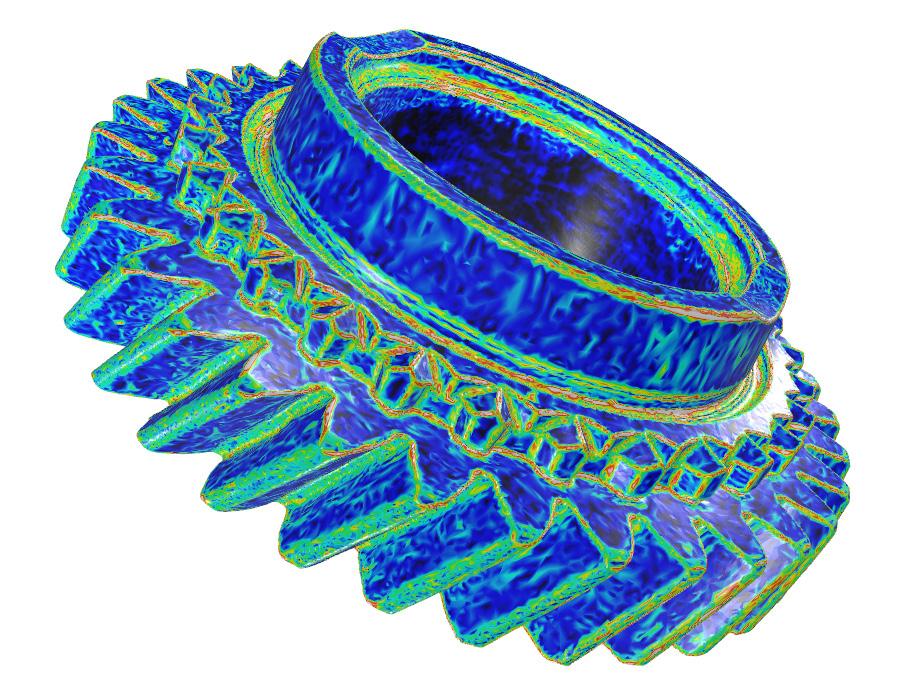
Left. Curvature mapped in color on a shell, showing the curvedness index calculated using the Cohen–Steiner tensor.
Curvature analysis provides deeper insight into surface features, highlighting edges and local defects. Various curvature metrics can be computed and stored as point attributes, then visualized using color mapping.
Additional curvature-based tools are planned for future releases of Mountains®.
NEW METROLOGICAL TOOLS
Digital Surf introduced shell-based analysis several years ago through dedicated modules. In collaboration with the
Centre of Precision Technologies (CPT) at the University of Huddersfield, advanced filtering and surface texture parameters have been extended to freeform surfaces.
A subset of ISO 25178-2 parameters has been adapted to curved geometries, requiring a transition from Euclidean to Riemannian geometry. These developments were first implemented in Mountains® 10 and continue to evolve.
Available tools include form removal (F-operator), S-filters and various height and hybrid parameters.
CONCLUSION
Freeform surface analysis addresses the growing complexity of modern manufacturing and design. Mountains® 11 provides a comprehensive set of metrology tools for shells, applicable across scales, from microns to meters, and compatible with a wide range of measurement technologies.
FURTHER READING
▶ Surface texture on freeform surfaces: guide.digitalsurf.com/en/guide-freeform.html
▶ Advanced Metrology for Freeform Surfaces, J. Jiang & P. J. Scott: www.elsevier.com/books/ advanced-metrology/jiang/978-0-12-821815-0
Above. Nine surfaces are assembled in 3D (left), then converted into a shell (center-left). A plane intersects the shell (centerright) to produce a Contour profile (right).
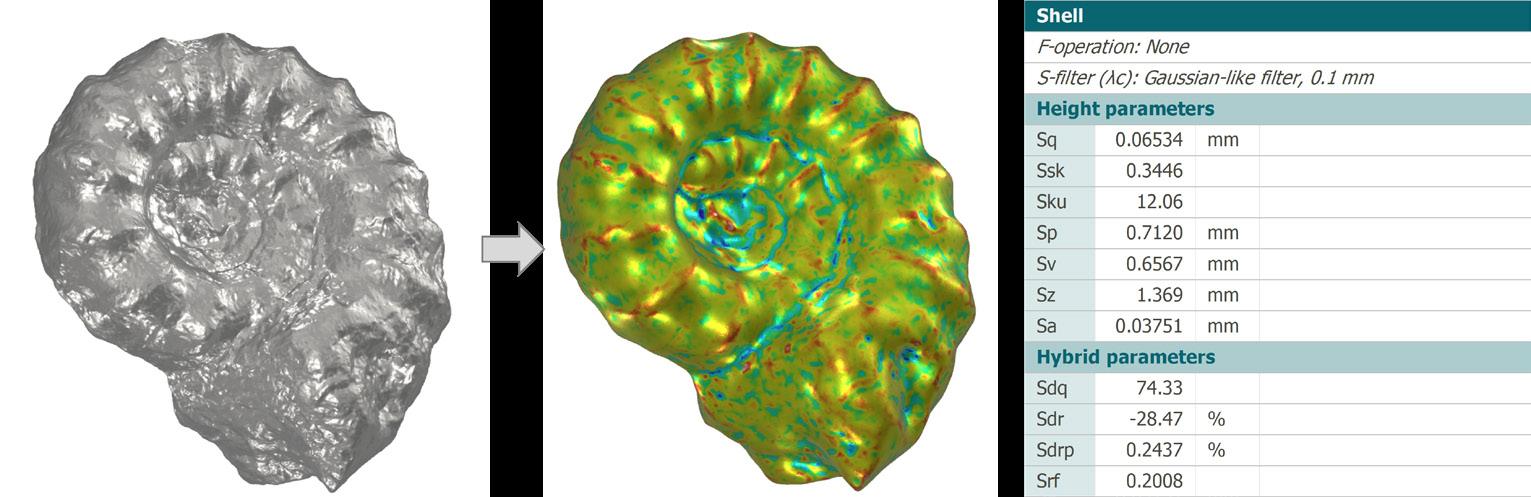
Above. Fossil shell (left), filtered
S-filter (center),
table (right) calculated from deviations shown as color mapping on the filtered shell.
TRADE SHOW REVIEW
The Digital Surf team was pleased to be exhibiting at the Materials Research Society (MRS) Fall Meeting late November/early December (above).
Taking place annually in Boston, MA, the meeting has now become a must-attend event in the Digital Surf Fall calendar. This conference dedicated to materials science is a great opportunity to meet scientists and researchers from all over the world and discuss their applications in various fields.
Anne, Emmanuel, Mathieu and Nicolas were on hand to welcome partners and visitors to the Digital Surf booth and showcase the new features of Mountains® software.
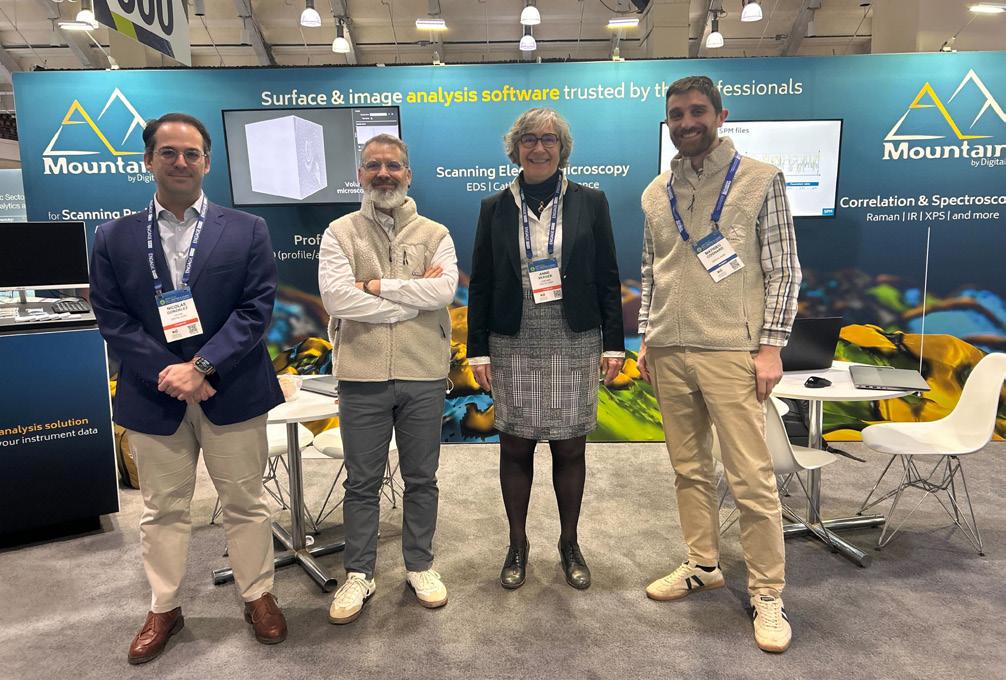
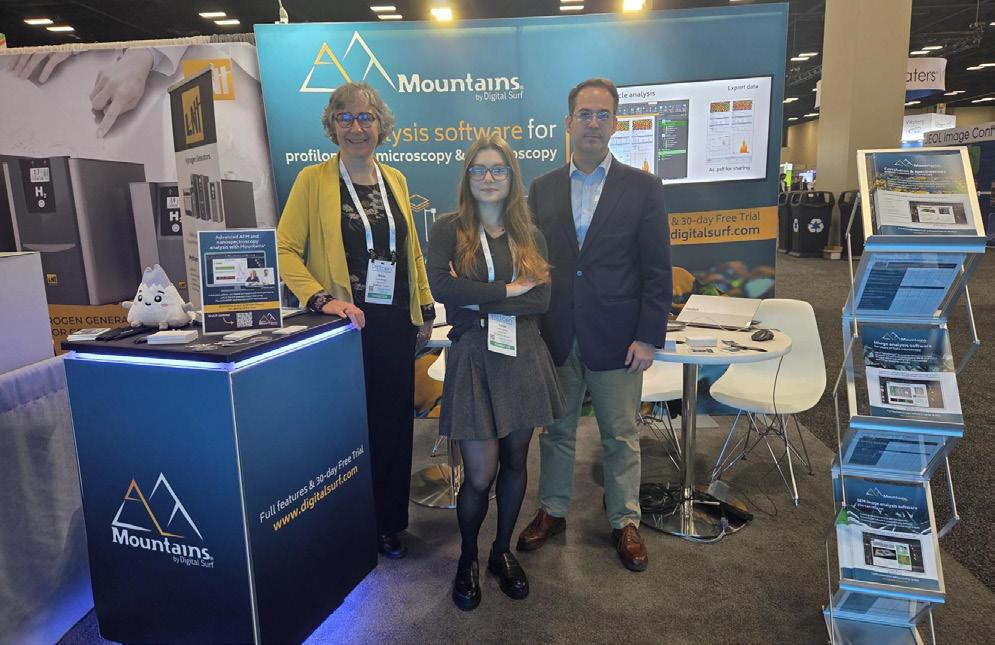
To kick off the 2026 trade show season, the Digital Surf team traveled to San Antonio, TX early March to attend the Pittcon conference (below).
Taking place from March 7-11, this international event gathered over 300 exhibiting companies and 3,900 participants who met to discuss the latest advances in analytical research and scientific instrumentation. Anne, Lucie and Nicolas were
pleased to offer visitors to our booth live demos of Mountains® software analysis features.
In late April, Digital Surf was thrilled to head for Honolulu, Hawaii to attend the MRS Spring Meeting. This event convened materials researchers from academia, industry, and national laboratories together for a week of cross-disciplinary collaboration and scientific exchange.
Mathieu, product manager for SPM applications at Digital Surf, was pleased to attend to meet the scientific community on site and to hold a talk on “AIdriven quality assessment and multi-model analysis of AFM force curves”.
Pico managed some time out from the conference to take in the local surroundings!
NEW WEBINARS
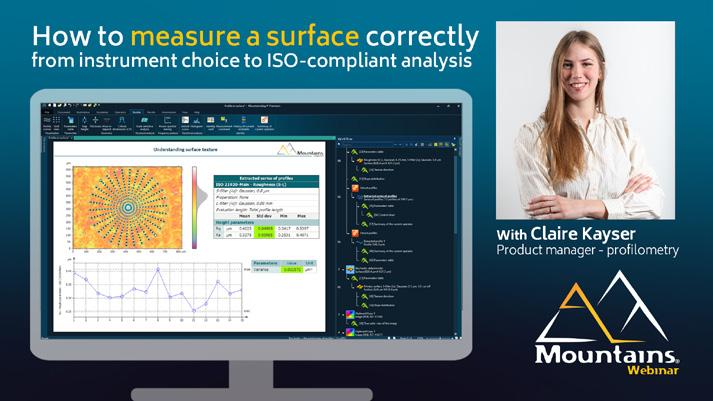
Visit our webinar library to explore both basic and advanced Mountains® features for profilometry, electron microscopy, scanning probe microscopy and spectroscopic techniques.
In our latest webinar, profilometry users will discover how to measure a surface correctly.
Another recent episode focuses on advanced AFM and nanospectroscopy analysis using Mountains® software.
Both episodes, along with all our other webinars, are available to watch on demand for free at bit.ly/3oWTBF9
WHAT’S HOT ONLINE
LOVED ON LINKEDIN
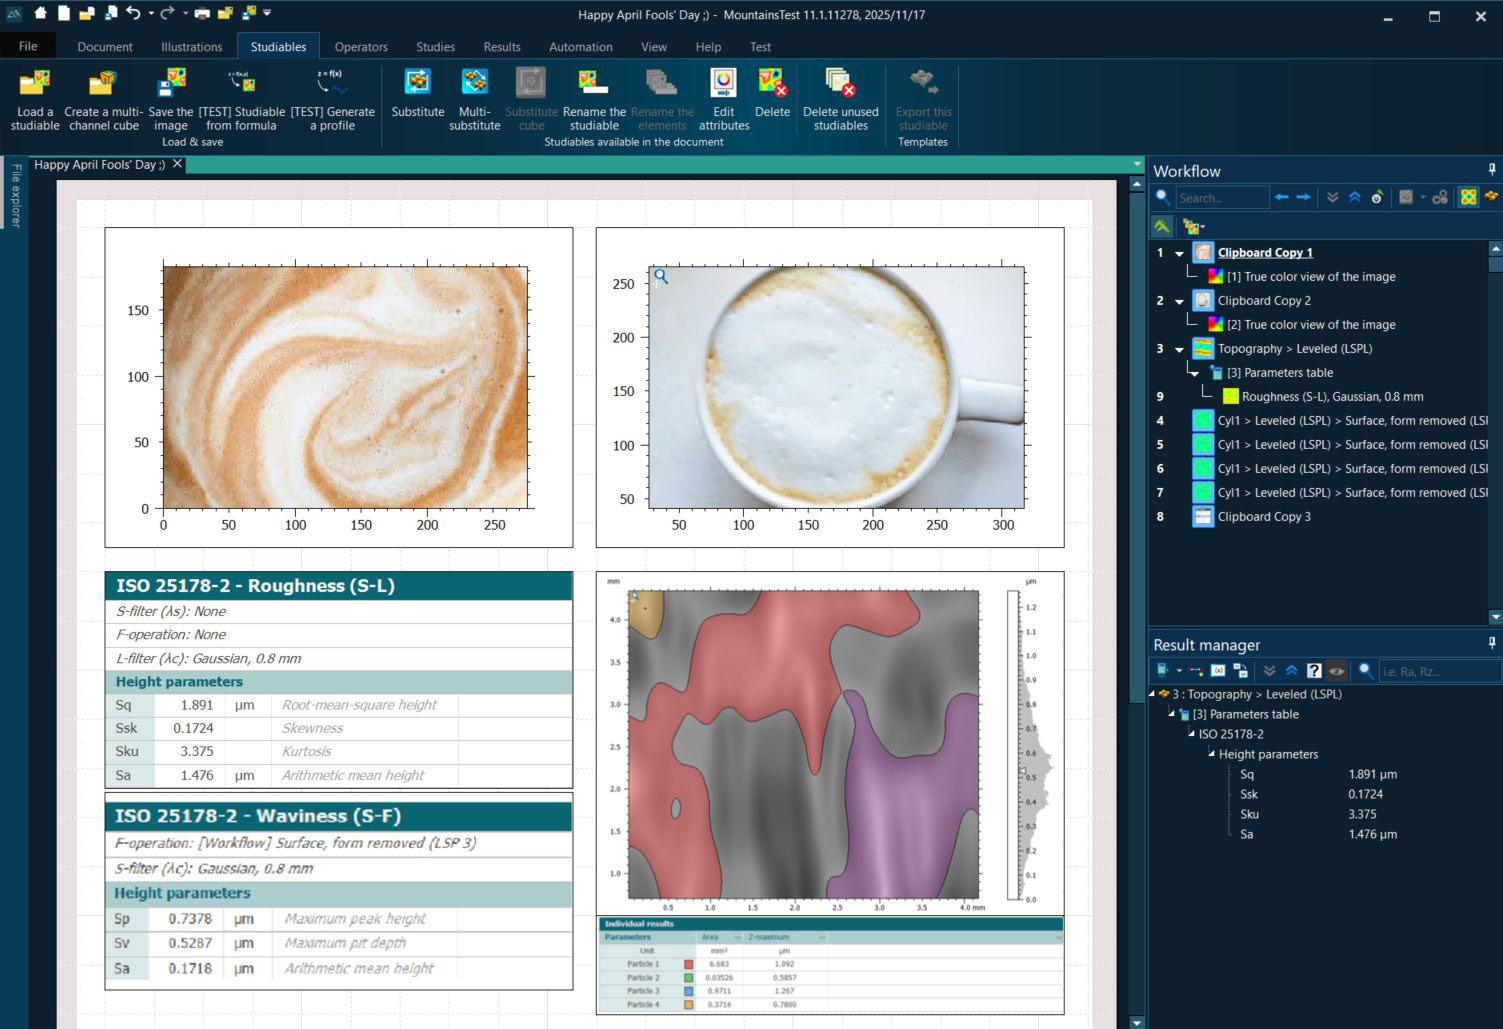
Did you hear we’re making coffee analysis our priority? Because we know how important it is to get the perfect cup of coffee before starting your surface analysis, we’ve created a brand-new module. Available only on April Fools’s Day: bit.ly/4cSIPe6
POPULAR ON FACEBOOK
Did you catch our Surface Metrology Cheat Sheet? It covers essential terms that every engineer and researcher should know, check it out: bit.ly/4tbZWhq
Have you been to our YouTube channel ?
We have lots of quick, helpful videos, as well as tutorials on Mountains® software basic and advanced features, check them out: bit.ly/2U2I2za
Surface Newsletter
Know a friend or colleague who would be interested in receiving the Surface Newsletter?
Let us know : contact@digitalsurf.com
The newsletter is available for download on our website www.digitalsurf.com
Useful LINKS
HQ, R&D Center
16 rue Lavoisier
25000 Besançon - France
Tel: +33 38150 4800
contact@digitalsurf.com
TRY MOUNTAINS® SOFTWARE
Take Mountains® for a test drive
Visit www.digitalsurf.com/free-trial
CONTACT US FOR AN UPDATE
Contact sales@digitalsurf.com for information about updating from previous versions to the latest Mountains® version
WATCH A MOUNTAINS® TUTORIAL
Get the most out of Mountains® software by watching one of our video tutorials www.digitalsurf.com/tutorials
LEARN SURFACE METROLOGY
Dive into our free online surface metrology guide and learn about characterizing surface texture in 2D and 3D www.digitalsurf.com/guide
CATCH UP WITH US
Forum des microscopies à sondes locales
June 8-12, 2026 | Paris, France
Euspen Conference
June 8 - 12, 2026 | Krakow, Poland
2nd European Meeting on Infrared Nanospectro-Imaging