SURFACE FALL 2026
Newsletter
Surface imaging, analysis & metrology news from Digital Surf
Join us!
www.digitalsurf.com
IN THIS ISSUE
CELEBRATING 40 YEARS OF ATOMIC FORCE MICROSCOPY
40 YEARS OF AFM NEW MOUNTAINS® 9.3 Happy 40th birthday Accelerating surface atomic analysis force microscopy! automation... and much more
APPLICATION
Multi-scale tribology Force spectroscopy: of brake friction Strengthening polylactic acid polymers by calcification
HOW TO SPOTLIGHT FEATURE Extract quantitative Welcome to the fascinating information from your worldimages of fiber analysis SEM
SURFACE METROLOGY METROLOGY SURFACE Q&A Should I clean up my measured surface? What cut-off value should I use?
NEWS && SOCIAL EVENTS PRODUCTS Events highlights WHAT’S HOT ONLINE What’s hot online
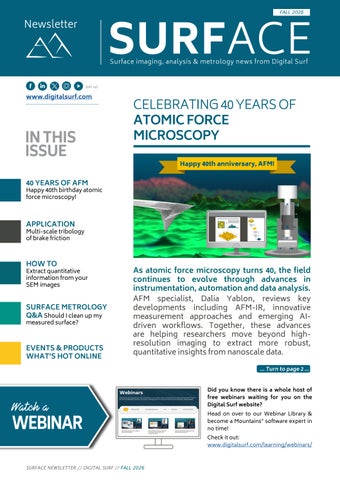
As atomic force microscopy turns 40, the field continues to evolve through advances in instrumentation, automation and data analysis. AFM specialist, Dalia Yablon, reviews key developments including AFM-IR, innovative measurement approaches and emerging AIdriven workflows. Together, these advances are helping researchers move beyond highresolution imaging to extract more robust, quantitative insights from nanoscale data.
Watch a
WEBINAR SURFACE NEWSLETTER // DIGITAL SURF // FALL 2026
… Turn to page 2 … Did you know there is a whole host of free webinars waiting for you on the Digital Surf website? Head on over to our Webinar Library & become a Mountains® software expert in no time! Check it out: www.digitalsurf.com/learning/webinars/
2
40 YEARS OF AFM
HAPPY 40TH BIRTHDAY ATOMIC FORCE MICROSCOPY! As atomic force microscopy (AFM) celebrates its 40th anniversary, the technology continues to evolve beyond high-resolution imaging toward increasingly automated, multimodal and quantitative characterization. In this article, Dalia Yablon, AFM specialist and longtime contributor to the microscopy community, explores the key innovations shaping the field and the growing role of advanced data analysis in nanoscale research. It’s been 40 years since a group of academic and industrial scientists invented atomic force microscopy. In their seminal paper, Atomic Force Microscope, published in 1986 in Physical Review Letters, Gerd Binnig and Christoph Gerber of IBM Zurich and Calvin Quate of Stanford University highlighted a technique capable of investigating insulating surfaces on an atomic scale.
developments commercialized in the 2010s and 2020s have truly moved the field forward.
They demonstrated that it was non-destructive and offered remarkable lateral and vertical resolution. While these fundamental strengths remain unchanged, AFM has continued to evolve into a premier nanoscale characterization technique for topography alongside electrical, mechanical, and optical properties in virtually any environment.
Another innovation that has only recently become commercially available is interferometric detection of cantilever motion instead of conventional optical beam-deflection methods. This enables more accurate displacement measurements and offers significant advantages for techniques such as piezoforce microscopy.
EASIER TO USE, MORE POWERFUL
The first instruments were considerably more difficult to use than today’s systems, many of which offer automated laser alignment, automated tip approach, and commercially fabricated cantilevers. Yet some of the most significant hardware
Several manufacturers now offer photothermal cantilever excitation for dynamic (tapping) methods using lasers rather than piezos. This provides cleaner excitation and tuning of the cantilever, particularly important for imaging in fluid environments where oscillations are strongly damped.
THE GROWTH OF AFM-IR
One area that has seen particularly strong growth over the past decade is AFM-IR, a family of techniques that combines AFM platforms with infrared spectroscopy to provide high-resolution chemical information together with topographical and mechanical data.
Above. Birth and rise of AFM over the last 40 years.
SURFACE NEWSLETTER // FALL 2026
40 YEARS OF AFM
While different AFM-IR implementations offer varying resolution limits, benefits and drawbacks, the capability to obtain sub-micron chemical information addresses an important need across industries ranging from semiconductors to chemicals. AFM-IR is expected to remain a significant growth area in the years ahead.
NEW EXPERIMENTAL APPROACHES
A recently developed approach that rethinks conventional AFM operation is Reverse Tip-Sample SPM. In this configuration, the sample is mounted onto a tipless cantilever and scanned over arrays or sets of probes. This method reduces the need to handle delicate cantilevers and enables faster measurements of the same sample with multiple probes, helping to eliminate some of the practical challenges associated with traditional AFM workflows.
BEYOND IMAGING: QUANTITATIVE ANALYSIS
Hardware developments tell only part of the story. Image processing and analysis have evolved in parallel to meet the needs of a community generating data at increasing speed and complexity through high-speed imaging, correlative methods, and multimodal techniques. This is where MountainSPIP® comes into play, offering a complete environment for traceable, automated and multi-technique analysis. Every processing step is documented in a reproducible workflow, making it easier to standardize analyses and compare results across instruments.
Above. Mountains® workflow allows full AFM analysis traceability.
Artificial intelligence is also becoming an increasingly important part of both AFM instrumentation and data analysis. Within Mountains®, machine learning is helping users sort and cluster large force-distance curve datasets, filter out artifacts and group similar behaviors before model fitting begins. Combined with automated selection of contact mechanics models such as Hertz, DMT and JKR, this helps ensure more reliable mechanical property measurements and faster extraction of meaningful results.
Above. Machine learning is already proving especially effective for sorting and clustering large force-distance curve datasets.
READ FULL ARTICLE
For a more detailed look at the latest advances in AFM instrumentation, data analysis and AI-assisted workflows read the full version on this article online: www.digitalsurf.com/ news/happy-40th-birthday-atomic-force-microscopy-afm
SURFACE NEWSLETTER // FALL 2026
3
4 4
APPLICATION
MULTI-SCALE TRIBOLOGY OF BRAKE FRICTION Brake performance results from complex interactions between surface structures acting at different scales. A recent study by researchers at LAMIH and LaMcube laboratories in the Hauts-de-France region demonstrates how multi-scale surface analysis can help identify the topographical features that govern friction, wear and braking efficiency. In vehicle braking systems, surface topography plays a critical role in friction, wear and overall function. Understanding how surface structures evolve over time and interact at different scales is essential for improving tribological performance. This challenge is at the core of research conducted by scientists from LAMIH UMR CNRS 8201 and LaMcube UMR CNRS 9013 laboratories.
The team used: ▶ 3D view ▶ Height histograms ▶ Photo simulation ▶ Watershed-based particle analysis ▶ Profile extraction ▶ Gaussian and robust Gaussian filtering ▶ Abbott-Firestone curves
The study relied extensively on MountainsMap® software to analyze, visualize and process large volumes of surface topography data.
These tools helped characterize the size, shape and distribution of surface features involved in friction and wear processes.
A WORKFLOW FOR LARGESCALE TRIBOLOGY STUDIES
“In the early stages of analysis, I intentionally avoid focusing too much on roughness parameters. I first try to understand the morphology and organization of the surface structures visually,” explains Robin Guibert.
The team used MountainsMap® across four major stages: data quality control, surface inspection, automated calculations and scientific interpretation.
Ensuring measurement quality
Before analysis began, every measured surface was visually inspected to guarantee data reliability. “Even when I work with several thousand surfaces, I systematically inspect each one individually,” comments Robin Guibert, one of the researchers involved in the study. Quality control relied on visualization tools including 3D view, photo simulation, surface series visualization and 4D views for time-evolving surfaces. The objective was to detect and correct measurement artifacts such as inconsistent signals, stitching defects or large non-measured areas.
Investigating friction surface morphology
Once validated, the surfaces were explored in detail to identify the morphological structures influencing tribological behavior.
SURFACE NEWSLETTER // FALL 2026
Automated analysis at scale
The third stage focused on large-scale automated surface correction, filtering and parameter calculations. In some cases, roughness parameters were calculated on more than 200,000 surfaces. To process these datasets efficiently, Robin Guibert developed an advanced MATLAB automation framework inspired by the MESRUG program originally developed by Professor Maxence Bigerelle. The system automatically controls MountainsMap® in batch mode and can launch up to 12 parallel instances simultaneously. “MountainsMap® is robust enough to run fully automated calculations continuously for several weeks,” says Robin. Using this framework, the team performed: ▶ Form removal ▶ Filling in of non-measured points ▶ Metrological filtering
APPLICATION Right. Topographies of the braking pad surface after various numbers of braking tests.
▶ Multi-scale decomposition ▶ Particle analysis ▶ Roughness parameter calculations
The authors noted that ISO compliance was a major reason for relying on MountainsMap® in tribology research.
From data to tribological insights
Beyond roughness calculations, the final objective was to generate meaningful scientific insights. The team correlated surface morphology, roughness parameters, tribological test bench results, physical context and theoretical models.
MountainsMap® played a central role thanks to its visualization capabilities and ability to compare multiple surfaces simultaneously. 3D views, photo simulations, particle analyses and parameter tables were used to create publication-ready figures and highlight friction-related mechanisms.
The researchers showed that multi-scale analysis makes it possible to distinguish between honing and cutting mechanisms. Honing truncates surface peaks and generates wear plateaus, while cutting produces grooves across the pad surface.
Third-body particles trapped in wear tracks can also become compacted into plateaus.
KEY FINDINGS
One of the most significant outcomes was the identification of specific surface scales linked directly to brake friction performance and wear.
The researchers demonstrated that different tribological phenomena are governed by different topographical scales. Surface wear was strongly associated with mesoscopic plateaus around 0.5 mm, while braking efficiency was linked to summit density at much smaller scales around 20 μm. The study also highlighted the importance of wear plateaus formed during braking, either from damaged surface peaks or compacted third-body particles. More broadly, the research showed that brake friction cannot be understood through a single roughness parameter or a single observation scale. Instead, the combination of multi-scale surface analysis, ISO-compliant roughness calculations and advanced visualization provides a powerful framework for understanding and optimizing braking systems.
INSTRUMENTS & SOFTWARE USED
Focus variation microscopy (PortableRL, Bruker Alicona) & MountainsMap® software
READ MORE
▶ Guibert, R. et al. Multiscale and Multiphysics Topographical Analysis of Brake Friction Material Related to Friction Performance. Lubricants 2026, 14, 139. doi.org/10.3390/lubricants14030139 ▶ Anscale – www.anscale.fr – Surface topography consulting and analysis services – robinguibert@anscale.fr
SURFACE NEWSLETTER // FALL 2026
5 5
6 6
HOW TO
EXTRACT QUANTITATIVE INFORMATION FROM YOUR SEM IMAGES For many SEM users, image interpretation remains a largely visual exercise. Yet modern image analysis tools increasingly allow researchers to move beyond observation and turn micrographs into measurable datasets that support R&D, quality control and manufacturing decisions. As demonstrated during a recent webinar by Benoit Zupancic, Product Manager for SEM at Digital Surf, the key lies in combining image processing, automated detection, statistical analysis and reproducible workflows.
FROM PARTICLES TO DATA
Nanoparticle characterization is a common application of SEM image analysis. Particle size, shape and morphology directly influence material properties, making accurate measurement essential in fields ranging from advanced materials development to quality assurance. The challenge is that SEM images are rarely perfect. Noise, uneven illumination, overlapping particles and imaging artifacts can all affect measurements. Before any quantitative analysis can begin, images often need preprocessing to reduce noise while preserving important boundaries. Once prepared, AI-driven segmentation can automatically distinguish particles from the background. Rather than relying on manual measurements, researchers can generate a complete dataset describing each detected particle through parameters such as area, diameter or aspect ratio. Classification tools then help exclude false detections and outliers, ensuring that only relevant objects are included in statistical calculations.
The result is a workflow that transforms a single image into a structured dataset and can subsequently be applied to entire image collections with consistent settings.
CHARACTERIZING REPEATED STRUCTURES
SEM is also widely used to inspect periodic structures such as photonic crystals, microfabricated components or patterned surfaces. In these cases, researchers are often interested in dimensions, geometry and manufacturing consistency. Instead of manually measuring each feature, image analysis software such as MountainsSEM® can identify every occurrence of a repeating pattern from a single user-defined reference. Contours can then be extracted automatically and compared against ideal geometries such as circles. This approach enables the calculation of key metrics, including feature diameter and deviations from the expected shape. By comparing these measurements against predefined tolerances, manufacturers can rapidly assess whether a component meets specifications or if process adjustments are required. Importantly, these measurements are not limited to individual structures. Automated analysis allows hundreds or thousands of features to be characterized using exactly the same criteria, reducing operator bias and improving repeatability.
UNDERSTANDING FIBER ORIENTATION
Above. AI-driven segmentation can automate particle detection and parameter calculation.
SURFACE NEWSLETTER // FALL 2026
Fiber-reinforced materials present another common challenge for SEM users. Mechanical loading can induce changes in fiber orientation, with fibers tending to align along the direction of applied tensile forces thus influencing material performance.
HOW TO
Above. Detecting and characterizing repeating patterns in photonic crystals: contour extraction and deviation analysis.
Quantifying such changes requires more than visual comparison. One option is texture analysis, which evaluates the directional nature of an image and produces an isotropy parameter. Low values indicate strong alignment in a particular direction, while higher values suggest a more random arrangement. For a more detailed analysis, individual fibers can be segmented and measured. Orientation distributions, fiber diameters and population statistics can then be compared across samples. By applying identical workflows before and after testing, researchers can objectively quantify structural changes even when the exact same fibers cannot be imaged twice.
THE IMPORTANCE OF REPRODUCIBILITY
Across all three use cases, a central message emerges: quantitative SEM image analysis is not just about automation. The real value comes from reproducibility. By preserving every step of the workflow, from preprocessing and segmentation to classification and statistical reporting, researchers can apply the same methodology to new datasets with confidence. As SEM datasets continue to grow, the ability to transform images into reliable numerical information is becoming essential. The future of microscopy analysis lies not only in seeing structures, but in measuring them consistently and turning observations into actionable insights.
Above. Analyze fiber orientation and investigate the influence of mechanical constraints. Left. Calculating global surface isotropy. Right. Analyzing orientation of individual fibers.
SEE IT IN ACTION
Watch our free webinar and learn how to obtain quantitative information from your SEM images: www.digitalsurf.com/webinars/sem-image-analysis-from-images-to-quantitative-insights
SURFACE NEWSLETTER // FALL 2026
7
8
SURFACE METROLOGY Q&A
SHOULD I CLEAN UP MY MEASURED SURFACE? Optical surface measurements sometimes contain isolated spikes or areas where no height could be measured. Analysis software provides tools to remove outliers and fill-in non-measured points, often producing a much cleaner-looking surface. But how can we tell whether these corrections improve the measurement or remove information that matters? François Blateyron, Digital Surf’s senior surface metrology expert, explains how to make informed choices before calculating surface texture parameters.
THE MAP IS NOT THE TERRITORY
A measured topography represents a surface as seen through an instrument. We never actually access the real surface. The measurement principle, probe or objective, sampling interval and acquisition settings determine which details are captured and how faithfully they are reproduced. Different configurations may therefore produce different views of the same surface. Thus the difficulty in comparing several measurements done by different instruments. Some features may be too small to resolve, too steep to access or too difficult to detect reliably. Noise adds height variations, measurement artifacts introduce false features and unsuccessful measurements leave non-measured points. What appears on screen reflects both the surface and the limitations of the measurement process. Before calculating parameters, we must therefore ask: which features really belong to the
surface, and which were introduced by the measurement?
STABILITY, OR THE ART OF REPETITION
Acquiring several measurements at the same location and combining them point by point can improve the resulting topography, provided the surface remains unchanged and the datasets are correctly aligned. The averaging process reduces random noise. A pointwise median is less sensitive to occasional extreme values, such as outliers appearing in only part of the acquisition. Repetition cannot eliminate systematic errors or reveal details beyond the instrument’s capabilities. Misalignment and drift can blur genuine features, while non-measured regions appearing on all measured surfaces will remain unknown. Counting how many valid
Above. Example of 10 areal measurements, done at the same place, in a short period of time. The left image shows the mean surface; the right image shows the standard deviation, revealing instabilities during repetitions, mainly located around grooves where the instrument struggles to obtain reliable measurements. The variability represents 6% of the surface amplitude.
SURFACE NEWSLETTER // FALL 2026
SURFACE METROLOGY Q&A
Above. Filling in non-measured points can be useful, especially with individual points or small regions (case A), or may generate smooth regions (case B) where surface complexity decreases. Impact on parameters will be almost invisible with case A regions, but may be significant in B regions. Leaving non-measured points untouched on a surface is sometimes a sound decision as they will not be taken into account in calculations, contrary to interpolated points that will contribute to the parameter results.
measurements contribute to each point is a way to assess the quality of the acquisition. Locating areas where the highest variations occur can reveal unstable regions.
indication of what lies inside the gap. Interpolation produces estimates, not additional measurements. And interpolated regions are smooth and less complex than their surroundings.
TO CORRECT OR NOT TO CORRECT
IMPROVING DATA, PRESERVING INFORMATION
Leaving data untouched may seem the safest choice, yet retaining confirmed measurement artifacts can distort the analysis. A few spurious spikes (outliers) may dominate height parameters or disturb leveling and filtering. Removing them is justified when they have been reliably identified as errors. An unusual height alone, however, does not always prove that a point is incorrect: a sharp peak or deep pit may sometimes be real. Non-measured points require a different form of judgment. Interpolating a small, isolated gap is usually reasonable when the surrounding topography is continuous and sufficiently sampled. But filling a large region is more speculative, especially across a groove, pore or edge. Missing points often occur where the instrument struggles, so neighboring heights may provide a poor
Correction should therefore depend on the defect, its spatial extent and the intended analysis. Compare the topography and relevant parameters before and after processing: excessive smoothing may erase details that matter to the surface’s function. Preserve the original data and document the correction settings. Where substantial information is missing, a new acquisition with a more suitable configuration may be necessary. But on the other hand, calculating surface texture parameter on a surface affected by many outliers is for sure a mistake, especially with some parameters that are more sensitive or unstable. The golden rule? A cleaner-looking surface is only useful if it supports a more faithful analysis.
FURTHER READING
▶ Preprocessing surfaces: www.youtube.com/watch?v=kT6kjpbUP48 ▶ Filtration techniques, section 12: guide.digitalsurf.com/en/guide-filtration-techniques.html ▶ Scaling laws of mean and uncertainty in 3D surface texture measurements: iopscience.iop.org/ article/10.1088/2051-672X/ae43db
▶ ISO 16610-30:2015, Geometrical product specifications (GPS) — Filtration Part 30: Robust profile filters: Basic concepts
SURFACE NEWSLETTER // FALL 2026
9
10 10 EVENT & PRODUCT HIGHLIGHTS
A SEASON OF EVENTS IN A FEW FIGURES Knowledge sharing was also a major focus throughout the season. Digital Surf experts delivered six oral presentations and scientific talks, covering topics ranging from surface characterization and particle analysis to AFM force curve analysis. In addition, we organized three hands-on workshops, giving participants the opportunity to explore Mountains® software in real-world scenarios and gain practical experience using its advanced analysis tools. Above. Benoit, Emmanuel, Anne & Lucie at the International Microscopy Congress (IMC) 2026 in Liverpool, UK.
What a busy and rewarding season it has been! As the year draws to a close, we would like to look back at some of the highlights through a few key figures. Over the past six months, Digital Surf participated in 12 events across the globe. From France to the United States, via the United Kingdom and Japan, our team traveled through six countries on three continents to connect with customers, partners, researchers and industry professionals. More than ten Digital Surf experts took part in these events, engaging in countless discussions about applications, measurement challenges, and emerging trends in surface metrology and image analysis. Our team was delighted to welcome visitors at six exhibition booths, where attendees could discover the latest developments in Mountains® software through live demonstrations and oneon-one exchanges.
Beyond the numbers, these events provided invaluable opportunities to meet passionate scientists, researchers and industry experts tackling some of today’s most exciting challenges. Every conversation offered fresh perspectives, inspiring ideas, and deeper insights into the evolving needs of our community. A sincere thank you to all our visitors, customers, partners, and collaborators. We greatly appreciated your presence, your questions and the many enriching discussions we shared throughout this event season.
NEW MOUNTAINS® 11.3
The latest version 11.3 of Mountains® software was released in September. This new interim version introduces new features that once again enhance the performance and user experience of the software platform.
Among these new features, users can access more powerful 3D visualization, asynchronous calculations for quicker visualization, new parameters in particle analyses and much more.
Above. Nils giving a presentation on MountainsSPIP® during the Forum des Sondes Locales (SPM meeting) in St Rémy, France.
SURFACE NEWSLETTER // FALL 2026
The full list of new features included in this version and the different update options are available here: bit.ly/whats-new-11-3
SOCIAL
WHAT’S HOT ONLINE Have you been to our YouTube channel ?
LOVED ON LINKEDIN
Our team joined forces with Bruker and the University of Mons (Belgium) to celebrate the 40th anniversary of AFM during Bruker’s AFM days. The day was filled with workshops, conferences and thought-provoking chats! bit.ly/4BFSwYT
We have lots of quick, helpful videos, as well as tutorials on Mountains® software basic and advanced features, check them out: bit.ly/2U2I2za
Surface Newsletter Know a friend or colleague who would be interested in receiving the Surface Newsletter? Let us know : contact@digitalsurf.com
POPULAR ONLINE
Our Online Store has officially opened! This new space allows our clients with a Software Maintenance Plan (SMP) to manage it quickly and easily. Take a look: bit.ly/4sRMCQI
The newsletter is available for download on our website
www.digitalsurf.com
SURFACE NEWSLETTER // FALL 2026
11
Useful LINKS
30
DAYS TRIAL
TRY IT FOR
FREE
TRY MOUNTAINS® SOFTWARE
Take Mountains® for a test drive Visit www.digitalsurf.com/free-trial
CONTACT US FOR AN UPDATE
Contact sales@digitalsurf.com for information about updating from previous versions to the latest Mountains® version
WATCH A MOUNTAINS® TUTORIAL
Get the most out of Mountains® software by watching one of our video tutorials www.digitalsurf.com/tutorials
LEARN SURFACE METROLOGY
Dive into our free online surface metrology guide and learn about characterizing surface texture in 2D and 3D www.digitalsurf.com/guide
CATCH UP WITH US 2026 MRS Fall Meeting & Exhibit | Booth 716 Dec 1-3, 2026 | Boston, MA, USA Pittcon 2027 Conference + Expo | Booth 1431 Apr 26-28, 2027 | Pittsburgh, PA, USA
HQ, R&D Center 16 rue Lavoisier 25000 Besançon - France Tel: +33 38150 4800 contact@digitalsurf.com
www.digitalsurf.com
Surface Newsletter, Nov 2026
Editor : Christophe Mignot Content editor : Clare Jamet Contributors : Laure Aubry, François Blateyron, Eugenia Capitaine, Mathieu Cognard, Robin Guibert, Dalia Yablon, Benoit Zupancic. Copyright © 1996-2026 Digital Surf, all rights reserved