Land Acknowledgment We acknowledge that the municipality of Blue Island has incorporated on Native American lands, taken from the tribes of the Ottawa, Ojibwa, Fox, and Potawatomi, who lived along and protected the waterways until their forced removal in 1835. This dedication reminds us that in order to be respectful of the past, we must steward the land for the future.
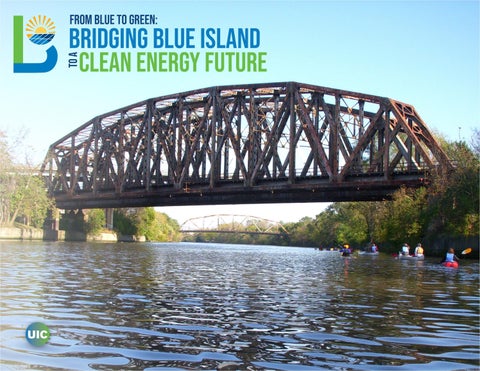
Acknowledgments College of Urban Planning & Public Affairs Dr. Nebiyou Tilahun Dr. Curt Winkle Midterm Jurors: Lindy Wordlaw, AICP Anne McKibben Dr. Khier Al-Kodmany Dr. Theresa Cordova Dr. Ning Ai Final Jurors: Michael Blue, FAICP Anton Rozhkov Dr. Eman Y. Shoeib Cover Photo: Amy Malysa (2011).
From Blue to Green: Bridging Blue Island to a Clean Energy Future was completed as part of the UPP 505: Plan Making and UPP 506: Plan-Making Studio in Spring 2021 at the University of Illinois at Chicago. This plan was developed in consultation with: Howard Coppari, LEED AP Community Development Manager for the City of Blue Island Kara Riggio High Bridge Consultant for Opportunity Advancement Innovation The Chicagoland Vintage Home Association Joe O’Meara of Blue Island Organic Sustainable (BIOS) Farm
Letter of Transmittal April 30th, 2021
☀ College of Urban Planning and Public Affairs 412 S Peoria St, Chicago, IL 60607
☀ Blue Island Planning Department
13051 Greenwood Ave, Blue Island, IL 60406
Dear esteemed colleagues and friends, It is our pleasure to present our semester-long work titled, From Blue to Green: Bridging Blue Island to a Clean Energy Future, an energy plan that centers on equity, resiliency, and community to propel Blue Island forward into an uncertain future. This project was facilitated by the University of Illinois at Chicago (UIC) in order for our team to fulfill the requirements of our core courses of Plan Making and the Plan Making Studio within our Master’s degree program in Urban Planning and Policy (UPP). Within this report, the reader will find a culmination of our planning skills, data analyses, research, and knowledge obtained throughout the past four months. Our plan illuminates the inner workings of Blue Island today in an attempt to better prepare for the City’s tomorrows along with the many years to come. If any questions arise or if clarification is needed, please feel free to reach out to our team. Once again, thank you to the City of Blue Island, our University, and our Professors, Dr. Curt Winkle and Dr. Nebiyou Tilahun, for the opportunity to develop this energy plan and to learn more about the wonderful city of Blue Island, Illinois. Sincerely, Our Team
ABBY Ebelherr
FLORA Ramirez
EDITH Portales
DIMITRI Nesbitt
VICTORIA Kurlander
BIANCA Joseph
SARAH Grumulaitis
HEAVEN Silva
NANDU Dubey
Table of Contents Executive Summary........................................................................07 Resumen Ejecutivo.........................................................................08 Uniendo Blue Island Hacía un Futuro de Energía Limpia...... 09 Introduction.......................................................................................10 A Clean Energy Vision....................................................................................... 10 Why this Plan and Why Now........................................................................12 Study Area..................................................................................................................13 Community Profile...........................................................................14 History.......................................................................................................................... 14 Land Use.....................................................................................................................15 Transportation.........................................................................................................17 Water & System Infrastructure....................................................................21 Population & Economic Dashboard........................................................22 Current Energy Consumption.....................................................................24 Conclusion......................................................................................... 27 Evaluating Progress....................................................................... 28 Policy Proposals Table................................................................... 29 Green Economy................................................................................ 30 1.0 Microgrid...................................................................................... 30 1.1 Solar-Powered Homes................................................................................32 1.2 Municipal Buildings Microgrids..........................................................34 1.3 Solar Farm..........................................................................................................35 1.4 Wind Turbines.................................................................................................36 2.0 Economy...................................................................................... 38 2.1 Cargo Oriented Development..............................................................38 2.2 Workforce Development.........................................................................40 Conclusion......................................................................................... 41 Energy Efficiency............................................................................ 42 3.0 Housing...............................................................................................................42 3.1 Home Weatherization................................................................................44 3.2 Community Education.............................................................................45
3.3 The Repurpose Project.............................................................................46 3.4 Anti-Gentrification Housing Ordinance.......................................47 4.0 Transportation.......................................................................... 48 4.1 Intersection and At-Grade Crossings..............................................48 4.2 LED and Solar Street Lights..................................................................50 4.3 Bike Infrastructure......................................................................................51 4.4 Parklets...............................................................................................................52 5.0 Heat Island Effect..................................................................... 55 5.1 Programming Parking Lots...................................................................55 5.2 Tree Canopy Restoration and Expansion.....................................57 5.3 Municipal Green Roofs..............................................................................58 5.4 Urban Agriculture........................................................................................60 5.5 Greener Landscape Ordinance...........................................................62 6.0 Waste Management................................................................ 63 6.1 A New Recycling Program......................................................................63 6.2 Combined Sewer System Efficiency...............................................65 7.0 Zoning........................................................................................... 66 7.1 Weatherization Program and Landmarked Structures......66 7.2 Solar Panels Outside the UTOD Area..............................................67 7.3 New Zoning Ordinance for Urban Agriculture.........................67 Conclusion......................................................................................... 68 Implementation Timeline............................................................. 69 A Greener Future Lies Ahead...................................................... 70 Appendix............................................................................................ 72 A.1 Methodology...................................................................................................72 A.2 Housing Energy Burden.........................................................................73 A.3 Weatherization Program & Landmarked Structures Text Amendment.................................................................................................74 A.4 Productive Land Zoning District for Urban Agriculture Text Amendment.................................................................................................75 A.5 Policy Proposal Details.............................................................................79 References & Visualization Credits...........................................................80
table of FIGURES Introduction Figure 1-1: Map of Study Area.................................................................. 13 Community Profile Figure 2-1: Land Use....................................................................................... 16 Figure 2-2: Transportation Routes....................................................... 17 Figure 2-3: Freight Network..................................................................... 17 Figure 2-4: Proposed Cargo Oriented Development Northeast Blue Island.................................................18 Figure 2-5: How Does the System Work When it Rains?..... 21 Figure 2-6: Routine Maintenance Costs in a Typical Year by Latinx Origin....................................................................................24 Figure 2-7: Unit Energy Efficiency Home Improvements by Latinx Origins.........................................................24 Figure 2-8: Heat Island Map for Blue Island................................. 26 Green Economy Figure 3-1: Diagram of Microgrid System Infrastructure..... 31 Figure 3-2: Proposed Municipal Buildings Microgrid............34 Figure 3-3: Solar Farm Site & Adjacent Land Use..................... 35 Figure 3-4: IAIS Intermodal Facility Map........................................38 Energy Efficiency Figure 4-1: Map of At-Grade Crossings in Northeast tract.48 Figure 4-2: Diagram of LED Solar Street Lights........................50 Figure 4-3: Western Avenue Parklets & Bikelane Proposal.......................................................................................... 53 Figure 4-4: Proposed Municipal Buildings Green Roofs.....58 Figure 4-5: Current Waste Bins............................................................64 Figure 4-6: Blue Island Zoning Map, 2017.....................................66 Conclusion Figure 5-1: Implementation Timeline for a Green Economic Future............................................................................69 Figure 5-2: Implementation Timeline for an Energy Efficient City....................................................................................69
Amy Malysa (2011), Dimitri Nesbitt (2021), Victoria Kurlander (2021).
In 2021, Illinois lawmakers reintroduced The Clean Energy Jobs Act, which calls for transitioning the state to 100 percent renewable energy by 2050. All cities in Illinois must do their part to meet this goal, concurrently updating their current infrastructure and implementing new green technology. This strategic energy plan seeks to do both by focusing on the goals to reduce energy usage and foster a local green economy, while also prioritizing equity, resiliency, sustainability, implementation, efficiency, and scalability by 2040. This plan focuses on a study area within the city of Blue Island, Illinois which reflects the characteristics of the whole of the city based on demographic, economic, and land use patterns. The proposals to be implemented in this study area can easily be replicated throughout the whole of Blue Island. To foster a local green economy, over the next 20 years, Blue Island will establish transitional microgrids on municipal buildings as well as local generation of power through a solar farm and several wind turbines. The city will also leverage its manufacturing capacity and cargo oriented development to attract the green technology industry. Blue Island will provide opportunities and financial support for green technology training through workforce development programs to ensure all residents can participate in the new economy. Blue Island will implement sustainable technology to address energy inefficiencies in its infrastructure, including updating the insulation features of all residential buildings and addressing connectivity gaps to make alternative transportation in the city more desirable. To reduce the energy needed to cool and heat buildings, the city will restore its tree canopy, install green roofs on municipal buildings, and encourage urban agriculture. Current recycling services will be expanded to include organic waste pickup and divert reusable materials from landfills. Finally, Blue Island will adopt sustainable and energy efficient sewer management practices with the aid of new technology. With this strategic plan, Blue Island will not only meet Illinois’ goal for carbon neutral electricity production by 2050, but will also exceed it by becoming a city well-prepared to step into the next age of green technology.
EXECUTIVE SUMMARY
Executive Summary
7
Resumen Ejecutivo reducir el consumo de energía y al la vez equidad resiliencia sostenibilidad
Flora Ramirez (2021).
eficiencia
adaptabilidad
Para el 2040 Blue Island será una comunidad accesible con viviendas energéticamente eficientes y áreas transitables, tomando en cuenta que su buena ubicación en la zona metropolitana de Chicago. En Blue Island se podrían ofrecer empleos dentro de la ciudad para los residentes a través del mejoramiento de la conexión de tránsito y de la implementación de la energía solar. Esta transición se completará con políticas que dan preferencia a una economía verde y equidad en todas sus formas, ofreciendo opciones y seguridad a sus residentes y al ambiente alrededor.
EXECUTIVE SUMMARY
Conozca más sobre la visión de nuestra ciudad y algunas de las propuestas que la lograrán!
9
Introduction
Amy Malysa (2011).
A CLEAN ENERGY VISION All across the country, there are many solutions being implemented to protect and halt the devastating effects of climate change. At the center of these solutions are the goals of increasing energy efficiency and transitioning to clean energy. It is imperative that Blue Island embed these principals in its long-term energy strategy. This energy plan presents a wide range of solutions that address both energy efficiency and transition to clean energy while also combating energy issues in housing, economics, and transportation. With regards to housing, homes will be more energy efficient through a weatherization program. Additionally, Blue Island would be keeping up with the surrounding area’s energy plans by engaging in solar and wind power on a larger scale. As of today, there is neither a focus on green jobs nor any workforce training for green jobs within the municipality. Our plan is beneficial to the economy of Blue Island because we intend on creating green job opportunities within the community. Finally, this plan attempts to resolve transportation issues by making the municipality more accessible for pedestrians, revitalizing the city’s freight infrastructure, and highlighting public transportation in the area. The outdated transportation infrastructure of the municipality leads us to believe that the time is now to update Blue Island’s energy plan.
VIS ION STATEMENT
By 2040, Blue Island will be a community of affordable, energy-efficient housing and walkable neighborhoods. Capitalizing off its accessible location in the greater Chicago area, Blue Island will provide local, green jobs for its residents and neighbors by enhancing transit connectivity and the implementation of solar energy. This transition will be completed with the enactment of policies that prioritize a green economic future and equity in all its forms, offering choice, security, and safety to its residents and the surrounding environment.
INTRODUCTION
This plan is guided by two goals: Energy efficiency is the goal to retro-fit infrastructure or amend policies to reduce energy usage. Green economic future is the goal to introduce new elements to Blue Island’s energy system and infrastructure to increase adaptability to new green technologies and increase usage of clean energy. The plan is guided by six criteria: equity, sustainability, resiliency, implementation, efficiency, scalability. Proposals in this plan not only consider questions of equity and sustainability but also whether ideas can be easily implemented and replicated throughout Blue Island.
11
WHY THIS PLAN AND WHY NOW Blue Island’s neighbors are already moving towards a cleaner energy future. Neighboring Calumet Park recently received funding for a Transit Oriented Development, and just north of the city, Exelon has built a solar farm. Blue Island is primed to set into motion clean and efficient energy projects that will benefit residents well beyond 2040 and ensure the city attracts further investment to remain competitive. Looking at Illinois, the 2016 Future Energy Jobs Act (FEJA) creates a zero emission standard with the goal of carbon neutral electricity generation in the state by 2050. FEJA funds the Illinois Solar program to increase localized solar energy production. Between $250M and $400M will go towards energy efficiency programs per year with $30M for job training.1 In February 2021, the Clean Energy Jobs Act was reintroduced in the state legislature. This act would increase funding for programs created by FEJA by 400%. Additionally, the bill seeks
David Wilson (2006).
to fund transportations projects that reduce gas and diesel emissions.2 Illinois’ direction is towards renewable energy and funding for projects that get communities in Illinois closer to energy efficiency and clean energy will continue to be available.
Blue Island will find aid at more than just the local level. The Biden administration has made the reduction of greenhouse gases by pursuing increased energy efficiency and implementing a clean energy standard a top priority, pushing bills that would require 100% clean energy consumption in the
US by 2035-2050.3 To achieve this goal, the Biden administration has proposed a legislation that would include $174B for electric vehicle inf rastructure, $115B to modernize roads, $50B for infrastructure climate resilience, and $48B for workforce development.
For this energy plan, the study area will focus on three specific census tracts of Blue Island because of their connection to the goals of the comprehensive plan.
The study area was selected for several reasons. First, the study area represents diverse land use and economic patterns. Second, a significant portion of the land use proposals in the comprehensive plan are located within these census tracts. Third,
Figure 1-1: Map of Study Area
the study area provides many opportunities for the city to take advantage of implementing its comprehensive plan goals.
INTRODUCTION
STUDY AREA
Additionally, the study area will be a model for Blue Island in exploring new policies that will help transition the city into a clean energy and greencentered economic future.
13
For ease of identification in this document, the tracts have been renamed as the following: 2 1
3
Cook County Government (2021)
Community Profile A new structure cannot be built without a foundation. To understand where a city is going, it is important to view where it has been and how that past has led to current conditions.
HISTORY The original settlement of Blue Island was erected on the southern edge of a glacial ridge.4 Its success was partially due to the Vincennes Trace, a buffalo migration route used by local Native American tribes such as the Ottawas, Ojibwas, Fox, and Potawatomi. These tribes lived alongside the Little Calumet River until their forced removal in the 1830s. We owe these Tribes recognition for laying the foundation for the future growth of Blue Island, Chicago, and the region, as a whole.5 Blue Island flourished because of its location, a mere 16-mile distance from Chicago. By 1850,
half of Blue Island’s population was either foreign-born or the children of foreign-born residents, leading to a city of diversity, which is still a strength of Blue Island.6 The discovery of clay deposits f rom the glacial lake bed turned Blue Island into a prominent brickmaking town that well lasted over a century. The Chicago, Rock Island & Pacific Railroad company arrived later in 1852, and over the next four decades built several railroad tracks and expansive freight yards, shops,
and a roundhouse, transforming the city from a mere stop along the Vincennes Trace into a major hub of rail and industry. These industrial enterprises led to waves of immigrants, many hailing from Germany, in search of economic opportunity.7 Most
COMMUNITY PROFILE
Blue Island Historical Society (1897-2021).
Victoria Kurlander (2021).
Blue Island Historical Society (1897-2021)
15
Blue Island Historical Society (1897-2021)
Victoria Kurlander (2021).
LAND USE
of the architecture of historical buildings currently in Blue Island reflects this German heritage. Between 2000 and 2010, Blue Island saw over a 30% increase of Latinx residents as new immigrants settled into the community8 9. This newer
population is dealing with post-industrial issues such as outdated inf rastructure and disconnected spatial patterns. Nonetheless, Blue Island is still a place for people to call home. It is a community that thrives due to its proximity to Chicago and a highly diverse population that has the same desire that the original settlers possessed: a place to affirm their values for a better life.
With the majority of Blue Island being single family residential parcels and commercial parcels densely located along Western Avenue, the city realized that revisions to permitted land uses were necessary. The 2012 Comprehensive Plan’s proposed revisions were posed to capitalize on the three largest land uses: residential, industrial, and open space-within Blue Island. This included adding
more multi-family housing along Western Ave. and the easternmost edge of Blue Island, converting portions of freight area to industrial usage for future warehouse developments, and pursuing development along the Little Calumet River in order to allow for more open space. An example of this exists in Blue Island’s unique zoning designation, the Uptown Transit Oriented District (UTOD).
Figure 2-1: Land Use
Created in 2012, the goal of the UTOD was to provide for transit supportive land uses and promote compact development. Parking requirements were decreased to promote mixed use development, commercial uses, and adaptive re-use of buildings. Though on a smaller scale, our
Dimitri Nesbitt (2021).
study area aims to illustrate how we can improve Blue Island’s housing stock, invite energy efficient industry, and increase the open space available to residents. The East tract is also largely
single family homes with the exception of a special use district dedicated to mobile houses. The West and Northeast tract share portions of Western Ave., but both are predominantly single family residences. While opportunities continue to exist
along this commercial corridor, the Northeast tract has an interesting element along the eastern edge known as the Northeast Cargo Oriented Development site, which will be discussed in detail later.
Blue Island has an extensive network of freight and commuter railroads, waterways, and interstate highways and is in close proximity to Midway and O’Hare International Airports. The city is near three major highways: I-57, I-294, and I-80. It is a 30-minute drive from Downtown Chicago.10 Figure 2-2: Transportation Routes
The Federal Railroad Administration, the authoritative source of information on passenger and f reight rail networks for the US federal government, provides geospatial resources accessible to the public on rail networks. The Freight Network Map (Figure 2-3) outlines rail networks in which users can access data layers including freight stations, grade crossings, and mileposts. There are four freight stations
and a larger presence of at-grade rail crossings that accumulate within the Northeast COD site in the Northeast tract. These are crossings where railroad tracks and roadways are at the same elevation, making these intersections complex in nature as several entities have jurisdiction.13 In Blue Island, these crossings potentially pose safety issues, and often, severe traffic delays, hindering the City’s connectivity traffic flow.
Figure 2-3: Freight Network
Sarah Grumulaitis (2021).
There are a total of six Metra stations, five Pace bus routes, and one neighboring CTA bus route.11 However, within the last decade, public transportation ridership has steadily decreased among the residents of Blue Island. In 2019, of 7,401 trips taken to work, 83.8% of them involved driving. Only 14% of trips to work were by public transportation.12 Of the five Pace routes, Route 349 is the most popular.
US DOT and Sarah Grumulaitis (2021).
COMMUNITY PROFILE
TRANSPORTATION
17
Figure 2-4: Proposed Cargo Oriented Development Northeast Blue Island
TRANSPORTATION
Cargo Oriented Development (COD) sites address underutilized and vacant industrial land by encouraging the redevelopment of manufacturing, logistics, and related businesses at locations where there is a strong freight access and an available workforce.
Cargo Oriented Development Blue Island has signif icant opportunities to boost freight infrastructure. COD promotes efficient and sustainable ways to move freight while helping communities to retain jobs. This helps generate a resilient economy through an efficient freight system that adapts to the use of greener vehicles such as the electrification of trucks and technologies. Currently there are three COD sites within Blue Island that hold economic potential for the city. One of these COD sites is in the Northeast tract which is also located within an Opportunity
Zone containing brownfield properties. Since the decline of manufacturing employment in Blue Island, there is a need for local labor supply and skills in freight and logistics industries. The city has the opportunity to use the COD site to create new routes for dedicated freight movement and remove freight off local community roads, lowering exposure to polluting f reight practices for both residents and the surrounding environment by decreasing congestion and truck pollution in residential and commercial areas.. Blue Island Economic Development Plan (2005)
Blue Island faces challenges of connectivity throughout its various modes of transportation. According to Pace bus ridership data, there is an uneven distribution of rides used throughout the study area, with certain routes seeing higher average rides than other routes. When service is not efficient or accessible, cars become residents’ only form of transportation. Over-reliance on cars leads to unnecessary energy through idling due to increased traffic and waiting for trains, which also increases polluting emissions. Additionally, as the primary north-south connector road from Chicago through Blue
COMMUNITY PROFILE
Connectivity Island, Western Ave. has long been viewed as an essential part of the city. However, Western Ave functions as a one-way street, affecting the circulation of traffic in downtown Blue Island. The reopening of Division and Chatham streets has improved movement, and the policy proposals this energy plan introduces will similarly help resolve these connectivity issues.
19
The proposed land-use changes, COD policies, providing mul ti-modal forms of transportation, and implementing pedestrianfriendly changes to support biking and walking will help increase the quality of life for residents in Blue Island.
City of Blue Island (2012)
Commitment to Bike & Pedestrian Travel Blue Island has shown commitment to building infrastructure that would be able to support alternative methods of transportation, specifically those geared towards bicycle and pedestrian travel. Within the past five years, the city has revitalized two bridges essential to the connectivity of Blue Island, incorporated a green infrastructure vision, and united communities throughout the region. The first bridge of note is the Division Street Bridge, which functions as a vital corridor between the north and south sides of the city over the Calumet-Sag Channel. The other is the Chatham Street Bridge,
City of Blue Island (2012)
which was reopened for strictly bicycle and pedestrian usage in 2021. This bridge now features an on street and off-street bike path with decorative gateways completing the connection between Alsip and Riverdale. 14 However, more strategic planning regarding the accessibility of these alternative methods of travel for non-leisure usage must be considered by Blue Island; the combination of all these elements will not only connect Blue Island to the rest of the region but also to the rest of the county, providing the municipality with economic and development opportunities.
Opened in 2021, the Chatham Street Bridge offers residents a car-free, multi-use path that connects Blue Islanders to each other, and to the larger region via the Cal-Sag Trail. Victoria Kurlander (2021).
COMMUNITY PROFILE
BLUE ISLAND WATER SYSTEM INFRASTRUCTURE
Figure 2-5: How Does the System Work When it Rains?
Calumet-Sag Channel The Calumet-Sag Channel serves as a waterway for heavy industrial businesses in the far southern neighborhoods of Chicago and adjacent suburbs, which has resulted in high levels of pollution due to sewer and waste disposal from these enterprises. This contamination has restricted access to the channel and adjacent parcels for active and passive recreational activities. Due to its reach, efforts to rehabilitate this waterway require partnerships with six neighboring communities and the Metropolitan Water Reclamation District of Greater Chicago, who controls property development along the channel. The Calumet-Sag Channel also accommodates the stormwater
21 Friends of the Chicago River (2006-2021)
runoff from Blue Island, which is an energy inefficient design.15 Sewer Sytem and Stormwater Like most older communities, the majority of Blue Island is served by a combined sewer system. As stressful climate events increase, this system will experience further deterioration. With three sewer locations that discharge into the adjacent Calumet-Sag Channel, the increasing frequency of heavy
rainfall events can be particularly devastating to Blue Island. Combined sewer overflows (CSOs) contain untreated or partially treated human and industrial waste, toxic materials, and debris as well as stormwater. This is a priority concern for water pollution, as seen within the 860 municipalities across the U.S. that experience CSO.16 Additionally, limited capacity sewer systems cause flooding issues for residential properties that result in increased costs
for homeowners and potential health risks. Aging stormwater infrastructure is a major concern for the City of Blue Island; as a result, they have joined the Calumet Stormwater Collaborative to “improve stormwater management through investments in and coordination of green infrastructure solutions.” 17
U.S. Census Bureau, American Community Survey (2019)
CURRENT ENERGY CONSUMPTION
Figure 2-6: Routine Maintenance Costs in a Typical Year by Latinx Origin
Household Energy Consumption The majority of occupied units in the study area utilize utility gas and electricity as the dominant forms of heating fuel; approximately 86% of occupied housing units are engineered for utility gas and 12% use electricity.18 Other forms of heating fuel are negligible and inconsistent in use. This data is limited in that it categorizes housing units based on what their primary method of heating is. In many circumstances, most forms of gas heating also use electricity to monitor systems like pumps and controls. In older, typically historic houses where a gas boiler is connected to radiators, an estimated 5% of total energy is electrical. The average monthly household bill in our tracts is $63.10 for utility gas and $90.84 for electricity. Annually, the average expenditures for any given household in the three tracts
are $757.20 for utility gas heating and $1,090.08 for electrical heating (Appendix A.2). As seen in Figure 2-6, analysis of the three main racial and ethnic identity categories suggest that Latinx households of any race spend slightly more on home maintenance than non-Latinx do in an average year. This extends to a racial and ethnic cohort analysis of energy efficient home improvement projects for the metropolitan region. Latinxs comprise 22% of the regional population, making them the second largest ethnic group in Chicagoland. Yet as seen in Figure 2-7, Latinx households account for only 13.6% of energy efficiency home improvement projects.19 This indicates a behavioral anomaly where Latinx households are not completing energy efficient home improvement projects at the same proportional rates as non-Latinx counterparts.
Total Households
Non-Latinx
Latinx
U.S. Census Bureau, American Housing Survey (2019)
Figure 2-7: Unit Energy Efficiency Home Improvements by Latinx Origin
6.6%
Other, non-Latinx
13.6% Latinx
14.7%
Black, non-Latinx
65.2%
White, non-Latinx
U.S. Census Bureau, American Housing Survey (2019)
Protections around the city’s historic housing stock remain a challenge for external energy upgrades, such as rooftop solar panels or eaves replacements. Any of these interventions that affect the external façade of a historically landmarked building requires approval from the Historic Preservation Commission in the form of a Certificate of Appropriateness.20 Similarly, external upgrades are more likely to be deemed appropriate if they can be hidden from view from the street or any side or front-facing façade directly under the purview of the Commision. However, the Commission only governs exteriors, and energy efficient retrofitting (or other internal projects) can have substantial impact on interiors.
Blue Island’s ordinance for the UTOD zoning district includes the possibility for residents to pursue energy eff icient inf rastructure. Specif ically noted are the guidelines for solar panels and wind turbines. However, solar roofs can only occupy up to 60% of the total roof area. Likewise, turbines must be single-column and are restricted to up to 35 feet tall. There are additional spatial restrictions for wind turbines, such as their proximity to livable spaces, that are further listed in the ordinance for the UTOD.21 Any deviances to solar panel and wind turbine installations must require a special use permit approved by the city’s planning offices and its administration.
COMMUNITY PROFILE
Improvement Limitations for Households
25
Victoria Kurlander (2021)
Uptown Transit Oriented Development District Zoning Ordinance Restrictions 60% Solar Roof Coverage Turbine height limit of 35 ft.
City of Blue Island (2012).
Municipal Energy Consumption In 2016, Blue Island budgeted $3,500 for its gas utility bill in general operations. Its expenses were $298.22 Using the $298 expense as a benchmark, the city budgeted $250 for gas utilities in 2018 and 2019. In actuality, the municipality spent $1,788 in 2018 and $3,624 in 2019 on gas utilities in its general operations.23 24 This fluctuation and rising costs of utility expenditures could be mitigated by smarter energy solutions in its public assets. Three major public buildings fall within our study area: the City Clerk’s Office, the police station, and the fire department. All three buildings could provide adequate testing grounds for improvements in energy efficiency which could then be extended to other municipal buildings in the future. Additionally, Blue Island is in the process of updating its public street lighting from traditional bulbs to LED. The city also wishes to change the aging light poles along Western Ave. and hopes to complete both upgrades at the same time. The additional
Figure 2-8: Heat Island Map for Blue Island
1 - relatively mild heat
area (slightly above the mean for the city)
2 3 4 5 - severe heat area
(significantly above the mean for the city)
Wholesale trade makes up the largest concentration of Blue Island’s economy while the greatest proportion of jobs are in the medical and health services. Both of these sectors of the economy use a great deal of energy but are also in a position to increase their energy efficiency and transition to alternative cleaner energy sources through updating technology and changing land use patterns. Transportation Energy Consumption
Trust for Public Land (2019).
cost of the poles, however, has delayed the project due to budget constraints. Commercial and Industrial Energy Consumption In 2018, energy consumption breakdown at the state level was 43.8% for commercial and industrial (C&I) purposes.25 In 2009, it is estimated that about
60% of total electricity usage in Blue Island was for C&I.26 Current energy usage in Blue Island for commercial and industrial uses is difficult to calculate. While today’s exact proportion of Blue Island’s energy is used for C&I purposes is not reported here, it is clear that it is an important consideration when developing an energy plan.
In 2018, 34% of energy consumed in the state of Illinois was due to transportation. It is difficult to pin an exact number on how much energy is being consumed for transportation in Blue Island, but the city is taking steps to reduce energy consumption. First, they created UTOD and COD sites located within our study area. Additionally, Blue Island’s comprehensive plan introduced plans to make Western Ave. a complete street. These initiatives are likely to reduce the vehicle miles traveled and encourage traveling using alternative modes of transportation.
COMMUNITY PROFILE
Conclusion Blue Island’s diverse community, affordable housing, and transit infrastructure present a set of opportunities for a clean energy future. Leveraging Blue Island’s assets in a strategic manner to reduce energy usage and promote a local green economy will not only reduce the community’s energy burden, but also catalyze economic growth.
27
Amy Malysa (2011)
EVALUATING PROGRESS The first section of this plan analyzed the existing conditions and challenges of the selected study area within Blue Island. This next section will explore policies to help guide the city in meeting green economic future and energy efficiency goals. Each policy addresses the different sections identified from
the strengths and weaknesses of the community: microgrid, economy, housing, transportation, heat island effect, waste management, and zoning and ordinances. Accompanying the policies is a set of criteria to evaluate how well they will deliver their intended objectives. The criteria are listed as the following:
POLICY PROPOSALS
Green Economy
The city of Blue Island is moving into a future where environmental sustainability must be facilitated by a green economy.
INTRODUCTION This movement marks the transition from fossil fuels, which expedite climate disaster, to an innovative and interconnected system of clean and renewable energy. Establishing a green economy in Blue Island is an equitable solution for the prioritization of green energy goals. The following green economy proposals involve the creation of green jobs with respect to the installation of various components of Blue Island’s microgrid and transportation inf rastructure. Combined with initiatives for workforce development, Blue Island will be able to provide a future to its residents that remedies the conflict between economic and ecological priorities. INTRODUCTION
1.0 MICROGRIDS Microgrids involve the connectivity of infrastructure supported by local renewable energy and other energy resources. Such an investment could not only provide clean and renewable energy to the municipality but create opportunities for green jobs. Job creation is a fundamental aspect of this proposal; the entire microgrid system would generate long-term green employment as the city partners with green technology entrepreneurs (see Section 2.2 for more information on a solar-centered workforce development plan). Community microgrids are self-reliant, serving thousands of customers. A transitional microgrid is smaller and can power hospital systems and municipal buildings. Microgrids help buildings become energy independent and allow for the integration and distribution of renewable energy. They can also support peak energy use days and even seasons.
1.0 MICROGRIDS GREEN ECONOMY
Stakeholders: ComEd, Solar Energy Businesses, Blue Island city officials
Figure 3-1: Diagram of Microgrid System Infrastructure
Timeline: 10+ Years By 2040, Blue Island can have the infrastructure to host a community microgrid. This proposal outlines a 20-year plan to ensure Blue Island achieves this goal.
31
Next 5 Years Blue Island will aid landowners who are interested in installing solar panels on their property. Next 5-10 Years Blue Island will install small scale microgrids on municipal buildings. Next 10-15 Years Blue Island will construct a community solar farm and install wind turbines. Next 15-20 Years Blue Island will work with ComEd to finalize a strategic integration between the city's migrogrid and the larger regional grid. Blue Island will work with ComEd to connect solar panels installed on homes and other public spaces to the microgrid.
Microgrids will be implemented into Blue Island through a collaborative effort from the public sector, solar energy businesses, and ComEd. Selection of Energy Sources Around 4,000 roofs in Blue Island, or 66% of total roofs in the city, are viable for solar energy
production.27 Additionally, there is space within the Northeast tract at 11955 Vincennes, where Blue Island is demolishing an abandoned building and making way for remediation in the area.28 This presents an opportunity to have a solar farm as seen in Section 1.3. Based on these conditions, the majority of energy produced through the
microgrid will be solar energy. However, current solar technology is less than 50% efficient; therefore, microgrids rely on a variety of energy sources. 29 Thus, while the transitional microgrids will be 100% solar energy, the community microgrid will also rely on 2-3 wind turbines.
Additionally, the community microgrid will also leverage smart housing meters and high-quality energy storage to maximize energy efficiency and resiliency. Cost According to research via the National Renewable Energy Laboratory, the mean cost of a community microgrid is $2.1 million per megawatts of Distributed Energy Resources such as solar or wind power.30
1.1 Solar-Powered Homes Stakeholders: ComEd, Solar Energy Businesses, Blue Island Planning & Marketing Departments, residents Timeline: 1-5 Years
With the increased interest in renewable energy technology, there are several funding opportunities that Blue Island can take advantage of, including the U.S. Department of Energy and Illinois Future Energy Jobs Act (FEJA) funding. In fact, ComEd has been able to secure U.S. Department of Energy Funding for similar projects. Not only is the energy clean and renewable but also the microgrid allows the municipality to respond to climate related power outages and move towards a self-sustaining future. SOLAR-POWERED HOMES Home solar is a good first step towards a community microgrid for Blue Island because the expertise to install solar panels on homes is already prevalent throughout the region. There are several businesses that focus on these types of installations. Additionally, ComEd has the capacity to connect residential solar panels to the larger energy grid. Thus, residents will see their energy bill decrease. Although the upfront costs are high, generally around $15,000
to $25,000, there are several state initiatives to mitigate these costs.31 Illinois Solar for All and Illinois Shines provide assistance, and there is also a tax deduction for residents who transition to solar energy. There are two policy interventions that Blue Island can take in the next five years to help increase the number of residential solar panels in Blue Island:
1 Launch a community outreach program.
2 Extend solar panel allowances outlined for the Uptown Transit Oriented Development (UTOD) district to the rest of Blue Island (see Section 7.2 for details).
The Blue Island Planning Department and the Marketing Department can collaborate to develop a homeowner’s guide to solar panels. This guide will include: ▶ ▶ ▶ ▶
Summary of benefits of solar panels State and federal incentives Explanation of the ComEd pay-back program Steps on how to get started with a solar panel installation
GREEN ECONOMY
Community Education As stated previously, about 66% of roofs in Blue Island are viable for solar panel Installation.32 To determine which homeowners should be targeted by this campaign, the Blue Island Planning Department can consult with ComEd and Google’s Project Sunroof to identify Blue Island residential structures that are best suited for solar panel installation.
33
U.S. HUD (2014).
1.2 Municipal Buildings Microgrid Stakeholders: Constellation New Energy, Blue Island Fire Deparment, Blue Island Police Department, Blue Island City Clerk Timeline: 5-10 Years MUNICPAL BUILDINROGRID To prepare for a volatile future with respect to the environment and climate change, building a resilient energy system is an important investment. Ideally, to power the municipality of Blue Island, a hybrid microgrid can be implemented. It would be best to begin with smaller scale microgrids, known as transitional microgrids, to power municipal buildings.
While Blue Island’s UTOD site makes allowances for solar panels, residents are less likely to adopt cleaner energy sources unless their leadership provides an example. Additionally, if the city does move forward with a microgrid, it will be in Blue Island’s best interest to use every resource available to produce local energy. With these goals in mind, Blue Island’s City Clerk’s Office, police station, and fire station should use solar panels on their rooftops to supplement their energy needs in their daily operations. Municipal buildings should also be equipped with battery storage and a smart controller system to create a transitional microgrid, starting with the fire station and then expanding to the rest of the
municipal buildings in the study area. As seen in Figure 3-2, the three buildings in mind have adequate space and minimal shading, making them ideal for solar energy generation. Additionally, these buildings are right next to each other on the same block, which provides an ideal condition for a transitional microgrid. One item to note is that if green rooftops are also going to be placed on these buildings (as proposed in Section 5.4), then an assessment will need to be conducted as to the ideal balance of greenspace for educational purposes/energy reduction and solar panels for energy generation.
Funding As with solar panels on residential buildings, there are many organizations currently available to assist with funds for solar installation on municipal buildings. Illinois Solar for All and Illinois Shines both provide community solar assistance programs, while Solar Investment Tax Credits allow for federal tax deductions when installing solar. Constellation NewEnergy, whom Blue Island is contracted with for its energy services, also provides incentives for installing solar power. SOLAR FA
Figure 3-2: Proposed Municipal Buildings Microgrid
Solar Potential
High-Yield
Police Station
Fire Station & City Clerk's Office
ComEd, Cook County Government, and Sarah Grumulaitis (2021).
Feasible
None
1.3 Solar Farm
In Fremont, California, fire stations 6, 7, and 11 were equipped with microgrids using solar panels on nearby carports. This increased their capacity to operate during power outages as the fire stations are an island away from the main energy grid. Even when there is no power emergency, by supplying their own energy, the fire stations reduce the energy
demand on the whole grid. As such, Fremont is expected to save a quarter million dollars from energy generation over a decade and 80,000 pounds of CO2 per a year. The project was made possible by a publicprivate partnership between the city of Fremont, Fremont-based clean technology firm Gridscape Solutions, and the California Energy Commission.35
GREEN ECONOMY
Case Study: Fremont Fire Station
Stakeholders: Solar Energy Businesses, ComEd, Blue Island Planning Department Timeline: 10+ Years
Solar Farms consist of a collection of solar panels on a large parcel of land. The overarching goal behind the creation of a solar farm in Blue Island is to connect it to the proposed community microgrid.
An ideal site for a solar farm exists within the Northeast tract. The city owns the land at 11955 Vincennes and is demolishing an abandoned building to make way for remediation in the area. There are also several parcels of vacant lots for sale within the borders of 119th Street, 123rd Street, and railroad tracks to the east that could expand upon the 11955 Vincennes site.
Figure 3-3: Solar Farm Site & Adjacent Land Use Proposed Solar Farm Site Residential Commercial
Industrial COD
Dimitri Nesbitt (2021).
35
Funding Illinois has appropriated over $250 million for the Illinois Solar program.33 A component of the Illinois Solar program is the Community Solar program. This program helps residents buy into a solar farm built in their utility area. Not only will this program provide funding, but it will also allow residents, regardless of being homeowners
or renters, to feel a sense of pride from partial ownership of the solar farm. The Community Solar program is not the only funding source available for solar farms. Blue Island can partner with ComEd to receive funding from the U.S. Department of Energy or pursue funding from the agency independently.
1.4 Wind Turbines Stakeholders: Blue Island Planning Department, Metropolitan Water Reclamation District of Greaeter Chicago, Local Businesses and Landowners Timeline: 10+ Years While the addition of wind turbines to Blue Island must be at a different location than the Solar Farm, the goal of this policy is to incorporate both clean energy options into the community microgrid. One of the drawbacks of building a solar farm is the fact that the land designated for such usage cannot be used for agriculture or alternative energy generation. That being said, a great advantage of wind energy is the versatility of where wind turbines can be installed due to their variety of sizes. Small-sized wind turbines can be affixed to building exteriors, bridges, and other similar structures while medium sized wind turbines can be installed along the Calumet-Sag Channel or other public or industrial areas with sufficient space. Additionally, Blue
Illinois Institute of Technology's advanced wind turbine can serve as a model for Blue Island's energy implementation. Illinois Institute of Technology (2011).
Island can set aside space for several wind turbines when installing the solar farm. Cost According to the non-profit organization Windustry, a wind turbine built on the home or farm scale with ten kilowatts of capacity will have an installation cost of approximately $50,000 to $80,000.34 This investment is a stepping stone to Blue Island’s goal of a Green Economic Future as plans for a hybrid-microgrid will be even more resilient using wind energy. Blue Island can explore additional incentives, including additional property tax abatement and sales tax rebates.
The Illinois Institute of Technology in Chicago has built a microgrid that powers its campus buildings and streetlights. This microgrid is largely powered by solar panels similar to the one proposed to Blue Island. However, IIT has also successfully installed a wind turbine just a few blocks
GREEN ECONOMY
Case Study: Illinois Insitute of Technology Microgrid away from campus. This shows that operating a microgrid with a wind turbine component is possible even in an urban environment.36
37
Amy Malysa (2011).
2.0 Economy INTRODUCTION Allocating enough funding for transportation systems is crucial to ensure the maintenance and efficiency of these services. Cargo Oriented Development (COD) provides an opportunity for manufacturing businesses, logistics, warehouses, etc., to use the same freight network. Locating businesses within the COD site will provide easy access to rail and available workforce as well as increase energy efficiency.
2.1 Cargo oriented Development Blue Island’s Existing COD Assets The Northeast Tract contains the IAIS Intermodal Facility. Its function is described as “that of a cross-town facility—where a drayman or a railroad delivers a container from one railroad to another for continuance
of the move.” 37 There is a growing trend in transportation and warehousing to locate industrial business parks near intermodal facilities as it cuts down transportation costs and emissions because of the proximity to the networks that deliver and distribute their goods. Between 2010 and 2016, annual lifts have been steadily increasing, showing the rise of intermodal freight as e-commerce becomes a major factor in goods distribution.38
Figure 3-4: IAIS Intermodal Facility Map
Blue Island will implement a multi-story warehouse within the Northeast tract using its existing freight assets such as the Northeast COD-zoned site and intermodal facility.
COD and Location Efficiency As e-commerce and sameday delivery services increase, cities are preparing for a surge in warehouse fulf illment demand.39 As cities introduce anti-congestion and traff ic measures, developers and investors are looking towards multi-story warehouses. Higherdensity facilities will be able to accommodate multiple retailers which are locating closer to customers for faster delivery. In the past, cities created distribution centers away from city boundaries, increasing sprawl. Additionally, purchasing land in suburban areas is 50% cheaper than building within cities where land is limited.40
ECONOMY
Blue Island has the opportunity to attract developers to its current COD-designated site to invest and fill in its vacant lots. The Blue Island Comprehensive Plan has prioritized COD and allotted three specif ic sites where industry is located. The zoning permit already exists; it is just a matter of restructuring the lot programming, redeveloping brownfield property through the designation of the Northeast tract as an Opportunity Zone.
2.0 ECONOMY Stakeholders: Illinois Department of Transportation, Blue Island Chamber of Commerce Timeline: 10+ Years
Mid-America Freight Coalitions (2012).
COD is becoming a popular policy model for municipalities to adopt in managing their f reight networks while still promoting economic development. The Illinois Clean Energy Jobs Act emphasizes the need for electrification of the transportation sector as it is the leading source of carbon pollution in the state, responsible for nearly one-third of all carbon
emissions.42 Through its EV Access for All program, the bill will help support municipalities in incentivizing electric vehicles, mass transit, and other transportation alternatives to reduce pollution from fleets of diesel trucks and buses. Certain barriers include the scale and time it will take to construct new warehouses and change the operations of private businesses to align with the city’s clean energy goals.
Case Study: Brooklyn Warehouse Study
The neighborhood of Red Hook in Brooklyn partnered with developer Dov Hertz to build a three-story facility. The warehouse will include truck ramps to the second floor and elevators that can hold a forklift going to the third floor. Similarly, in the Bronx, a two-story warehouse is planned at 840,000 square feet. It is centrally located and will function as a distribution center for businesses that serve over 8 million customers that live within 10 miles of the facility. 41
Ware Malcomb (2018).
GREEN ECONOMY
Funding and Political Feasibility
39
2.2 Workforce Development 2.2.1 Blue Island Goes Solar Stakeholders:Blue Island residents, Local training institutions, Blue Island Marketing Department & Public Works Department Timeline: 1-5 years WORKFORCE DEVELOPMENT Introduction This strategic energy plan increases the presence of the green technology industry in Blue Island. It is imperative that Blue Island provide workforce development opportunities for Blue Islanders to increase local employment in this industry. This effort will maximize the positive economic impact of the energy plan in Blue Island.
projects proposed in this plan. Therefore, Blue Island should focus on providing workforce development opportunities that lead to a North American Board of Certif ied Energy Practitioners certification. There are two possible workforce development programs which can stand alone or complement each other:
1. Blue Island Goes Solar There is likely to be an increase in solar panels in Blue 2. Solar Specialists Scholarship Island because of the several
Possible Training Organizations Midwest Renewable Energy Association Grow Solar Millennium Solar Electric Solar Training National Latino Education Institute OAI Lyte Solar Program
Blue Island will create partnerships with several local institutions that prepare students for accreditation. The Blue Island Marketing Department will complete a community outreach effort to let the community learn about the opportunities available to them. Blue Island can also communicate with residents via paper flyers, social media, and at community meetings or events. These partnerships will culminate in a fair where prospective students can learn about the different training programs. This fair could be opened to neighboring communities, as well, offering regional cooperation. As Blue Island will only be forming relationships, the cost of this policy proposal is likely negligible, amounting to the cost of community outreach. However, Blue Island can pursue sponsorship from prominent employers, training institutions, non-prof it organizations, or government agencies. 2.2.2 The Solar Specialists Scholarship Blue Island will work with neighboring municipalities
and educational institutions to build a program to help residents who may face barriers to access training otherwise receive a North American Board of Certified Energy Practitioners certif ication. Possible neighboring municipalities for partnership are Alsip and Calumet City. The Solar Specialists Scholarship includes: •
• • •
Scholarship that covers the cost of attending classes and taking the certification exam. Transportation voucher Daycare voucher (if applicable) Opportunity to apply to a Blue Island Apprenticeship Program with Public Works (for Blue Island residents only)
Blue Island Apprenticeship Program Experience is equally as important as certif ication. Blue Island’s Public Works Department will create a 6-month apprenticeship program for Scholars from Blue Island that receive a certificate. This apprenticeship program not only helps scholars increase their employment opportunities,
Initially, this apprenticeship program can only accommodate a few Scholars. However, as solar panel installation on municipal buildings expands and a municipal microgrid is established, the program’s capacity will increase.
development in this area, so Blue Island can expect several funding opportunities in the coming years. CONCLUSION
Solar Panel Installer from Bloomberg, 2013
Implementation Since this will be a partnership between several municipalities, it is appropriate to select a nonprofit through a competitive process as a grant administrator. The grant administrator would be tasked to process
GREEN ECONOMY
but it will also provide Public Works the necessary support to manage the solar panels installed on municipal property.
student applications, manage transportation and daycare vouchers, and serve as a liaison between students, the municipalities, and prospective employers.
Funding the Scholarship There are several grants that the municipality can apply for, including at the state level through DCEO and at the federal level through the Department of Commerce Economic Development Administration. Creating a partnership with an institution and the fact that the program is regional increases the likelihood of successful grant funding. Under FEJA, ComEd provides grants for solar workforce training. There are legislations in both the state of Illinois and U.S. Congress that are looking to increase funding for workforce
Blue Island’s transition to cleaner energy includes adjusting its economic model to prioritize green energy goals. The city has the opportunity to introduce a new energy system in the form of a microgrid to promote the use of renewable energy. Municipal buildings and homes will benefit from switching to solar energy while the city implements wind turbines and a solar farm alongside building exteriors and bridges. Additionally, by capitalizing on its COD site and freight network, the city will offer residents job opportunities within the transportation, manufacturing, and logistics sectors. An increased presence of the green technology industry in the city will be key in delivering a positive economic impact for local businesses and residents. The city of Blue Island will create an economy that reduces environmental risks and develops in a sustainable manner without sacrificing the needs of future generations or its surrounding environment.
41
ENERGY EFFICIENCY
In seeking a more resilient future, Blue Island must engage in energy efficiency efforts to reduce its consumption.
INTRODUCTION From adopting more green infrastructure to joining regional collaboratives dedicated to pursuing green technology, Blue Island has begun to act on the sense of urgency climate change brings. The city must be deliberate in its policy implementation and ensure that the decisionmaking process is participatory, collaborative, and forward thinking especially while considering a post-COVID-19 economic recovery. By implementing policies that reduce the city’s energy burden, Blue Island will not only be able to increase the quality of life of its residents but also gain more financial freedom to invest in other policies.
3.0 Housing INTRODUCTION Low-income households disproportionately face higher energy burdens and costs because it is difficult to fund necessary but costly home retrofitting. For this reason, this plan prioritizes facilitating retrofitting of all residential buildings, regardless of income. Census data indicates that a majority of Blue Island houses may retain outdated structural integrity causing unnecessary overproduction of heating, ventilation, and air conditioning systems.43 Weatherizing these structures will improve the city’s resilience by reducing
3.0 Housing HOUSING The Illinois Department of Commerce and Economic Opportunity (DCEO) is in the midst of receiving public comments on the 2020 State Weatherization Plan, a guiding document that determines the state’s strategy for the 2022 Illinois Home Weatherization Assistance Program. The federal Department of Energy has expressed an interest in funding weatherization initiatives in Illinois for the 2021 Fiscal Year, and the State will determine community partnerships for each county to administer funds. Establishing the BIGH program will aid Blue Island in receiving these funds and coordinating to maximize their impact in the city.
Timeline: Implementation - 1-5 Years Full Weatherization : 10+ Years
energy consumption from these systems. Weatherization is a substantially more cost-effective strategy for reducing energy usage than demolition of the current housing stock. To work towards Blue Island’s goal of 100% weatherization for its housing structures by 2035, the city will establish a grant-funded weatherization program called the Blue Island, Green Home Project (BIGH Project).
Adobe Stock (n.d.)
The BIGH Project has four elements:
1 Home Weatherization Grant Program
2
3
4
Community Education
The Repurpose Program
Anti-Gentrification Ordinance
ENERGY EFFICIENCY
Stakeholders: Resident homeowners, Historic Preservation Committee, Lakeshore Recycling Services
43
3.1 Home Weatherization Weatherization Database
Retrofitting housing structures
Blue Island Department of Planning will create a database that lists housing structures, including landmarked ones, to identify opportunities for weatherization retrofits. Blue Island will work closely with the Historic Preservation Committee to properly identify appropriate retrof its for landmarked structure to expedite the weatherization process.
With the Weatherization Database, the city will accept applications from residents or community organizations that help weatherize to begin retrofit projects. Households that are eligible for these funds must be low-income residents who make up to 80% of the Area Median Income. Community organizations that receive funds must also prove that they serve low-income residents.
Case Study: ComEd Blue Island’s Finance Department and the BIGH Project will partner with the Chicagoland Vintage Home Association (CVHA) to aid in the administration of the funds. Blue Island will work with CVHA to identify a list of contractors that are specialized in retrofitting. This list will contain contractors located in Blue Island and contain at least 65% minority or women owned businesses.
The Weatherization Process: CVHA will hire or contract a certif ied energy assessor to perform energy audits to verify need and estimate project expenditure. 2. CVHA will work with homeowners to identify eligible contractors. 3. CVHA will release funds for the weatherization. 4. CVHA will produce an annual report for Blue Island’s Planning Commission and Finance Department.
ComEd’s energy retrofit program can serve as an exploratory cases for how funds are distributed to organizations who do the work implementing these retrofit projects. ComEd partners with the Chicagoland Vintage Home Association to administer these funds and several communities in the metropolitan area, including Blue Island residents, are eligible applicants.44
ComEd (2014).
1.
It is at the discretion of the Planning Commission, the Community Development Manager, and appropriate municipal personnel to determine how many projects to fund in a single fiscal year, particularly in its initial years, to preserve the program’s longevity.
Funding f rom the U.S. Department of Energy for the 2022 Illinois Home Weatherization Assistance Program. Eligible households are able to receive up to $15,000 for energy eff icient retrofits, administered by a local community partner.45 DCEO Community Development Block Grant (CDBG) - The CDBG is awarded to communities to pursue pressing development issues in their jurisdictions, of which, dilapidated and vacant housing from structural integrity qualify.
3.2 Community Education Blue Island will develop, fund, and maintain a community education series to communicate policy changes, weatherization opportunities, and retrof it application assistance to interested residents. Co m m u n i t y education programming will consist of ad hoc educational sessions (including Spanish-language sessions) organized by the Community Development Manager at the Blue Island Public Library on the
retrof it opportunity as well as application writing and submitting for residents with eligible homes and incomes. These events will occur once every quarter and replace two of the library’s traditional programming events for that month. For residents unable to attend, library staff will undergo training on the program’s eligibility requirements to assist the public. Funding The community outreach effort will likely last for the duration
of the program until 100% weatherization is achieved. It is possible that some grant monies can be allocated for this community outreach. However, if needed, Blue Island can explore sustained appropriations for community education by diverting necessary funds from the Blue Island Golf Course budget or the Police Department. Additionally, the city can encourage tax deductible contributions by corporations and Blue Island residents for this purpose.
Case Study: National Association for State Community Services Programs
Rotation of grants from the Department of Energy’s Energy Efficiency & Renewable Energy Office and the U.S. Environmental Protection Agency (EPA), such as the Healthy Communities Grant Program for Region 5. However, funding is not available universally across regions at the same time, so frequent updating is required.
The National Association for State Community Services Programs, a non-profit that represents state directors of weatherization assistance on the federal level, notes that community education of weatherization is a critical component for improving the lifespan of home structures, and by extension, the health of a community through energy efficiency. Of the best models for weatherization education, the Opportunity Council in Bellingham, Washington, and the nationally operating Healthy House Institute are noted for having developed workbooks, toolkits, and policy briefs for use in communities.46
Alternative funding may be pursued by special municipal efforts such as appropriations. Blue Island Public Library (n.d.)
ENERGY EFFICIENCY
Funding the BIGH Program
45
3.3 The Repurpose PRoject As part of the weatherization initiative for Blue Island, the city will develop and maintain a retrofit waste management program known as Repurpose. The program seeks to reduce waste generated by retrofit construction by collecting unused materials into a municipally managed stockpile that low-income residents can access through awarded weatherization projects administered by the city. When considered alongside the larger weatherization program, the waste generated by energy efficient retrofit is not forgotten but reintroduced into use for further energy consumption reduction.
Victoria Kurlander (2021).
Blue Island will enter a negotiation with Lakeshore Recycling Systems (LRS) to provide collection receptacles for active weatherization projects as awarded by the BIGH Project. This will be part of a larger contract renegotiation with LRS. (See Section 6.1) The receptacles will be temporarily available at project sites and will be determined by the energy assessor. The Repurpose Bank Upon completion of the weatherization project, LRS will deliver these materials to a sheltered area of the Public
Works Facility at 3153 Wireton Road. Public Works personnel will inventory these materials and provide this information to the energy assessor and the Community Development Manager. The city will utilize the Repurpose inventories in subsequent BIGH Project weatherization awards to divert waste from landfills and reduce energy consumption from the creation, purchase, and transport of new materials. The city will promote Repurpose alongside the BIGH Project through community education campaigns that make weatherization projects more accessible.
Case Study: Evanston, IL Evanston, IL has adopted successfully mandated waste management for construction projects in their climate mitigation and resiliency plans as part of a zero-waste strategy. Evanston works closely with waste haulers to ensure construction materials that can be reused are diverted from the landfill. Additionally, Evanston launched an outreach campaign to share information about the ZeroWaste strategies.47
ENERGY EFFICIENCY
3.4 Anti-Gentrification Housing ORdinance The city will adopt a Housing Preser vation Ordinance that will empower tenants with rights of f irst refusal and tenant opportunity to purchase assistance in multifamily buildings and mobile home parks to prevent the displacement of primarily lowincome residents by entering an agreement with a not-for-profit affordable housing developer to maintain dwelling affordability by purchasing the building or site from the owner. In the event a multi-family building or mobile home park is sold, the city will adopt an Inclusionary Zoning policy that will require developers to offer a percentage of units at below market rates to lower-income households or pay a high in-lieu fee.
47
With new energy eff icient developments that can affect adjacent housing affordability, the city will require the developer enter a Community Benefit Agreement that will require developers to financially support the BIGH Project’s weatherization efforts for eligible homes; in return, the residents will agree to support the development. The city will adopt a Demolition Surcharge Ordinance that will fine developers $7,500 for each demolished single-family home, including mobile/modular home sites, and $2,500 for every demolished unit of multi-family housing. The financial resources generated by these fees will supplement the municipal losses from an adjoining Tax Abatement Policy that eligible residents can apply for.
Victoria Kurlander (2021).
4.0 Transportation INTRODUCTION Reducing dependency on cars offers many benefits such as reduction of energy dependence on fossil fuels and healthier residents due to a reduction in vehicle emissions and more exercise. Blue Island can do more to make those living in the city and visiting comfortable with using its streets and sidewalks for biking, walking, and personalized transporters to realize these benefits.
4.1 Intersection and At-Grade Crossing Revisions Stakeholders: Blue Island Public Works Department Timeline: 1-5 Years, 5-10 Years INTERSECTION AND AT-GRADE CROSSING REVISIONS The goal of this policy is to promote semi-permanent painted infrastructure at key intersections throughout the three census tracts, building off already-identified intersections in Blue Island’s Non-Motorized Plan. This policy will implement similar pedestrian safety techniques in the at-grade
crossing at 119th street and all intersections at Western Avenue.
Intersections and Pedestrian Safety Retrofits
At-Grade Crossing Delays
Painted infrastructure helps mark safe spaces for pedestrians when traveling across streets such as crosswalks or intersections. Inf rastructure retrof its include curb extensions to tighten curb radii. Promoting walkability to reduce
BI has several at-grade crossings that fall in the Northeast tract (See Figure 4-1). In 2011, the rail crossing at 119th Street had an average of 118.76 total hours/ day of aggregate delay, 1,974 vehicles delay, and an average of 6.56 minutes for gate down/ train passing. This is one of the top 10 public highway-rail grade crossings that cause the greatest amount of motorist delay and has several other hotspots running throughout its rail-lines.48 Safety is an issue because rail operations are in direct conflict with highway, pedestrian, and bicycle traffic.
dependency of cars is less likely to occur if pedestrians do not feel safe crossing these intersections. When drivers know where they must give pedestrians rightof-way, pedestrians will feel safer walking on streets. More people choosing to walk will decrease the dependence on cars and thus reduce automobile pollution from emissions.
Figure 4-1 of At-Grade Crossings in Northeast tract
According to CMAP’s 2011 update on Motorist Delay at Public Highway-Rail Grade Crossings in Northeastern Illinois, twenty cities with the greatest amount of motorist delay account for approximately 68% of the total motorist delay in Northeastern Illinois.49 Blue Island experiences motorist delays at 23 crossings and an annual average daily traff ic (the total volume of vehicle traffic of a highway or road for a year divided by 365 days) of 114,719. This results in 5,717 delayed vehicles or 166.4 total hours of aggregate delay.50 Flora Ramirez (2021).
This policy will be implemented along with other cool pavement techniques for programming parking lots (see Section 5.1). Additionally, the city has already put together a comprehensive Non-Motorized Plan with the Active Transportation Alliance. The Blue Island Public Works department will help implement the policy. Responsibilities for grade crossing maintenance and improvements are divided
between the public and private sectors. Private railroads maintain the warning devices and crossing surfaces at the crossing, and public highway authorities maintain advance warning signs that are not on the railroad right-of-way. Installing better signage may be cost-effective compared to expensive reconstruction of roads to separate pedestrian/ vehicle traffic f rom railroad traffic and prevent them sharing the same road/intersection.
However, this inexpensive and shorter-term process in changing human behavior will still provide direct benefits such as reducing crossing distance for pedestrians and encouraging slower turning speeds. The success of this policy will be measured through increased pedestrian foot traffic, public engagement, incorporating artist work and designs, and a reduction in crashes at key intersections.
ENERGY EFFICIENCY
Implementation
49
Case Study: Jersey City, New Jersey Jersey City, New Jersey hired a design and planning firm, Street Plans, to implement six walkability workshops that gathered feedback from residents on the city’s anticipated Pedestrian Enhancement Plan. Pop-up public meetings were held across the city in which the design firm conducted surveys for residents to help plan the walkability workshops. Based on the feedback received and supplementary data analysis, the workshop locations
were along corridors that were identified as unsafe for pedestrians. Each workshop included designs such as temporary curb extensions, a public-feedback board, tables and chairs, wayfinding signage, planters, and colorful paint. The curb extensions enabled residents to travel safely throughout the areas, and additional feedback received helped provide input for the creation of the Pedestrian Enhancement Plan.51
4.2 LED and Solar Street Lights S t a ke h o l d e r s : Illinois Department of Transportation, Constellation NewEnergy Timeline: 1-5 Years
Blue Island can also improve the energy efficiency of its streets by upgrading its current street lights to LED bulbs and solar batteries. While LED replacement by itself offers benef its in energy savings, solar-powered street lights are completely self-sufficient, using only the clean solar energy that their own batteries provide. They can function even when there is a larger power outage in the city, and as there are no electric bills, the city pays only the cost of the batteries, which need to be replaced every 5-7 years.53 Implementation There is already agreement among city officials to change to LED street lights on Western Ave., but these enhancements have been delayed due to: 1) Blue Island needs to work with the Illinois Department of Transportation (IDOT) as Western Ave. falls under their jurisdiction
2) The city wishes to replace its street poles at the same time it upgrades its lighting, but this requires extra funding There are several means of coming up with this funding. The city could take out a lowcost or market-rate loan that is then repaid with the electricity savings. There are also Energy Efficiency and Conservation Block Grants through the U.S. Energy Department. ComEd offers incentives to municipalities upgrading to LED bulbs, though this program is likely not compatible with a switch to solar.
Case Study: Asheville, North Carolina In 2010, Asheville, North Carolina replaced its street lights with LED fixtures as part of its goal of reducing its carbon footprint by 20% in five years. They estimated that the LED program would account for one-third of their targeted reduction. In addition
to the numbers stated in the criteria, Asheville estimates that they will see a return on their investment in only 4.6 years. In 12 years, they estimated a net savings of nearly $3 million, only $100,000 of which will need to go back into the LED program.52
Figure 4-2: Diagram of LED Solar Street Lights
Weather Issues Concerns about snow are often at the forefront of LED conversations, and while it is true that LED bulbs are not warm enough to melt snow, this is not an issue with street lights as they are downward facing. However, snow can cover solar panels, making them less efficient. Solar street lights require less maintenance than street lights hooked up to power lines, and some of these savings could be used to pay employees for snow removal in the winter months.
Unknown (n.d.)
55, 56
Implementation
4.3 Bike Infrastructure Stakeholders: Blue Island Chamber of Commerce, Public Works, Community Development Department, Business Owners Timeline: 5-10 Years
Providing alternative modes of transportation can help reduce car trips and reduce energy consumption. By adding bike infrastructure, people can travel to work or school and access essential services without relying on their car to do so. This will not only reduce energy from driving
but decrease traffic congestion, as well, reducing energy wasted waiting at stop lights and train intersections.
If removal of parking is required to create bike lanes, the city will need to dialogue with business owners who may have concerns about lost traffic due to fewer cars. The Community Development department is the designated permitting agency that would release new permits for commercial additions and parking lots that could require bicycle infrastructure as part of bulk regulations. The Department of Public Works would additionally oversee the bike rack installations
in the right-of-way that will need to become part of the Capital Improvements Plan. Potential funding sources to help with implementation are CMAP’s CMAQ/TAP-L Program Development and the Regional Transportation Authority (RTA)’s Access to Transit Program. Increased accessibility to safe bike inf rastructure creates affordable means of transportation for all Blue Island residents and promotes the concept of complete streets. To alleviate problems, bike racks can be placed in strategic locations that operate 24 hours, are near bus stops, or are well lit.
Existing Opportunities for Bike Infrastructure Blue Island is located adjacent to the Cal-Sag trail. The trail connections through bike lanes have the potential to connect Blue Island to Chicago’s lakefront, Indiana, and Iowa.54 The city is home to three Metra stations, which commuters can travel to via bike before boarding the train to complete their journey. Blue Island has made progress in improving its bike infrastructure, including reopening of the Chatham
Scott Shigley (n.d.)
ENERGY EFFICIENCY
Avenue bridge as a dedicated bicycle and pedestrian promenade.
51
Case Study: Mount Prospect, Illinois The Village of Mount Prospect was awarded funding through the RTA’s Access to Transit program, which helped construct concrete pads at the Mount Prospect Metra Station on the UP Northwest line, also served by two Pace Routes. The shelters used solar-powered lighting, and the project was based on recommendations from the Mount Prospect
Downtown Implementation Plan, which the Village completed with assistance from the RTA’s Community Planning program. The shelter is in an area that sees much pedestrian traffic and protects bikes from rain and snow, which helps increase trust for residents who hesitate to park their bikes alone for several hours.57
4.4 PARKLETS S t a ke h o l d e r s : Illinois Department of Transportation, Blue Island Public Works, Blue Island Chamber of Commerce Timeline: 1-5 Years PARKLETS
Implementation
Streets encompass a significant portion of urban communities, often comprising as much as 40% of public land.58 Streets become inaccessible for pedestrians through the high presence of both moving and parked cars. The main economic corridor of Western Ave. lacks streetscape amenities for pedestrians, causing people to rely on using their cars to travel throughout the area. Modifying this commercial spine to be more pedestrian friendly can help promote alternative means of transportation. Parklets can serve to activate streets as gathering space, slow traffic down, green concrete corridors, and promote economic activity.59 Additionally, parklets provide amenities such as benches, landscaping, lighting, and public art opportunities.
The city will collaborate with the Blue Island Public Works department as well as the Blue Island Chamber of Commerce to implement the parklets. As Western Ave. is an IDOT rightof-way, that governmental body will need to be included in planned changes. The Public Works department will begin the process with permitted designs for modular parklets and work with the legal department to discuss liability issues in the right of way. The Chamber of Commerce will assist in engaging businesses in explaining data indicating how parklets spur economic activity. This community outreach will help identify potential businesses that can host a parklet.
Bruce Gage (2019).
Figure 4-3:
ENERGY EFFICIENCY
Flora Ramirez (2021).
53
Activation of Commercial Corridor The parklets are temporary solutions for placemaking and
will open further opportunities such as spaces for public art or landscaping to absorb rainwater. They will further help gauge support for permanent
sidewalk extensions and removal of parallel parking. Parking installations may occur on a rotating schedule to encourage businesses to provide their
parallel parking spaces and for pedestrians to experience the variety of businesses Western Ave. has to offer.
Case Study: Aurora, Illinois In March 2021, the City of Aurora published a Downtown Parklet Guidelines and Application Packet that includes the location, materials, dimensions, and design options parklets must abide by. All parklets must have written permission to be placed in front of adjacent businesses and cannot obstruct access to fire hydrants, fire lanes, loading zones, roadways with posted speeds greater than 30 mph, and accessible parking spaces. Parklets
also need to meet handicap seating requirements and have wheelchair accessibility. The city has also designated start and end dates for which parklets will be allowed throughout the year; these are dependent on weather and approval from the City Clerk. The overall costs include the cost of each parking space, which is $2.00 per day; a permit fee that depends on the amount of time the parklet will be on the street; and an obstruction permit for the parklet.60
Victoria Kurlander (2021)
Introduction Blue Island can implement several green infrastructure initiatives to reduce energy usage and beautify the city. By increasing the tree canopy, Blue Island can utilize an inexpensive solution to target the Urban Heat Island Effect (UHI) along its commercial corridor and other identified key neighborhoods. If the city adopts a greener landscape ordinan ce, programs parking lots to include solar canopies, and incorporates cool pavements techniques, it will see even more benefits.
Programming Parking Lots
Solar Canopies
Blue Island can implement two different policies to reprogram their parking lots, one being more cost effective than the other: Creating solar canopies in designated parking lots to include electric vehicle (EV) stations powered by the solar canopy Applying cool pavement techniques to reflect an increased amount of the sun’s energy
Solar canopies would be utilizing wasted space in parking lots to reduce the UHI effect and promote EV usage. They could potentially provide an additional energy source for the proposed microgrid. Solar canopies do not need additional space set aside unlike a ground-mounted system, and they improve fuel efficiency of cars by offering shade so that a vehicle’s air conditioning does not need to be used as frequently 61
Top: Solar-Powered Electric Vehicle Charging Station, LA Solar Group Bottom: Solar Canopy in Santa Cruz, AE Sunpower
5.1 Programming Parking Lots Stakeholders: Blue Island
Planning Department
Timeline: 1-10 Years
ENERGY EFFICIENCY
5.0 Heat Island Effect
55
Cool Pavement Techniques For parking lots that do not install solar canopies, painting the pavement a lighter color is an easy and cost-effective method of residing the heat absorbed by asphalt. Colors other than white can be used as long as they are light colors, giving otherwise grey inf rastructure some character.
Researcher painting cool pavement technique to combat urban heat.
Roy Kaltschmidt (2012).
Implementation
69
Blue Island would need to identify initial parking lot locations - ideally located near Metra locations and municipal buildings - to build the solar canopies over. The Blue Island Department of Public Works can contract with an electrical engineering company to develop an installation plan. Implementation of cool pavement techniques would require transitioning to painting parking lots a lighter color to decrease heat absorption. Tree Canopy Restoration & Expansion
Stakeholders: Blue Island
Department of Planning, Natural Path Urban Forestry, Chicago Regions Trees Initiative (CRTI), Openlands Timeline: Initial Plantings: 1-5 Years Maintenance: 10+ years
within the study area. • Implement the Forestry Management plan developed by the Natural Path Urban Forestry with the help of the Planning and Public Wo r k s Department. In residential areas • Identify residents that could function as tree stewards to help maintain young trees planted in their neighborhood.
In 2016, Blue Island saw most of its tree canopy be reduced due to disease. At minimum, the city needs to replace the trees that were lost. All 3 tracts of the study area have a tree canopy of less than 50%.62 For each tree planted, Blue Island could see an average annual benef it upwards of $112 depending on the size of tree.63 Municipal Implementation & Coordination Blue Island can: • Refer to the 2012 Co m p re h e n s i ve Tre e Inventory conducted by Natural Path Urban Forestry • Leverage grant programs from the CRTI and Openlands to revitalize the tree canopy
ENERGY EFFICIENCY
5.2 Tree Canopy Restoration & Expansion
Green
Roofs
57
Tree canopy, Seattle Department of Transportation, Seattle Weekly, 2017.
5.3
Municipal Green Roofs Calumet Stormwater Collaborative, M e t ro p o l i t a n Wa te r Reclamation District of Greater Chicago, Citizens for Conservation, Chicago Wilderness, CMAP, Blue Island Fire Department, Blue Island Police Department, Blue Island City Clerk Stakeholders:
Timeline: 5-10 Years
Increasing the tree canopy in Blue Island is only one method to combat UHI. Greening the roofs of the city’s municipal buildings will also reduce UHI while providing additional energy savings for cooling and heating buildings. The City of Blue Island should install extensive vegetated roofs on the same buildings under consideration for solar panels (see Section 1.3): the City Clerk’s Office, police station, and f ire station. The city should also assess whether an intensive or semi-intensive vegetated roof could be installed on one of these buildings.
Case Study: Ipswich, Massachusetts
Types of Green Roofs Extensive vegetated roofs are lightweight, lowmaintenance roofs that support plants with shallow roots. Their primary purpose is environmental, helping to reduce stormwater runoff f rom buildings and local ambient air and surface temperatures.64 An extensive green roof on any or all of the three proposed buildings would benefit the city through reduced energy costs by insulating the building in the winter months and lowering temperatures in the summer.
Intensive vegetated roofs are heavier and require much more maintenance as they typically contain larger native plants like shrubs and flowers. They offer all the benefits of an extensive roof and can also be used for educational purposes if made publicly accessible. With nearly 13 schools less than two miles from these municipal buildings, there is an opportunity to engage Blue Island’s youth in sustainability at the same time they learn about their governmental bodies.
Ipswich, Massachusetts, with a population of approximately 13,000, received funding from the U.S. EPA to construct a green roof on a building used for affordable senior housing as part of a demonstration. The roof was 3,000 square feet and extensive. The new roof captured, on average, 50% of the rainfall, and even when wet from previous storms, delayed runoff by at least an hour.
Figure 4-4: Proposed Municipal Buildings Green Roofs
Police Station
Fire Station & City Clerk's Office
Cook County Government and Sarah Grumulaitis (2021).
ENERGY EFFICIENCY
Implementation and Funding
out citing again the benefits Upfront costs typically run of reducing stormwater f rom about $18 - 25 per runoff. Additionally, the U.S. a square foot.65 However, EPA has the Clean Water Blue Island already has State Revolving Fund, and connections with the the Illinois EPA has their Metropolitan Planning Green Infrastructure Grant Council with its Rain Barrel Program, both of which could program and could reach be used to help with costs.
59
70, 71
Cornell College of Agriculture and Life Sciences (2020).
5.4 Urban agriculture Stakeholders: Blue Island Residents
Likewise, the proliferation of green space will also lower the risk of severe flooding Timeline: 1-5 years, 5-10 years, as overall permeability 10+ years throughout Blue Island will improve. Urban agriculture is particularly well suited to decrease flooding because the soil is nutrientrich and can therefore Urban A g r i c u l t u r e hold more moisture. 68 Urban agriculture is a practice that can contribute to a more efficient use of energy and lead to innovative methods of energy usage. In New York City, urban agriculture can reduce UHI by 22%-44% through increasing green space.66 Even though Blue Island is less dense, a similar effect can be achieved. The majority of energy use in the food system occurs beyond the farm gate; the United Nations Food and Agriculture Organization estimates that over 75% of energy use in the food system of high-income nations occurs after cultivation.67 Therefore, localized food systems contribute to a reduction in energy usage.
Introducing Urban Agriculture to Blue Island
allow for the creation of Community Supported Agriculture and mandates The first step that Blue Island that the Illinois LINK card be can take is to amend the accepted for food purchases. zoning code. Currently, urban Fostering Urban Agriculture agriculture is not allowed in Blue Island. Therefore, The Blue Island Planning the municipal code will be Department and the Park amended to include a new District can work to identify zoning category to allow this vacant lots that meet the practice (see Section 7.4). requirements for urban agriculture and utilize The zoning amendments designated municipally prioritizes equitable access owned parklands. Once a to the benefits of urban list is produced, Blue Island agriculture. The amendments can work with local nonprofits to establish a network of community gardens. This partnership will not only provide available land to these organizations but also offer support to access funding.
Fresh fruits and vegetables and a sign for the local c o m m u n i t y - s u p p o r te d agriculture scheme from the former Blue Island community farm, BIOS Farm. (BIOS Farm, 2019)
ENERGY EFFICIENCY
61
Above: Growing Home farm, in Englewood, on the South Side of Chicago (Andrew Collings, 2018). Below: Chicago's Growing Solutions Farm (Nathan Lambrecht, 2021).
Funding of urban agriculture projects There are several federal grants that can help fund the establishment and maintenance of a municipal community garden. The U.S. EPA has the Healthy Communities Grant Program and Environmental Justice Small Grants Program.
The U.S. Department of Agriculture also has Grants for Urban Agriculture and Innovative Production for initiating and expanding gardens and for accelerating urban agriculture models. The National Institute of Food and Agriculture provides Community Food Projects Competitive Grants for community food projects or for projects that combat food insecurity.
Greener landscape 5.5 ordinance Stakeholders: Metra, Regional Companies Timeline: 1-4 years
Chicago’s current landscape Blue Island has adopted a ordinance covers 3 categories: Complete Streets Ordinance, it does not specif ically • Planting trees or shrubs address landscaping that on parkways would promote more • Landscaping to screen greenspace in new and the perimeters of parking existing developments. lots, loading docks, and other vehicular use areas By adopting a similar ordinance Blue Island would It also requires parkway be able to increase street plantings in the construction level vegetation along with of any principal building and their tree canopy which any addition or enlargement would also help decrease to an existing building if the surface temperatures new construction exceeds within the study areas. 1,500 square feet. Though
Tree Fund of Pottstown, PA (n.d.)
72
TLake Environmental Design (n.d.)
6.0 Waste Management ENERGY EFFICIENCY
6.1 A new recycling program Stakeholders: Blue Island
residents, Lakeshore Recycling Services, Blue Island Weatherization Program Contractors Timeline: 1-5 years
accessible, which reduces energy consumption. The renegotiation will add the following to Blue Island’s recycling program: •
A New Recycling Program • As the United States continues to increase its waste output, municipalities must explore more efficient systems to manage it.73 Blue Island will partner with Lakeshore Recycling Services (LRS) to develop a new recycling program that is more robust and innovative. This recycling program will make energy eff icient structures more
•
Retrofit Waste Management Program Organic Waste Collection Program Zero Waste Disposal Bins
Therefore, such a program is of value not just for Blue Island, but also for LRS. The program’s success can lead to LRS expanding its service options in other municipalities. This program will be unique to LRS and the region; Blue Island can therefore seek a unique partnership with LRS to limit service cost increases. For example, LRS can provide select services in-kind.
63
6.1.1 Retrofit Waste Management Program
Wireton Road. Public Works personnel will inventory these materials and provide this LRS will provide collection information to the energy receptacles for active assessor and the Community weatherization projects as Development Manager. awarded by the BIGH Project (see Section 3) to separate 6.1.2 Organic Waste construction materials. Collection Program This is modeled after a similar effort in Evanston, LRS will introduce an IL.74 The receptacles will organic waste collection be temporarily available at program to Blue Islanders project sites determined by that live in the study area. the energy assessor involved This program will be a pilot with the BIGH project. program for Blue Island and Upon completion of the LRS and will take advantage weatherization project, LRS of the aerobic digester that will deliver these materials LRS is already operating. to a sheltered area of the Public Works Facility at 3153
Case Study: Illinois comprehensive waste service Mount Prospect, IL has a comprehensive waste collection service. Residents can separate out their food and organic yard waste. This is then collected separately from other trash. The program has diverted 35% waste away from landfill and was recognized by the National Waste & Recycling Association. The program runs from April to mid- December at no additional costs for residents.
Blue Islanders in the study area will be provided with a container for organic waste. In this container, residents will collect their organic waste, which includes food and yard waste. LRS will then collect the organic waste and efficiently dispose of it. This program involves an increased number of LRS collecting trucks in the area. To offset issues caused by increased emissions, Blue Island and LRS should redesign the pickup schedule. For example, while collection for regular waste is weekly, organic collection pickup can be every 2 or 3 weeks, or viceversa. The truck increase may also be balanced by a decrease
in public waste collection due to newly installed solar compacting bins as discussed in the next section. 6.1.3 Zero Waste Disposal Bins
Depending on the model chosen, solar compacting trash receptacles offer a variety of benefits. Standard bins use built-in solar panels to power their machinery, compacting separated trash and recycling bins to reduce volume and decrease the number of pickups necessary. The best use of a solar compactor is when paired with software that alerts the trash collector as to when the bin is full so that unnecessary trips are not taken. LRS employees would need to be trained on this software and change their routes accordingly.
As part of its renegotiation, Blue Island should replace its Figure 4-5: Current Waste Bins public, single-compartment trash bins with solar compacting receptacles. The city’s current public trash receptacles do not offer a recycling option and are simple, large plastic barrels (see Figure ??). Not only does this not encourage proper disposal of recyclable waste, but the unsightly bins do not instill pride in residents for their city. Victoria Kurlander (2021).
Community Education The success of this program hinges on properly communicatin g with residents. Blue Island’s Marketing Department and Public Library will collaborate with LRS to release a campaign. LRS will provide much of the content of the campaign while Blue Island focuses on effective community outreach. This campaign will be in both Spanish and English and will address general recycling best practices and inform residents how to participate in the organic waste collection and recycling programs. The information will be distributed through various forms including: • •
• •
Community meetings at the public library Online informational sessions, later to be uploaded to Blue Island’s website Flyers Social Media notices
Stakeholders: City of Blue
Island, Metropolitan Water Reclamation District of Greater Chicago Timeline: 1-5 years
Most combined sewer systems are unable to handle modern day usage; they can often exceed their capacity resulting in overflow events.75 In 2012, Blue Island identified several sewer improvements in a Capital Improvements plan totaling over $6 million dollars, a substantial investment.76 Blue Island is currently adopting green infrastructure measures to reduce the burden on the sewer system, but another measure to reduce the number of overflow events would be to invest in smart data infrastructure geared towards monitoring and maintaining the combined sewer system within the municipality. This move could reduce overflow events by billions of gallons of water per year. 77
Increasing Efficiency To work towards decreasing the amount of overflow events experienced in Blue Island, the city should implement a Real Time Control (RTC) system to better control and adapt at what rate stormwater is released downstream into the combined sewer system. RTC Implementation can be broadly def ined as a system that adjusts facility operations in real-time due to online measurements. These measurements monitor water level, rainfall, and weather forecast at minimum. Depending on the needs
Case Study: Hawthorne, California: Real-Time Monitoring to Prevent Sewer Overflows Hawthrone installed 50 SmartCover units (about 2.5% of the city’s manholes) real- time remote level monitoring sensors covering 66 of the hot spots in their sewer system. These sensors provided the city with real-time early warning of pre-flow events through alarms and the use of a data analytics tool to indicate when pipes were beginning to accumulate dirt; grit; fats, oils, and grease (FOG); or tree roots, which could change the daily pattern of water flow in the pipes. Since the installation of the real-time monitoring system, Hawthorne experienced only one overflow in its sewer collection system and was able to virtually eliminate sewer overflows in its collection system, saving more than an estimated $2 million in fines and mitigation costs since 2006. 78
of the municipality, an RTC the following elements: system can also measure • Control devices (valves temperature, infiltration rate, and gates) and water quality parameters. • Data communication infrastructure An RTC system would include • Sensors to collect measurements
ENERGY EFFICIENCY
6.2 combined sewer system efficiency
65
7.0 ZONING Figure 4-6: Blue Island Zoning Map, 2017
Stakeholders: Blue Island Residents, Blue Island Landowners, Non-profit organizations active in Blue Island
C1: Central Area Commercial C2: Highway Commercial
Timeline: 1-5 Years
I1: Limited Industry
In recent years, Blue Island has pursued an innovative approach to zoning by introducing the UTOD. This zoning district already boasts language around renewable energy and fosters multi-modal transportation.
I2: General Industry R2: Single Family Residential SU: Special Use UTOD
There are a few zoning text amendments that, if applied to the larger study area, will facilitate the implementation of this strategic energy plan. The zoning changes include the following: ▶
▶ ▶
Introduction of Blue Island’s Housing Weatherization program in regard to landmarked structures. Introduction of solar panel language for areas outside of the UTOD area. Introduction of a new zoning district to allow for urban agriculture in certain areas of Blue Island.
City of Blue Island (2017).
7.1 Weatherization Program & Landmarked Structures The BIGH Project (see Section 3) is an ambitious plan that will retrofit all housing structures by 2035, including landmark structures. Landmark structures are an important asset to Blue Island, and therefore, retrofitting
will need to be completed with no effect to exterior façades. However, the Historic Preservation Ordinance should introduce language so that the process to weatherize landmark buildings is clear.
1. Establish an energy standard for R1 structures: this will create a designation for a residential building or a group of residential buildings built in 1990 or earlier that meet a 15% reduction in energy consumption compared to an initial energy audit. 2. Address retrofitting exterior windows: a text amendment to include windows as part of weatherization Certificates of Appropriation if consistent with the architectural style of the landmarked structure. See Appendix A.3 for full text of changes.
ENERGY EFFICIENCY
7.2 Solar Panels Outside the UTOD Area The largest issue with implementing many solar energy changes is Blue Island’s own solar ordinances. There are currently no permissive uses of solar outside of the UTOD, and as discussed in the Community Profile, those permissions are restrictive. It is recommended that Blue Island expand its current UTOD solar panel
ordinance to the whole city and then assess if permissive uses cannot be increased to allow for up to 90% of rooftop solar coverage to remove barriers for implementation. Developments in solar panel aesthetics means that the panels do not need to interfere with the look of a building.
67 Tim McDonnell (2020).
7.3 New Zoning District for Urban Agriculture Blue Island will introduce a new zoning category called Productive Land (PL) to allow urban agriculture in the city. This new district will be adjacent to the residential district and the UTOD to ensure that urban agriculture will be easily accessible to the community. The zoning text amendments are modeled after urban agriculture in the cities of Detroit, Baltimore, and Chicago.79 80 81 This new land use category includes two permitted principal uses by right: 1. Limited Urban Agriculture (LUA) for smaller operations in which a resident or small organization can harvest food crops or non-food crops
(e.g., flowers) for personal or group consumption or for community beautification if they choose to do so. A special use permit is needed to allow for built structures, such as greenhouses, hoop houses, etc. 2. Community Gardens (CG) are an area managed and maintained by a group of individuals to grow and harvest food crops or nonfood crops (e.g., flowers) for personal or group consumption, for community beautification, for donation, or for sale that is accessory or subordinate to the garden’s primary purpose. Community Gardens will be
required to donate surplus products to either the Blue Island Park District or other community-serving organizations. Community Gardens will also be required to be accessible to the community by regularly offering free-of-charge workshops and education programming around healthy eating, composting, recycling, and renewable energy. A community garden may include common areas (e.g., workshop sheds or greenhouses) maintained and used by the group. They are typically owned or managed by public entities, civic organizations or community-based organizations who have relationships with the municipality, work with them to develop land, and
are maintained by volunteers/ residents. Additionally, the zoning amendments are designed to create an equitable local food ecosystem. All farmers and sellers that participate in this ecosystem will have to accept LINK, to ensure equal access to f resh food. The zoning amendment ensures: • Farmer’s Market and Farm Steads • Community Supported Agriculture (CSA) • Apiaries for Beekeeping • Licensing in Blue Island mandates that the Illinois Link Card be accepted for food purchase. See Appendix A.4 for full text of changes.
Conclusion The move to green energy can not only boost a city’s economy, but it can also provide its residents a healthier and more equitable future by reducing energy consumption and creating a more selfsufficient community in which they can take pride. Energy efficient homes mean affordable living for lower income homeowners, while pedestrian-friendly streets provide cyclists, walkers, and those with personalized transporters a safe and pleasing path to access their city. An increase in vegetated infrastructure and the management of waste and stormwater will mean a cleaner environment in which to work and play. The effectiveness of these objectives, however, depends on the willingness of city officials to assess and change ordinances that currently limit the growth of clean energy and agriculture in Blue Island. If the effort is made towards these proposed policy changes, Blue Island’s residents and surrounding environment will find a future of choice, security, and safety for everyone to enjoy.
Victoria Kurlander (2021).
Implementation Timeline for a
GREEN ECONOMIC FUTURE
SUMMARY
Figure 5-1:
69
Figure 5-2:
Implementation Timeline for an
ENERGY EFFICIENT CITY
A Greener future lies ahead Worldwide, cities are feeling the negative impacts of the changing climate and every city will need to take a critical look at their policies to determine their vision of a sustainable and equitable community for its residents. Though intimidating this is an opportunity to think beyond the status quo and seize the moment. Blue Island is in position to take advantage of the national and state push for green energy solutions and give its residents a strong, green economy in an energy efficient community that provides equity, choice, and security to everyone. The policies presented have taken into account Blue Island’s strengths and weaknesses: from its diverse population and strong freight infrastructure to the increasing incidents of flooding and challenges of connectivity. Recommendations include easily implementable policies such as retrofits of intersections to more bold initiatives such as a community microgrid. Each policy is tailored to Blue Island’s history, land use, residential makeup, and current energy-saving procedures and accounts for how well it will improve the equity, sustainability, and resiliency of the community. However, recommendations cannot be effective if they remain unused, and thus the ease of implementation, cost-effectiveness, and how well each program could be replicated throughout the city were also considered. Business-as-usual will no longer suffice. If Blue Island successfully executes these policy proposals, it can become a model city for not only the Chicagoland region but nationwide. This energy plan may seem ambitious. It is ambitious. Blue Island can be ambitious. For its residents and for its future, Blue Island can be a community that does more than survive climate change – it can thrive.
Blue Island Historical Society (2017).
Appendix
Equity - Who will bear the burdens of our recommendations? Will our plan benefit everyone, or only a select few?
A.1 Methodology A team of nine students in the Master’s of Urban Planning and Policy at the University of Illinois at Chicago worked together to produce this strategic energy plan for the City of Blue Island, Illinois as a class assignment. The guidelines for this assignment were to develop a strategic energy plan for Blue Island with resiliency, sustainability, and equity as part of the plan’s critical pillars. After a study of the current conditions and land use patterns of Blue Island, the team identified a study area that satisfactorily reflects the whole of Blue Island. The study area was chosen because of the variety of land use patterns, including economic corridors, residential, and industrial corridors. The study area also contains the Uptown Transit Oriented Development (UTOD), representing Blue Island’s own vision for its future. Additionally, residents of the study area have similar demographic measures compared to the whole of Blue Island. By developing a plan for a study area, the team identified three additional criteria: implementation, efficiency, and scalability. These criteria were identified in order to ensure that the contents of this plan, while curated for the study area, can be applied elsewhere in Blue Island. This discussion resulted in the following definitions for our six criteria of equity, sustainability, resiliency, implementation, efficiency, scalability.
Sustainability - Do future generations have a voice in our assessments? Resiliency - Will our community be stronger? Will they be prepared for the future? Implementation - Will the government agree to it? Do they have the capacity? Will it be easy to undertake? Efficiency - What about cost? Do we have the resources? Scalability - Can this be expanded to all of Blue Island? Based on extensive research of the current conditions in Blue Island, the team worked through various iterations of the plan’s vision for Blue Island. The team identified housing, transportation, and economy as key areas for policy intervention, as well as how the criteria will be applied to Blue Island. The team completed the drafting of policy interventions by separating into two teams the Housing, Population, and Economy Team and the Transportation, Infrastructure, and Land Use Team. Each team pursued policy interventions and communicated regularly to identify opportunities for collaboration. After a list of policy interventions was constructed, each policy intervention was evaluated based on each criteria to assign a “high, medium, or low” impact.
bridging blue island
While conversions of neighborhood energy sources towards more renewable options affects a housing structure externally, ideas for retrofitting older housing stock will have to encounter the realities of some of these cross-fuel systems.
However, four interviews were conducted throughout the planning process:
Methodology for Calculating Monthly Bills:
-
Blue Island Planning Department Chicago Vintage Homeland Association OAI Workforce Development The head of former BIOS Farm, Joe O'Meara
The team remained cognizant of the missing voices from residents and stakeholders. The decision of which policy interventions and their design is based on the research conducted about current conditions, the criteria and goals identified by the team, and the four interviews conducted. A.2 Housing Energy Burden Limitations on Household Energy Consumption The limitation of the Census’ data is that the methodology appears to only categorize housing units based on what their primary method of heating is. However, in many circumstances, most forms of gas heating also use electricity to monitor systems like pumps and controls. For example, in older, typically historic houses where a gas boiler is connected to radiators, an estimated 5% of total energy is electrical.
Heating fuel bills vary depending on the household income and energy usage. Certain metrics, like calculating using the kilowatt hourly rate, are not dependable because they can change with every municipality. They are also not ideal because they require estimates of the average square footage of a dwelling unit, which can easily skew one way or another. The analysis uses data from the Low-Income Energy Affordability Data (LEAD) Tool from the Department of Energy. The Tool uses Public Use Microdata Samples (PUMS) from the 2018 American Community Survey, and is therefore its own limitation. PUMS data allow for the creation of new datasets of estimates for a particular subject, and the Department of Energy uses them to describe energy burden. The default method is to categorize the study area’s population into cohorts based on the Area Median Income (AMI) for a family of four. The average family size in the three tracts is 3.65 which is comparable to the LEAD Tool’s 4-person household calculations. This AMI statistic is calculated by the Department of Housing and Urban Development, which--for our study area--assesses the incomes of the Chicago-Naperville-Elgin Metropolitan Statistical Area. It places the Area Median Income at $84,600 a year. This means 50% of the metropolitan population earns more than $84,600 and 50% of the metropolitan population earns less than $84,600.
bridging blue island
APPENDIX
Using this evaluation, the teams decided which policy interventions. Due to time and pandemic-related constraints, the team did not conduct resident interviews. Furthermore, the team did not reach out to every stakeholder that is identified in this plan.
73
LEAD cohorts further categorize people into those earning 0-30%, 30-60%, 60-80%, 80-100%, and 100% and more of the Area Median Income. Heating fuel bills for these cohorts is different depending on the household’s cohort and the tract they reside in. The methodology for our profile involved separately adding each tract’s gas and electricity bills, across all cohorts, and finding an average. The mean of this new figure was then calculated, and subsequently divided by twelve months to find a workable monthly bill for utility gas and electricity that can represent all AMI cohorts. These bills are $63.10 a month for utility gas and $90.84 for electricity. Annually, the average expenditures for any given household in the three tracts are $757.20 for utility gas heating and $1,090.08 for electrical heating. Methodology for Calculating Latinx Energy Burden AMI: To focus on vulnerable populations that can benefit from structural policies and programs that reduce energy wastage, the 0-30% of AMI cohort was analyzed qualitatively. However, the AMI for Chicagoland characterized Blue Island and our study area differently. According to figures from the 2018 American Community Survey (to match the data the LEAD Tool uses), the median household income for all of Blue Island was $48,398. In our three tract study area, the median household income was $50,536. This skews wealthier because the Western Tract - 8235 - consists of different socioeconomic demographics than the other two tracts. Nevertheless, a median income of $50,536 is 59.7% of the Chicagoland AMI, meaning that more households in Blue Island fit into cohorts of 0-30% and 30-60% of the AMI.
A.3 Weatherization Program and Landmarked Structures- Amendment Text To better implement weatherization for landmarked homes in Blue Island, the City will add the following text amendments: For Section 3.2 - Definitions of Words and Phrases of the Zoning Ordinance: a text amendment to add “(40) EFFICIENT CONTEMPORARY USE: is the designation for a residential building or a group of residential buildings built in 1990 or earlier that meet a 15% reduction in energy consumption compared to an initial energy audit.” to establish an energy standard for R1 structures. For Section 4.4 - Schedule Use of Controls - District R1 of the Zoning Ordinance: a text amendment to include the mention of “efficient contemporary use” in the district’s intent to establish structural conformity. •
This will affect Section 6.4 (1) of the Zoning Ordinance, in which residential structures in an R1 district that do not meet the efficient contemporary use standard through defined repair and alterations regulations will result in a non-conforming structure.
•
This will affect Section Two.A.21 - Rehabilitation of the Historic Preservation Ordinance by operationalizing the phrase “efficient contemporary use” to conform with the definition of the Zoning Ordinance. This means landmarked homes will be encouraged by the Historic Preservation Commission to undergo weatherization so as to not be non-conforming in R1 districts.
bridging blue island
These changes will form arguments that the Historic Preservation Commission has a duty to pursue energy efficient weatherization in its project approval process because it will conform to its own mandate in Section One.A.4: “Protecting and enhancing the attractiveness of the City to have buyers, visitors and shoppers and thereby supporting business, commerce, industry, and providing economic benefit to the City...”
•
This will also affect Section 4.06.3.F - General Cross-reference Guide for Additional Regulations, Nonconforming of the Uptown Oriented Development Zoning District Ordinance, in which definitions of residential conformity regarding efficient contemporary use will come from the Zoning Ordinance.
For Section 4.06.8.A.2.b - Minor Remodeling of the Uptown Transit Oriented Development Zoning District Ordinance: a text amendment to include windows, if consistent with the architectural style of the landmarked structure. •
In the UTOD, Minor Remodeling does not require approval from the Historic Preservation Commission, but rehabilitations to landmarked buildings require a Certificate of Appropriateness. Therefore, it will be strongly recommended to the Historic Preservation Commission to award Certificates of Appropriation by acclamation to “major changes” to landmarked structures, as defined by Section Nine.A.1 of the Historic Preservation Ordinance, when the sole changes are for weatherization of windows that are consistent with the architectural style of the landmarked home.
•
In the event a Certificate of Appropriateness is not awarded to a weatherization project of a landmarked home, the homeowner will be encouraged to pursue a Certificate of Economic Hardship from the Historic Preservation Commission to argue that weatherization is consistent with “efficient contemporary use” and an inability to complete retrofits will threaten the longevity of the landmarked property, as mandated by the Commission’s Statement of Purpose.
A.4 Productive Land Zoning District for Urban Agriculture Amendment Text: Definitions and Zoning Urban Agriculture- the growing, processing and distribution of plant and animal products- by and for the local community- within an urban environment. Community Garden (CG)- An area managed and maintained by a group of individuals to grow and harvest food crops or non-food crops (e.g. flowers) for personal or group consumption, for community beautification, for donation, or for sale that is accessory or subordinate to the garden’s primary purpose as described above in Urban Agriculture. A community garden area may be divided into separate garden plots or orchard areas for cultivation by one or more individuals or may be farmed collectively by members of the group. A community garden may include common areas (e.g., workshop sheds or greenhouses) maintained and used by the group. They are typically owned or managed by public entities, civic organizations or community-based organizations who have relationships with the municipality, and work with them to develop land, and maintained by volunteers/ residents.
bridging blue island
APPENDIX
•
75
•
Organizations or individuals running a CG on municipal land will be required to donate any surplus products to the community via Blue Island Park District or other community-serving organizations.
•
Organizations or individuals running a CG on municipal land will be required to offer free-of-charge workshops for all ages which can range from topics including urban agriculture, healthy eating, composting, recycling, and renewable energy.
•
Organizations or individuals running a CG on municipal land will be required to collaborate with local schools to host school tours annually.
•
Organizations or individuals running a CG on municipal land will be required to have at least 66% of its staff be Blue Island residents.
•
Soil Contamination- To avoid health threats associated with contaminated soil, the proposed zoning code rewrite requires that anyone cultivating food for human consumption on a CG must test and, if necessary, remediate the soil in which they are growing, or else use imported soil and an impermeable barrier. The Blue Island Park District should work to develop comprehensive soil standards.
Specifications: The CG can be maximum 25,000-square-feet. It is intended to prevent a single community garden from dominating a given block or detracting from the block’s existing residential or commercial character.
•
The limit does not apply to gardens located in the proposed PL District since it is specified for urban agriculture. There can be more than one community garden that is 25,000 square feet on a single block. The size limit applies to individual gardens, not to individual blocks.
•
Structures (defined below) are permitted by right. Community garden accessory buildings may be up to 675 square feet in area.
*These specifications are modeled after urban agriculture plot size requirements in Chicago. [1] Limited Urban Agriculture- Similar to a CG, but need a Special Use permit to allow for built structures. LUA does not have the municipal partnership nor obligations that CGs have. They are smaller operations in which a resident or small organization can harvest food crops or non-food crops (e.g. flowers) for personal or group consumption or for community beautification if they choose to do so. This donation can be arranged through the closest CG. Specifications: •
No commercial usage of products.
•
LUA can have composts, which must be securely fastened and fenced (See below Compost definition for more details). Byproducts from said compost must be used on site.
•
Apiaries are prohibited in R-1 and UTOD.
bridging blue island
• • •
Use permitted by right only in the PL Zoning or in a CG. Up to five hives or colonies of honey bees may be kept as an accessory use. Beekeepers must register with the Illinois Department of Agriculture (IDA).
Farm Stand- A temporary structure, accessory to a CG for the display and sale of, food crops or non-food crops (e.g. flowers) for personal or group consumption, locallyproduced food products and similar non-animal agricultural products grown or produced on the general property of the CG upon which the stand is located. •
This stand will be the meeting point for food pickup, similar to a Community Supported Agriculture scheme (CSA). However, this “CSA” will be specifically for the residents of Blue Island who experience food insecurity/ have little access to obtain fresh produce. There will be a formalized system set up in which residents registered through public assistance programs such as SNAP will be automatically enrolled through the Farm Stand “CSA” and also can use food stamps to purchase SNAP- eligible crops.
•
Require the farm stand to accept SNAP benefits and sell a certain amount of SNAP-eligible crops.
•
They also will be given the opportunity to volunteer on city farms for crop discounts and potential job training.
•
This Farm Stand/ CSA venture will also be donating 40% of their crops to local food pantries, such as The Salvation Army Crossgenerations Worship & Community Center.
•
The excess crops after the “CSA” and donation rations then can be sold for a profit to community members who do not qualify for public assistance.
Farmers Markets- A pre-designated, municipally owned or operated area, with or without temporary structures, where CGs sell excess harvest food crops or non-food crops (e.g. flowers) for personal or group consumption. Community development and outreach tactic. Specifications: •
Farmers markets are permitted as an accessory use where located on the same zoning lot as municipal parking lots, religious institutions, educational institutions, schools, outdoor recreation facilities, and non-profit neighborhood centers.
•
Sale of farm products grown or produced at CGs is allowed as an accessory use at a farm stand located on the property of the CGs from which the farm product is grown or produced. Sale of farm products grown or produced at CGs is also allowed at the proposed farmers market location at the corner of Broadway St. and Chatham St., which is across from the Portland Playlot and Lincoln Elementary School.
•
This location was selected due to its proximity to the recreational facilities of the Cal-Sag Channel and the Chatham Street Bridge and the Division Street Bridge.
bridging blue island
APPENDIX
Apiaries- A place in which a colony or colonies of bees are kept.
77
•
Also, there is historical precedence because of the 1915 farmers market which was located nearby on Broadway St. and S. Western Ave.
Compost- the natural degradation or controlled biological decomposition of organic waste material, such as yard and food waste, to yield a nuisance-free humus-like product. The proposed zoning code rewrite allows on-site composting at LUAs and CGs within any zone.
Structures: Rainwater Catchment System- A method of catching rainwater runoff from the roof of a structure into rain gutters that channel into a rain barrel, drum, or cistern.
•
Under the proposed code, composing on-site is allowed as an accessory use, so long as any compost pile is located at least 3 feet away from any lot line and composting areas and structures are maintained in a way that protects adjacent properties from nuisance odors and the attraction of rodents or other pests.
•
Organic waste material for composting may also be accepted from outside sources only on municipallyowned CG land, not in LUA.
•
For private residences, composting is considered a permitted encroachment in yards. Specifically, a compost pile is allowed as a permitted encroachment only in a rear yard (not a front, corner, side, or interior side yard) and must be contained within a bin. It must also be at least 3 feet from any lot line.
•
Composting specifically excluding bones, meat; fat, grease, oil, raw manure, and milk products.
•
The amount of compost material cannot exceed 15 cubic yards in LUA in zones R-1 and UTOD, and 30 cubic yards in CG zoned in PL, at any given time. CGs that fall into the R-1 and UTOD can apply for a Special Use for the largest compost capacity.
Hoophouse- An unheated structure whose roof and sides are made largely of transparent or translucent material (not glass) for the purpose of the cultivation of plants. Shed- a simple roofed structure, typically made of wood or metal, used as a storage space, a shelter, or a workshop. Greenhouse- A building or structure whose roof and sides are made largely of glass or other transparent or translucent material and in which the temperature and humidity can be regulated for the cultivation of plants A greenhouse may or may not be a permanent structure. Raised Bed- Raised bed gardening is a form of gardening in which the soil is formed in beds, which can be of any length or shape, but are usually about 3-4 feet wide. The soil is raised above the ground and is usually enclosed by a frame made of wood, rock, or concrete blocks, and may be enriched with compost. •
They will be predominantly used if the soil is poor or if we are building on hardscape.
bridging blue island
Pros: Home energy consumption will decrease. The program can target low-income households who experience a higher energy burden.
APPENDIX
Housing 3.0
[1] Department of Planning and Development- Chicago. (2021). Urban Agriculture FAQ. https://www.chicago.gov/city/en/depts/dcd/supp_ info/urban_agriculturefaq.html#:~:text=The%20 25%2C000%2Dsquare%2Dfoot%20size,existing%20 residential%20or%20commercial%20character.
Cons: Weatherization may induce gentrification and displacement.
A.5 Policy Proposal Details Microgrid 1.0
Urban Agriculture 5.4
Pros: Blue Island will be self-sustainable, meet modern energy standards, and have a resilient energy supply.
Pros: Urban Agriculture reduces energy usage by decreasing the heat island effect.
Cons: High price point of investments in solar and wind power
The additional green space also decreases risk of flooding. The project will increase accessibility to fresh food.
Economy 2.0
Cons: Possible environmental degradation without sustainable agriculture practices.
Pros: Reduces freight presence on residential roads and locates warehousing and storage near existing rail lines to shorten transport time for goods. Creates and retains jobs within freight, rail, logistics, and manufacturing which offers lifelong careers for people. Lessens the environmental impact of freight by strategizing for cleaner and more efficient ways to move trucks, reduce noise pollution, and improve safety.
*Unless otherwise written in text or captioned otherwise, all photos are property of the team members involved in this plan. *If you made it this far, thanks for reading our plan!
Cons: Certain barriers include the scale and time it will take to construct new warehouses as well as change the operations of private businesses to align with the city’s clean energy goals.
bridging blue island
79
REFERENCES 1 S. 2814, State of Illinois Cong. (2016) (enacted). Retrieved 24, 2021, from https://www.ilga.gov/legislation/99/SB/ PDF/09900SB2814lv.pdf 2 H. 0804, State of Illinois Cong. (2021) (introduced). Retrieved 24, 2021, from https://ilcleanjobs.org/wp-content/ uploads/2021/02/CleanEnergyJobsAct. pdf 3 Lawson, A. J. (2021). Clean Energy Standards: Selected Issued for the 117th Congress (United States, Congressional Research Service). Retrieved f rom https://crsreports.congress.gov/product/ pdf/R/R46691 4 Chicago Sunday Tribune. (1900, March 4). How Chicago’s Suburbs Were Planted And Named– Norman Rexford’s Journey to Blue Island. Blue Island Historical Society, 2019. Retrieved from https://blueislandhistoricalsociety. com/2019/01/07/how-chicagos-suburbswere-planted-and-named-normanrexfords-journey-to-blue-island/ 5 Sulski, J. (1997, Dec. 18). Showing The Way. Chicago Tribune, Special to the Tribune. Retrieved from https://www. chicagotribune.com/news/ct-xpm-199712-18-9712180088-story.html 6 Volp, J.H. (1938). The first hundred years, 1835-1935: historical review of Blue Island, Illinois. Illinois Historical Society. Retrieved from https://archive. org/details/firsthundredyear00volp/ mode/1up 7 Volp, J.H. (1938). The first hundred years, 1835-1935: historical review of Blue Island, Illinois. Illinois Historical Society. Retrieved from https://archive. org/details/firsthundredyear00volp/ mode/1up
8 U.S. Census Bureau. (2019 & 2000). American Community Survey, 5-Year Estimates. Table DP05: Demographic & Housing Estimates. Retrieved March 25, 2021, from https://data.census.gov 9 U.S. Census Bureau. (2000). DEC Summary File 1. Table 71: Race. Retrieved March 25, 2021, from https://data.census. gov 10 City of Blue Island. (n.d.). City of Blue Island Comprehensive Plan 2012. Retrieved from https://www.blueisland. org/wp-content/uploads/government/ plancommission/FY12-0106-BLUEISLAND-COMP-PLAN_050712lowres.pdf 11 ibid 12 Regional Transportation Authority. (2021, January 13). Pace Bus Ridership. Retrieved April 5, 2021, from https://www. rtams.org/dataset/pace-bus-ridership 13 Iowa Department of Transportation. (n.d.). About highway-railroad crossings - Office of rail transportation. Retrieved f rom https://iowadot.gov/iowarail/ highway-railroad-crossings/aboutcrossings
sewer-overflows-csos 17 Metropolitan Planning Council. (n.d.). Stormwater management. Retrieved from https://www.metroplanning.org/ work/project/23/subpage/ 18 U.S. Census Bureau. (2019). American Community Survey, 5-Year Estimates. Table DP04: Housing by Select Characteristics Retrieved February 28, 2021, from https://data.census.gov 19 Source: U.S. Census Bureau. (2019). American Community Survey, 5-Year Estimates. Table DP04: Housing by Select Characteristics Retrieved February 28, 2021, from https://data. census.gov 20 Blue Island Historic Preservation Commission. (n.d.) Blue Island Landmarks. Landmark and Historic District Nominations, City of Blue Island. 1-3. 21 Blue Island Planning Commission, Tesla Associates, Inc., and Ginkgo Planning & Design Inc. (2012). Blue Island Uptown Transit Oriented Zoning District. 2-37.
14 City of Blue Island. (2021, January 27). West segment of Cal-sag trail completed. News and Events. Retrieved from https://www.blueisland. org/2021/01/27/west-segment-of-calsag-trail-completed/
22 City of Blue Island. (n.d.) City of Blue Island, Illinois Audited Financial Statements for the Year Ended December 31, 2016, pp. 91. Retrieved April 6, 2021, from http://www.blueisland. org/citizen-information/financial-audit/
15 City of Blue Island. (n.d.) Calumet Rivers Development Project. Sustainability & Environment. Retrieved f rom http: //www.blueisland.org/ sustainability-environment/calumetrivers-development-project/
23 City of Blue Island. (n.d.) City of Blue Island, Illinois Annual Financial Report for the Year Ended December 31, 2019, pp. 88. Retrieved April 6, 2021, from http://www.blueisland.org/citizeninformation/financial-audit/
16 U.S. Environmental Protection Agency. (2020, August 13). Combined sewer overflows (CSOs). Retrieved from https://www.epa.gov/npdes/combined-
24 City of Blue Island. (n.d.) City of Blue Island, Illinois Annual Financial Report for the Year Ended December 31, 2018, pp. 88. Retrieved April 6, 2021,
from http://www.blueisland.org/citizeninformation/financial-audit/ 25 U.S. Energy Information Administration - EIA - independent statistics and analysis. (n.d.). Retrieved April 04, 2021, from https://www.eia.gov/ beta/states/states/IL/overview 26 Center for Neighborhood Technology. (n.d.). Chicago Energy Regional Snapshot. Retrieved f rom https: //www.cmap.illinois. g o v /d o c u m e n t s / 1 0 1 8 0 / 6 0 8 1 9 / RegionalEnergyReport.pdf/eda696318694-454e-a262-efda9fb930b0 27 Project Sunroof [Map]. (n.d.). Retrieved from https://www.google. com/get/sunroof 28 City of Blue Island. (n.d.). Creating Space for the Future – Building Demolition at 11955 Vincennes. Announcements. Retrieved f rom http://www.blueisland.org/2020/12/29/ creating-space-for-the-future-buildingdemolition-at-11955-vincennes/ 29 Giraldez Miner, J. I., Flores-Espino, F., MacAlpine, S., & Asmus, P. (2018). Phase I Microgrid Cost Study: Data Collection and Analysis of Microgrid Costs in the United States (No. NREL/ TP-5D00-67821). National Renewable Energy Lab. (NREL), Golden, CO (United States). 30 Giraldez Miner, J. I., Flores-Espino, F., MacAlpine, S., & Asmus, P. (2018). Phase I Microgrid Cost Study: Data Collection and Analysis of Microgrid Costs in the United States (No. NREL/ TP-5D00-67821). National Renewable Energy Lab. (NREL), Golden, CO (United States). 31 Center for Sustainable Energy. (2021). How much does a typical residential solar electric system cost?
32 Project Sunroof [Map]. (n.d.). Retrieved from https://www.google. com/get/sunroof 33 Future Energy Jobs Act Webpage. (n.d.). Retrieved f rom https://www. futureenergyjobsact.com/ 34 Windustry. (n.d.) How Much Do Wind Turbines Cost? Windustry. Retrieved from www.windustry.org/ how_much_do_wind_turbines_cost 35 May, B. (2005, May 31). Solar Power: A Hot New Trend in the Fire Service. Firehouse. Retrieved f rom https:// www.f irehouse.com/tech-comm/ article/10513911/solar-power-a-hot-newtrend-in-the-fire-service 36 Smart grid. (n.d.). Retrieved April 21, 2021, from http://iitmicrogrid.net/ microgrid.aspx 37 Mid-America Freight Coalition. (n.d.). IAIS Blue Island, IL. Regional Freight Study. Retrieved from https:// midamericafreight.org/index.php/rfs/ network-inventory/rail/intermodalfacilities/iais-blue-island-il/ 38 Chicago Metropolitan Agency for Planning. (n.d.) Rail Crossing Delays in Metropolitan Chicago. Retrieved from https://www.cmap.illinois.gov/updates/ all/-/asset_publisher/UIMfSLnFfMB6/ content/rail- crossing- delays-inmetropolitan-chicago 39 Jones, Lang, LaSalle. (2018). Why multi-story warehouses are coming to America. JLL. Retrieved from https:// www.jll.cl/es/trends-and-insights/ investor/Why-multi-story-warehousesare-coming-to-America
40 Jones, Lang, LaSalle. (2018). Why multi-story warehouses are coming to America. JLL. Retrieved from https:// www.jll.cl/es/trends-and-insights/ investor/Why-multi-story-warehousesare-coming-to-America 41 Morris, Keiko. (2018). In New York City, Warehouses Have Nowhere to Go But Up. The Wall Street Journal. Retrieved from https://www.wsj.com/ articles/in-new-york-city-warehouseshave-nowhere-to-go-but-up-1517061600 42 Hicks, C. and Barbeau, A. (2019). Equity, innovation can be part of Illinois’ efforts to electrify transportation. Environmental Defense Fund. Retrieved from http://blogs.edf.org/ energyexchange/2019/05/22/equityinnovation-can-be-part-of-illinoisefforts-to-electrify-transportation/ 43 U.S. Census Bureau. (2019). Table DP04: Housing by Select Characteristics. American Community Survey, 5-Year Estimates. Retrieved from https://www. census.gov/data.html 44 Energy Upgrades Application. (n.d.). Retrieved February 1, 2021, from https:// www.chicagolandvintagehomes.org/ apply 45 Illinois Department of Commerce & Economic Opportunity. (n.d.) Home Weatherization. Community Services. Retrieved from https://www2.illinois. g o v/d c e o / C o m m u n i t y S e r v i c e s / HomeWeatherization/Pages/default. aspx 46 Unknown. (n.d.) “Client Education Resources,” Weatherization Assistance Program Technical Assistance Center (WAPTAC). National Association For State Community Services Programs. NASFSC.org. 47 City of Evanston. (November 2018). Climate Action and Resilience
Plan. Retrieved f rom https: // w w w.c i tyo feva n s to n .o rg / h o m e / showdocument?id=45170 48 Chicago Metropolitan Agency for Planning. (n.d.) Rail Crossing Delays in Metropolitan Chicago. Retrieved from https://www.cmap.illinois.gov/updates/ all/-/asset_publisher/UIMfSLnFfMB6/ content/rail- crossing- delays-inmetropolitan-chicago 49 Chicago Metropolitan Agency for Planning. (2011). Motorist Delay at Public Highway-Rail Grade Crossings in Northeastern Illinois. Retrieved f rom https: //www.cmap.illinois. gov/documents/10180/29236/20111004-Motorist-Delay_20111121_f inal. p d f / 1 9 2 e 6 a 3 7- d 5 0 e - 4 f c 7- a c a 8 d996e057b0c2 50 Chicago Metropolitan Agency for Planning. (2011). Motorist Delay at Public Highway-Rail Grade Crossings in Northeastern Illinois. Retrieved f rom https: //www.cmap.illinois. gov/documents/10180/29236/20111004-Motorist-Delay_20111121_f inal. p d f / 1 9 2 e 6 a 3 7- d 5 0 e - 4 f c 7- a c a 8 d996e057b0c2 51 Street Plans. (2021). JC Walks Pedestrian Enhancement Plan | Jersey City, NJ. Retrieved from http://www. street-plans.com/jc-walks-pedestrianenhancement-plan-jersey-city-nj/ 52 Cleveland, John. (March 31, 2013). LED Streetlights Make Dollars and Sense: Asheville, NC. Retrieved from https://www.usdn.org/uploads/cms/ documents/asheville-led-streetlightsand-green-capital-improvementprogram-best-practices-case-study.pdf 53 Greenshine. (2021). Solar Lighting Guide 2021 (with PDF Download). Greenshine. Retrieved from https:// www.streetlights-solar.com/solar-
bridging blue island
lighting-guide.html 54 Blue Island, Active Transportation Alliance. (2012). Active Transportation Plan. Retrieved f rom http://www. blueisland.org/wp-content/ uploads/2012/02/22/blue-island-poisedto-adopt-active-transportation-plan/ COBI-Non-Motorized-Plan-FINALDRAFT.pdf 55 Greenshine. (2021). Solar Lighting Guide 2021 (with PDF Download). Greenshine. Retrieved from https:// www.streetlights-solar.com/solarlighting-guide.html 56 ComEd. (n.d.) LED Streetlights: Light the Way to Savings. Retrieved from https://www.comed.com/WaysToSave/ ForYourBusiness/Pages/StreetLights. aspx 57 Regional Transportation Authority. (2021). Access to Transit Program. Plans & Programs. Retrieved from https:// www.rtachicago.org/plans-programs/ access-transit-program 58 Working Collaboratively with IDOT. (2016). Active Transportation Policy. Retrieved from https://atpolicy.org 59 Metro, J. (2020, July 23). In a PostPandemic World, Parklets Should Stay Parked. Strong Towns. Retrieved f rom https://www.strongtowns.org/ journal/2020/7/21/in-a-post-pandemicworld-parklets-should-stay-parke 60 City of Aurora. (2021). Downtown Parklet Guidelines and Application Packet. Retrieved from https://www. a u ro ra - i l .o rg / D o c u m e n t Ce n te r/ View/8367/2021-Parklet-Application 61 U.S. Department of Energy. (n.d.). Fuel Economy in Hot Weather. Retrieved from https://www.fueleconomy.gov/feg/ hotweather.shtml
APPENDIX
Solar for Homeowners. Retrieved from https://sites.energycenter.org/solar/ homeowners/cost
81
62 Chicago Region Trees Initiative. (n.d.). CRTI Priority Area: Identifying where trees will have the greatest impact. Chicago Region Trees Initiative. Retrieved from http://chicagorti.org/ PriorityMap 63 Prince George's County Department of Environmental Resources & Ortiz, A. (n.d.). Urban Tree Canopy Fact Sheet. Prince George's County. Retrieved from https://www.princegeorgescountymd. gov/DocumentCenter/View/181/UrbanTree-Canopy-Fact-Sheets-PDF 64 United States Environmental Protection Agency. (2018 August). Estimating the Environmental Effects of Green Roofs: A Case Study in Kansas City, Missouri. Retrieved from https://www.epa.gov/sites/production/ files/2018-09/documents/greenroofs_ casestudy_kansascity.pdf 65 City of Chicago. (2021). Green Roofs: Best Management Practices. Water Management. Retrieved from https: //www.chicago.gov/city/en/ depts/water/supp_info/conservation/ g r e e n _d e s i g n /g r e e n _ r o o f s _ bestmanagementpractices.html 66 Mohareb, E. et al. (December 5, 2017). Considerations for reducing food system energy demand while scaling up urban agriculture. Environmental Research Letters. Vol. 12, Number 12. https://iopscience.iop. org/article/10.1088/1748-9326/aa889b 67 Mohareb, E. et al. (December 5, 2017). Considerations for reducing food system energy demand while scaling up urban agriculture. Environmental Research Letters. Vol. 12, Number 12. https://iopscience.iop. org/article/10.1088/1748-9326/aa889b 68 Institute for Local SelfReliance (ILSR). (2021). Composting by
Californians Against Waste. https://www. cawrecycles.org/composting 69 Heat Island Group. (2021). Cool Pavements. Berkeley Lab. Retrieved f rom https: //heatisland.lbl.gov/ coolscience/cool-pavements 70 United States Environmental Protection Agency. (2018 August). Estimating the Environmental Effects of Green Roofs: A Case Study in Kansas City, Missouri. Retrieved from https://www.epa.gov/sites/production/ files/2018-09/documents/greenroofs_ casestudy_kansascity.pdf 71 City of Chicago. (2021). Green Roofs: Best Management Practices. Water Management. Retrieved from https: //www.chicago.gov/city/en/ depts/water/supp_info/conservation/ g r e e n _d e s i g n /g r e e n _ r o o f s _ bestmanagementpractices.html 72 Wood, L., Hooper, P., Foster, S., & Bull, F. (2017). Public green spaces and positive mental health – investigating the relationship between access, quantity and types of parks and mental wellbeing. Health & Place (48), 63-71. 73 United States Environmental Protection Agency. (2021, April 15). National Overview: Facts and Figures on Materials, Wastes and Recycling. Retrieved from https://www.epa.gov/ facts-and-f igures-about-materialswaste-and-recycling/national-overviewfacts-and-figures-materials#Generation
Metropolitan Water Reclamation District of Greater Chicago. Retrieved April 19, 2021, from https://mwrd.org/ understanding-your-sewer-0 76 Chicago Metropolitan Agency for Planning. (2016, May). Blue Island Capital Improvement Priorities Report. Retrieved from https:// w w w. c m a p . i l l i n o i s . g o v/d o c u ments/10180/22986/Blue+Island+Capital+Improvement+Priorities+Report. pdf/84efee92-97e0-4390-b50e635196514695?t=1468369320000 77 U.S. Environmental Protection Agency Office of Wastewater Management. (2018). Smart Data Infrastructure for Wet Weather Control and Decision Support. Retrieved from https://www.epa.gov/npdes/smart-data-infrastructure-wet-weather-control-and-decision-support 78 Case Study U.S. Environmental Protection Agency Off ice of Wastewater Management. (2018). Smart Data Infrastructure for Wet Weather Control and Decision Support. 79 Baltimore City Planning Commission. (2013, November). Homegrown Baltimore: Grow Local Baltimore City’s Urban Agriculture Plan. Retrieved from https://www. baltimoresustainability.org/wpcontent/uploads/2015/12/HGB-GrowLocal-Final-Cover-1.pdf
74 City of Evanston. (November 2018). Climate Action and Resilience Plan. Retrieved f rom https: // w w w.c i tyo feva n s to n .o rg / h o m e / showdocument?id=45170
80 City of Detroit Urban Agriculture Ordinance Abridged. (2013). Retrieved from https://detroitmi.gov/Portals/0/ docs/cpc/pdf/Urban%20Ag%20 Ordinance%20Abridged_Apr2013. pdf?ver=2013-04-19-164058-087
75 Metropolitan Water Reclamation District of Greater Chicago. (n.d.). Understanding Your Sewer.
81 Department of Planning and Development- Chicago. (2021). Urban Agriculture FAQ. Retrieved from
bridging blue island
h t t p s : // w w w . c h i c a g o . g o v /c i t y / e n /d e p t s /d cd /s u p p_ i n fo /u rb a n _ agriculturefaq.html#:~:text=The%20 25%2C000%2Dsquare%2Dfoot%20 size,existing%20residential%20or%20 commercial%20character.
VISUALIZATION CREDITS Adobe Stock. (n.d.) Photograph. https:// www.caeiowa.org/help-paying-bills/ weatherization-of-homes/ Amy Malysa, 2011, Photograph. https:// www.flickr.com/photos/21178482@N00/ BIOS Farm. (2019, August 5). Farm Stand Today. [Facebook Update]. Retrieved from https://www.facebook.com/BiosFarm/photos Bloomberg Getty Images. (2013) Untitled. Photograph https://time. com/3933638/solar-panels-house/ Blue Island Historical Society. (October 2017). Photograph, https://blueislandhistoricalsociety.com/articles/ Blue Island Historical Society, (18972021), Photograph, https://blueislandhistoricalsociety.com/articles/ Blue Island Public Library. (n.d.) Photograph. https://www.mapquest. com/us/illinois/blue-island-public-library-359886113 Center for Neighborhood Technology, 2005, Proposed Cargo Oriented Development Northeast Blue Island, Map, http://www.blueisland.org/wp-content/ uploads/bi-plan_vii-cod-proposal-b1_ northeast-industrial-sector.pdf. Chicago Metropolitan Agency for Planning, 2012, Reconfigure Western Avenue and Gregory Street as two-way Complete Streets, Rendering, http://www.blueis-
City of Blue Island, (2012). U-TOD District Map. http://www.blueisland.org/ wp-content/uploads/planning.UTOD-Ordinance.pdf City of Blue Island. (2017). Zoning Map. Map. http://www.blueisland.org/wp-content/uploads/government/city-departments/building-zoning/zoning/Blue_Island_Zoning_Map_033117_JEA_R.pdf Collings, Andrew. (2018). Growing Home Workers. Photograph. Next City. Retrieved from https://nextcity.org/daily/entry/urban-agriculture-sprouting-roots-in-illinois-legislative-soil ComEd. (2014). Monochrome Logo. Digital Artwork. Edited by Dimitri Nesbitt. ComEd. (2020). Is Solar an Option for Me? Solar Calculator. Retrieved from: https://secure.comed.com/MyGeneration And Cook County Government, Open Data, 2021. And Grumulaitis, Sarah. (2021) Build ing Footprint Map. Cook County, IL, Open Data. (2021). Map of Building Footprints, Map, https:// hub-cookcountyil.opendata.arcgis.com/. Cook County, IL, Open Data. (2021). Map of Three Tracts, Map, https://hub-cookcountyil.opendata.arcgis.com/. Deamer, Kacey. (Dec. 10, 2020).Urban Ag Project Developing Curriculum to Support Producers, Planners and Policymakers. https://smallfarms.cornell. edu/2020/12/urban-ag-project-developing-curriculum-to-support-producers-planners-and-policymakers/ Department of Housing and Ur-
ban Development. (2014). Untitled. Photograph. https://www.flickr.com/ ph otos/hudopa/ 15278960315/ in/ photolist-31UHf j-gxEBSp-aG1osH4X4a8T-g5WyaV-a98dNf-aM4Z5ivWfxi9-86qVKp-bSiexP-4qQ5Nsa98hjJ-avw8kT-o3p8hp-ph9EAg-uZRYnu-rJKYbp-av4vCK-NotTn-C2wPw86cb6DA-8aXkTX-9bDGEF-efXYwF-9JBVHd-mowx9-8ypRR7-pgSCbK-rvmLjqHWgEyX-9sJwUH-aSi8Pz-7d13ju-h7uzMV-dxroG2-gyucJt-7d13kY-J5DW7h7m8Uhu-8y7W4g-vWfCUj-8Wkor19CYRJo-oZDvhp-AQHzr2-8YU2Fna95q6k-5dfLBQ-49Cpiw-FAkKc/ David Wilson, 2006, Photograph. https://www.flickr.com/photos/davidwilson1949/16296644192/in/photostream/ Dimitri Nesbitt. (2021). Land Use, Map,https://app.urbanfootprint.com. Dimitri Nesbitt. (2021). Photograph. Dimitri, Nesbitt. (2021). Solar Farm Site. Map. Friends of the Chicago River, (20062021), A Closer Look at Combined Sewer Overflows, Diagram, https://www.chicagoriver.org/get-involved/volunteer/ overflow-action-days/a-closer-look-atcombined-sewer-overflows. Flora Ramirez. (2021). Map. https://app. urbanfootprint.com/?maponly=1. Flora Ramirez. (2021). Photograph. Gage, Bruce. (2019). Blue Island Sidestream Elevated Pool Aeration Station and Park. Photograph. https:// www.flickr.com/photos/18345733@ N05/49287520967/in/photolist-2i6mj8e-ou9zC5-2i6nqQg-2i6Pm83-2i6KWxV-2i6NjwP-2i6Prkh-2i6L4zf-2i6PB9v-2i6NncD-2i6PCjS-2i6L8oH-2i6Pu7K2i6PxZp-2i6L18F-2i6PpQU-fQtvA5-fQtvcY-6k2wLp-fQtxEY-fQccDZ-fQcd2H-
2jzKvXS-azkPr3-fQtPjE-oux2Mc-fQcdrp-fQcceB-wP5iv5-fQbTXF-azwp2WfQtuhu-fQcgbc-fQtPWS-fQcfNP-azu8vrfQtNSJ-fQbWFZ-fQcfan-azu8tn-fQbVLvfQtwc9-fQtwr5-fQtxjW-fQbUxk-azwp8L Grumulaitis, Sarah, 2021, Transportation Routes, Map, https://app.urbanfootprint. com Illinois Institute of Technology. (2011). IIT Wind Turbine 2. Photograph. https:// www.flickr.com/photos/49476807@ N04/5938210622/in/photostream/ Lambrecht, Nathan. (2021). Growing Solutions Farm. Photograph. Illinois Farm Bureau Partners. Retrieved from https://www.ilfbpartners.com/farm/gardening/urban-gardens-flourish-in-chicago/ McDonnell, Tim. (2020, Oct. 8). Agrivoltaics. Photograph. Quartz. https:// qz.com/1913868/why-agricultural-landis-better-than-rooftops-for-solar-panels/ Mid-America Freight Coalitions. (2012) Area. Map Created by Flora Ramirez. The Trust for Public Land, (2019), Urban Heat Islands for U.S. Cities, (2019), https: //www.arcgis. c o m / h o m e / i te m . h t m l ? i d = 4 f 6 d 72903c9741a6a6ee6349f5393572. Roy Kaltschmidt. (2012). Photograph https://newscenter.lbl.gov/2012/09/13/ parking-lot-science/ Seattle Department of Transportation. (2017). Untitled Photograph https://www. seattleweekly.com/news/will-seattle-finally-protect-its-tree-canopy/ Shigley, Scott. (n.d.). Argyle Streetscape. Photograph. https://www.site-design. com/argyle-streetscape/ Unknown. (n.d) AE Sunpower. Untitled Photograph. https://powersolarphoenix.
bridging blue island
com/carport-solar-panels-cost/ Unknown. (n.d). LA Solar Group. Photograph. https://la-solargroup. com/2020/10/13/residential-solar-carport/
APPENDIX
land.org/wp-content/uploads/westernavenue/1-COBI-CMAP-Comp-PlanWestern-Ave-Strategy-2012.pdf
Unknown. (n.d.). The 4th Generation Smart Solar Street Light. Digital Artwork. https://line.17qq.com/articles/dgjehdfdz_p3.html U.S. Census Bureau. (2019). American Community Survey, 5-Year Estimates. Table DP04: Housing by Select Characteristics, Table S1901: Income in the Past 12 Months, Table S1501: Educational Attainment, Over 25 years, Table S2405: Industry By Occupation, Over 16 years, Table DP05: Demographic & Housing Estimates, Table B08141: Means of Transportation to Work, Table S1701: Poverty Status in the Past 12 Months, Table S2506: Housing Costs as Percentage of Total Income, Table S2301: Employment Status. U.S. Census Bureau. (2017) Economic Census, All Sectors: Summary Statistics for the U.S., States, and Selected Geographies: 2017. U.S. Census Bureau, (2019), American Housing Survey, U.S. Department of Housing and Urban Development, Table: Home Improvement Characteristics, https://www.census.gov/programs-surveys/acs. U.S. Department of Transportation, 2021, FRA - Safety Map, https://fragis.fra.dot. gov/GISFRASafety/. And Grumulaitis, Sarah, 2021, Freight Network, Map, https://app. urbanfootprint.com Victoria Kurlander, 2021, Photograph. WARE MALCOMB. (2018). Photograph https://www.wsj.com/articles/in-newyork-city-warehouses-have-nowhereto-go-but-up-1517061600
83