
INVESTMENT OUTLOOK


THE U.S. FEDERAL RESERVE PLAYS CATCH-UP
Inflation was elevated during the first quarter, putting significant pressure on U.S. Federal Reserve (Fed) policymakers to tighten monetary policy. The Consumer Price Index was 7.9% in its latest reading, with inflation breakeven rates (what investors expect inflation to be in the future) also up significantly in recent months. Aggregate demand has been strong, with consumer spending up as the most severe waves of the pandemic appear to be over.
Aggregate supply has been the bigger factor pushing inflation, however, with the continued impact of COVID-19 around the world bogging down supply chains. The war in Ukraine was an additional factor contributing to elevated inflation late in the first quarter, as the conflict led to a jump in commodity prices.
It’s now clear that the Federal Reserve was late to begin this monetary tightening cycle and policymakers have been working to assure investors that they will keep inflation within reasonable bounds. As a start, the Fed raised the fed funds rate by 25 basis points in March and various Fed governors have signaled that several more rate hikes are coming throughout the remainder of 2022. Additionally, the Fed has announced plans to wind down its sizable balance sheet (which mainly consists of U.S. Treasuries and agency mortgage-backed securities), another important tool
at policymakers’ disposal.
The persistence of inflationary pressures and consequent increasingly hawkish tone of Fed policymakers jolted the bond market in the first quarter, with investors today pricing in expectations for a further 2.00% increase to the fed funds rate by year-end. Since there are six FOMC (Federal Open Market Committee) meetings remaining this year, this means that the bond market is currently expecting rate hikes of at least 25 basis points at each meeting, with 50 basis point increases at two of those
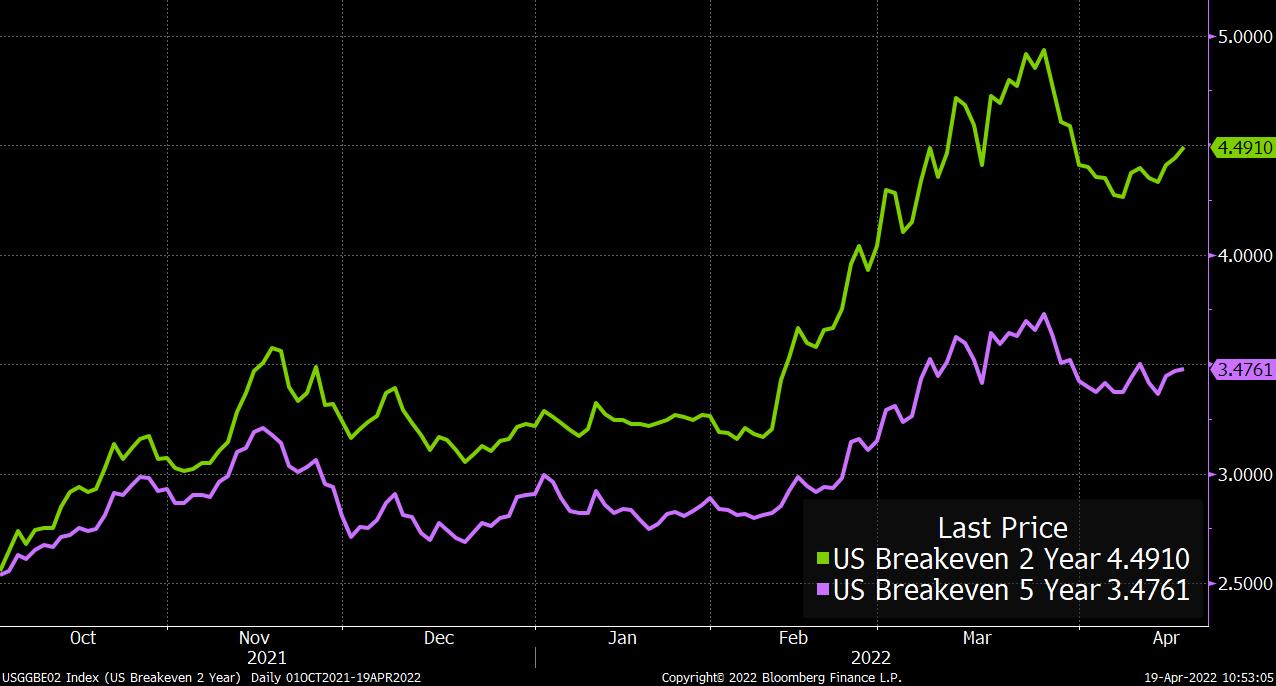
U.S. Inflation Breakeven Rates
Source: Bloomberg
meetings. This represents a high number of interest rate hikes incorporated into today’s bond prices, and a big jump from what was expected early in the first quarter.
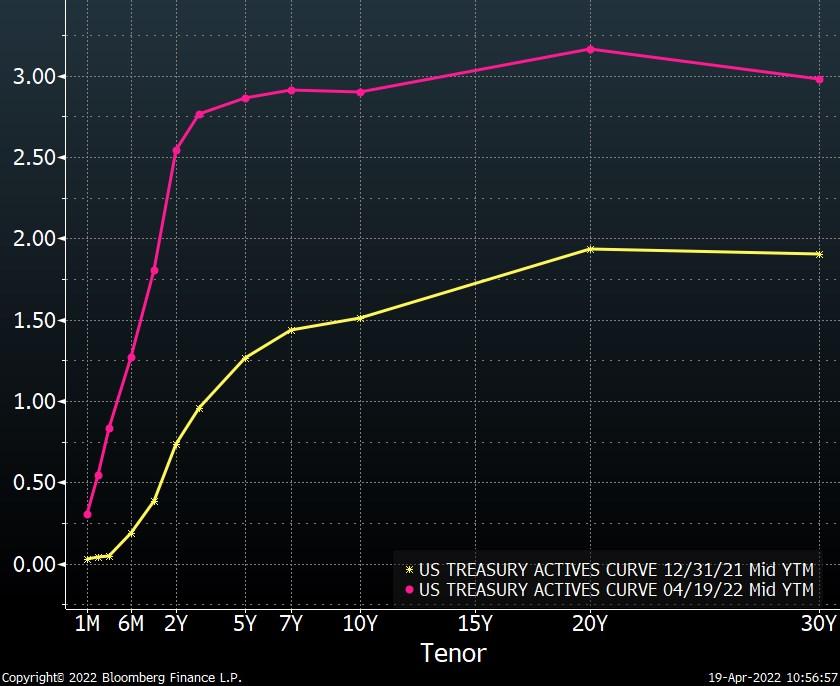
In response to increased hawkishness at the Fed, the U.S. Treasury yield curve has risen sharply, with the biggest move on the short end of the curve. Short duration bonds have outperformed longer duration bonds this year due to lower sensitivity to changing interest rates. The Merrill Lynch 1-3 Year U.S. Treasury Index returned -2.3% during the first quarter, while the Bloomberg U.S. Long Treasury Bond Index returned -10.6%. Intermediate duration indexes were between these two extremes, with the Bloomberg U.S. Mortgage-Backed Security and Bloomberg U.S. Aggregate Bond indexes returning -5.0% and -5.9%, respectively, during the quarter.
The recent hawkish turn among Fed policymakers risks overshoot, with the bond market clearly flashing signs of worry about monetary policy error. For example, the U.S. Treasury yield curve is quite
U.S. Treasury Yield Curve
Source: Bloomberg
flat between the 3 and 10-year tenors, signaling bond investors’ belief that the U.S. economy could slow in the medium term. Ironically, an overly hawkish Federal Reserve could prove to be a positive for some areas of the bond market, as restrictive monetary policy could lead to lower longer-term interest rates. We believe there is a significant risk of this occurring during the next year or so and that the bond market offers attractive opportunities at current levels.
Bond yields are as high as they’ve been in several years and are especially attractive in the intermediate and short duration spaces. The Bloomberg Barclays
Mortgage-Backed Security Index has a yield of 3.5% today, up from 2.0% at the end of December. Among short duration bond
indexes, the Merrill Lynch 1-3 Year U.S. Treasury Index today has a yield of 2.4%. Despite the negative returns of the first quarter, these higher yields will be beneficial for investors with a longer investment horizon.
EQUTIES ADJUST TO A NEW RATE REGIME
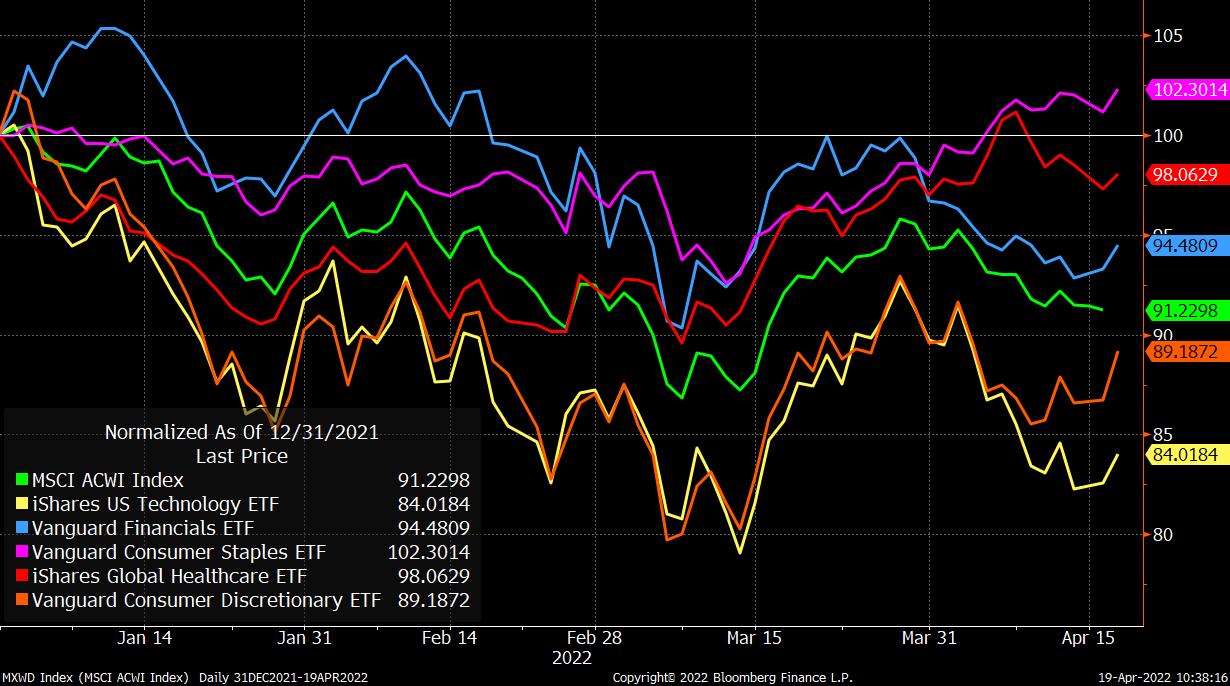
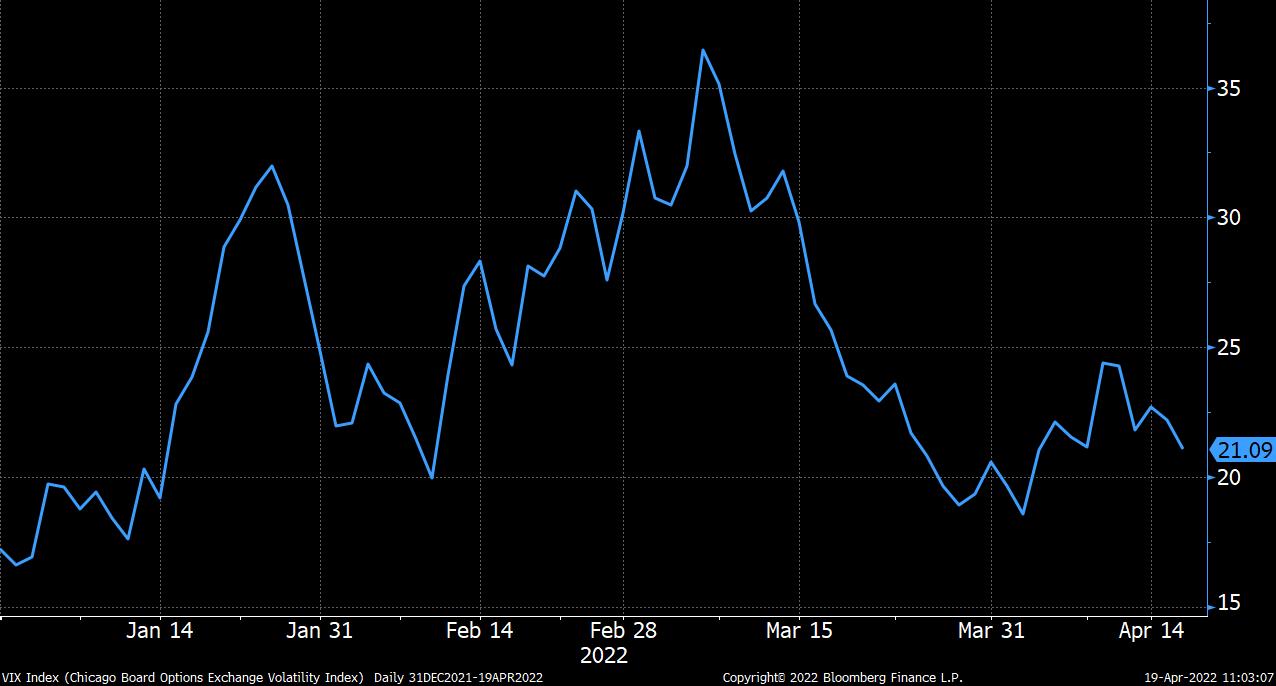
The MSCI All Country World Index (ACWI), a measure of the global stock market, returned -5.3% during the first quarter. Energy, financial, and other “value” stocks (defined as those with lower valuations and lower growth prospects over the longer term) outperformed “growth” stocks and the broader market. While there was heightened deviation in sector-level returns this quarter, the ACWI's performance emblematized the elevated market volatility. The global benchmark was down nearly 13% for the quarter at its trough in early March, before recovering 8% by the end of the month.
Macroeconomic factors have been driving the equity market. Elevated inflation and higher interest rates are the biggest of these, with higher U.S. Treasury yields resulting in higher discount rates for equities.
The war in Ukraine further dampened investors’ mood midway through the quarter, but as horrifying as the events in Ukraine have proven to be, the broad equity market has much more exposure to interest rates than it has to the war.
Additional volatility may lie ahead for equities. Investors are jittery today with the war in Ukraine unresolved and it not yet clear when inflation will peak. Things look more positive for the medium and longer term, as it’s likely that inflation will eventually fall as monetary policymakers aggressively target it and as constraints to aggregate supply diminish. The timing
U.S. Equity Returns
Source: Bloomberg
of equity market movements in the short run is very difficult to predict, of course, but when the market begins to discount the prospect for improvement in the macro environment, long-term investors will want to be fully invested. Market recoveries often occur very suddenly and forcefully.
Our equity portfolios hold overweight positions to the industrial, materials, and healthcare sectors, and underweight positions to the financial, energy, and consumer staple sectors. We are roughly neutral on the technology sector which, after the volatility of the first quarter, has areas that are attractive today.
—
Brandon Fitzpatrick, CFA
Chicago Board Options Exchange Volatility Index (VIX)
Source: Bloomberg

THIS PUBLICATION IS FOR INFORMATIONAL PURPOSES ONLY. THIS PUBLICATION IS IN NO WAY A SOLICITATION OR OFFER TO SELL SECURITIES OR INVESTMENT ADVISORY SERVICES, EXCEPT WHERE APPLICABLE, IN STATES WHERE DB FITZPATRICK IS REGISTERED OR WHERE AN EXEMPTION OR EXCLUSION FROM SUCH REGISTRATION EXISTS.
INFORMATION THROUGHOUT THIS PUBLICATION, WHETHER STOCK QUOTES, CHARTS, ARTICLES, OR ANY OTHER STATEMENT OR STATEMENTS REGARDING MARKET OR OTHER FINANCIAL INFORMATION, IS OBTAINED FROM SOURCES WHICH WE AND OUR SUPPLIERS BELIEVE RELIABLE, BUT WE DO NOT WARRANT OR GUARANTEE THE TIMELINESS OR ACCURACY OF THIS INFORMATION.
BLOOMBERG FINANCE L.P. IS THE SOURCE UTILIZED FOR GRAPHS THROUGHOUT THIS PUBLICATION. THE GRAPHS ARE USED WITH PERMISSION OF BLOOMBERG FINANCE L.P. NEITHER WE NOR OUR INFORMATION PROVIDERS SHALL BE LIABLE FOR ANY ERRORS OR INACCURACIES, REGARDLESS OF CAUSE, OR THE LACK OF TIMELINESS OF, OR FOR ANY DELAY OR INTERRUPTION IN THE TRANSMISSION THEREOF TO THE USER. THERE ARE NO WARRANTIES, EXPRESSED OR IMPLIED, AS TO ACCURACY, COMPLETENESS, OR RESULTS OBTAINED FROM ANY INFORMATION CONTAINED IN THIS PUBLICATION.
NOTHING IN THIS PUBLICATION SHOULD BE INTERPRETED TO STATE OR IMPLY THAT PAST RESULTS ARE AN INDICATION OF FUTURE PERFORMANCE.