
INVESTMENT OUTLOOK



YIELD CURVE STEEPENS AS FED’S DOVISH TURN IS COMPLETE
Interest rates declined meaningfully in 2019 as economic growth slowed and the Federal Reserve (Fed) embraced a dovish monetary policy. The term structure of interest rates steepened during the second half of the year as the Fed became increasingly accommodative.
Despite policymakers showing resistance to cutting rates early in 2019, the Fed ultimately cut rates three times during the year. Additionally, the Fed has expanded its balance sheet significantly in recent months. Since September, the Fed has been purchasing up to $60 billion in shortterm Treasury bills monthly with the goal of strengthening bank reserves and improving liquidity in the short-term debt market.
After moving from a hawkish tone to a dovish one during the last 12 months, it is unlikely the Fed will make significant policy rate adjustments in 2020.
Policymakers will likely not raise rates unless inflation is persistent and exceeds their mandated target of 2.0% (today the 3-year inflation breakeven rate is just 1.54%). At the same time, given the three rate cuts made in 2019, policymakers will also be hardpressed to cut rates further in the near term unless the risk of a recession increases materially (investors are currently forecasting no interest rate changes during the first half of 2020, with one 25 basis point cut in the second half of the year). We believe it most likely that policymakers will hold
off on further moves with interest rates for the foreseeable future, and will instead direct their focus in 2020 to the Fed’s balance sheet. Balance sheet expansion is likely to continue until a long-term solution is found regarding continued tension in the short-term debt market.
Positive investor sentiment and demand for yield caused corporate spreads to tighten 60 basis points in 2019, nearing their tightest levels since the financial crisis. We expect credit spreads to widen in the coming
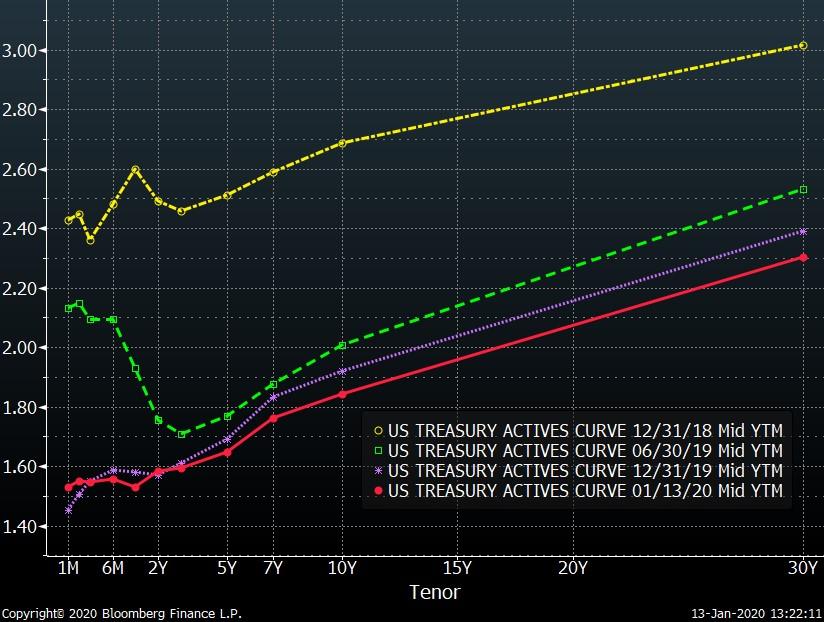
U.S. Treasury Yield Curve
Source: Bloomberg
months due to declining earnings growth and the resulting weakening of corporate balance sheets. Consequently, today we are conservative with our corporate bond positioning, emphasizing highly rated companies and liquid securities. Mortgage-backed security spreads widened 4 basis points in 2019 due to heightened prepayment risk and interest rate volatility, and today offer good relative value versus corporate bonds.
The combination of accommodative monetary policy and slower economic growth will likely keep interest rates range-bound in the coming months. A continued dovish Fed is likely to cause the dollar to depreciate, resulting in higher commodity prices and inflation breakeven rates. Meanwhile, weakness in the manufacturing sector and a potential slowdown in the housing sector are set to pressure economic
growth in 2020. With these forces pressuring interest rates in opposite directions, we have positioned our fixed income portfolios’ duration and convexity attributes to be closely aligned to their benchmarks. We are retaining flexibility to adjust sector and coupon exposure, should market conditions change.
Justin Packard, CFA
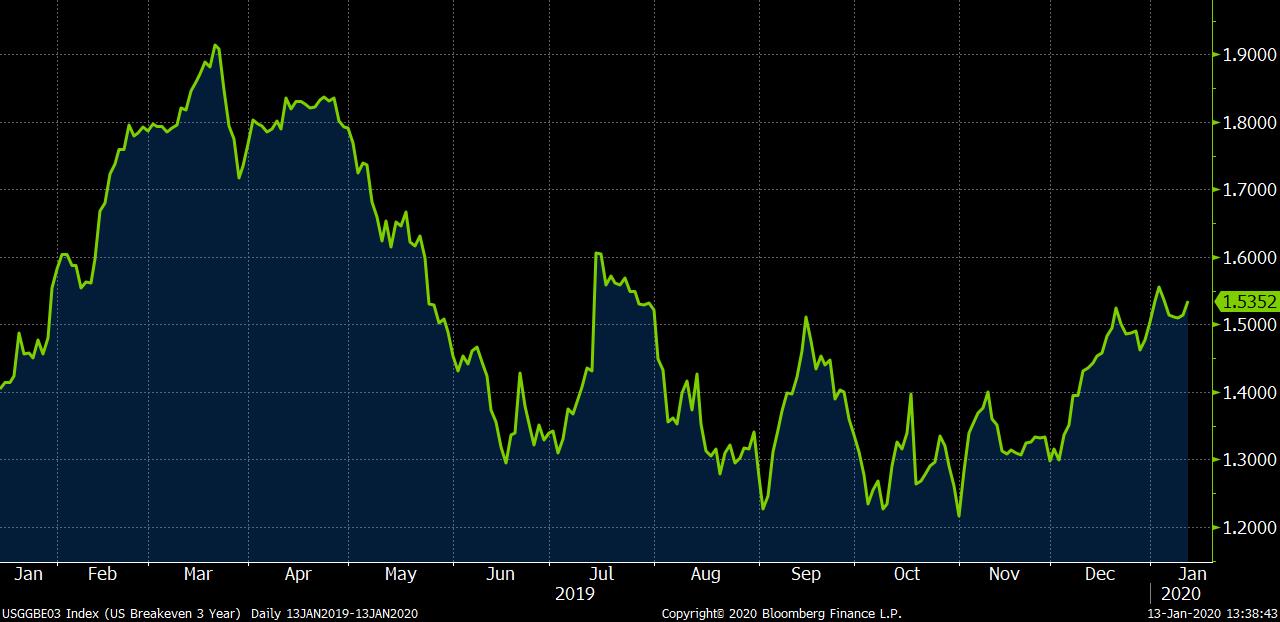
3-Year U.S. Inflation Breakeven Rate
Source: Bloomberg
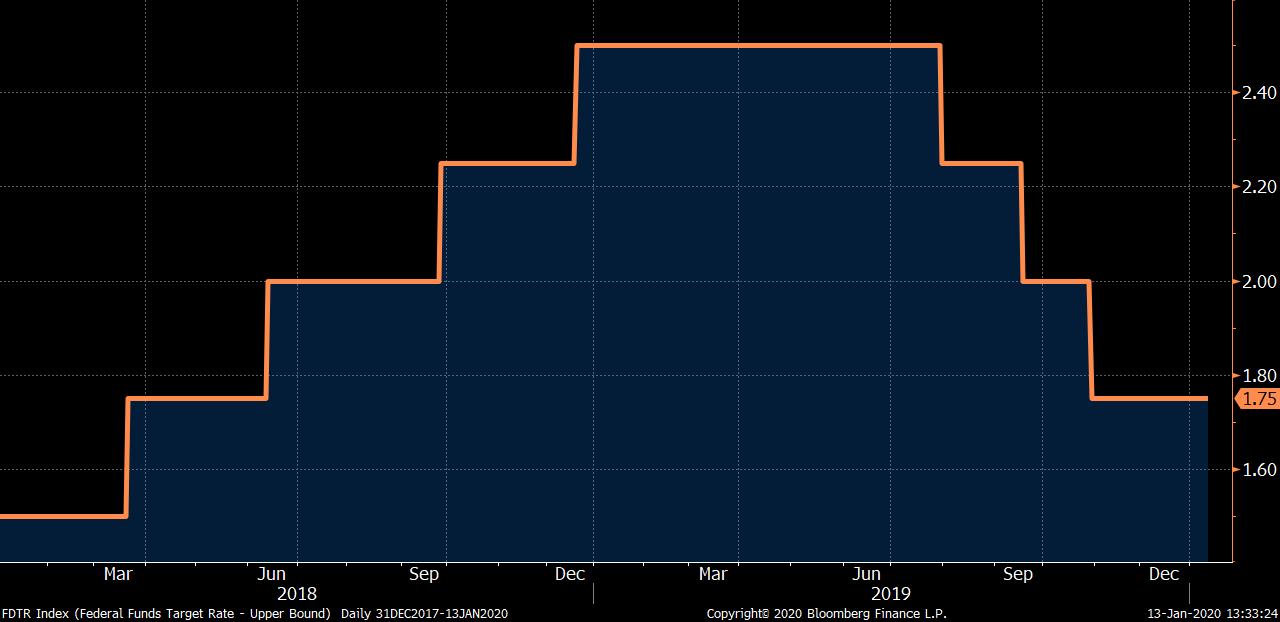
Fed Funds Target Rate
Source: Bloomberg
EQUITY MARKET BUOYANT, BUT 2020 OUTLOOK CLOUDY
The equity market had a very strong year in 2019, fueled principally by lower interest rates but also by a gradual de-escalation of trade tensions between the U.S. and China. The MSCI All Country World Index, which measures the global stock market, returned 27.3% during the year. The S&P 500 Index (made up of U.S.based large cap companies) returned 31.5%, while the MSCI EAFE (international developed stocks) and MSCI Emerging Market indices returned 22.8% and 18.6%, respectively. Among sectors of the stock market, technology was the top performer last year with the Dow Jones U.S. Tech-
nology Index up 46.6%. The energy sector was the worst performer, with the Dow Jones U.S. Energy Sector Index up 10.0%.
The yield of a 10-year Treasury bond fell from 2.68% at the start of 2019 to 1.92% at year-end (having reached 1.46% in September). This was an important element of the story for equities, as lower interest rates tend to encourage the movement of money into more risky sectors such as corporate bonds, real estate, and, of course, stocks. This occurred last year, with equity valuations expanding.
Headlines regarding trade negotiations between Washington and Beijing in 2019 were often jarring, but investors early on priced in an eventual diminution of conflict, thereby aiding equity returns. This forecast has been vindicated, as political leaders are currently wrapping up “phase one” (involving increased agricultural purchases from China and lower tariffs in the U.S.) of a potentially more comprehensive agreement. With the presidential campaign in the U.S. about to heat up considerably, most investors believe that further serious trade negotiations between the U.S. and China will be delayed until 2021. This potential de-
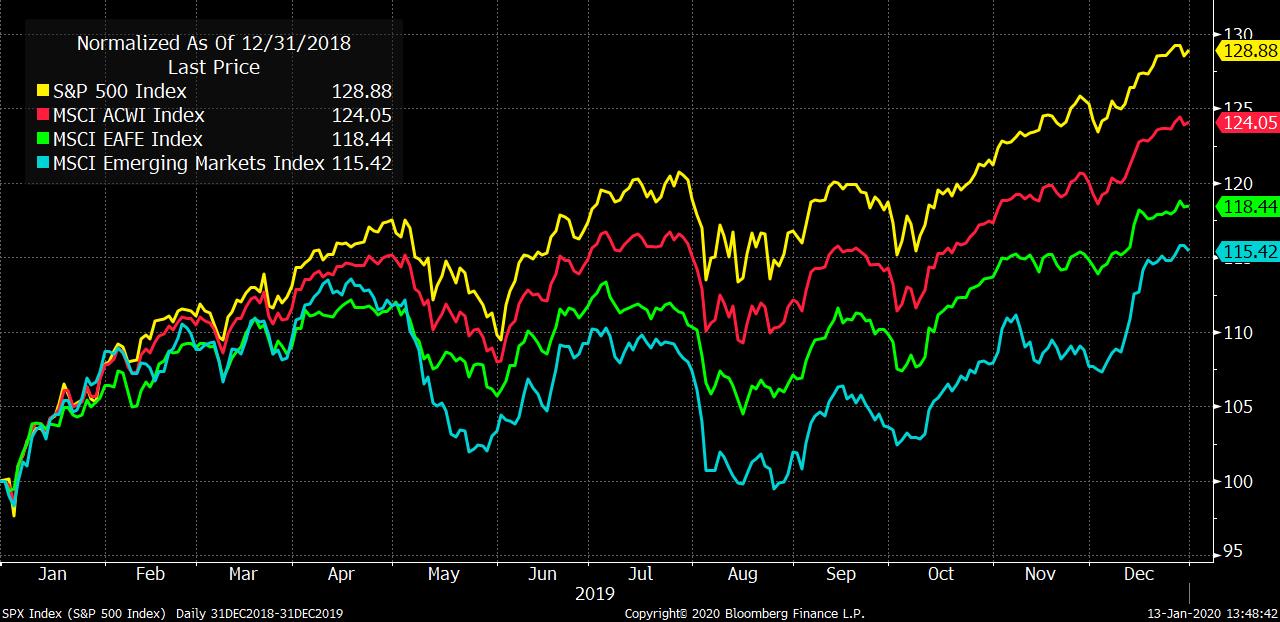
2019 Equity Returns
Source: Bloomberg
lay should be a positive factor for equities as the next round of negotiations will address more sticky subjects such as currency valuations, technology transfer, and government involvement in private industry.
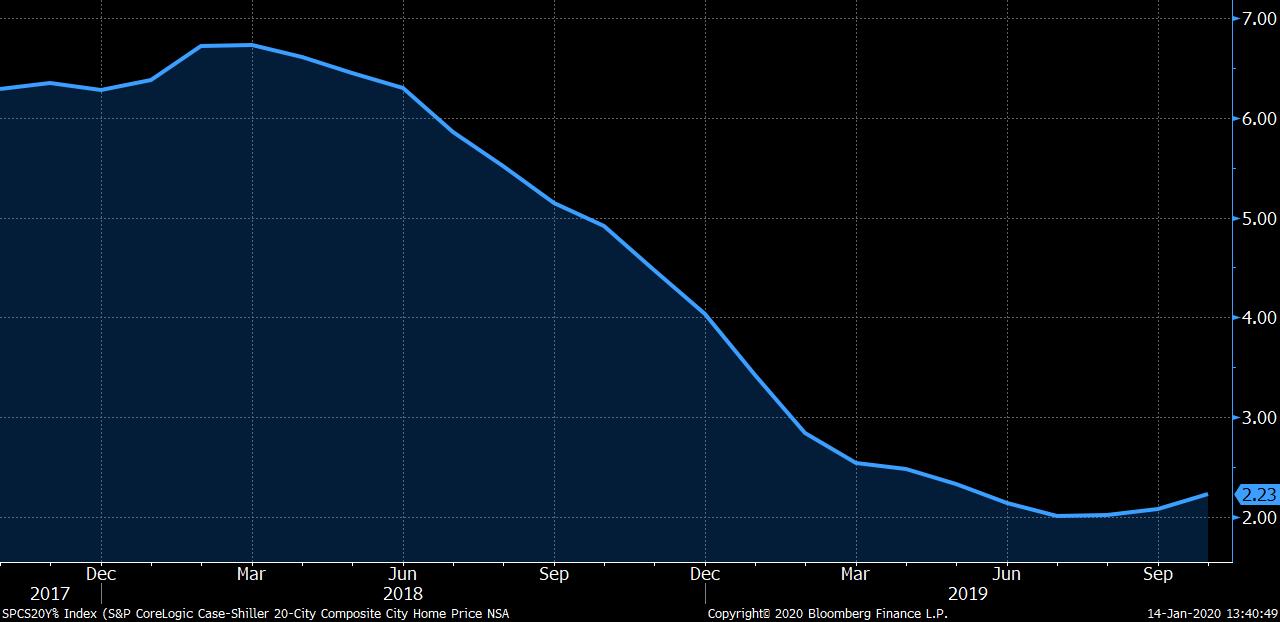
S&P Case-Shiller U.S. National Home Price Index
Source: Bloomberg
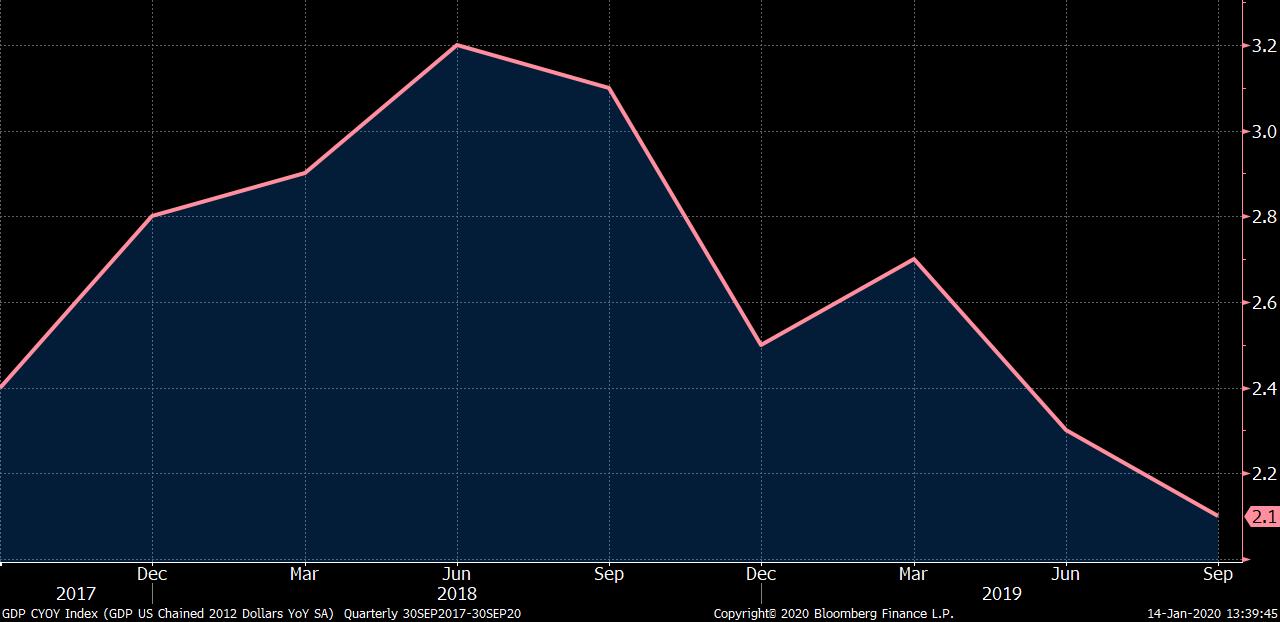
Looking forward to 2020, the outlook for equities is cloudy. The housing and manufacturing sectors in the U.S. are showing signs of cooling off, while the U.S. GDP growth rate, though still respectable at 2.1%, has declined. A recession does not seem likely in the near term, but further economic slowdown may be forthcoming. On the positive side for equities, trade tensions have abated considerably and the Federal Reserve has signaled that it will remain accommodative with monetary policy in the coming quarters. Both of these factors are likely already priced in to equity valuations, however, with the S&P 500 trading at 18.7x expected earnings. A rise of long-term Treasury bond yields, even a modest rise of 50 - 75 basis points, would likely pressure equities.
Source: Bloomberg U.S. GDP Growth Rate
With this analysis as a backdrop, we have positioned our equity portfolios somewhat defensively, with an overweight position to healthcare stocks and an underweight position to technology. We are maintaining flexibility to rebalance into more cyclical sectors should the bull market falter.
Brandon Fitzpatrick, CFA

THIS PUBLICATION IS FOR INFORMATIONAL PURPOSES ONLY. THIS PUBLICATION IS IN NO WAY A SOLICITATION OR OFFER TO SELL SECURITIES OR INVESTMENT ADVISORY SERVICES, EXCEPT WHERE APPLICABLE, IN STATES WHERE DB FITZPATRICK IS REGISTERED OR WHERE AN EXEMPTION OR EXCLUSION FROM SUCH REGISTRATION EXISTS.
INFORMATION THROUGHOUT THIS PUBLICATION, WHETHER STOCK QUOTES, CHARTS, ARTICLES, OR ANY OTHER STATEMENT OR STATEMENTS REGARDING MARKET OR OTHER FINANCIAL INFORMATION, IS OBTAINED FROM SOURCES WHICH WE AND OUR SUPPLIERS BELIEVE RELIABLE, BUT WE DO NOT WARRANT OR GUARANTEE THE TIMELINESS OR ACCURACY OF THIS INFORMATION. BLOOMBERG FINANCE L.P. IS THE SOURCE UTILIZED FOR GRAPHS THROUGHOUT THIS PUBLICATION. THE GRAPHS ARE USED WITH PERMISSION OF BLOOMBERG FINANCE L.P. NEITHER WE NOR OUR INFORMATION PROVIDERS SHALL BE LIABLE FOR ANY ERRORS OR INACCURACIES, REGARDLESS OF CAUSE, OR THE LACK OF TIMELINESS OF, OR FOR ANY DELAY OR INTERRUPTION IN THE TRANSMISSION THEREOF TO THE USER. THERE ARE NO WARRANTIES, EXPRESSED OR IMPLIED, AS TO ACCURACY, COMPLETENESS, OR RESULTS OBTAINED FROM ANY INFORMATION CONTAINED IN THIS PUBLICATION.
NOTHING IN THIS PUBLICATION SHOULD BE INTERPRETED TO STATE OR IMPLY THAT PAST RESULTS ARE AN INDICATION OF FUTURE PERFORMANCE.